
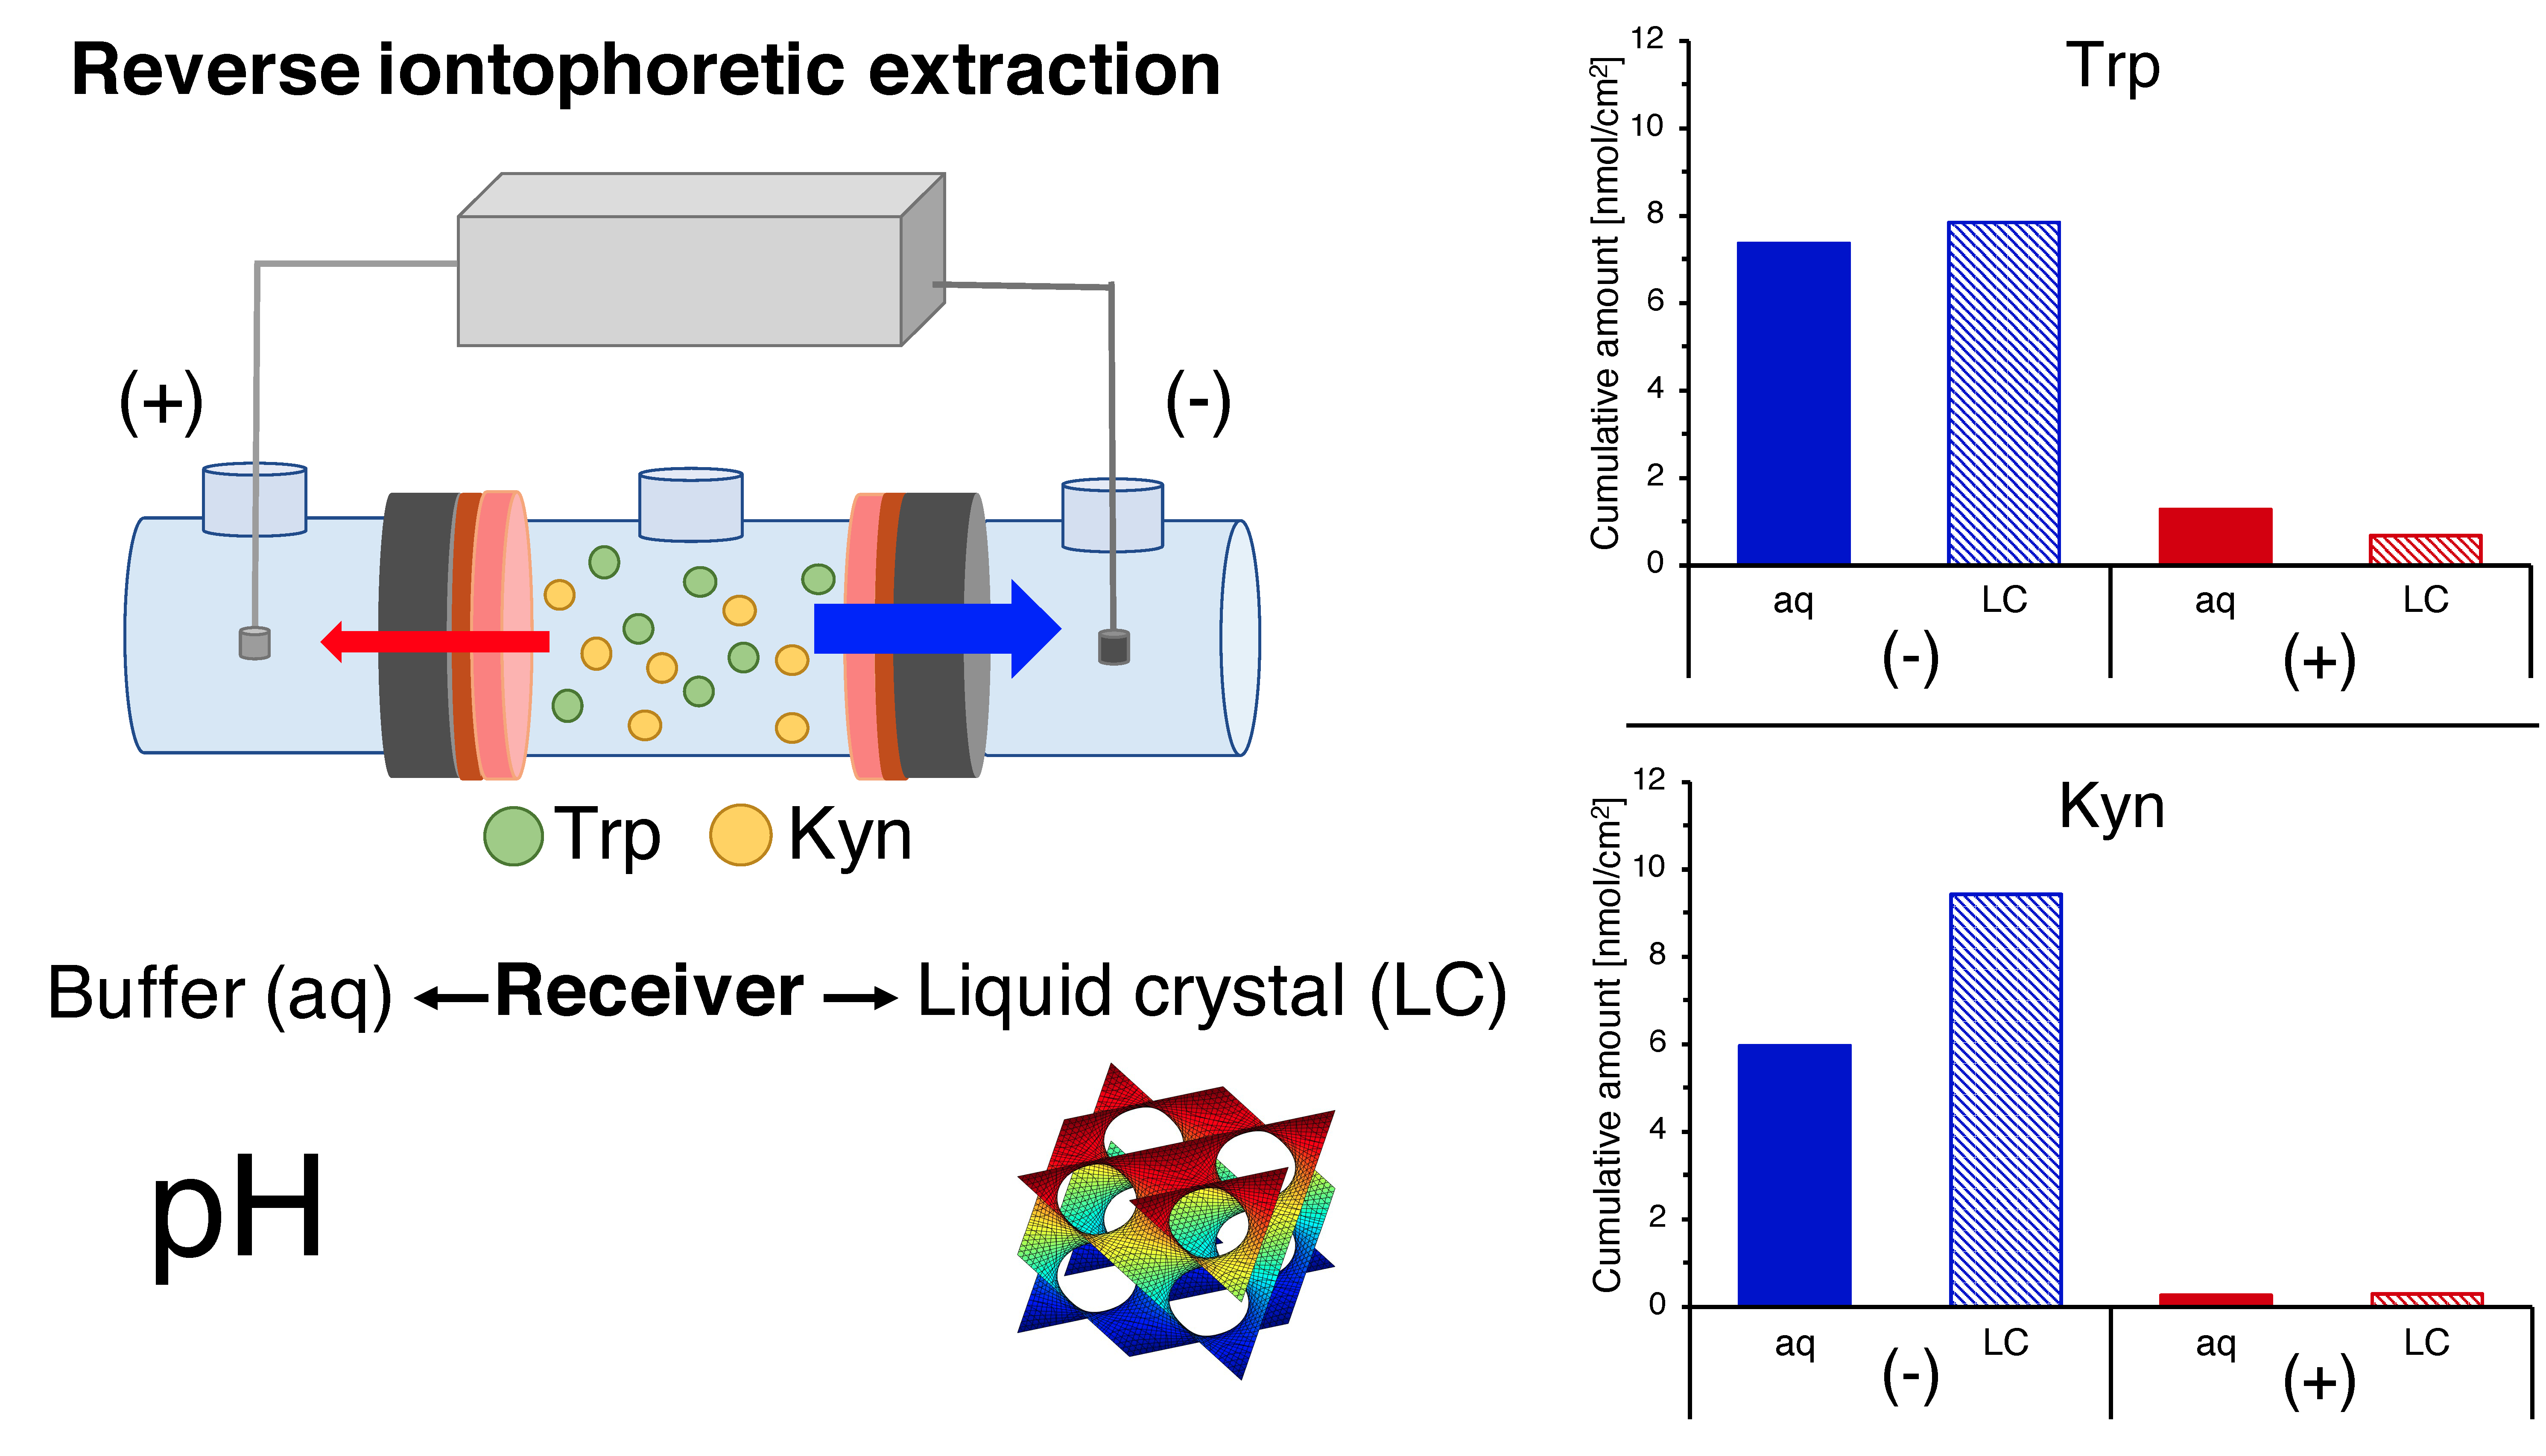
Reverse Iontophoretic Extraction of Skin Cancer-Related Biomarkers

 , ,
, ,  and
and
Abstract
:
1. Introduction
2. Materials and Methods
2.1. Materials
2.2. Preparation of Electrodes
2.3. Skin Preparation
2.4. Preparation of Liquid Crystalline Cubic Phase as a Receiver
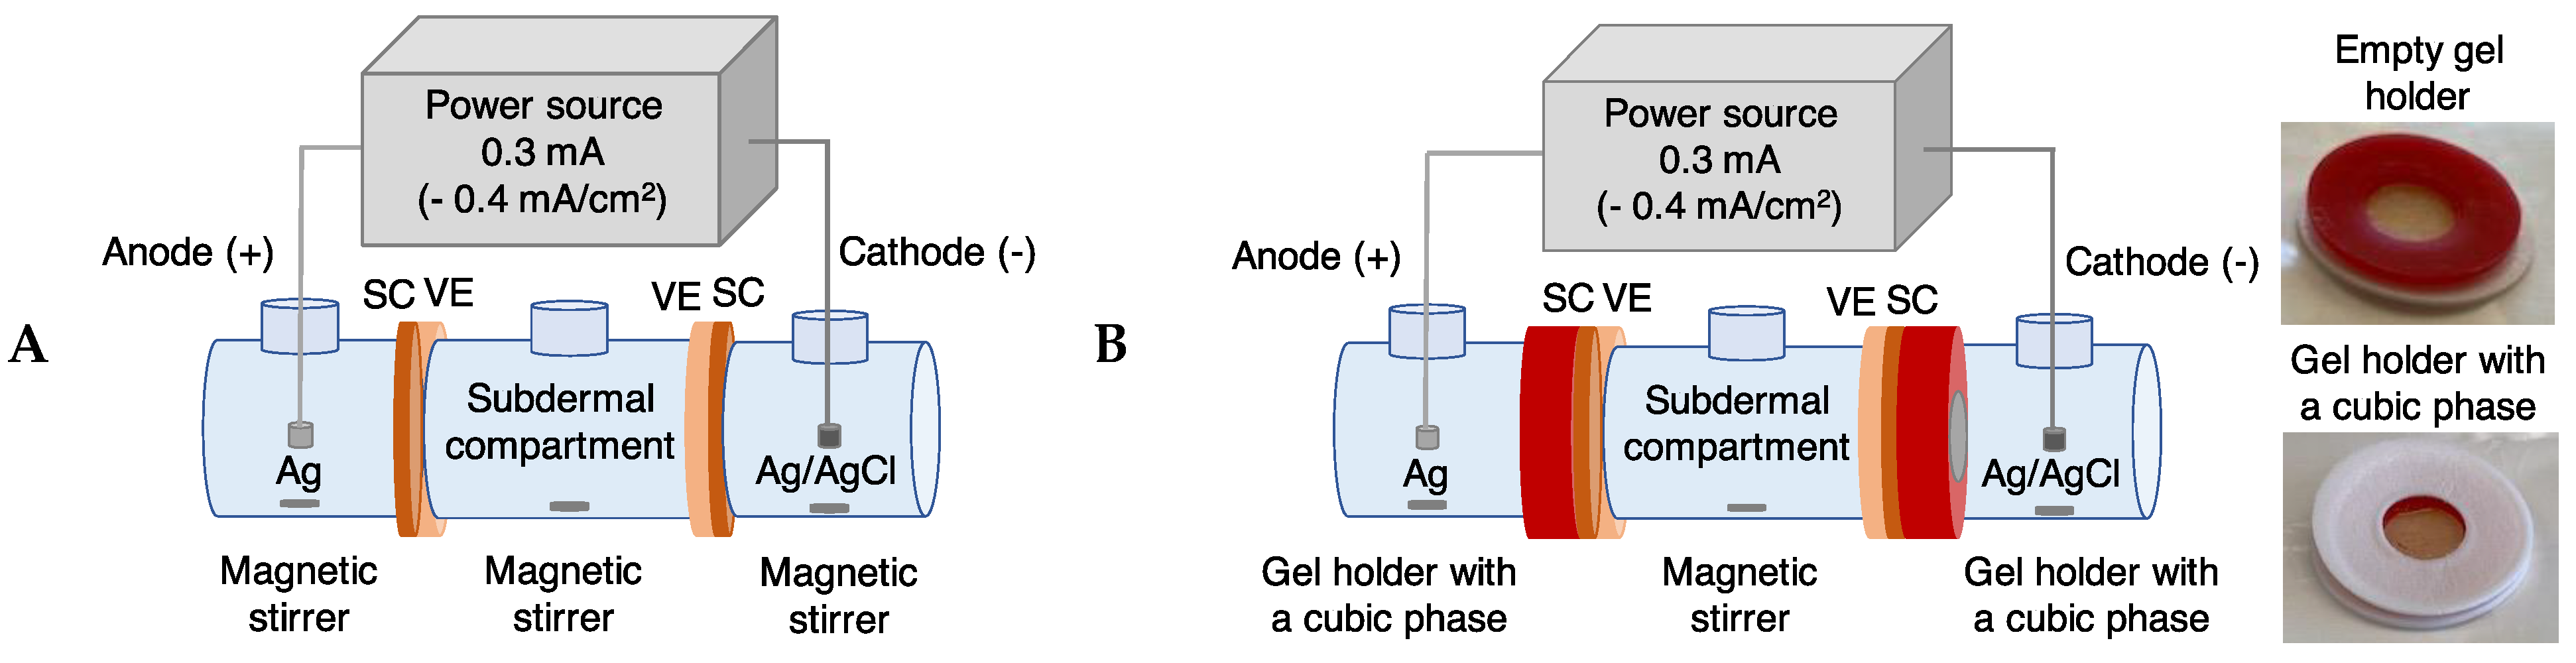
2.5. Reverse Iontophoretic Extraction of Trp and Kyn
2.6. Passive Diffusion Extraction of Trp and Kyn
2.7. Control Experiment
2.8. Analytical Method
2.9. Small Angle X-ray Diffraction (SAXD)
2.10. Data Analysis and Statistics
3. Results
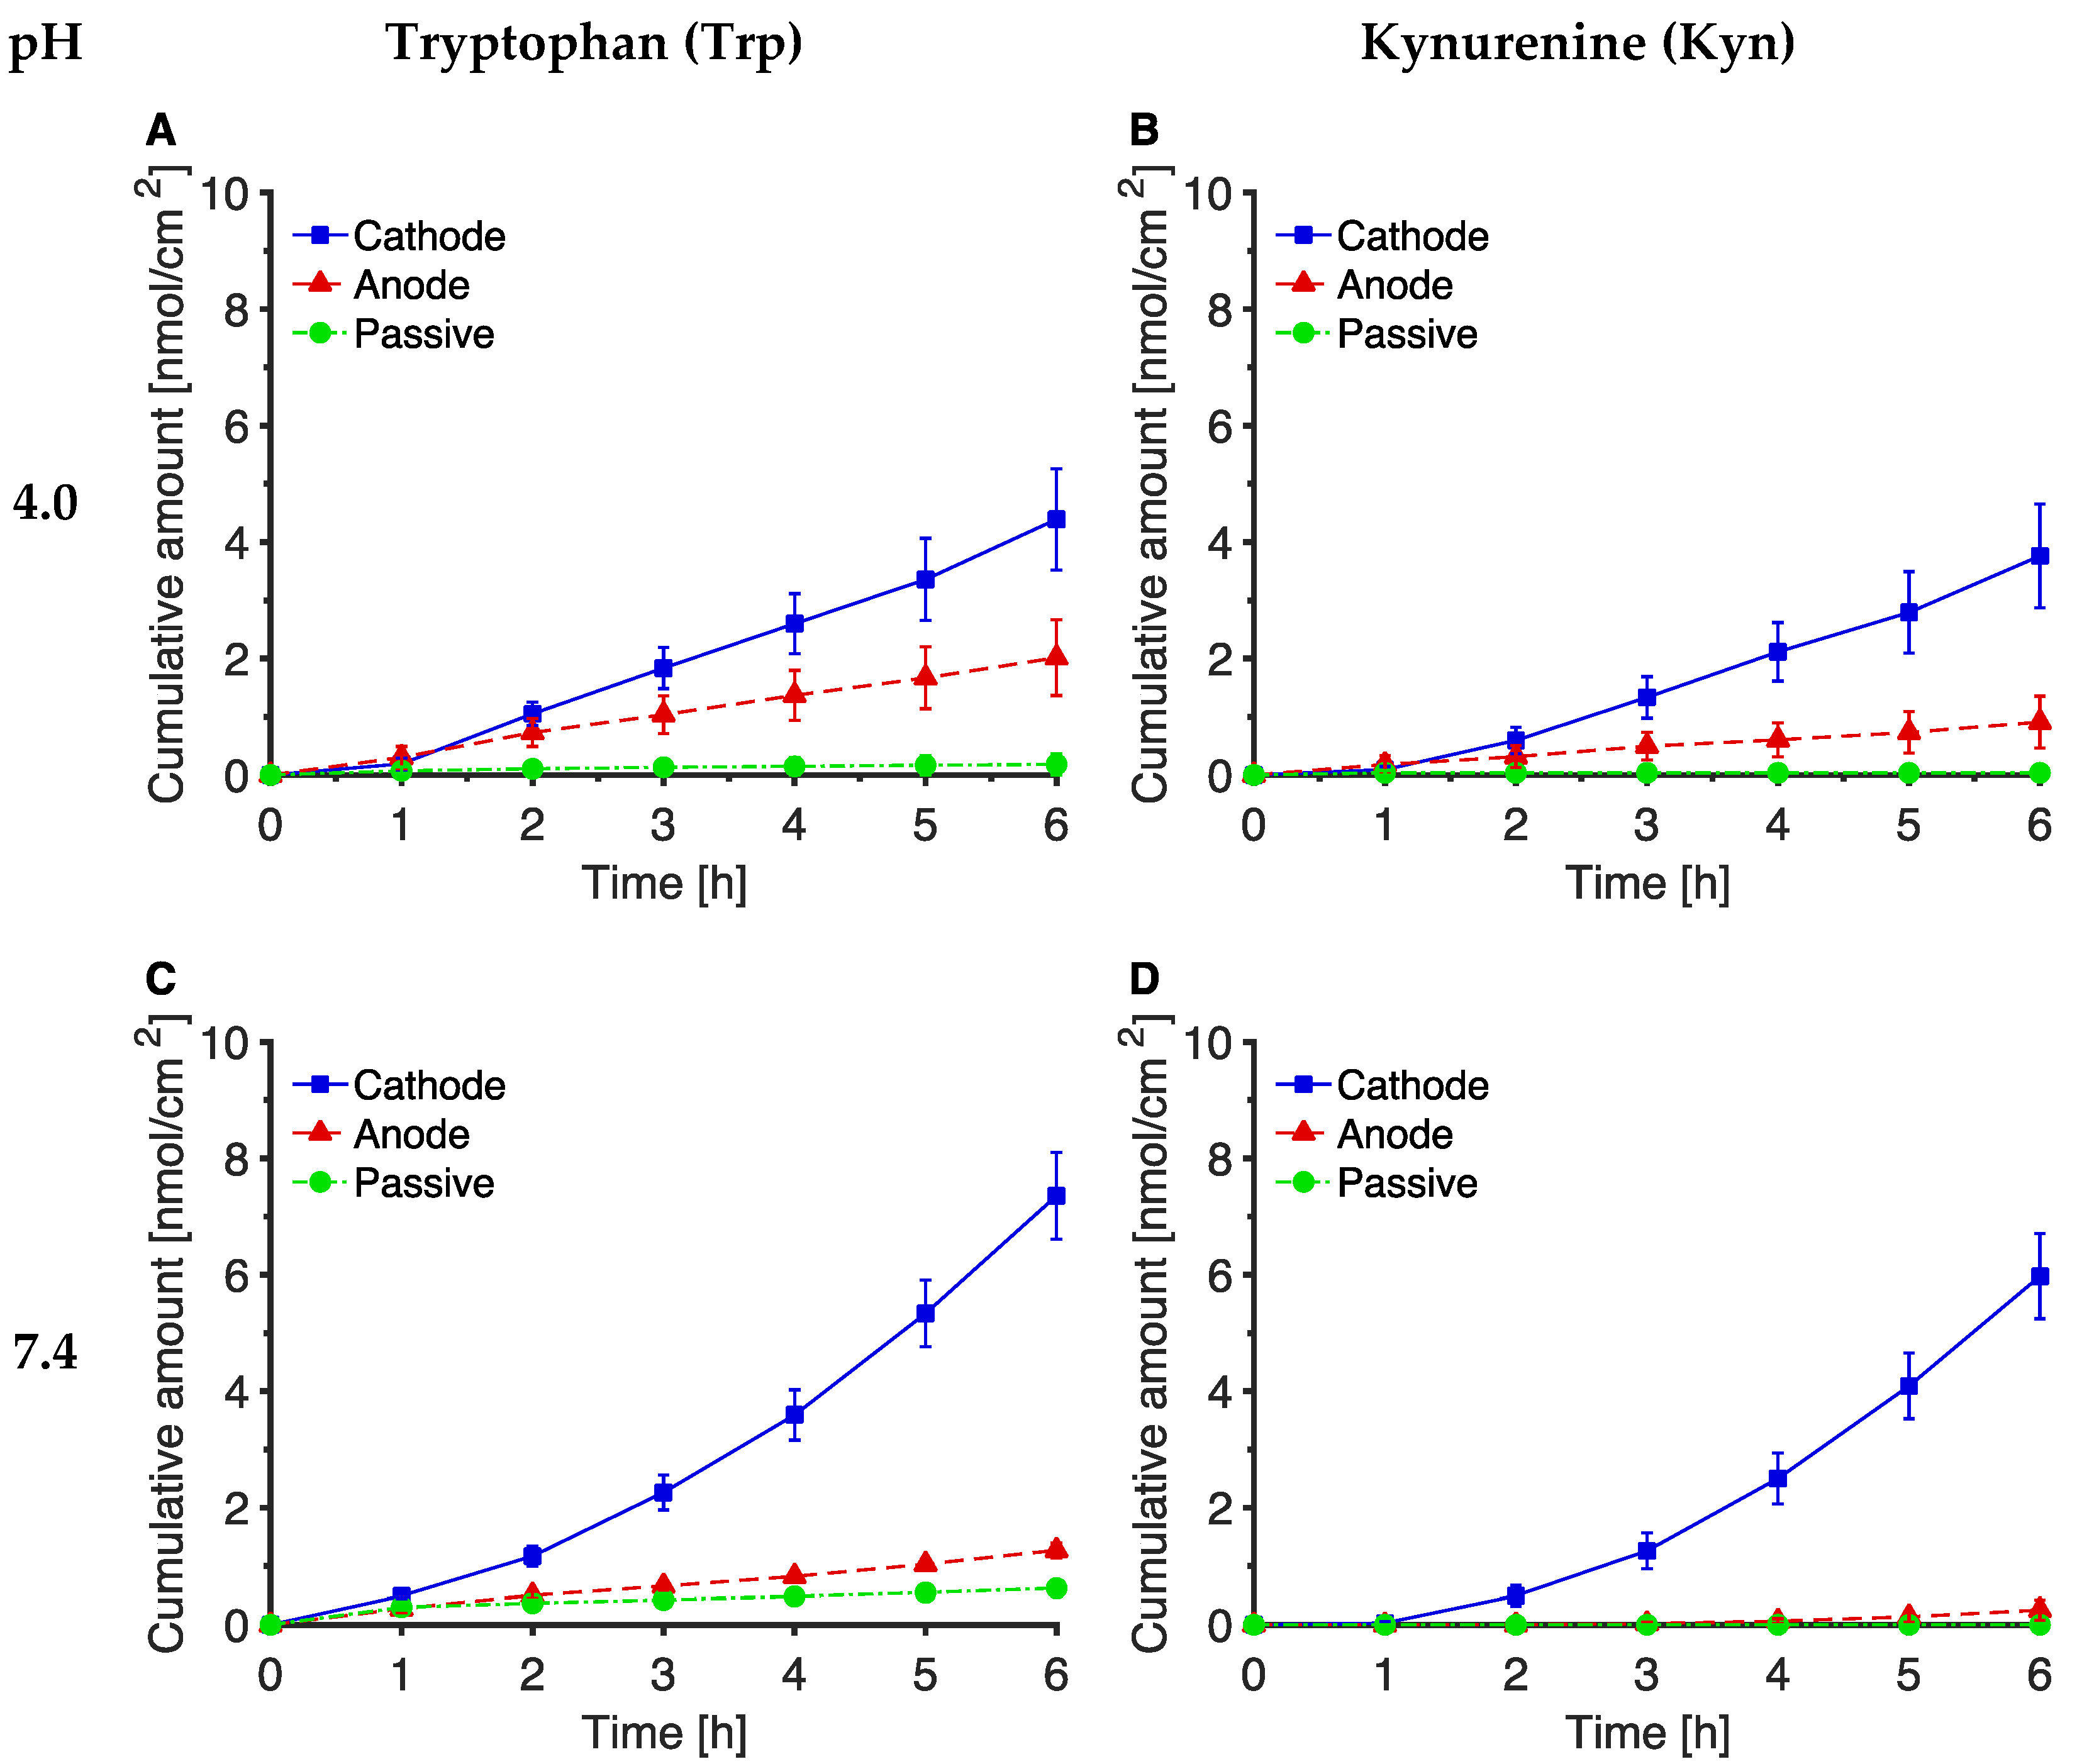
3.1. Reverse Iontophoretic Extraction of Trp and Kyn at pH 7.4
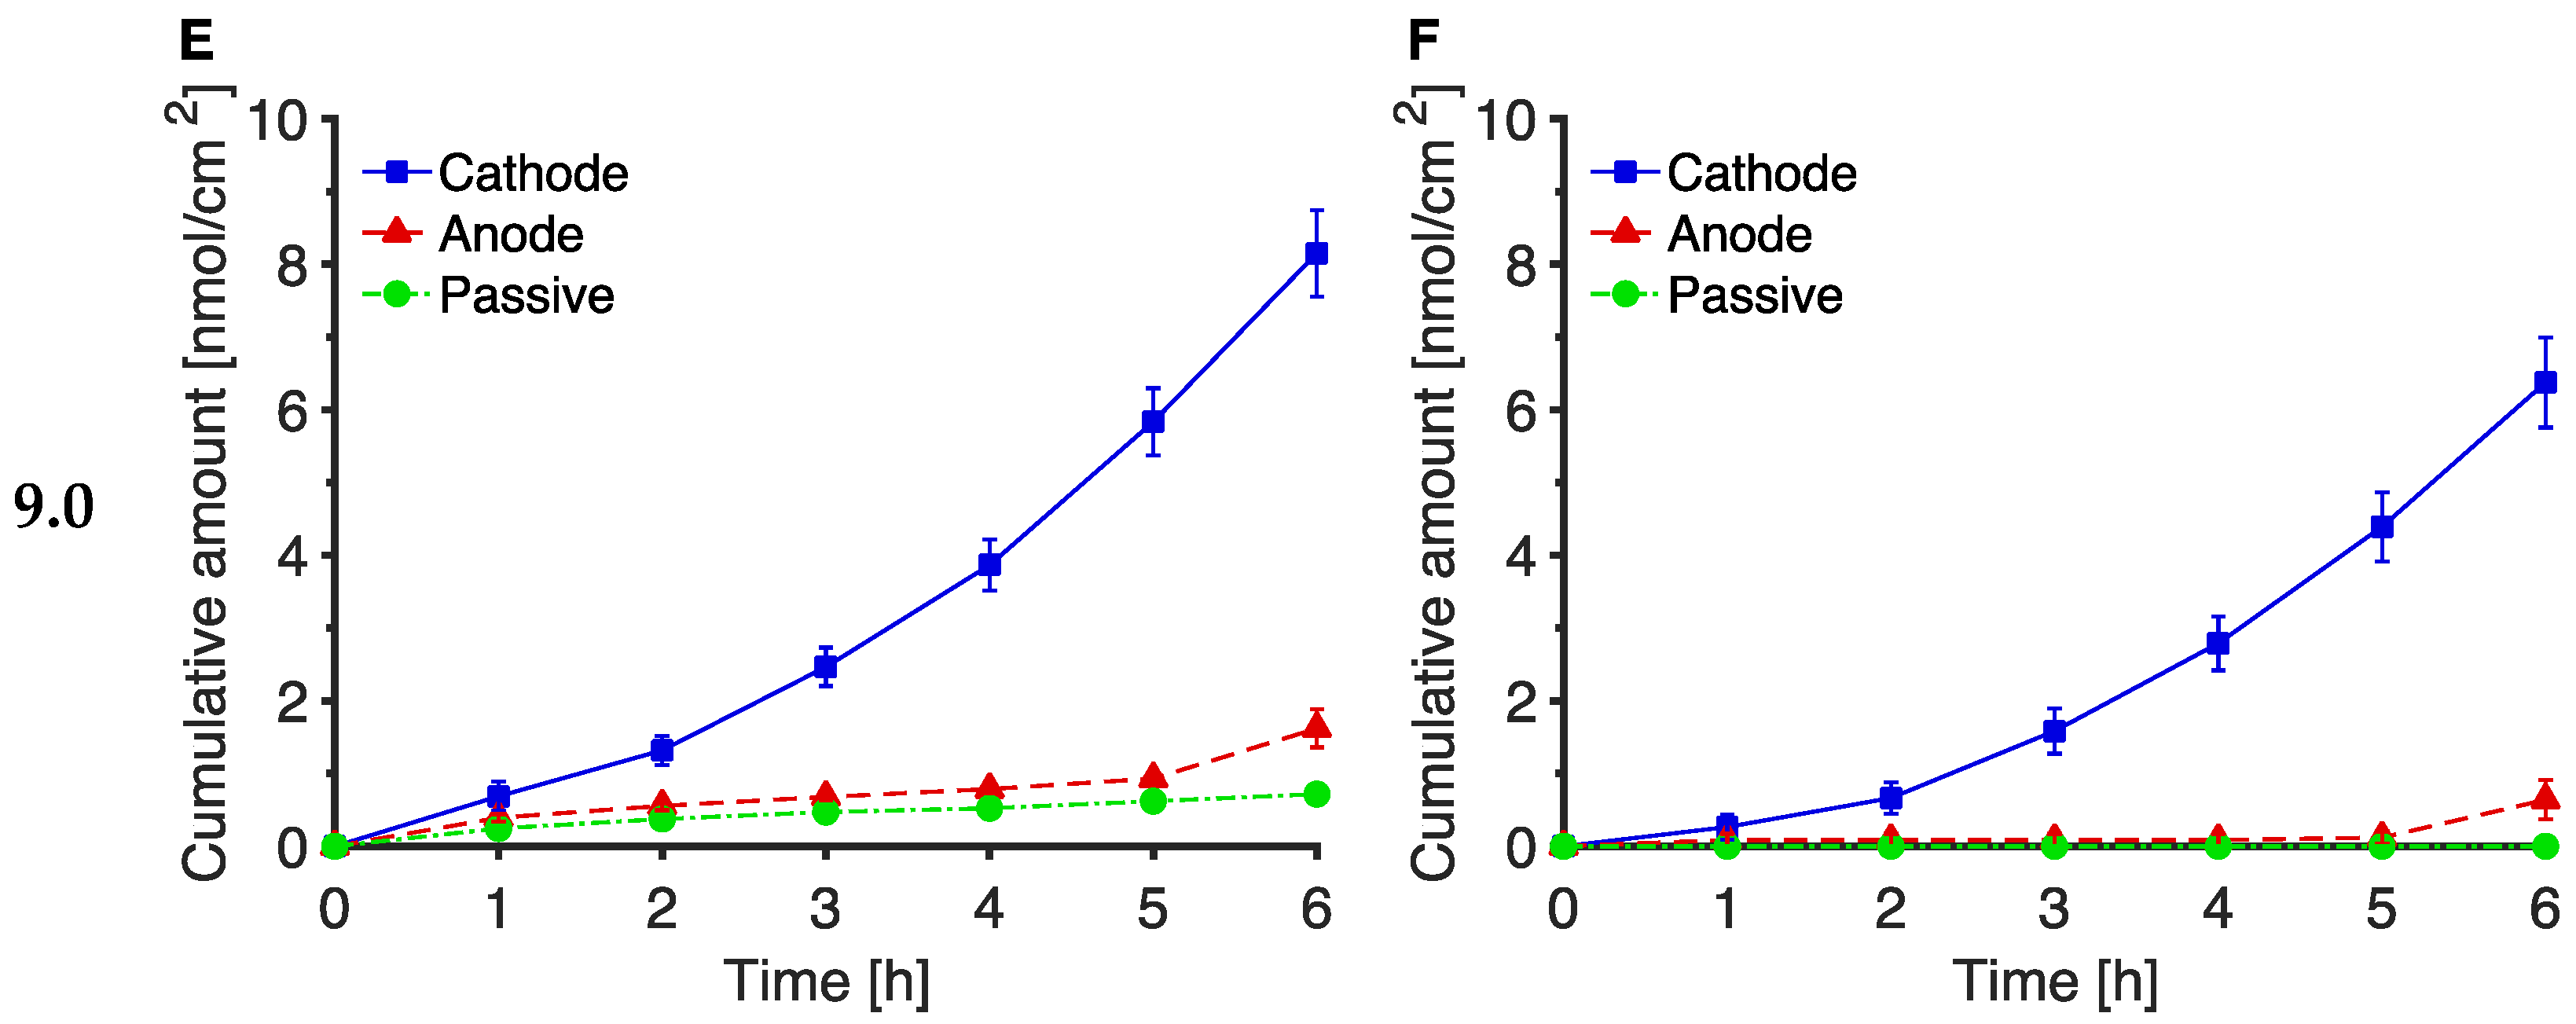
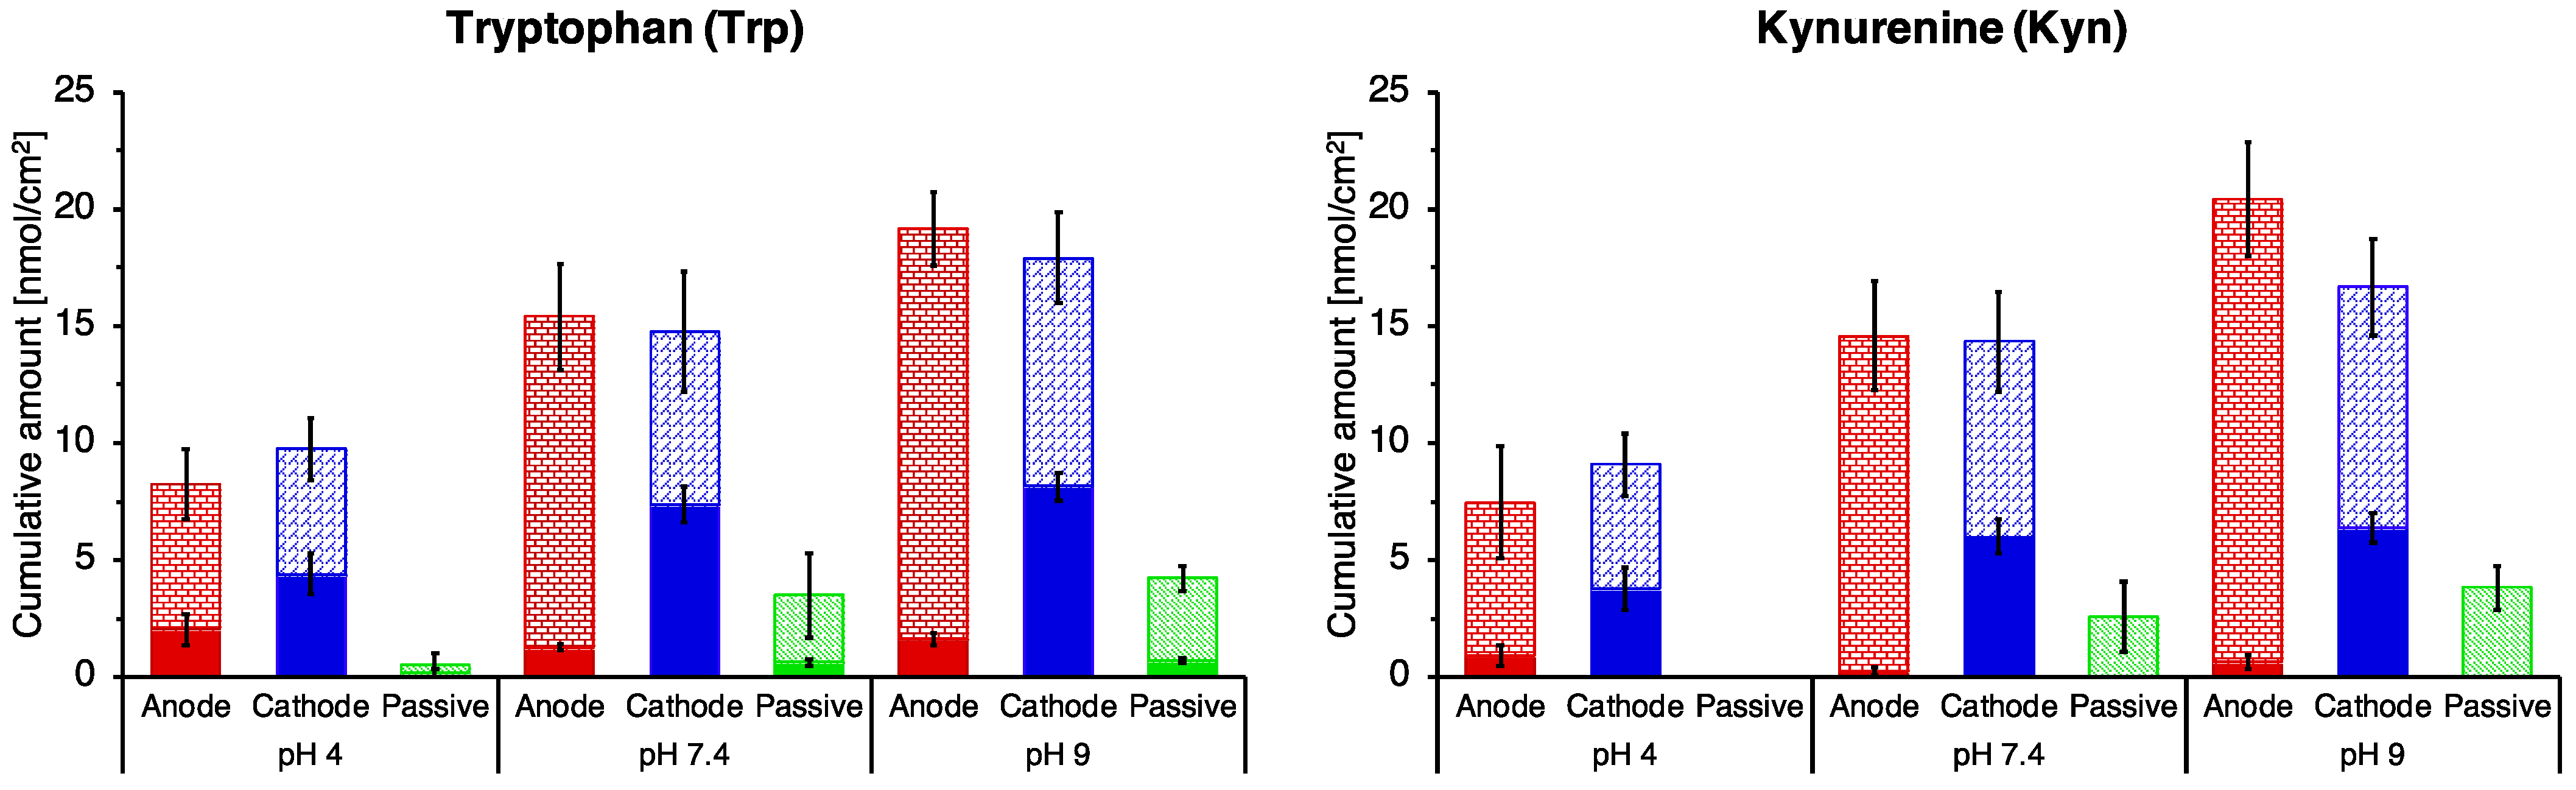
3.2. The Effect of pH on Trp and Kyn Extraction by Reverse Iontophoresis
3.3. Extraction of Endogenous Trp and Kyn
3.4. Post-Iontophoretic Passive Extraction of Trp and Kyn
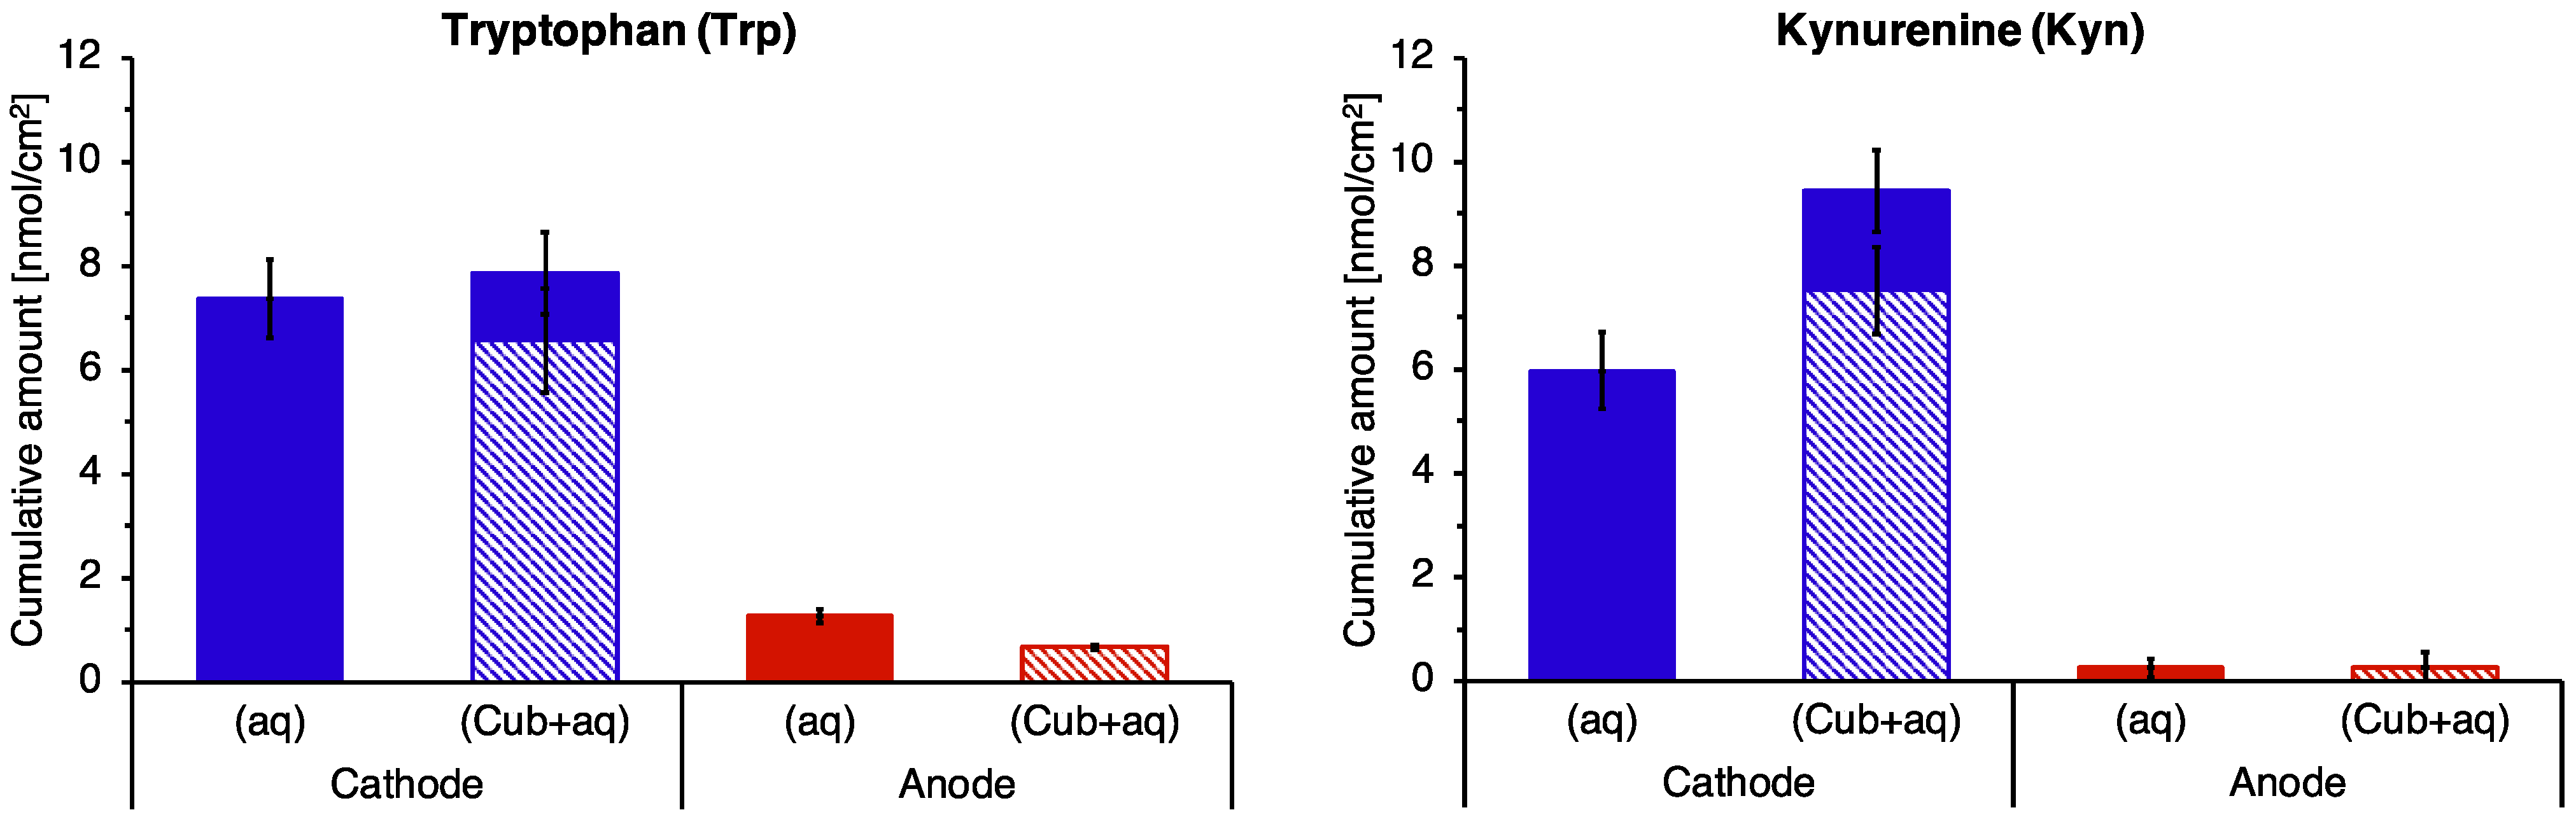
3.5. Reverse Iontophoretic Extraction into a Semisolid Matrix
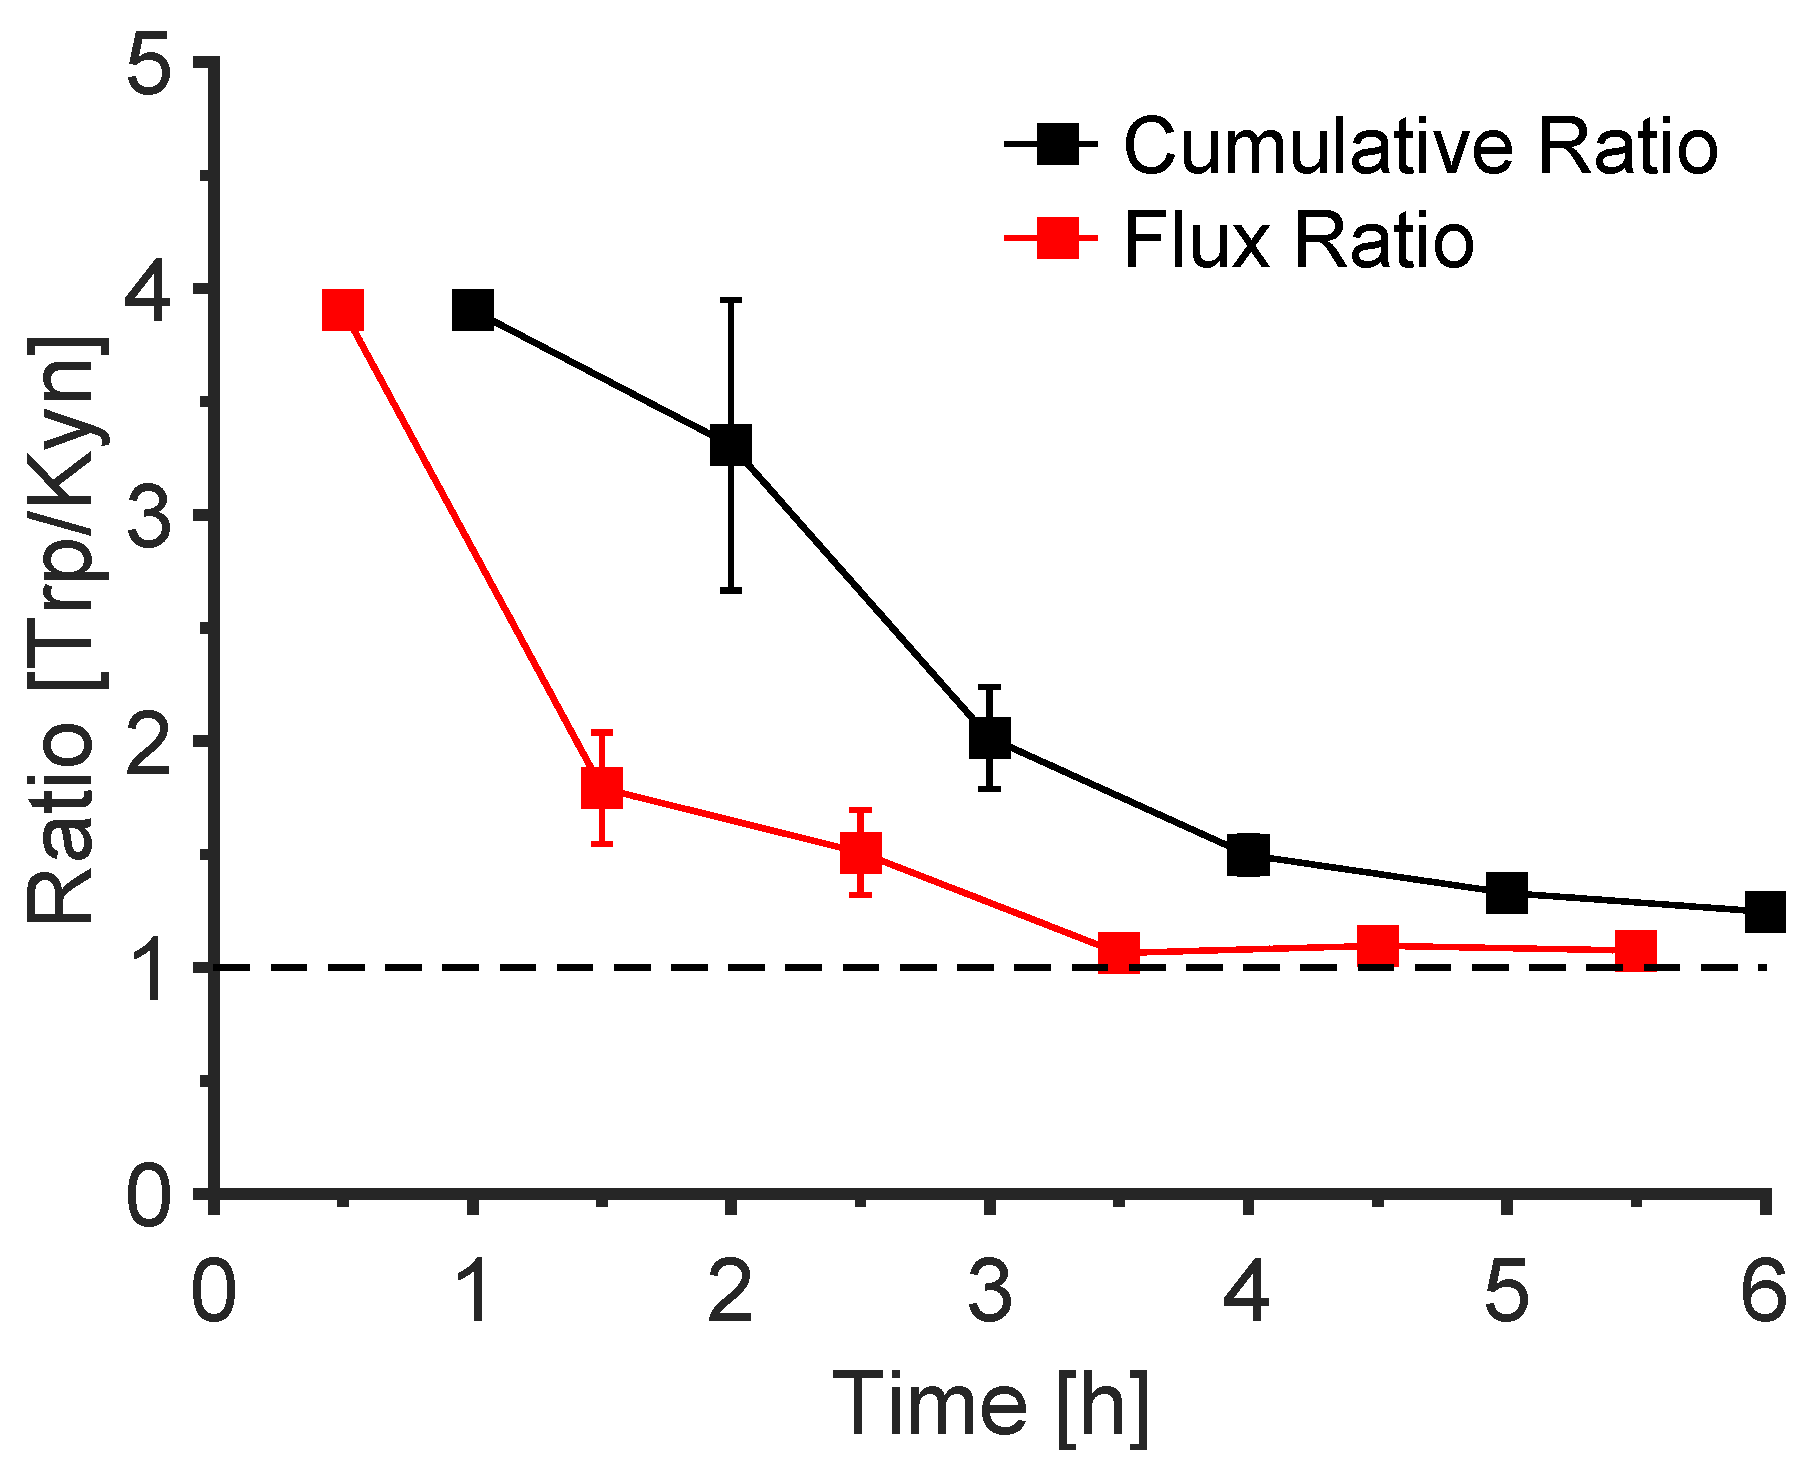
3.6. The Trp/Kyn Ratio
4. Discussion
5. Conclusions
Supplementary Materials
Author Contributions
Funding
Institutional Review Board Statement
Informed Consent Statement
Data Availability Statement
Acknowledgments
Conflicts of Interest
References
- Madan, V.; Lear, J.T.; Szeimies, R.M. Non-melanoma skin cancer. Lancet 2010, 375, 673–685. [Google Scholar] [CrossRef] [Green Version]
- World Health Organization. Skin Cancers. Available online: https://www.who.int/uv/faq/skincancer/en/index1.html (accessed on 8 May 2019).
- Diepgen, T.L.; Mahler, V. The epidemiology of skin cancer. Br. J. Derm. 2002, 146 (Suppl. 61), 1–6. [Google Scholar] [CrossRef]
- Fink, C.; Haenssle, H.A. Non-invasive tools for the diagnosis of cutaneous melanoma. Ski. Res. Technol. 2017, 23, 261–271. [Google Scholar] [CrossRef] [Green Version]
- Lui, H.; Zhao, J.; McLean, D.; Zeng, H. Real-time Raman Spectroscopy for In Vivo Skin Cancer Diagnosis. Cancer Res. 2012, 72, 2491–2500. [Google Scholar] [CrossRef] [Green Version]
- Kittler, H.; Pehamberger, H.; Wolff, K.; Binder, M. Accuracy of the clinical diagnosis for melanoma with and without dermoscopy. J. Investig. Dermatol. 2002, 119, 238. [Google Scholar]
- Grin, C.M.; Kopf, A.W.; Welkovich, B.; Bart, R.S.; Levenstein, M.J. Accuracy in the Clinical-Diagnosis of Malignant-Melanoma. Arch. Derm. 1990, 126, 763–766. [Google Scholar] [CrossRef]
- Carrera, C.; Segura, S.; Aguilera, P.; Takigami, C.M.; Gomes, A.; Barreiro, A.; Scalvenzi, M.; Longo, C.; Cavicchini, S.; Thomas, L.; et al. Dermoscopy Improves the Diagnostic Accuracy of Melanomas Clinically Resembling Seborrheic Keratosis: Cross-Sectional Study of the Ability to Detect Seborrheic Keratosis-Like Melanomas by a Group of Dermatologists with Varying Degrees of Experience. Dermatology 2017, 233, 471–479. [Google Scholar] [CrossRef]
- Morton, C.A.; Mackie, R.M. Clinical accuracy of the diagnosis of cutaneous malignant melanoma. Br. J. Derm. 1998, 138, 283–287. [Google Scholar] [CrossRef] [PubMed]
- Ferris, L.K.; Gerami, P.; Skelsey, M.K.; Peck, G.; Hren, C.; Gorman, C.; Frumento, T.; Siegel, D.M. Real-world performance and utility of a noninvasive gene expression assay to evaluate melanoma risk in pigmented lesions. Melanoma Res. 2018, 28, 478–482. [Google Scholar] [CrossRef]
- Malvehy, J.; Hauschild, A.; Curiel-Lewandrowski, C.; Mohr, P.; Hofmann-Wellenhof, R.; Motley, R.; Berking, C.; Grossman, D.; Paoli, J.; Loquai, C.; et al. Clinical performance of the Nevisense system in cutaneous melanoma detection: An international, multicentre, prospective and blinded clinical trial on efficacy and safety. Br. J. Derm. 2014, 171, 1099–1107. [Google Scholar] [CrossRef]
- Narayanamurthy, V.; Padmapriya, P.; Noorasafrin, A.; Pooja, B.; Hema, K.; Khan, A.Y.F.; Nithyakalyani, K.; Samsuri, F. Skin cancer detection using non-invasive techniques. RSC Adv. 2018, 8, 28095–28130. [Google Scholar] [CrossRef] [Green Version]
- Mogensen, M.; Jemec, G.B. Diagnosis of nonmelanoma skin cancer/keratinocyte carcinoma: A review of diagnostic accuracy of nonmelanoma skin cancer diagnostic tests and technologies. Derm. Surg. 2007, 33, 1158–1174. [Google Scholar] [CrossRef]
- Paliwal, S.; Hwang, B.H.; Tsai, K.Y.; Mitragotri, S. Diagnostic opportunities based on skin biomarkers. Eur. J. Pharm. Sci. 2013, 50, 546–556. [Google Scholar] [CrossRef] [PubMed]
- Maru, G.B.; Gandhi, K.; Ramchandani, A.; Kumar, G. The Role of Inflammation in Skin Cancer. In Inflammation and Cancer; Aggarwal, B.B., Sung, B., Gupta, S.C., Eds.; Springer: Basel, Switzerland, 2014; pp. 437–469. [Google Scholar]
- Hussain, S.P.; Harris, C.C. Inflammation and cancer: An ancient link with novel potentials. Int. J. Cancer 2007, 121, 2373–2380. [Google Scholar] [CrossRef] [PubMed]
- Mantovani, A.; Allavena, P.; Sica, A.; Balkwill, F. Cancer-related inflammation. Nature 2008, 454, 436–444. [Google Scholar] [CrossRef]
- Li, Q.; Withoff, S.; Verma, I.M. Inflammation-associated cancer: NF-kappaB is the lynchpin. Trends Immunol. 2005, 26, 318–325. [Google Scholar] [CrossRef]
- Liu, M.; Wang, X.; Wang, L.; Ma, X.; Gong, Z.; Zhang, S.; Li, Y. Targeting the IDO1 pathway in cancer: From bench to bedside. J. Hematol. Oncol. 2018, 11, 100. [Google Scholar] [CrossRef] [PubMed] [Green Version]
- Sumimoto, H.; Imabayashi, F.; Iwata, T.; Kawakami, Y. The BRAF-MAPK signaling pathway is essential for cancer-immune evasion in human melanoma cells. J. Exp. Med. 2006, 203, 1651–1656. [Google Scholar] [CrossRef] [Green Version]
- Bos, J.D.; Meinardi, M.M. The 500 Dalton rule for the skin penetration of chemical compounds and drugs. Exp. Dermatol. Viewp. 2000, 9, 165–169. [Google Scholar] [CrossRef] [PubMed]
- Scheuplein, R.J.; Blank, I.H. Permeability of the skin. Physiol. Rev. 1971, 51, 702–747. [Google Scholar] [CrossRef]
- Mbongue, J.C.; Nicholas, D.A.; Torrez, T.W.; Kim, N.S.; Firek, A.F.; Langridge, W.H. The Role of Indoleamine 2, 3-Dioxygenase in Immune Suppression and Autoimmunity. Vaccines 2015, 3, 703–729. [Google Scholar] [CrossRef] [Green Version]
- Wirthgen, E.; Hoeflich, A. Endotoxin-Induced Tryptophan Degradation along the Kynurenine Pathway: The Role of Indolamine 2,3-Dioxygenase and Aryl Hydrocarbon Receptor-Mediated Immunosuppressive Effects in Endotoxin Tolerance and Cancer and Its Implications for Immunoparalysis. J. Amino Acids 2015, 2015, 973548. [Google Scholar] [CrossRef] [Green Version]
- Chen, Y.; Guillemin, G.J. Kynurenine pathway metabolites in humans: Disease and healthy States. Int. J. Tryptophan. Res. 2009, 2, 1–19. [Google Scholar] [CrossRef] [PubMed] [Green Version]
- Zhai, L.; Dey, M.; Lauing, K.L.; Gritsina, G.; Kaur, R.; Lukas, R.V.; Nicholas, M.K.; Rademaker, A.W.; Dostal, C.R.; McCusker, R.H.; et al. The kynurenine to tryptophan ratio as a prognostic tool for glioblastoma patients enrolling in immunotherapy. J. Clin. Neurosci. 2015, 22, 1964–1968. [Google Scholar] [CrossRef] [PubMed] [Green Version]
- Gustafsson, A.; Prgomet, Z.; Jankovskaja, S.; Ruzgas, T.; Engblom, J.; Ohlsson, L.; Gjorloff Wingren, A. Effect of IFN-gamma on the kynurenine/tryptophan ratio in monolayer-cultured keratinocytes and a 3D reconstructed human epidermis model. J. Derm. Sci. 2020, 99, 177–184. [Google Scholar] [CrossRef]
- Leboulanger, B.; Guy, R.H.; Delgado-Charro, M.B. Reverse iontophoresis for non-invasive transdermal monitoring. Physiol. Meas. 2004, 25, R35–R50. [Google Scholar] [CrossRef]
- Kalia, Y.N.; Naik, A.; Garrison, J.; Guy, R.H. Iontophoretic drug delivery. Adv. Drug Deliv. Rev. 2004, 56, 619–658. [Google Scholar] [CrossRef]
- Green, P.G.; Hinz, R.S.; Cullander, C.; Yamane, G.; Guy, R.H. Iontophoretic delivery of amino acids and amino acid derivatives across the skin in vitro. Pharm. Res. 1991, 8, 1113–1120. [Google Scholar] [CrossRef]
- Delgado-Charro, M.B.; Guy, R.H. Transdermal reverse iontophoresis of valproate: A noninvasive method for therapeutic drug monitoring. Pharm. Res. 2003, 20, 1508–1513. [Google Scholar] [CrossRef] [PubMed]
- Sieg, A.; Jeanneret, F.; Fathi, M.; Hochstrasser, D.; Rudaz, S.; Veuthey, J.L.; Guy, R.H.; Delgado-Charro, M.B. Extraction of amino acids by reverse iontophoresis: Simulation of therapeutic monitoring in vitro. Eur. J. Pharm. Biopharm. 2008, 70, 908–913. [Google Scholar] [CrossRef]
- Sieg, A.; Jeanneret, F.; Fathi, M.; Hochstrasser, D.; Rudaz, S.; Veuthey, J.L.; Guy, R.H.; Delgado-Charro, M.B. Extraction of amino acids by reverse iontophoresis in vivo. Eur. J. Pharm. Biopharm. 2009, 72, 226–231. [Google Scholar] [CrossRef] [PubMed]
- Sylvestre, J.P.; Bouissou, C.C.; Guy, R.H.; Delgado-Charro, M.B. Extraction and quantification of amino acids in human stratum corneum in vivo. Br. J. Derm. 2010, 163, 458–465. [Google Scholar] [CrossRef] [PubMed]
- Yang, Q.; Guy, R.H. Characterisation of Skin Barrier Function Using Bioengineering and Biophysical Techniques. Pharm. Res. 2015, 32, 445–457. [Google Scholar] [CrossRef] [Green Version]
- Lipani, L.; Dupont, B.G.R.; Doungmene, F.; Marken, F.; Tyrrell, R.M.; Guy, R.H.; Ilie, A. Non-invasive, transdermal, path-selective and specific glucose monitoring via a graphene-based platform. Nat. Nanotechnol. 2018, 13, 504–511. [Google Scholar] [CrossRef] [PubMed]
- Sieg, A.; Guy, R.H.; Delgado-Charro, M.B. Noninvasive glucose monitoring by reverse iontophoresis in vivo: Application of the internal standard concept. Clin. Chem. 2004, 50, 1383–1390. [Google Scholar] [CrossRef]
- Merino, V.; Lopez, A.; Hochstrasser, D.; Guy, R.H. Noninvasive sampling of phenylalanine by reverse iontophoresis. J. Control. Release 1999, 61, 65–69. [Google Scholar] [CrossRef]
- Ebah, L.M.; Read, I.; Sayce, A.; Morgan, J.; Chaloner, C.; Brenchley, P.; Mitra, S. Reverse iontophoresis of urea in health and chronic kidney disease: A potential diagnostic and monitoring tool? Eur. J. Clin. Investig. 2012, 42, 840–847. [Google Scholar] [CrossRef] [Green Version]
- Mize, N.K.; Buttery, M.; Daddona, P.; Morales, C.; Cormier, M. Reverse iontophoresis: Monitoring prostaglandin E2 associated with cutaneous inflammation in vivo. Exp. Derm. 1997, 6, 298–302. [Google Scholar] [CrossRef]
- Bouissou, C.C.; Sylvestre, J.P.; Guy, R.H.; Delgado-Charro, M.B. Reverse iontophoresis of amino acids: Identification and separation of stratum corneum and subdermal sources in vitro. Pharm. Res. 2009, 26, 2630–2638. [Google Scholar] [CrossRef]
- Hoffman, A.S. Hydrogels for biomedical applications. Adv. Drug Deliv. Rev. 2012, 64, 18–23. [Google Scholar] [CrossRef]
- Koehler, J.; Brandl, F.P.; Goepferich, A.M. Hydrogel wound dressings for bioactive treatment of acute and chronic wounds. Eur. Polym. J. 2018, 100, 1–11. [Google Scholar] [CrossRef]
- Santos, L.F.; Correia, I.J.; Silva, A.S.; Mano, J.F. Biomaterials for drug delivery patches. Eur. J. Pharm. Sci. 2018, 118, 49–66. [Google Scholar] [CrossRef]
- Bakshi, P.; Vora, D.; Hemmady, K.; Banga, A.K. Iontophoretic skin delivery systems: Success and failures. Int. J. Pharm. 2020, 586, 119584. [Google Scholar] [CrossRef]
- Rac, V.; Levic, S.; Balanc, B.; Olalde Graells, B.; Bijelic, G. PVA Cryogel as model hydrogel for iontophoretic transdermal drug delivery investigations. Comparison with PAA/PVA and PAA/PVP interpenetrating networks. Colloids Surf. B Biointerfaces 2019, 180, 441–448. [Google Scholar] [CrossRef]
- Milak, S.; Zimmer, A. Glycerol monooleate liquid crystalline phases used in drug delivery systems. Int. J. Pharm. 2015, 478, 569–587. [Google Scholar] [CrossRef]
- Kulkarni, C.V.; Wachter, W.; Iglesias-Salto, G.; Engelskirchen, S.; Ahualli, S. Monoolein: A magic lipid? Phys. Chem. Chem. Phys. 2011, 13, 3004–3021. [Google Scholar] [CrossRef] [PubMed]
- Larsson, K. Cubic Lipid-Water Phases—Structures and Biomembrane Aspects. J. Phys. Chem. 1989, 93, 7304–7314. [Google Scholar] [CrossRef]
- Engström, S.; Norden, T.P.; Nyquist, H. Cubic phases for studies of drug partition into lipid bilayers. Eur. J. Pharm. Sci. 1999, 8, 243–254. [Google Scholar] [CrossRef]
- Clogston, J.; Caffrey, M. Controlling release from the lipidic cubic phase. Amino acids, peptides, proteins and nucleic acids. J. Control. Release 2005, 107, 97–111. [Google Scholar] [CrossRef] [PubMed]
- Geraghty, P.B.; Attwood, D.; Collett, J.H.; Dandiker, Y. The in vitro release of some antimuscarinic drugs from monoolein/water lyotropic liquid crystalline gels. Pharm. Res. 1996, 13, 1265–1271. [Google Scholar] [CrossRef] [PubMed]
- Rummel, G.; Hardmeyer, A.; Widmer, C.; Chiu, M.L.; Nollert, P.; Locher, K.P.; Pedruzzi, I.I.; Landau, E.M.; Rosenbusch, J.P. Lipidic Cubic Phases: New Matrices for the Three-Dimensional Crystallization of Membrane Proteins. J. Struct. Biol. 1998, 121, 82–91. [Google Scholar] [CrossRef]
- Nolan, L.M.A.; Corish, J.; Corrigan, O.I.; Fitzpatrick, D. Iontophoretic and chemical enhancement of drug delivery. Int. J. Pharm. 2003, 257, 41–55. [Google Scholar] [CrossRef]
- OECD. Test Guideline 428: Skin Absorption: In vitro Method. In OECD Guidance Notes on Dermal Absorption, Series on Testing and Assessment; Organisation for Economic Co-operation and Development: Paris, France, 2004; Volume Section 4, p. 156. [Google Scholar]
- Hopf, N.B.; Champmartin, C.; Schenk, L.; Berthet, A.; Chedik, L.; Du Plessis, J.L.; Franken, A.; Frasch, F.; Gaskin, S.; Johanson, G.; et al. Reflections on the OECD guidelines for in vitro skin absorption studies. Regul. Toxicol. Pharm. 2020, 117, 104752. [Google Scholar] [CrossRef] [PubMed]
- Jankovskaja, S.; Engblom, J.; Rezeli, M.; Marko-Varga, G.; Ruzgas, T.; Björklund, S. Non-invasive skin sampling of tryptophan/kynurenine ratio in vitro towards a skin cancer biomarker. Sci. Rep. 2021, 11, 678. [Google Scholar] [CrossRef]
- RStudio Team. RStudio: Integrated Development for R; RStudio, PBC: Boston, MA, USA, 2020. [Google Scholar]
- Suzuki, Y.; Suda, T.; Furuhashi, K.; Suzuki, M.; Fujie, M.; Hahimoto, D.; Nakamura, Y.; Inui, N.; Nakamura, H.; Chida, K. Increased serum kynurenine/tryptophan ratio correlates with disease progression in lung cancer. Lung Cancer 2010, 67, 361–365. [Google Scholar] [CrossRef] [PubMed]
- Qiu, H.; Caffrey, M. The phase diagram of the monoolein/water system: Metastability and equilibrium aspects. Biomaterials 2000, 21, 223–234. [Google Scholar] [CrossRef]
- Briggs, J.; Chung, H.; Caffrey, M. The temperature-composition phase diagram and mesophase structure characterization of the monoolein/water system. J. Phys. II 1996, 6, 723–751. [Google Scholar] [CrossRef] [Green Version]
- Chemelli, A.; Conde-Valentin, B.; Uhlig, F.; Glatter, O. Amino Acid Induced Modification of Self-Assembled Monoglyceride-Based Nanostructures. Langmuir 2015, 31, 10377–10381. [Google Scholar] [CrossRef]
- Rawlings, A.V.; Scott, I.R.; Harding, C.R.; Bowser, P.A. Stratum-Corneum Moisturization at the Molecular-Level. J. Investig. Dermatol. 1994, 103, 731–740. [Google Scholar] [CrossRef] [Green Version]


| Analyte | Structure | Mw [g/mol] | LogD * |
|---|---|---|---|
| Tryptophan (Trp) | 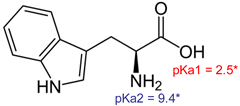 | 204.22 | −1.1 at pH 4.0 −1.1 at pH 7.4 −1.2 at pH 9.0 |
| Kynurenine (Kyn) |  | 208.21 | −2.0 at pH 4.0 −1.9 at pH 7.4 −2.2 at pH 9.0 |
| pH 1 | Analyte | Cumulative Amount Extracted (nmol/cm 2) | Trp/Kyn Ratio 2 | ER 3 | |||
|---|---|---|---|---|---|---|---|
| at Anode | at Cathode | Passively | Anode | Cathode | |||
| 4.0 | Trp | 2.0 ± 0.7 (n = 12) | 4.4 ± 0.9 (n = 10) | 0.2 ± 0.2 (n = 4) | 1.4 ± 0.2 (n = 9) | 11 | 24 |
| Kyn | 0.9 ± 0.4 (n = 12) | 3.8 ± 0.9 (n = 10) | <LOQ (n = 4) | - | - | ||
| 7.4 | Trp | 1.3 ± 0.1 (n = 6) | 7.4 ± 0.8 (n = 6) | 0.6 ± 0.1 (n = 4) | 1.3 ± 0.3 (n = 6) | 2 | 12 |
| Kyn | 0.3 ± 0.2 (n = 6) | 6.0 ± 0.7 (n = 6) | <LOQ (n = 4) | - | - | ||
| 9.0 | Trp | 1.6 ± 0.3 (n = 5) | 8.2 ± 0.6 (n = 6) | 0.7 ± 0.1 (n = 4) | 1.3 ± 0.6 (n = 6) | 2 | 11 |
| Kyn | 0.6 ± 0.3 (n = 5) | 6.4 ± 0.7 (n = 6) | <LOQ (n = 4) | - | - | ||
Publisher’s Note: MDPI stays neutral with regard to jurisdictional claims in published maps and institutional affiliations. |
© 2021 by the authors. Licensee MDPI, Basel, Switzerland. This article is an open access article distributed under the terms and conditions of the Creative Commons Attribution (CC BY) license (https://creativecommons.org/licenses/by/4.0/).
Share and Cite
Morin, M.; Björklund, S.; Jankovskaja, S.; Moore, K.; Delgado-Charro, M.B.; Ruzgas, T.; Guy, R.H.; Engblom, J. Reverse Iontophoretic Extraction of Skin Cancer-Related Biomarkers. Pharmaceutics 2022, 14, 79. https://doi.org/10.3390/pharmaceutics14010079
Morin M, Björklund S, Jankovskaja S, Moore K, Delgado-Charro MB, Ruzgas T, Guy RH, Engblom J. Reverse Iontophoretic Extraction of Skin Cancer-Related Biomarkers. Pharmaceutics. 2022; 14(1):79. https://doi.org/10.3390/pharmaceutics14010079
Chicago/Turabian StyleMorin, Maxim, Sebastian Björklund, Skaidre Jankovskaja, Kieran Moore, Maria Begoña Delgado-Charro, Tautgirdas Ruzgas, Richard H. Guy, and Johan Engblom. 2022. "Reverse Iontophoretic Extraction of Skin Cancer-Related Biomarkers" Pharmaceutics 14, no. 1: 79. https://doi.org/10.3390/pharmaceutics14010079
APA StyleMorin, M., Björklund, S., Jankovskaja, S., Moore, K., Delgado-Charro, M. B., Ruzgas, T., Guy, R. H., & Engblom, J. (2022). Reverse Iontophoretic Extraction of Skin Cancer-Related Biomarkers. Pharmaceutics, 14(1), 79. https://doi.org/10.3390/pharmaceutics14010079