Review

Analytical Techniques for Structural Characterization of Proteins in Solid Pharmaceutical Forms: An Overview

Department of Pharmaceutical Chemistry, Faculty of Pharmacy, University of Ljubljana, Aškerčeva Cesta 7, SI-1000 Ljubljana, Slovenia
*
Authors to whom correspondence should be addressed.
Pharmaceutics 2021, 13(4), 534; https://doi.org/10.3390/pharmaceutics13040534
Submission received: 11 February 2021 / Revised: 21 March 2021 / Accepted: 8 April 2021 / Published: 11 April 2021
(This article belongs to the Section Biologics and Biosimilars)

Abstract

:
Therapeutic proteins as biopharmaceuticals have emerged as a very important class of drugs for the treatment of many diseases. However, they are less stable compared to conventional pharmaceuticals. Their long-term stability in solid forms, which is critical for product performance, depends heavily on the retention of the native protein structure during the lyophilization (freeze-drying) process and, thereafter, in the solid state. Indeed, the biological function of proteins is directly related to the tertiary and secondary structure. Besides physical stability and biological activity, conformational stability (three-dimensional structure) is another important aspect when dealing with protein pharmaceuticals. Moreover, denaturation as loss of higher order structure is often a precursor to aggregation or chemical instability. Careful study of the physical and chemical properties of proteins in the dried state is therefore critical during biopharmaceutical drug development to deliver a final drug product with built-in quality that is safe, high-quality, efficient, and affordable for patients. This review provides an overview of common analytical techniques suitable for characterizing pharmaceutical protein powders, providing structural, and conformational information, as well as insights into dynamics. Such information can be very useful in formulation development, where selecting the best formulation for the drug can be quite a challenge.

Graphical Abstract

1. Introduction

Biological drugs based on proteins as active substance, have emerged as a very important class of drugs offering promising alternatives for the treatment of many diseases, such as various forms of cancer, autoimmune diseases, and hormonal disorders. Due to the complexity of protein structures and their high susceptibility to aggregation, fragmentation, and chemical modifications, successful drug development and production is extremely challenging [1]. To increase the stability of proteins in solution, they are formulated as solid pharmaceutical forms, the most common of which are lyophilizates (obtained by lyophilization or freeze-drying process). Pharmaceutical proteins are subjected to various stress conditions during the preparation of the lyophilization solution, during the time they are dissolved in the solution prior to the initiation of lyophilization, and in the lyophilization process where they are subjected to freezing, and primary and secondary drying. All stress factors, in combination with selected excipients for the chosen formulation, can alter the physical and/or molecular properties of the protein in solution or in the final solid pharmaceutical form. If the native structure is not maintained during the lyophilization process, this may be reflected in the unstable final product and, hence, in the product quality, safety, and efficiency [2]. It is also known that proteins can easily fold back during rehydration and exhibit native structures despite partial or complete unfolding in the solid state [3,4]. Nevertheless, the protein may exhibit poor storage stability [5,6]. Therefore, preservation of the native structure in the dried state is crucial for adequate storage stability of proteins [7,8].
Protein drug development is based on stability studies in which critical properties of protein formulations are evaluated using various analytical methods. During these studies, formulations containing proteins are subjected to various forms of stress, including temperature, pH, and freezing, and their properties are monitored over time. The evolution also depends on the choice of excipients, stabilizing agents to protect the protein structure during freezing and drying, and the lyophilization cycle [9]. Usually, several different excipients must be used because different or even opposite protective functions are required. For example, buffers to reduce the pH consequences of concentration changes during freezing [10], solutes that are preferentially excluded from the surface of the drug pharmaceutical to protect against the effect of removal of local water during freezing [11], and also surfactants that can reduce the surface denaturation of proteins during freezing by reducing the ice-water interface [12]. Furthermore, carbohydrates are often added because they can bind to the surface of biological material (the interactions involve hydrogen bonding) and thus protect against drying damage [13,14,15]. Carbohydrates with higher molecular weight have less protective effect than smaller carbohydrates such as sugars, as there are fewer free hydroxyl groups available to interact with protein. Therefore, sugars, such as trehalose, which is known to be particularly effective in this regard [16,17], and others have been used as very effective lyoprotectants. The molar ratio of excipient to protein is also important in stabilizing the protein during lyophilization. In addition, excipients that remain amorphous in the solid state have a better ability to prevent protein aggregation. [18]
Solid-state characterization is currently less established. Usually, analytical methods evaluate critical properties of the protein formulation in solution after reconstitution, which is not necessarily indicative of adequate protein stabilization in the solid phase and therefore cannot guarantee long-term stability of the pharmaceutical form. The less frequent use of solid-phase characterization can also be attributed to the general lack of high-resolution methods. Nevertheless, methods based on structural characterization of proteins in solid form can evaluate both secondary and tertiary structure of proteins in solid-state during formulation development. Thus, only relevant formulations that are able to preserve the native structure of proteins in the solid state can be included in stability studies. The use of such an approach can guide the development of solid-state protein pharmaceuticals and reduce the risk of selecting unsuitable formulations for stability studies as a basis for selecting the final formulation. However, there is a general need for the development of appropriate high resolution analytical techniques for the characterization of proteins in the solid state [19,20].
This review presents the most common analytical methods for the structural characterization of proteins in solids (Figure 1), their basic principles, and a brief discussion with selected examples for each method. For the characterization of protein secondary structure in the solid state, Fourier transform infrared spectroscopy (FTIR), Raman spectroscopy, and near-infrared spectroscopy (NIR) are the most commonly used methods. Solid-state fluorescence and UV–Vis spectroscopy can be used to follow the tertiary structural changes of proteins to some extent. Circular dichroism can be used to study both secondary and tertiary protein structures by measuring the difference in absorbance. Solid-state nuclear magnetic resonance (ssNMR) is used to characterize both structural and dynamic changes. Differential scanning calorimetry (DSC) is useful for characterizing molecular mobility, crystallization kinetics, degree of crystallinity and denaturation, and for determining glass transition temperature (Tg). Dielectric relaxation spectroscopy (DRS) as a complementary method to DSC can provide insights into protein dynamics, while X-ray diffraction (XRD) analysis can be used to study the powder structure (amorphous/crystalline) of lyophilized proteins. Moreover, recently developed methods based on mass spectrometry, such as solid-state hydrogen-deuterium exchange mass spectrometry (ssHDX-MS), can be used to study the protein structure and conformation in the solid state with high resolution. In addition to structural characterization, monitoring protein aggregation is also very important for the stability, quality, safety, and efficiency of the final drug. Aggregation, along with protein denaturation and surface adsorption, can affect the amount of native protein and, thus, the activity of the drug. This review also presents two regularly used techniques for the analysis of aggregated species: size-exclusion chromatography (SEC) and dynamic light scattering (DLS) [21,22,23].

2. Methods for Structural Characterization

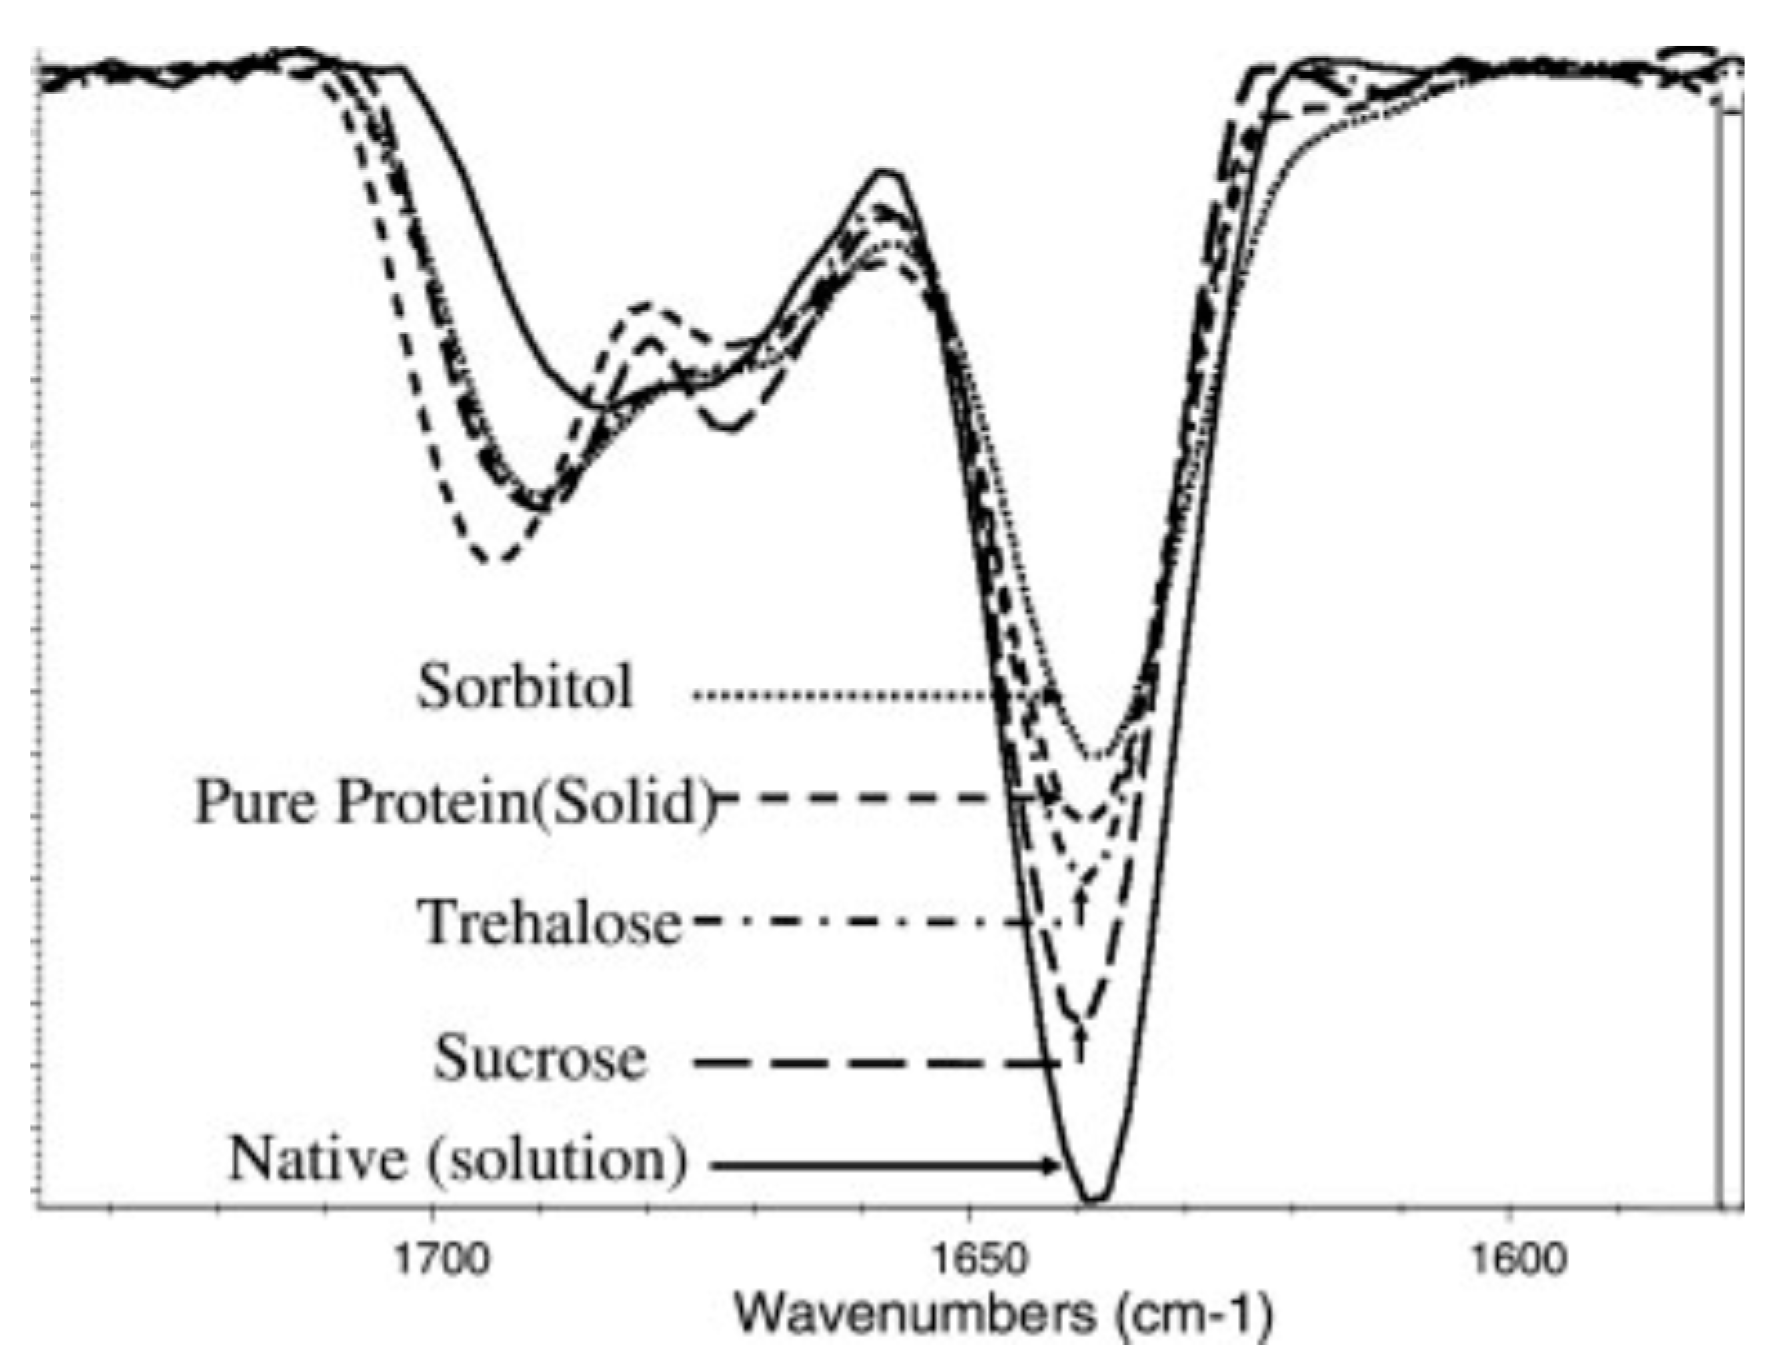
2.1. Fourier-Transform Infrared Spectroscopy (FTIR)

Examination of protein secondary structure in the solid state immediately after lyophilization can be very useful in predicting long-term storage stability. The preservation of native structure in the dried state can be directly correlated with the prevention of aggregation and protection of activity of labile proteins after rehydration [3]. Infrared spectroscopy is one of the fundamental and most widely used analytical techniques for characterizing protein secondary structures, both in solution and in the solid state. Modern infrared spectrometers are usually Fourier transform infrared (FTIR) spectrometers, since the detector signal is Fourier transformed into the measured spectrum. FTIR spectroscopy can be used to monitor the conformational stability of proteins both prior to lyophilization and after reconstitution, as well as in the lyophilized solids. It is a rapid method, but has some limitations due to water (if present in the sample), which can interfere with the FTIR spectra. Moreover, formulations containing various excipients may be too chemically complex for interpretation. Nevertheless, Fourier transform infrared spectroscopy (FTIR) is a very popular method for studying the loss of native structure or the degree of disruption of secondary structure during freeze-drying of proteins.
Multiple vibrational modes in the mid-infrared range are common for proteins because the amide bonds form the backbone of the protein [24]. The vibrational mode most commonly studied for the analysis of the secondary structure of proteins is the amide I region (1650 cm−1) [24,25]. It is directly related to the conformation of the backbone and originates mainly from the C=O stretching vibration with minor contributions from the C–N stretching vibration (Figure 2) [26,27]. In addition, the amide region II (1550 cm−1) can also provide useful information about changes in secondary structure derived mainly from in-plane N–H bending [28,29]. Characteristic frequency shifts can be observed depending on the hydrogen-bonding pattern of the amide bonds. This pattern is closely related to the type and amount of structural elements, such as α-helix, β-sheets, and γ-turns [27]. From this information, the secondary structure can usually be deduced. Even though amide I is the region of choice for protein conformational investigations the band arising from water can interfere with protein bands. For protein samples with higher water content, the water-insensitive region amide III (1300 cm−1) is preferable for secondary structure analysis. Since proteins are composed of several different secondary structure types, infrared spectra usually consist of many overlapping bands originating from the different structure types. These overlapping bands are difficult to resolve and often result in a single broad amide band. Therefore, mathematical manipulations must be applied to obtain useful structural information. The most commonly used method is spectral derivative (second), which narrows the band and improves the resolution of the signal [30]. There is often some band broadening in the FTIR spectra of freeze-dried proteins. On the other hand, there are also shifts in the band position and intensities of the amide I spectral components due to the physical environmental changes. The shifts can be very significant [7,31]. The formation of protein aggregates, which may be associated with the formation of strongly hydrogen-bonded, antiparallel intermolecular β-sheet structures [32], is closely associated with evidence of the formation of bands around 1620–1625 cm−1 and around 1680–1700 cm−1 [3,31].
Several studies have been published on structural changes in lyophilized protein formulations using FTIR spectroscopy. Xu et al. predicted protein degradation rates in glassy solid matrices [33], several studies have been published on structural changes in lyophilized protein formulations using FTIR spectroscopy. Xu et al. predicted protein degradation rates in glassy solid matrices [34]. In addition, interpretation of Gaussian deconvolution of amide bands provided insights into estimating the content of secondary structure elements (α-helix and β-sheets) [35]. FTIR was also used to study the effects of mannitol content, for example in the spray-dried antibody formulations [36]. It was used to monitor the effects of sucrose and sorbitol in lyophilizates [37], and for a comparison between different sucrose contents (Figure 3) in selected antibody solids (freeze-dried, foam-dried and spray-dried) [38]. Prestrelski et al. also studied the preservation of native protein structure by disaccharides in the solid state. The infrared spectra of proteins in the pre-lyophilized, lyophilized, and rehydrated states were similar in the presence of disaccharides, except for some formulations containing mannitol [4]. In general, increasing the carbohydrate content in lyophilized formulations resulted in higher intensity of FTIR bands [34]. Samples for FTIR analysis are usually prepared as pellets containing KBr (approximately 5% of the protein), which may have some disadvantages. One of them is aggregation, which can occur during sample separation preparation. Therefore, attenuated total reflectance (ATR) mode has recently emerged as a prominent alternative that is being used more and more frequently [39].
Although infrared spectroscopy is a very useful analytical tool for characterizing freeze-dried proteins (Figure 4), it also has some disadvantages, such as low resolution, semi-quantitative measurement, and poor ability to predict degradation in the solid state. In addition, FTIR can only measure global protein conformations and is unable to monitor local changes that may affect stability. Aggregation, which can occur due to tertiary structural changes, also cannot be detected by infrared spectroscopy, demonstrating the need for a method with better resolution that can measure other than just global secondary structural properties [37,40,41,42,43].

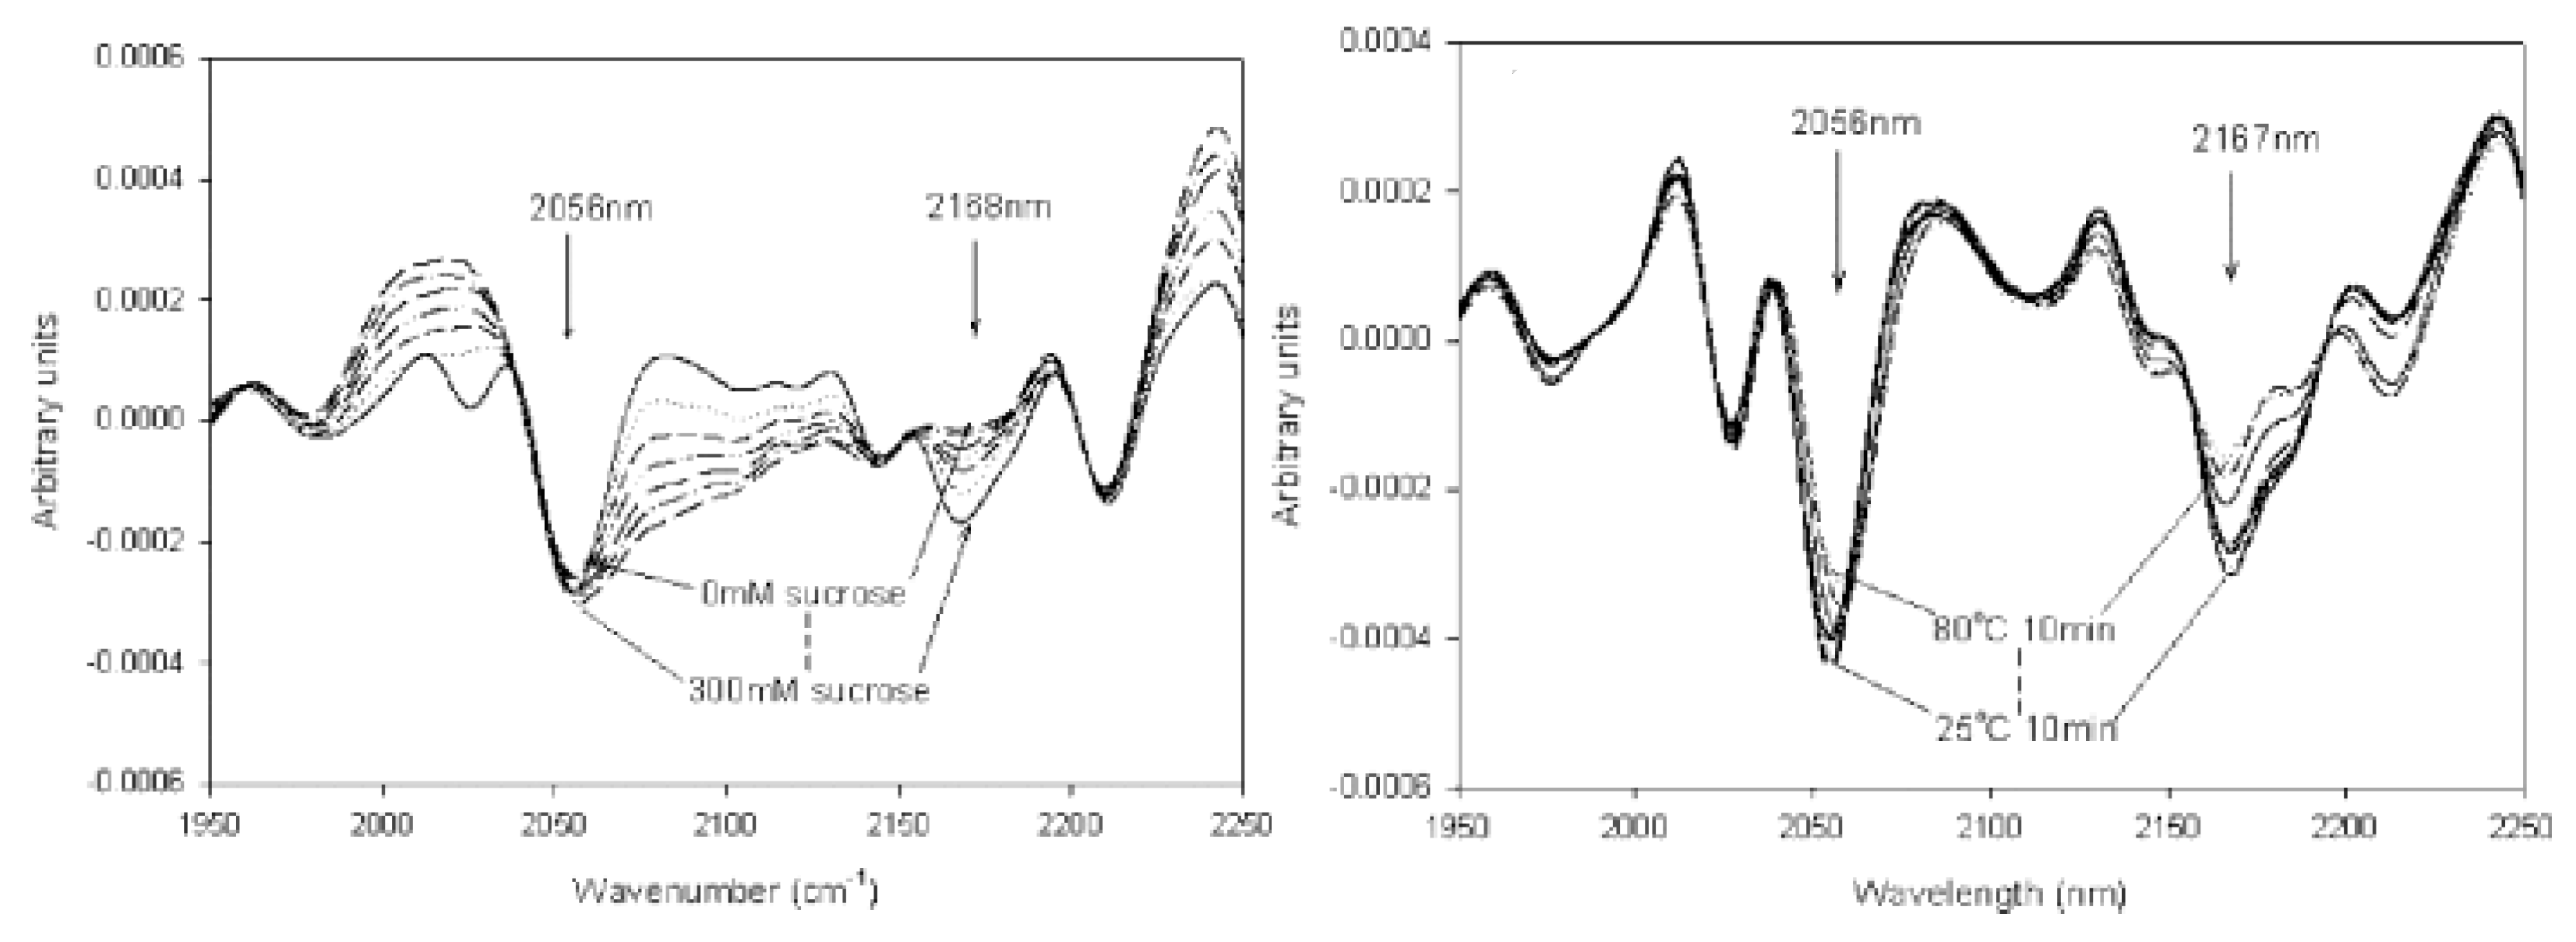
2.2. Near-Infrared Spectroscopy (NIR)

Although Fourier transform infrared spectroscopy (FTIR) is the method of choice, near-infrared spectroscopy (NIR) is increasingly used as an analytical tool to study the secondary structure of proteins. It is one of the most valuable non-destructive and non-invasive analytical methods that has found extensive application in the study of pharmaceutical secondary structures [44,45,46,47]. As a non-destructive method, NIR is of particular interest for the study of lyophilized amorphous solid formulations that are prone to moisture absorption [48]. NIR also has several advantages over FTIR and Raman spectroscopy for characterizing protein structure in solids. Unlike FTIR, the instrument does not need to be purged with nitrogen gas, as moisture content tends to show weak interference in NIR spectra. In addition, the experiment time to acquire an NIR spectrum of the analyzed sample is usually no more than 2 min per sample which is quicker than FTIR and much more quicker than Raman [46,49]. Furthermore, there is no sample preparation and no hazardous chemicals are used. In contrast to Raman, samples are preserved during NIR measurements and can be recovered after the analysis (Raman uses laser light that usually damages proteins in samples). While FTIR analyzes require extensive data manipulation to obtain relevant information about protein structure, this is not the case with NIR analyzes [44]. The low absorptivity of water in the NIR range allows for much longer optical path lengths compared to infrared spectroscopy (from 0.5 mm up to 10 mm) [50]. It also allows measurement in reflectance mode, so spectra can be collected directly from the lyophilization vial. NIR can also be used to obtain information on the crystallinity of samples, as well as to determine the residual moisture content in lyophilizates when studying their effect on stability [44,49,51]. As a method, NIR has several advantages over Karl Fischer moisture determination. One of them is undoubtedly that it is a non-destructive analytical tool. Therefore, the same sample can be subjected to a different method for stability studies, thus providing a direct correlation between residual moisture and stability [52,53,54].
Bai et al. investigated the secondary structure of proteins in lyophilized formulations using nondestructive NIR spectroscopy (Figure 5) [51]. In general, different protein secondary structures yield different NIR spectra [55]. Using band narrowing techniques, such as second derivative, we can gain some insight into the correlation between protein absorption bands and different secondary structure elements [56]. For example, the amount of intramolecular hydrogen bonding can predict the conformational stability of a protein in the solid state. A properly folded protein will have many more intramolecular hydrogen bonds, as reflected by a decrease in amide II band frequency [57,58].
In the spectra of lyophilized proteins, bands near 4369 and 4604 cm−1 can be associated with an α-helical structure, while β-fold structures are associated with bands at 4323, 4417, and 4525–4535 cm−1 [47,56]. It has also been documented that loss of α-helix structure due to exposure to higher temperatures can lead to an increase in β-sheet structure [3,47,56]. NIR has also been shown to be useful for monitoring protein conformation and stability throughout the entire lyophilization process, i.e., from solution to final solid drug product [59,60]. Near-infrared spectroscopy can be a promising alternative to infrared spectroscopy in the biopharmaceutical industry in the development of lyophilized protein pharmaceuticals. It has several advantages over FTIR and Raman spectroscopy, the most important of which are collection of spectra in less than a minute, no sample preparation, and no opening of vials. On the other hand, this method needs further research to be used as a routine method for in-line monitoring of protein secondary structure during lyophilization process.

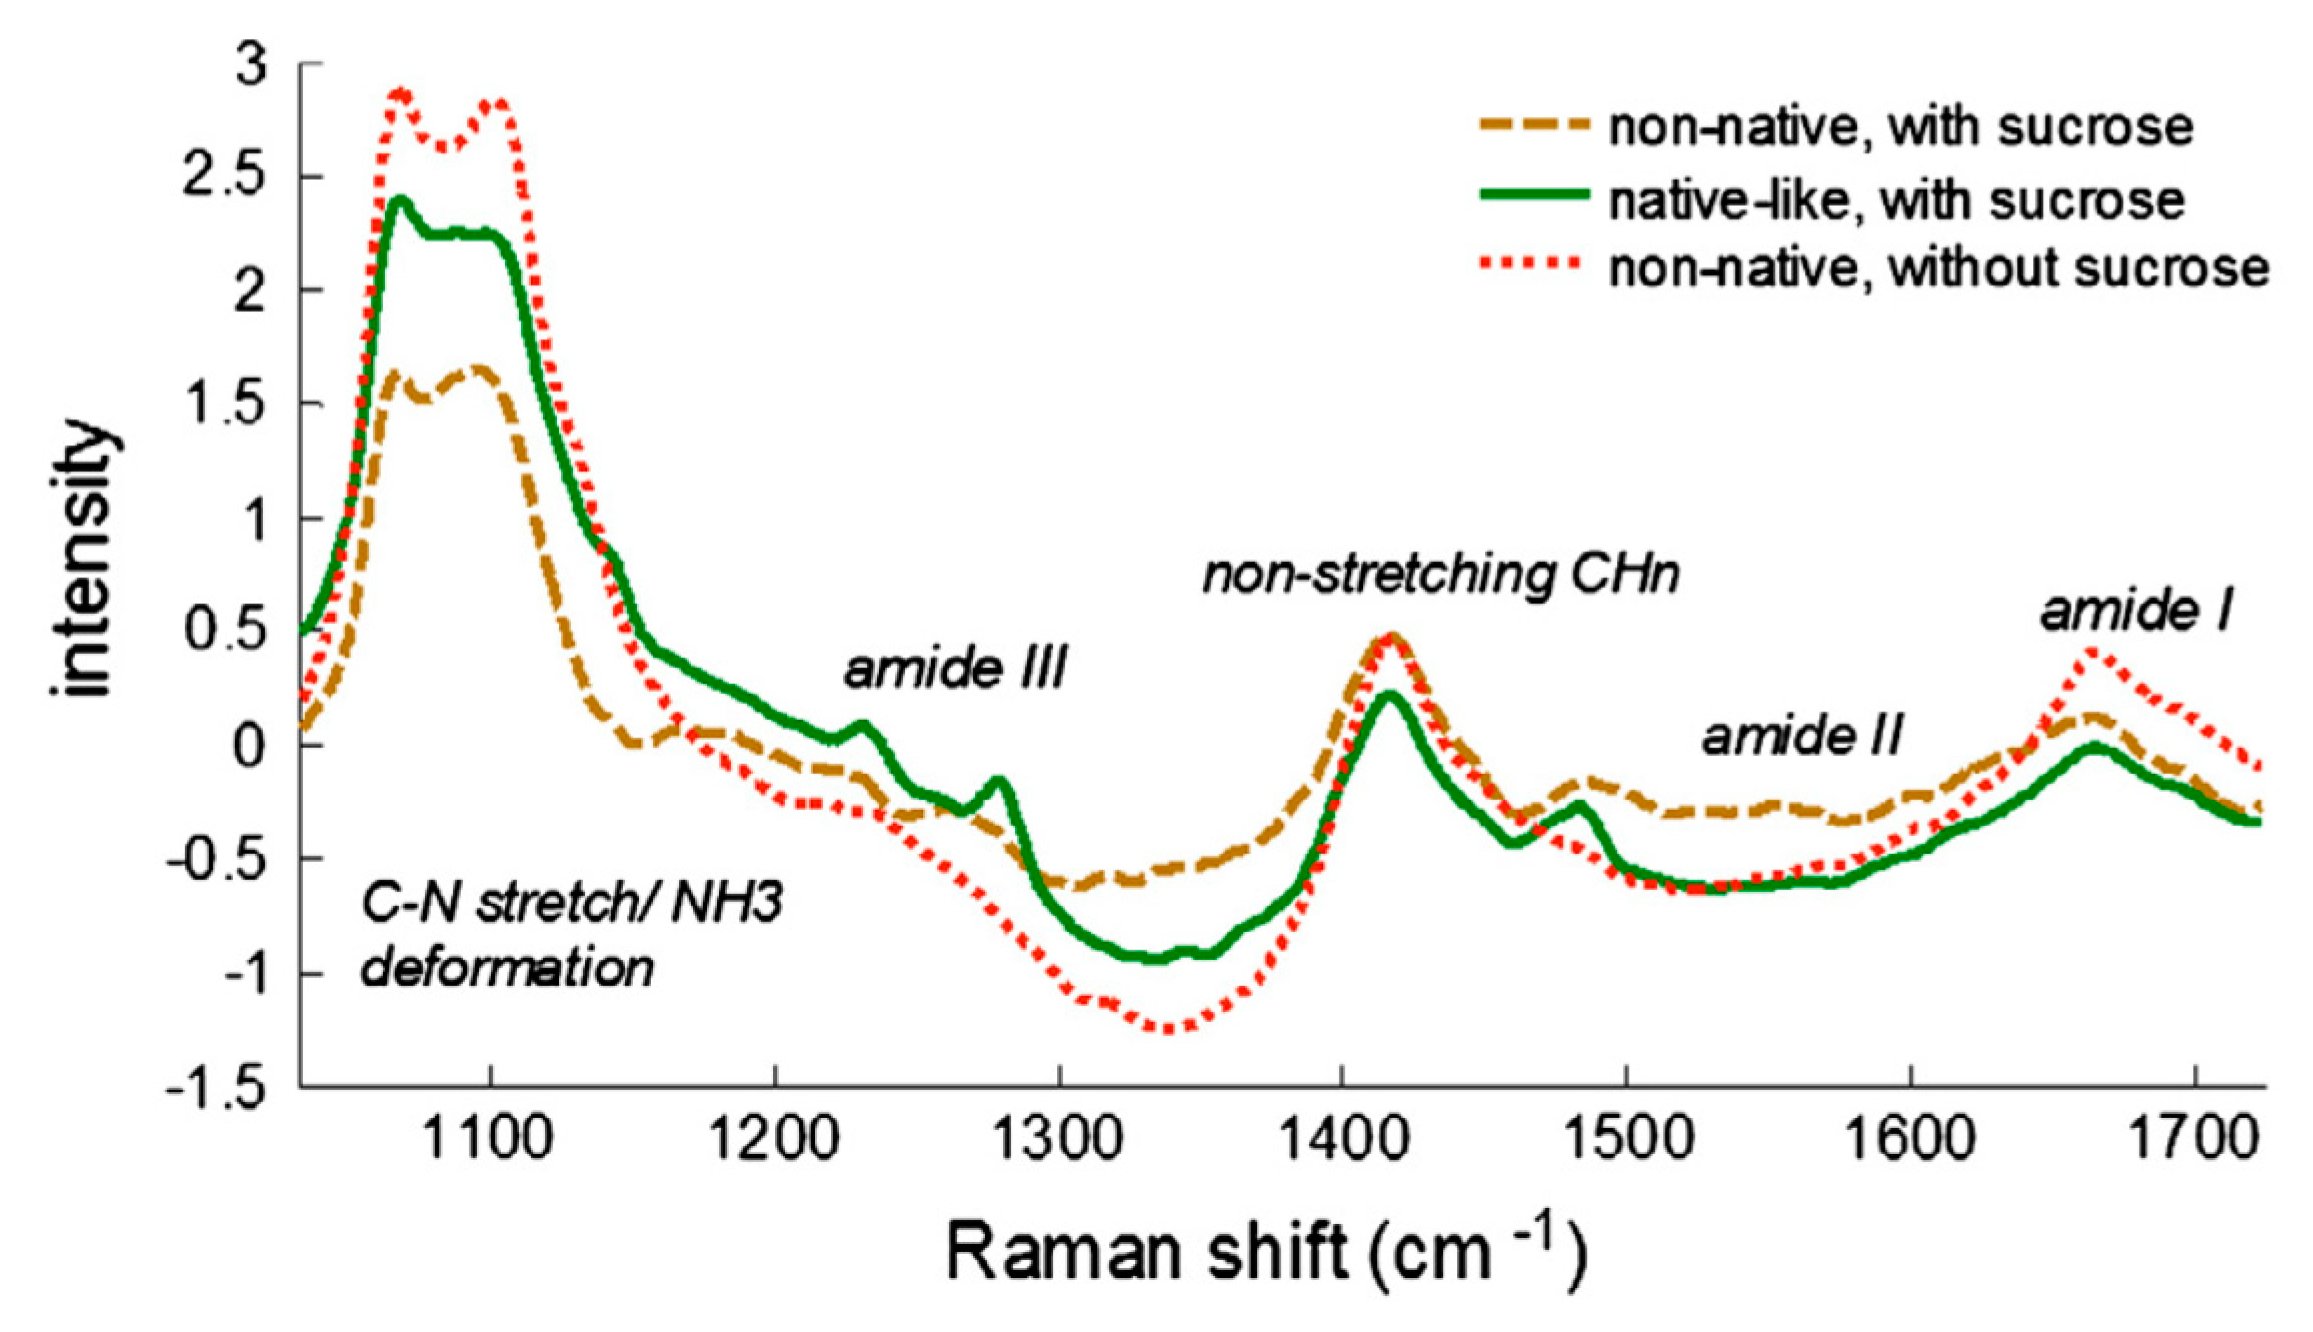
2.3. Raman Spectroscopy

Raman spectroscopy often complements infrared analysis because it provides information about molecular vibrations and is useful for studying different states of aggregation of biopharmaceutical samples. Similar to infrared spectroscopy, Raman spectroscopy provides sample signature spectra in the fingerprint range. There is also no sample preparation, making it a relatively simple technique compared to some other spectroscopies. Unlike infrared spectroscopy, Raman spectroscopy is based on inelastic scattering. The Raman Effect occurs when a beam of intense radiation, typically from a laser (green, red, etc.), passes through a sample. The protein molecules experience a change in molecular polarizability as they vibrate. The change in polarizability yields information about the peptide backbones and secondary structures of the proteins. Two major advantages of Raman spectroscopy compared to FTIR are the weak scattering and reduced noise due to water. Consequently, in addition to the solid state, proteins can also be studied in their native (aqueous) state [61,62,63]. Typical regions in Raman spectra associated with the components of the secondary structure are the amide I region for the α-helix structure (1600–1700 cm−1), the amide III region (1230 to 1340 cm−1) and C–C stretching bands (890–1060 cm−1) of the protein backbone (Table 1) [64]. The amounts of secondary structure present in the solid protein sample, as measured by Raman spectroscopy in the amide I region, have shown a good correlation with the storage stability of the lyophilizates. However, Raman spectroscopy has also been shown to be a useful tool for screening excipients in formulation design [27,65,66]. Better structure retention has been observed for protein formulations with higher amounts of carbohydrate excipients, such as disaccharides (Figure 6). The significant change in the 1100 cm−1 can be attributed to direct correlation of this region with protein unfolding.
Using Raman spectroscopy, Hedoux et al. investigated structural changes caused by lyophilization, and they observed minor changes in terms of protein structure during freezing and rehydration [67]. It was also shown that the spectral changes were mainly caused by vacuum-induced dehydration. Formulations with mannitol as excipient were studied by in-line Raman spectroscopy [68]. The aggregation processes of various proteins were also determined by Raman spectroscopy [69,70,71].
Nevertheless, there are also some limitations to the analysis of the secondary structure of proteins by Raman spectroscopy. The laser light can heat the samples locally and damage them. Therefore, the measurements must be performed relatively quickly [66]. Fluorescence noise originating from the sample or impurities can also interfere with the Raman signals.

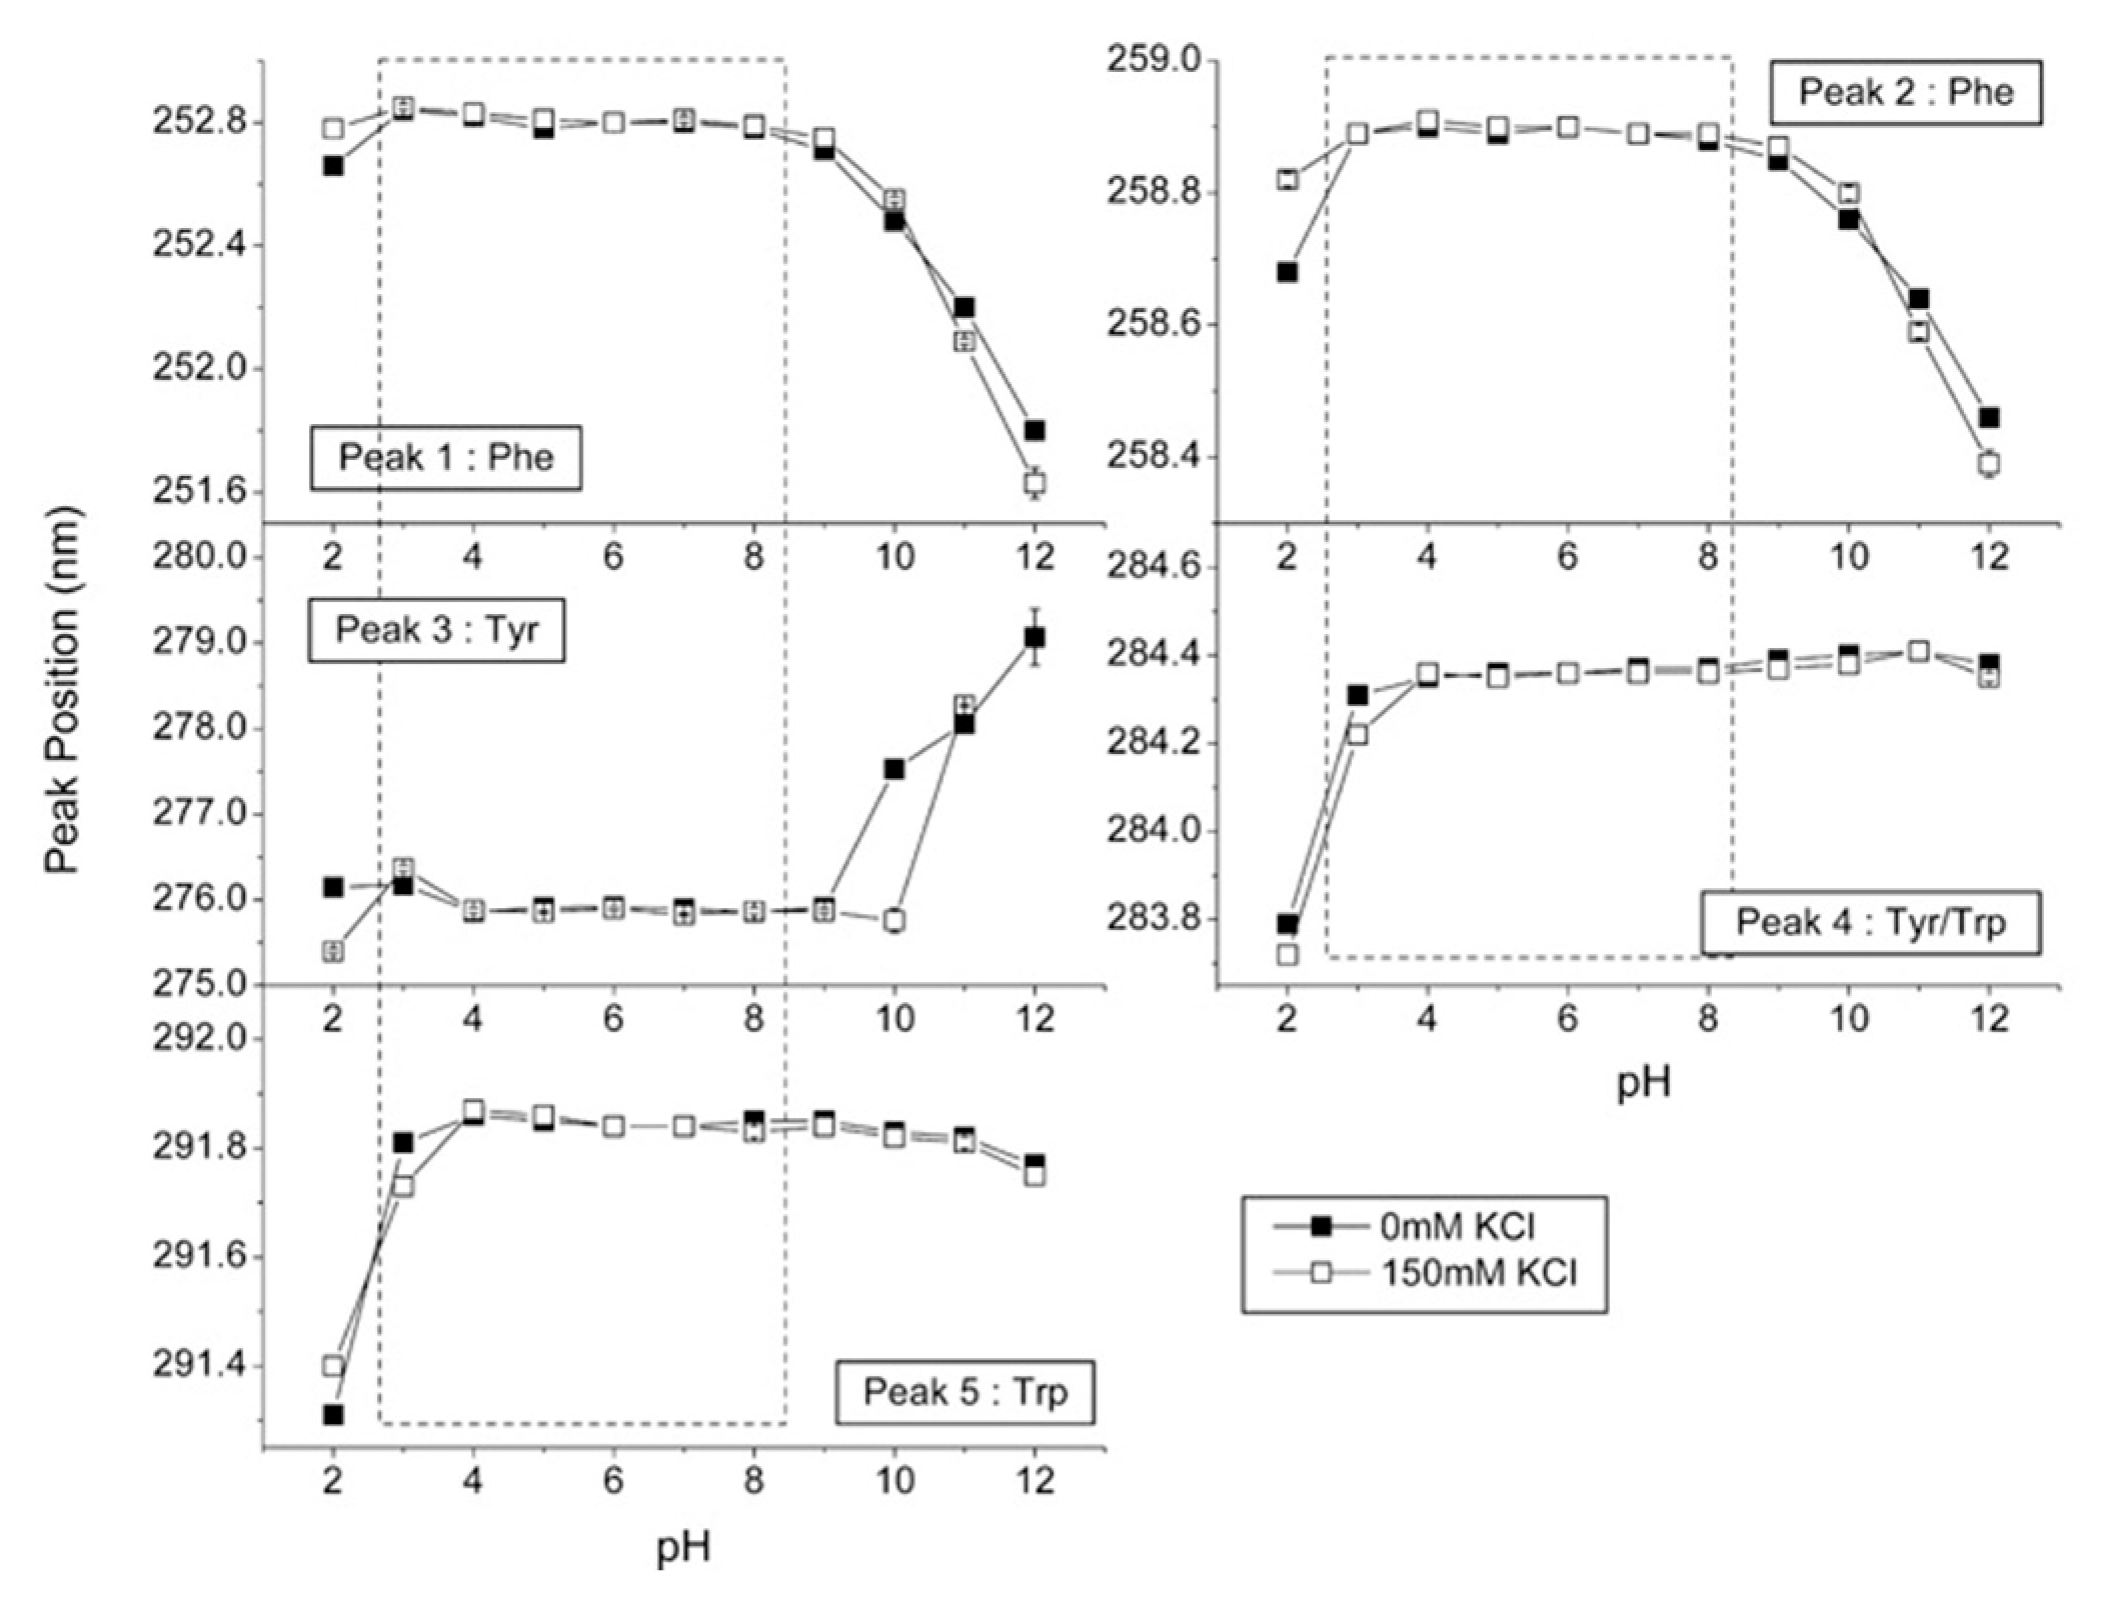
2.4. Solid-State UV–Vis Spectroscopy

UV–Vis spectroscopy allows to study the tertiary structure of proteins and to follow their changes. By using the second derivative of UV spectroscopy, the aromatic residues and their surroundings in proteins can be studied. The main peak of proteins between 240 and 300 nm consists of several spectra that overlap in a final broad peak in the zero-order spectra. These spectra are mainly formed by the absorption of the residues phenylalanine (245–270 nm), tyrosine (265–285 nm), and tryptophan (265–295 nm) [72,73]. Due to the overlap of absorption peaks, UV–Vis spectroscopy has often been limited in the characterization of proteins. By using second derivative analysis as a resolution enhancement technique (as was already done with FTIR), many individual peaks can be derived from the raw spectra with multiple components (Figure 7) [74,75].
The position of the peaks in the second derivative spectra correlates well with the polarity of the microenvironment of the aromatic amino acids and, thus, conformational changes within the protein [76,77]. Therefore, UV–Vis spectroscopy with second derivative processing can be very useful for characterizing the tertiary structure of proteins. Shifts to shorter wavelengths usually indicate increased polarity of the aromatic amino acid microenvironment [78]. On the other hand, the intensity of the peaks can also provide useful structural information. Derivative intensities can be used to calculate amino acid content [72,79], and the so-called a/b ratio is used to evaluate the exposure of tyrosine to bulk solvent [76]. In recent years, the sensitivity of UV–Vis spectroscopy has also greatly increased and now second-derivative negative peaks can be measured with a resolution of up to 0.01 nm, providing a very sensitive tool to study protein conformational changes [78,80,81]. Second derivative UV–Vis spectra can also provide us with information about the perturbations of the tertiary structure of proteins as a function of various conditions, such as pH (Figure 8), temperature, ionic strength, and other factors [81,82,83]. Temperature dependence of second-derivative peak positions has been widely used as a tool to study the thermal unfolding of proteins. Shifts to lower wavelengths at elevated temperature usually indicate increased exposure of the aromatic side chains to the solvent. Another example is the study of aggregation behavior as a function of pH and temperature [84].

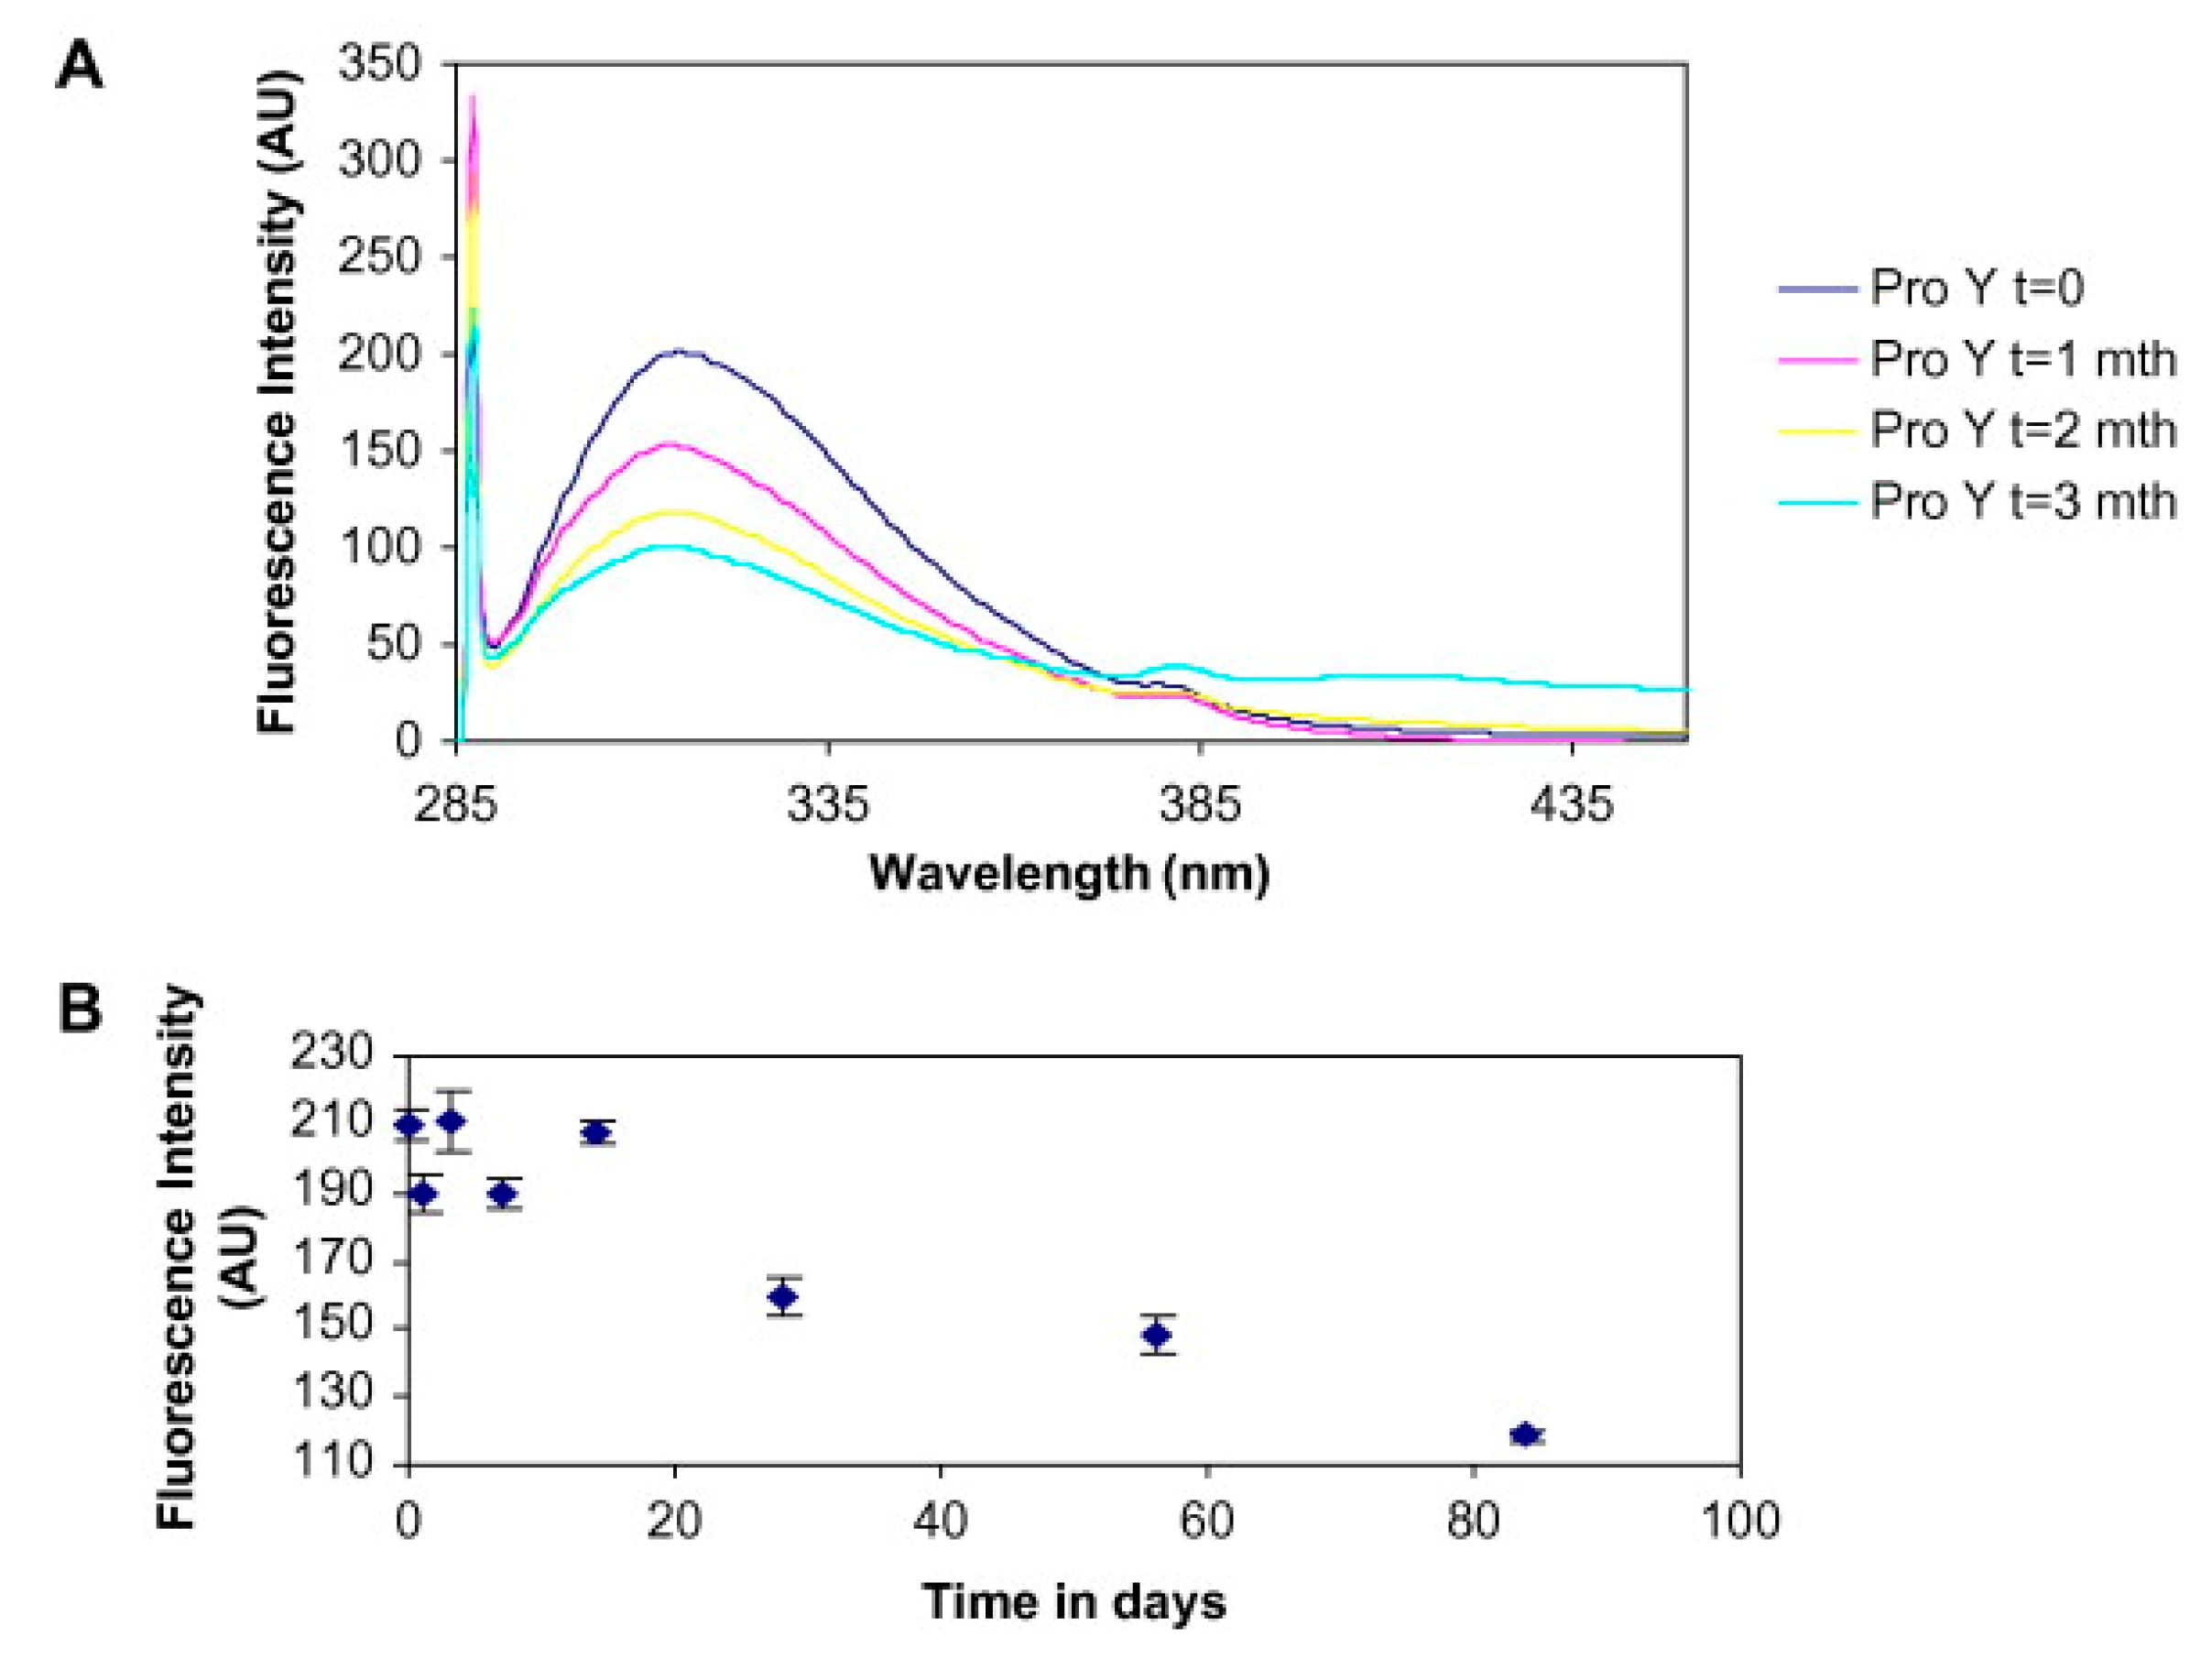
2.5. Solid-State Fluorescence Spectroscopy

Despite the fact that altered secondary structure in proteins directly implies loss of tertiary structure, preserved secondary structure does not confirm retention of tertiary structure. Therefore, it is crucial to systematically study the tertiary structure of proteins as well. Recent literature has shown that solid-state fluorescence spectroscopy can be a useful tool to study the tertiary structure of proteins in solid dosage forms, and that tertiary structure correlates with long-term stability [85,86,87,88,89].
In solid-state fluorescence, the molecules of proteins are excited to a wavelength corresponding to their excitation maximum. Light is then emitted during the transition from the excited state back to the ground state. Aromatic amino acids present in proteins provide intrinsic fluorescence signals that can be measured, and they provide useful information about tertiary structure. The most common is tryptophan fluorescence, which is often used to check the integrity of the tertiary structure of proteins [90,91]. Solid-state fluorescence has been used to study the unfolding of proteins in different environments such as pH, temperature, and buffer excipients to provide direct information on the degradation of freeze-dried proteins (Figure 9) [85,89]. In another study, a monoclonal antibody freeze-dried with sucrose as an excipient and stored at a higher temperature showed decreased fluorescence intensity as well as quite large aggregation [86]. Proteins can also be derivatized with fluorescent probes to detect protein aggregates. In this case, the sensitivity of solid-state fluorescence is increased at wavelengths characteristic of the probes [92].
Strong background scattering of lyophilized protein powders with high optical density may prove to limit solid-state fluorescence. This problem can usually be avoided by analyzing samples in front-face mode. Another disadvantage of solid-state fluorescence is its sensitivity, which depends on the position of the aromatic amino acids in the protein tertiary structure. This can be solved by co-lyophilization of proteins with chromophores [93].

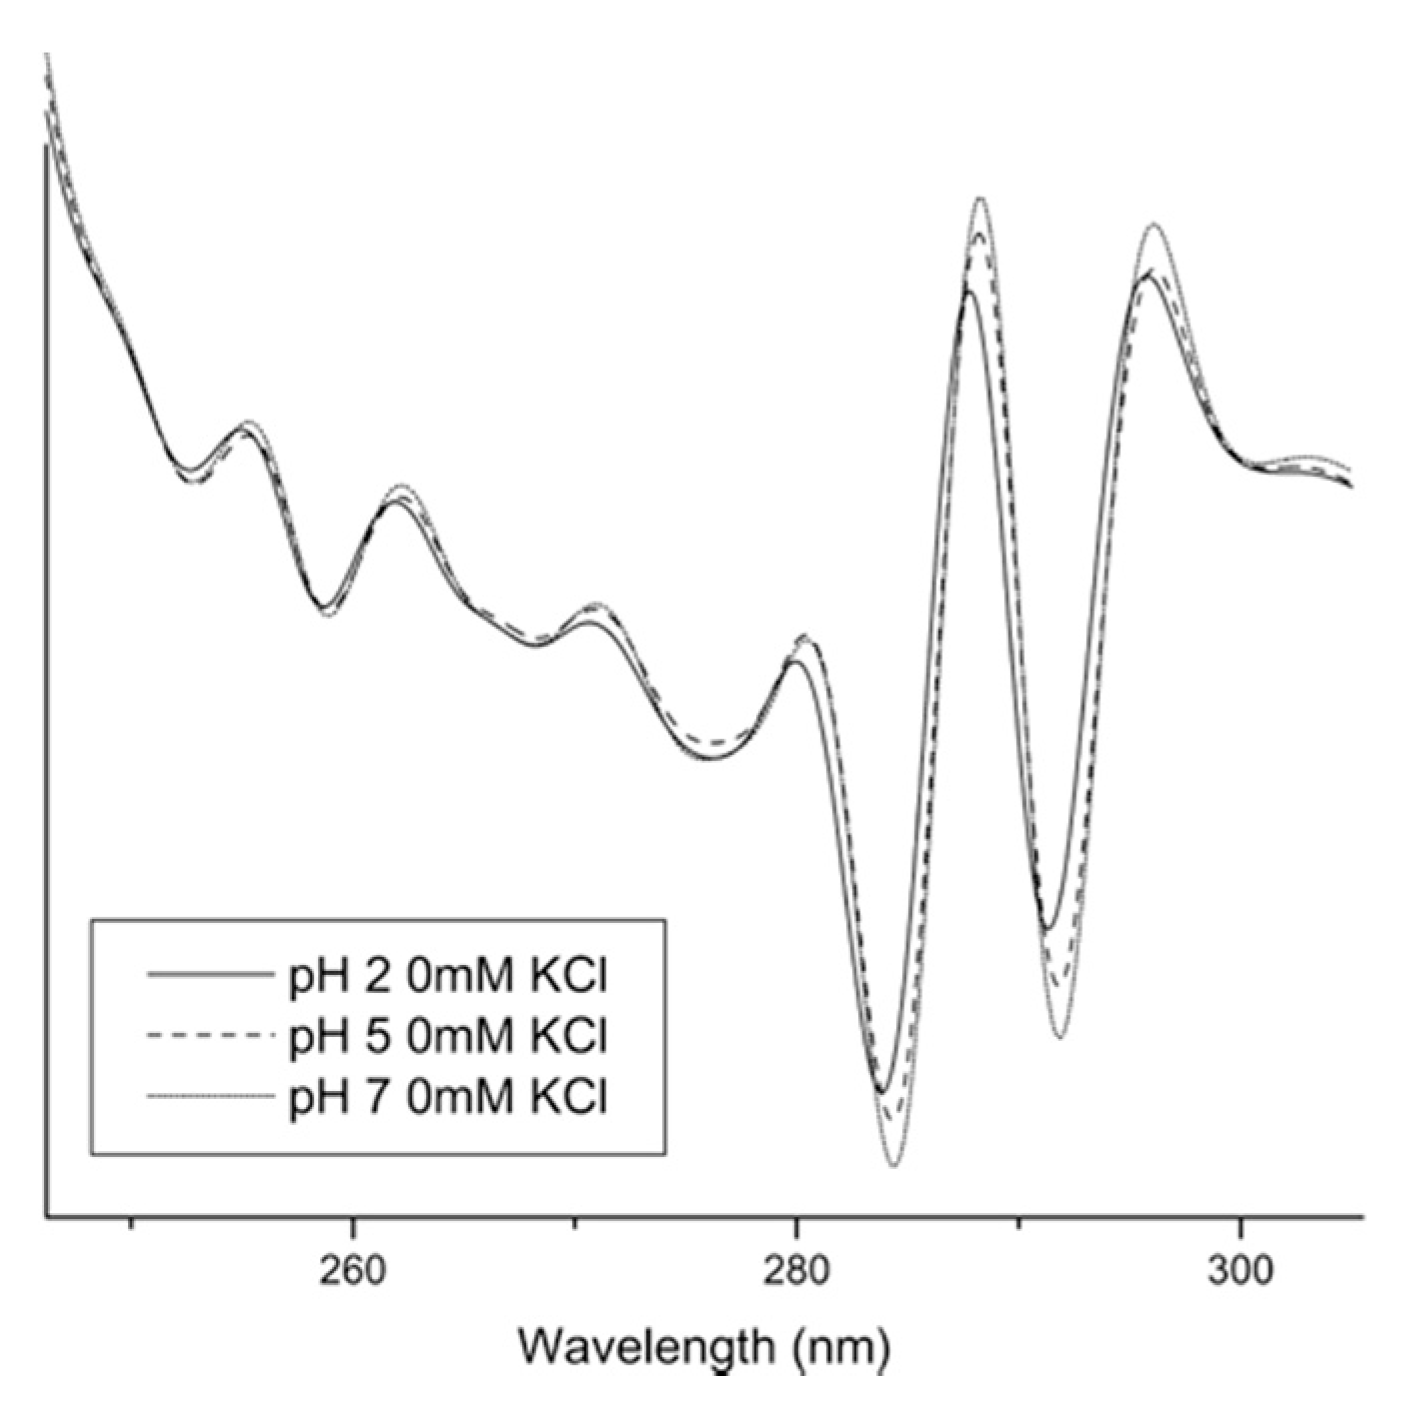
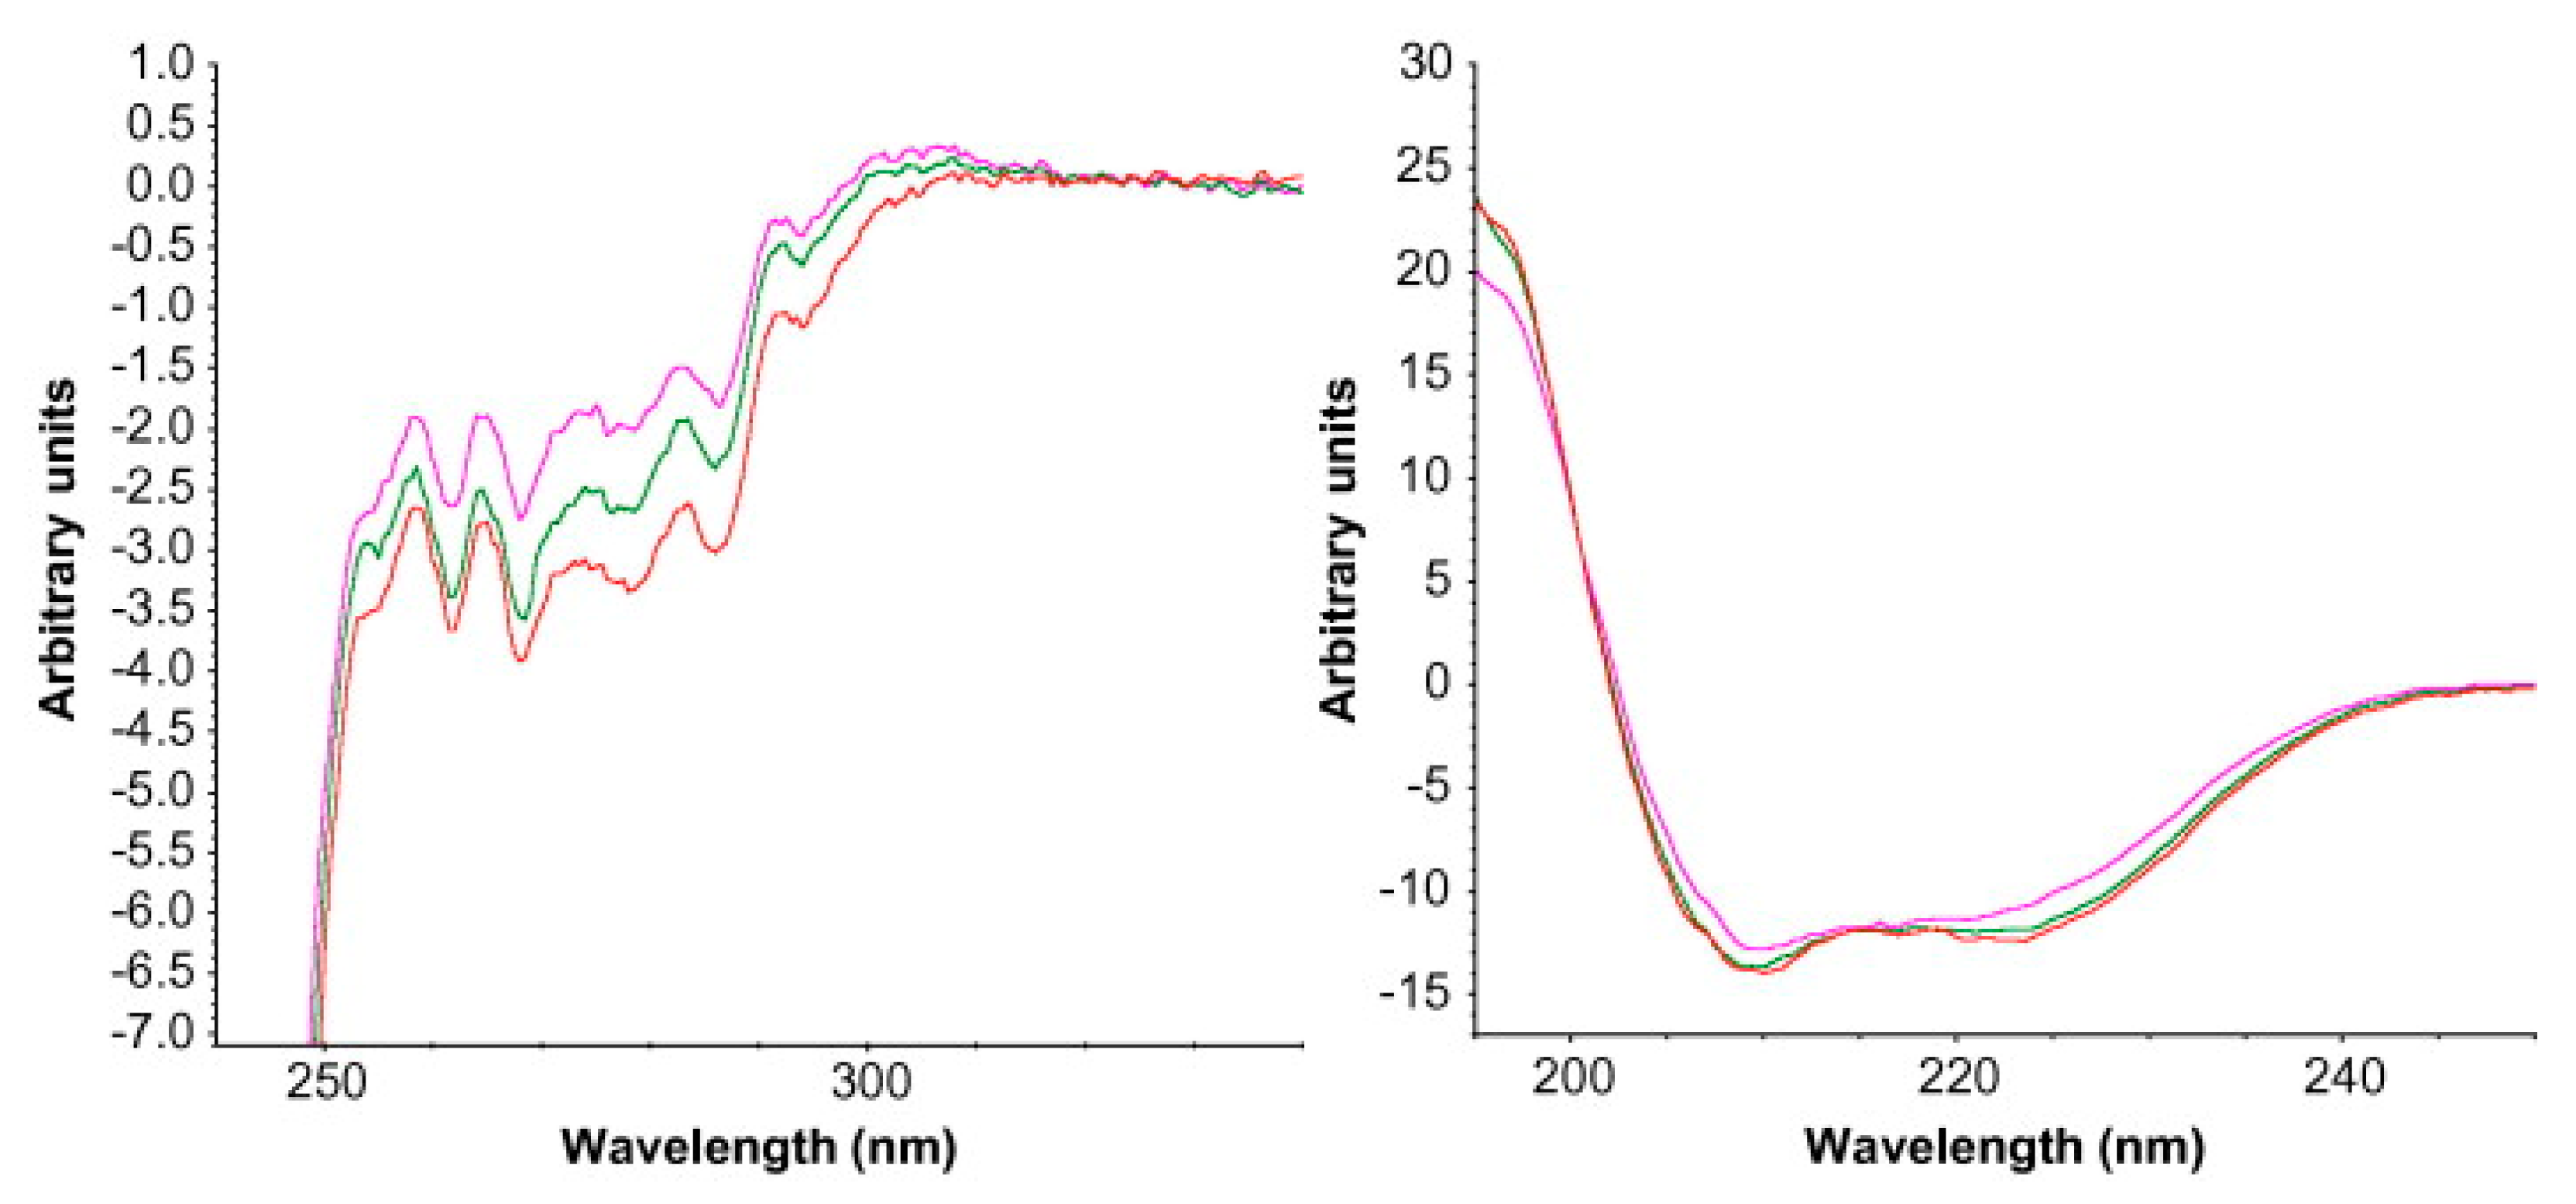
2.6. Circular Dichroism (CD)

Circular dichroism (CD) measures the difference in protein absorbance for left- and right-handed circularly polarized light. The difference in absorbance is due to the interaction of protein chromophores with the chiral environment [94]. Typical applications with CD analysis include estimating the content of protein structures (secondary and tertiary) and detecting conformational changes in a protein due to changes in the environment (pH, excipients, addition of denaturants, and temperature) [83,95,96,97]. CD can measure in both the near-UV CD region (310–255 nm) and far-UV CD region (below 250 nm) of the spectra. Tryptophan, tyrosine, phenylalanine, and cystine contribute to the signals in the near-UV CD spectra. The signals provide direct information about the tertiary structures of the proteins. On the other hand, peptide-amide bonds contribute to the signals in the far-UV CD spectra. These signals reflect the secondary structure of the protein, i.e., α-helixes, β-sheets and γ-turns [98].
Liu et al. investigated the forced oxidation of proteins by hydrogen peroxide. The data obtained clearly indicate disruptions in the tertiary structures. On the other hand, most of the secondary structure was retained [99]. Harn et al. also studied proteins with CD, but as a function of temperature. Increasing the temperature at rather small intervals carried out thermal studies. The changes in the relative content of the β-sheet structure of the protein were observed. It was shown that one antibody had better stabilization than the other at the same protein concentration [100]. CD has also been used as a tool to monitor the aggregation of antibodies to assess the stability of therapeutic proteins during process development, formulation development and product characterization [101]. Similarly, Vermeer and Norde used CD in combination with other techniques, such as DSC, to assess the thermal stability of immunoglobulin, its unfolding and aggregation [102]. Ramachander et al. also used CD as an additional method to solid-state fluorescence spectroscopy to analyze changes in the secondary and tertiary structure of the reconstituted protein (Figure 10) [85].
Circular dichroism experiments are typically measured in solution, i.e., water or buffer with a pH from 2 to 12. In recent years, there has also been the option for measurements in solid-state mode, which could be quite useful for studying lyophilized protein pharmaceuticals [103,104]. Further, there are several interesting works dealing with solid-state CD, such as the study by Kawamura et al. on L- and D-serine in combination with solid-state NMR and density functional theory (DFT) [105]. Moreover, Bak et al. studied the effect of high pressure treatment on soluble proteins [106].

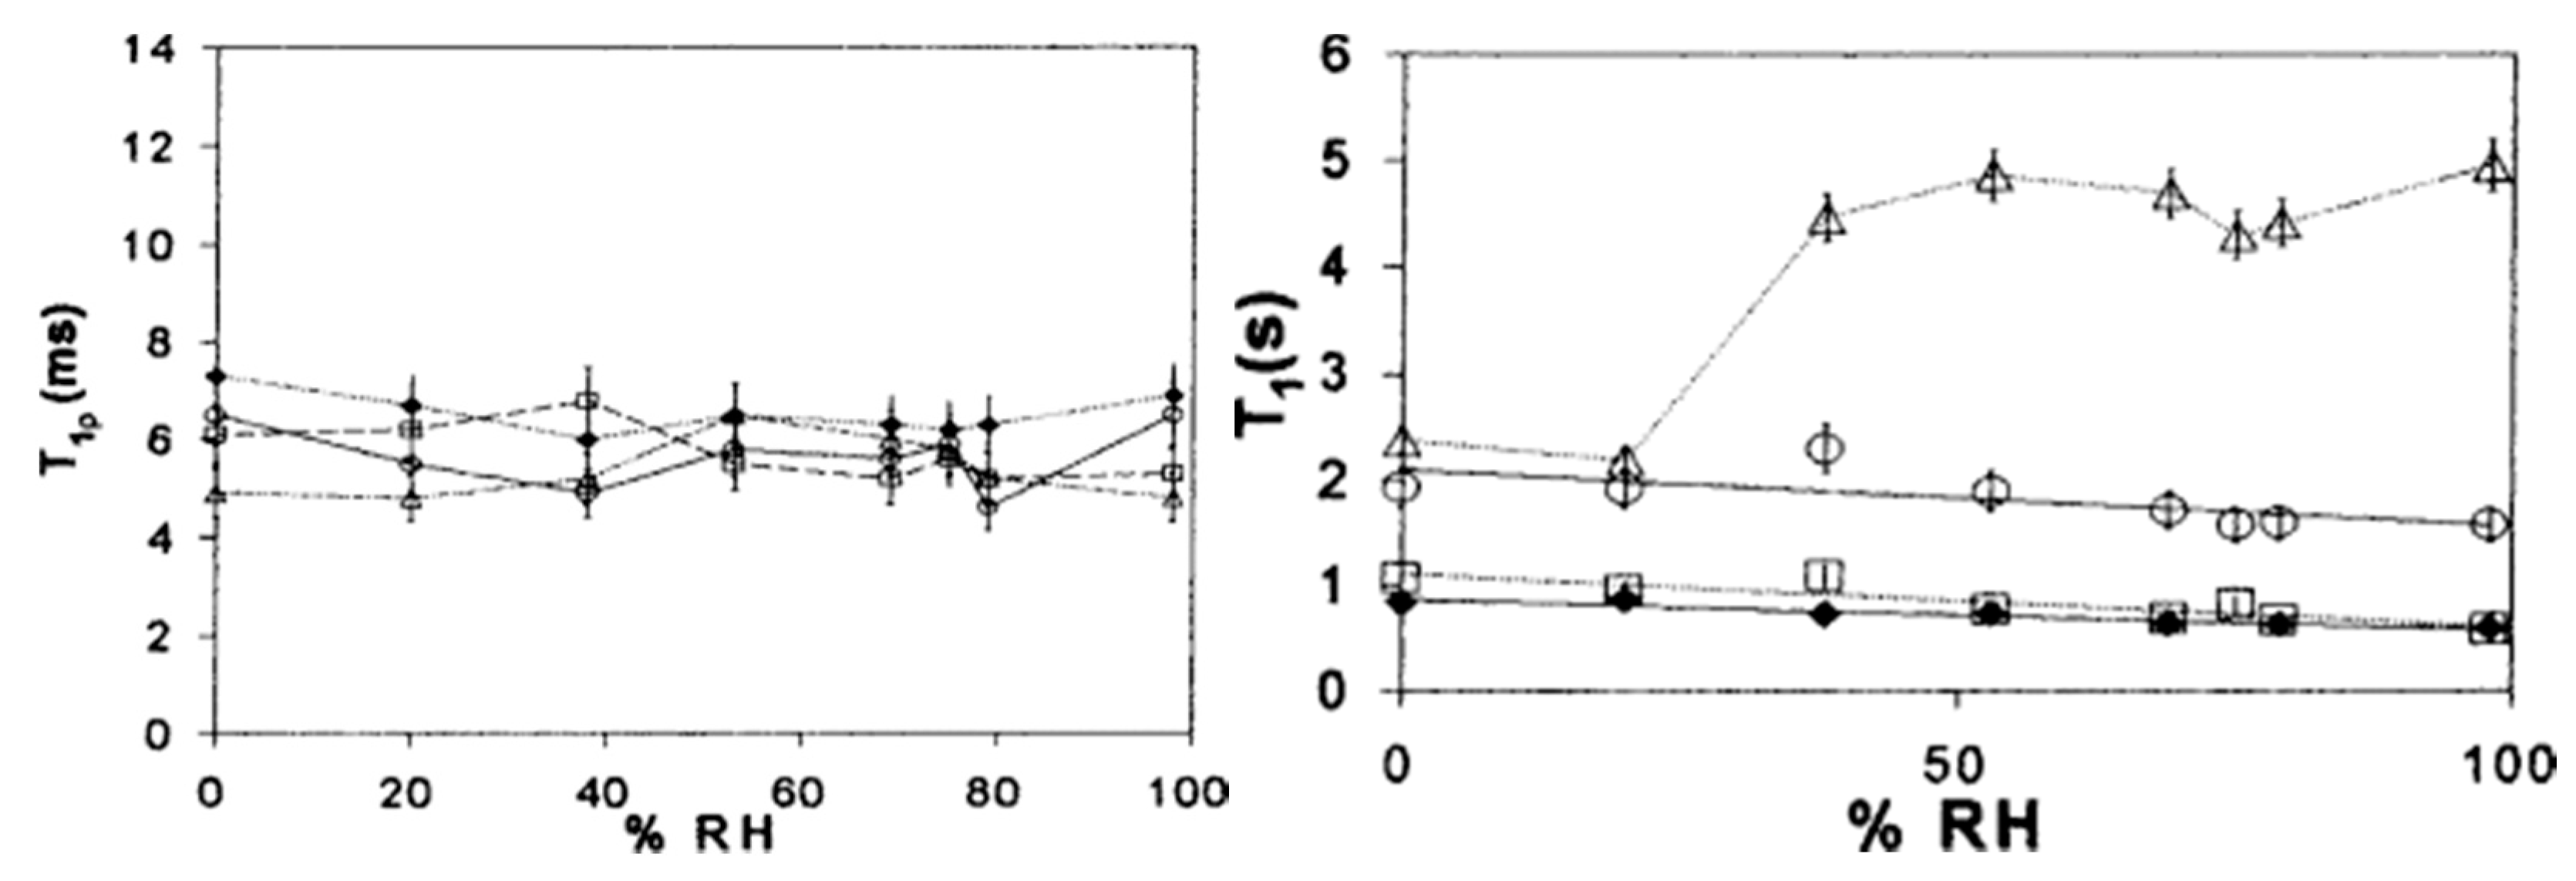
2.7. Solid-State Nuclear Magnetic Resonance Spectroscopy (ssNMR)

Solid-state nuclear magnetic resonance spectroscopy is a powerful method for structural characterization as well as for studying the dynamics of lyophilized protein pharmaceuticals [107,108]. With ssNMR, proteins can be analyzed with atomic-level resolution. However, the random orientations of proteins in solid form limit the use of ssNMR to provide high-resolution structural information. 1H (proton) and 13C (carbon) are the two most commonly used nuclei in NMR spectroscopy. Normally, large magnetic fields are preferred as they offer increased sensitivity.
With ssNMR, relaxation measurements can be performed on dried protein formulations, with very good correlations between relaxation times and pharmaceutical stability in solid formulations, even in the long-term range [109,110,111,112,113,114]. In addition to chemical analysis, ssNMR determines molecular mobilities over a wide range of time scales for β-relaxation: via spin-lattice relaxation times (T1) on a picosecond-nanosecond time scale and spin-lattice relaxation times in a rotating frame (T) on a microsecond-millisecond time scale. Whereas T1p is measured in a rotating frame, the T1 is measured in a laboratory frame [115,116]. ssNMR spectroscopy can also be used to study the interactions between proteins and excipients by measuring the differences in chemical shifts in different formulations. A nice example can be found in the work of Lam et al. in which the stability of lyophilized formulations, containing lactose and trehalose as excipients, was studied (Figure 11) [116]. The addition of sugars reduced the relaxation rates, whereas the presence of moisture increased them. Although changes in T1p may be random and rather small, they usually provide information about the long-term stability of proteins in the solid state, since relaxation times are directly related to the frequencies of molecular motion. In general, lower values for the relaxation times represent greater long-term stability of the measured sample. In addition, Separovic et al. found strong correlations of T1 relaxation times with changes in protein aggregation and activity [117]. Yoshioka’s group also extensively studied the molecular dynamics of proteins using ssNMR spectroscopy. They showed a good correlation of relaxation times with aggregation rates of freeze-dried proteins [118,119,120]. Furthermore, Tian et al. have shown that the stability provided by arginine in freeze-dried antibody products is due to non-covalent interactions between the arginine side chain and the protein [31]. The study of protein relaxation times using ssNMR can also be used to predict storage stability in the solid state, as there is a very good correlation between ssNMR data and long-term storage stability [89].

2.8. Differential Scanning Calorimetry (DSC)

Differential scanning calorimetry (DSC) is one of the most common techniques for characterization of freeze-dried protein drugs [121]. It is commonly used as a complementary method to spectroscopic and chromatographic characterization of proteins in the solid state [122]. The method consists of heating and cooling the sample together with a reference, measuring the difference in the amount of heat required to raise the temperature of the sample and reference. The difference is measured as a function of temperature, maintaining similar temperatures for the sample and reference [123]. DSC is a widely used technique for studying the unfolding of protein secondary structures and for characterizing the conformational stability of proteins under various conditions. DSC can be used in both solid and liquid states. Nano differential scanning calorimetry (nanoDSC) is used to analyze liquid samples of protein formulations. Lyophilized proteins are usually dissolved in buffers with pH around neutral, but water can also be used. From the heat capacity curve, the melting temperature (Tm), as well as the calorimetric enthalpy (ΔHm) and entropy (ΔSm) of the unfolding process can be accessed. For example, nanoDSC has been used to determine the melting temperature of proteins with FTIR spectroscopy [124]. On the other hand, DSC is more commonly used to study solid samples of protein formulations. While the unfolding of proteins produces endothermic peaks, their aggregation is shown to be an exothermic event. Moreover, in the study by Pikal et al. aggregation could be correlated with the loss of secondary structure and a decrease in the area under the denaturation endotherm. This process was reversible with trehalose as an excipient in the formulations [122]. By comparing the melting temperatures (Tm) of different protein lyophilizates, insights can be gained into their different secondary structures. DSC can also be used to optimize lyophilization parameters, ultimately resulting in a better appearance of the lyophilized protein cake. For example, Han et al. investigated the effect of sucrose and mannitol. It was found that the addition of sucrose to the formulations resulted in an upward shift in melting points, thus providing protection, while the addition of mannitol did not show the same benefit [125]. Ihnat et al. also investigated the effects of various excipients on the thermal stability of lyophilized protein samples [126].
Interestingly, protein stability does not always correlate well with glass transition temperature (Tg) values [127]. On the other hand, formulations stored above their Tg are generally less stable than those stored below. While storage below the Tg is necessary, it is not always sufficient to ensure stability. Therefore, when evaluating protein stability in lyophilized formulations, DSC characterization should be accompanied by other analytical methods [6,128,129]. In addition, modulated DSC (mDSC) can resolve total heat flow into thermodynamic (reversal) heat flow and kinetic (non-reversal) heat flow. For example, the enthalpy relaxation endotherm (kinetic) can be separated from the glass transition event (thermodynamic) [130]. Therefore, mDSC is particularly useful for detecting Tg present with other overlapping thermal events (glass transition) [131]. Therefore, mDSC is particularly useful for detecting Tg present with other overlapping thermal events (glass transition) [132], to correlate eutectic temperature (lowest possible melting temperature over all of the mixing ratios for the involved component species) events leading to cake collapse [133] and to study the effects of annealing on the thermal properties of frozen sucrose solutions [134,135,136]. It was also used as an additional method to ssHDX-MS for the analysis of the conformation of lyophilized IgG1 (Table 2) [137].

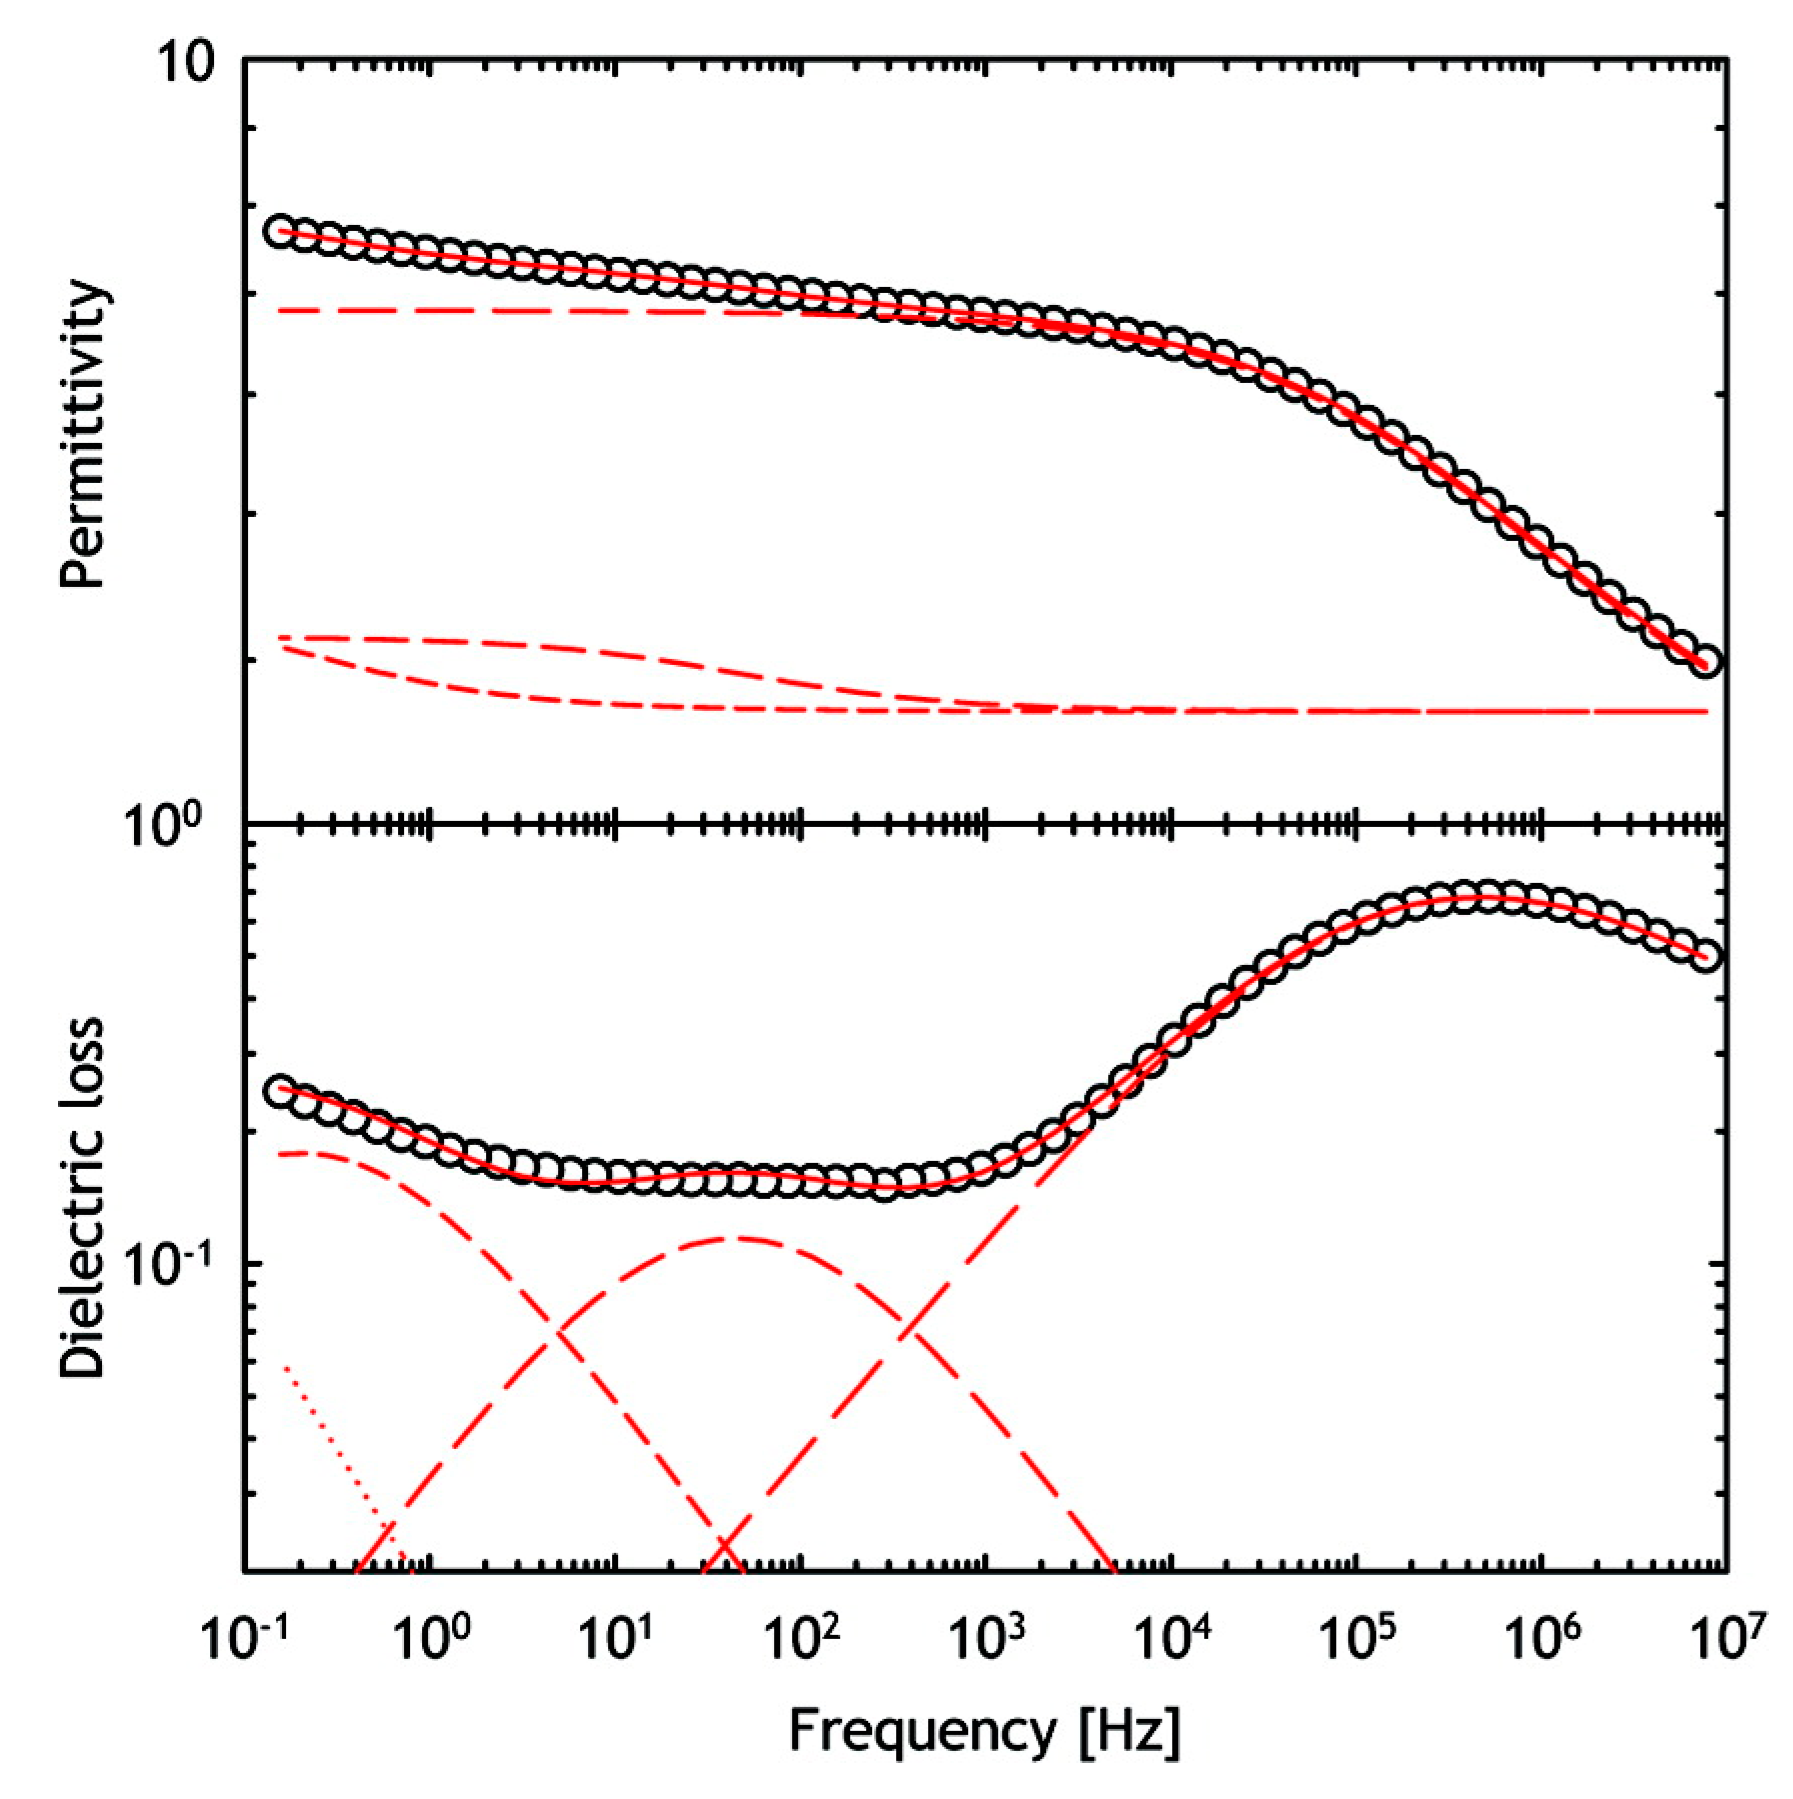
2.9. Dielectric Relaxation Spectroscopy (DRS)

Dielectric relaxation spectroscopy (DRS) is a thermoelectric technique for studying changes in the conformational dynamics of proteins. It is a useful analytical tool that can complement calorimetry. It is a non-invasive method that characterizes protein motions over a frequency range from 10–5 to 1011 Hz. DRS determines the time dependence and extent of electrical polarization processes by measuring the speed and extent of polarizability of a material placed in a weak and sinusoidal oscillating electric field [138,139,140]. The wide frequency range allows the study of slow and hindered macromolecular oscillations, restricted charge transfer processes, as well as relatively fast reorientations of small molecules or side-chain groups. Thus, the method can distinguish relatively well between groups involved in global and local dynamics. This is very important because protein dynamics involves many different types of motion, both local and more global, including transitions between multiple conformational substates. More specifically, DRS reflects the mobility of molecular dipoles and is able to directly capture the time scale of molecular motions. High-frequency studies, for example, refer to specific dipole reorientation polarizations, and are directly linked to the microscopic structure of the solid sample. Thus, the dipoles act as molecular probes that can provide information about the structural properties of the sample. In addition, DRS can provide information on protein structure, primary and secondary molecular motions (dynamics), water content, and its state (bound or free). The dielectric analysis of water in pharmaceutical systems is typically done in the high-frequency region. [134,141,142].
Different lyophilized protein formulations with variable amounts amount of sugar and protein drug were analyzed by E. Mozine et al. using DRS. Significant differences in dielectric relaxation times and activation energies were observed [134,138,139]. In addition, DRS can also be used to study the correlation between temperature and relaxation kinetics. Thus, the dielectric measurements of samples are performed over a range of temperatures. Furthermore, the molecular mobility of freeze-dried protein pharmaceuticals under the Tg was measured in relation to stability during storage. In general, a longer relaxation time for sucrose and trehalose formulations was associated with better stability [22]. In addition, studies of the hydration effect on protein dynamics in the lyophilizates were performed using DRS analysis (Figure 12) [140,143]. Nevertheless, the correct assignment of the DRS spectra of the hydrated solid-state pharmaceuticals can be challenging because the relaxation kinetics of water and protein drug can overlap. Therefore, the moisture present in the samples generally poses a problem and additional studies may be required to use DRS as an analytical tool in the development of drug formulations.

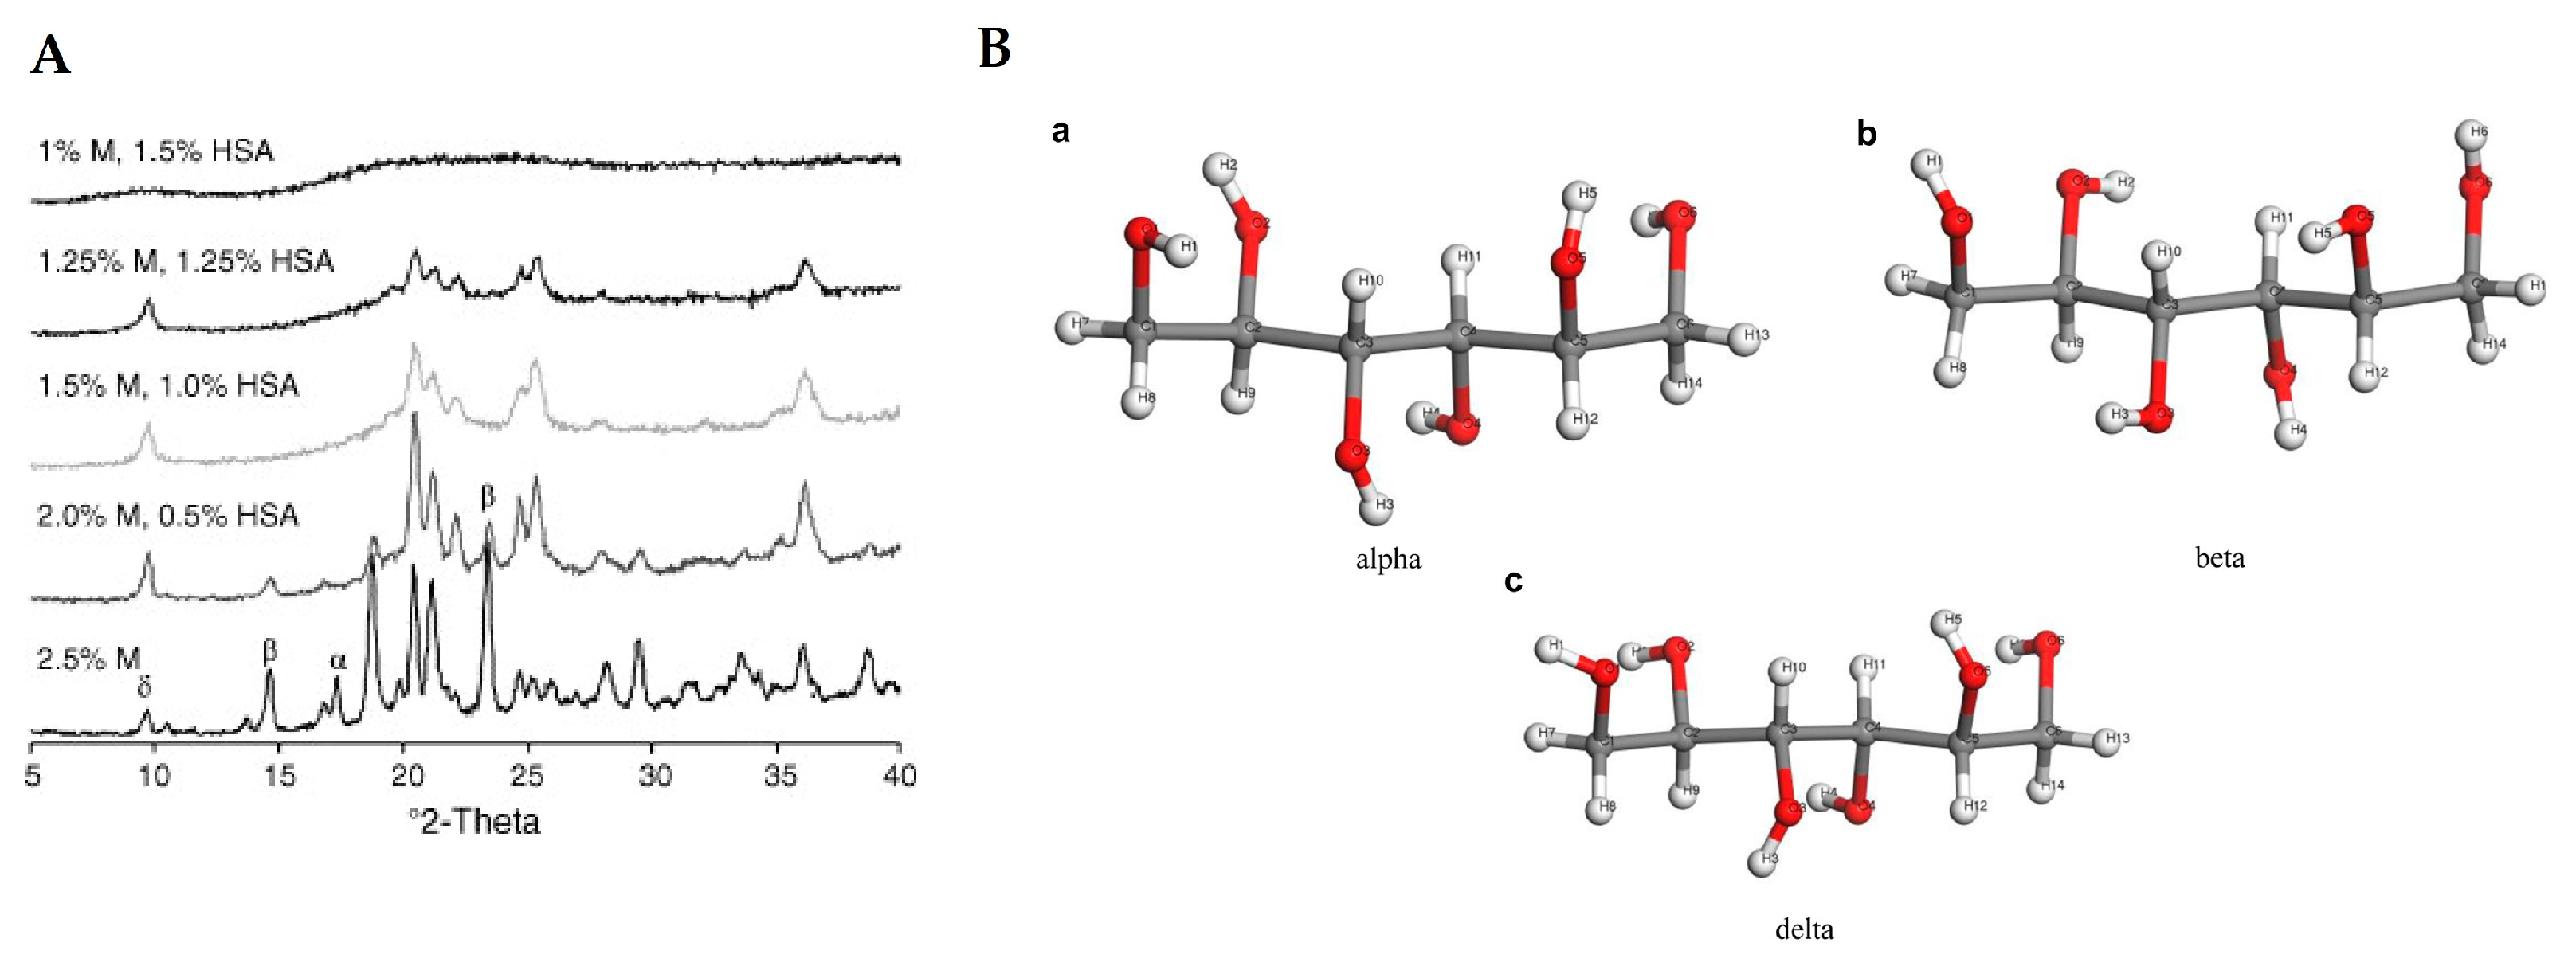
2.10. X-ray Diffraction (XRD)

Diffraction analysis based on X-ray light is a widely used analytical technique to study the physical state of materials, which has been used in drug research and development for many years. It is a method of choice for three-dimensional structural analysis of proteins in the solid state. The technique provides information on powder structure (amorphous/crystalline) and internal surface structure for better understanding of structure–function relationship of proteins and their interaction with various factors in their environment. Changes in the crystalline form of protein pharmaceuticals may be reflected in changes in solubility, which has implications for bioavailability. In addition, changes in the formulation matrix can affect the stability of lyophilized proteins [144,145,146]. In X-ray powder diffraction (XRD), an X-ray beam is incident on a single crystal and scattered at different angles. The intensities and angles at which the X-rays are scattered allow the electron density in the crystal to be determined, which in turn leads to the derivation of a three-dimensional structure of the crystal. Thus, XRD is ideally suited to monitor the evolution of crystallinity as well as changes in the crystalline forms of lyophilized protein pharmaceuticals.
Crystallization of the components in the lyophilized proteins formulations can be induced, for example, by lowering the temperature during the lyophilization cycle [147,148]. Crystallization of the formulations may result in individual components not having the same physical form as present in the starting materials. For example, an excipient may crystallize or remain amorphous. When the excipient crystallizes, there are several possibilities, such as crystallizing a polymorphic form or a hydrate of the starting form. These forms have already been observed in various formulations, demonstrating the need to also examine the lyophilized protein pharmaceuticals also by powder X-ray diffraction. Such changes in the form of excipient may lead to degradation of proteins as active species in the formulations. There are several studies on the behavior of excipient mannitol with XRD as the analytical technique used. Mannitol is a very good example, as it can exist in at least three polymorphic forms, an amorphous form and a hemihydrate form (Figure 13) [149,150,151,152,153,154].
In a recent study by Norrman et al., the structure in insulin formulations was investigated. In these formulations, protamine was co-crystallized with insulin. XRD analysis showed that protamine acts as a charge balancer and does not specifically bind to insulin [155]. Izutsu et al. in which the stabilizing effect of amphiphilic excipients and sugars was investigated by XRD analysis published another interesting study. It was shown that various amphiphilic excipients, such as polyethylene glycol (PEG), act as good stabilizers for lyophilized proteins when dispersed in a sugar-dominated matrix [17].

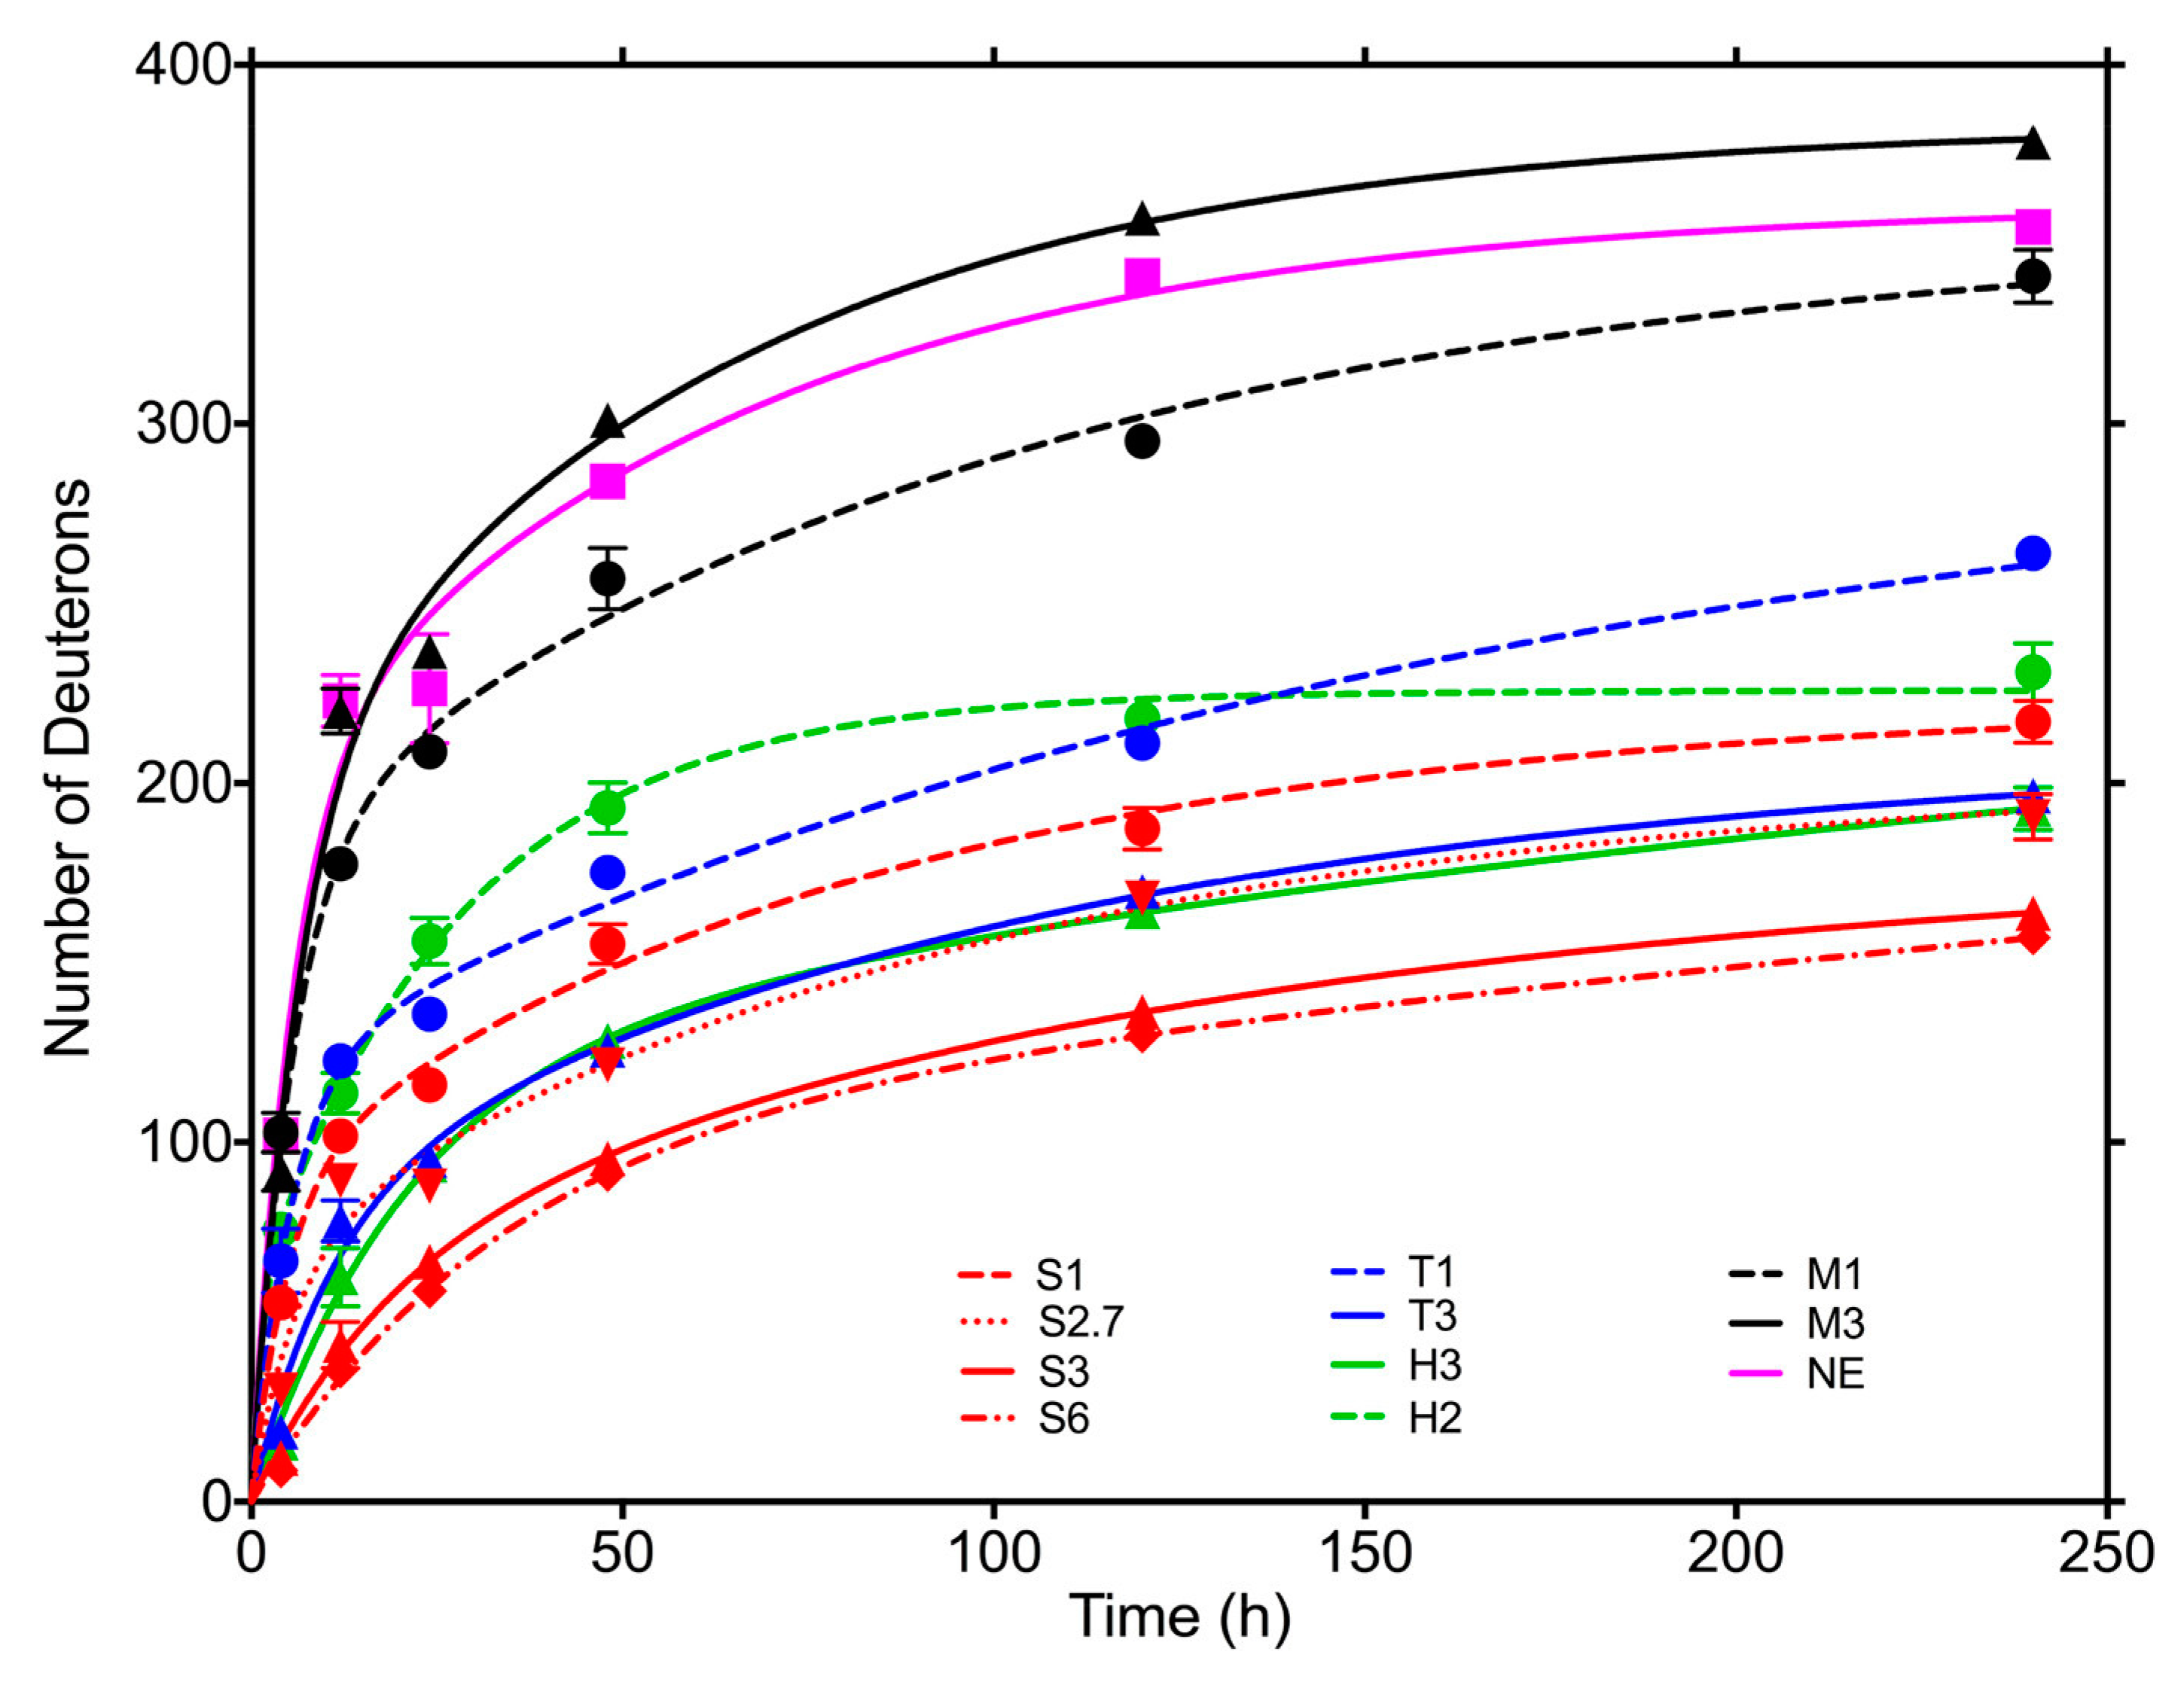
2.11. Solid-State Hydrogen-Deuterium Exchange Mass Spectrometry (ssHDX-MS)

Hydrogen/deuterium exchange mass spectrometry (HDX-MS) has recently emerged as a very useful and efficient method for studying protein conformation and interactions with excipients in the solid state, as well as for predicting physical stability. As a high-resolution method for analysis in solution, HDX-MS has been used for many decades to study protein structure, conformation, stability, solvent exposure and dynamics [156,157,158,159,160], as well as protein folding and ligand binding [161]. It measures the kinetics of deuterium uptake in both the intact protein and its peptic fragments [162]. HDX-MS as a technique consists of exposure of the protein to D2O, whereupon the rate as well as extent of deuterium incorporation is recorded as a change in mass (m/z) [163,164]. Similarly, solid-state hydrogen-deuterium exchange mass spectrometry (ssHXD- MS) can be used to measure protein structure, interactions with excipients, and to study the conformation of proteins in lyophilized powders. Results are usually obtained with relatively high resolution and the method is characterized by a very good correlation between deuterium exchange and physical stability during storage [43,165]. In practice, freeze-dried protein samples are exposed to D2O in the vapor phase at controlled relative humidity, vapor pressure, and temperature for varying lengths of time. This is often done in a desiccator containing deuterium oxide. Samples are then rapidly reconstituted under quenched conditions (usually in acidic buffer with a pH around 2.5) and subjected to liquid chromatography-mass spectrometry (LC/MS) analysis with or without proteolytic digestion. If digestion is performed prior to analysis of the samples using LC/MS, information on deuterium uptake can be obtained with peptide-level resolution. Such an approach is often used with HDX-MS in solution [166,167,168]. Then, the extent of deuterium uptake by the protein and its peptide fragments is measured as a function of time using mass spectrometry [20,169]. Indeed, hydrogen atoms can be exchanged for deuterium upon exposure to D2O. On the other hand, they can also be exchanged again, so that only the hydrogen atoms on the amide backbone can be analyzed by mass spectrometry. Such analysis can provide insight into the intra- and intermolecular hydrogen bonding interactions in the formulation matrix. These interactions can strongly influence the physical stability of the protein drug [170].
Although HDX-MS is a relatively new analytical technique, there are already several examples of its application to the study of protein-based pharmaceuticals in solid form. French et al. studied spray-dried powders with HDX and FTIR, taking advantage of isotopic shifts in the amide bands [171]. Desai et al. used HDX with proton NMR analysis to study the protein structure of pancreatic trypsin inhibitor in the lyophilized state [172]. ssHDX was also used to study hydration in lyophilized myoglobin. The extent of HDX in solids is related to hydration of the exchangeable amide groups and protein conformation and dynamics. By using pepsin digestion, mapping with resolution at the peptide level can also be achieved [173]. In addition, the kinetics of HDX were also investigated, suggesting that it is useful for detecting non-native species in protein formulations that cannot be detected by other methods, such as FTIR [174]. Moorthy et al. used ssHDX to predict protein aggregation of myoglobin in lyophilized formulations. They showed a better correlation with the extent of aggregation for ssHDX compared to FTIR band intensity [43]. Similar results were obtained by examining the conformation and aggregation of a monoclonal antibody IgG1 (immunoglobulin G1) (Figure 14). Interestingly, protein aggregation decreased when histidine was added to formulations containing sucrose. However, these results did not correlate with structural or conformational changes observed by FTIR or HDX-MS [137]. Wilson et al. used ssHDX- MS to investigate the effects of processing conditions and excipients on protein structure and physical stability. The results obtained show, among other things, how this method can be used as a tool not only for predicting stability but also for developing more robust protein formulations [175].
Solid-state HXD-MS as a characterization tool can be very useful for solid-state protein stability studies, providing information at higher resolution than other conventional methods [176]. While conventional analytical tools can detect differences between processes and formulations, there is no good correlation with the physical stability of proteins. On the other hand, ssHDX-MS shows a greater correlation to physical stability. Usually, a more stable sample has a lower maximum deuterium retention (Dmax) and peak area. Furthermore, ssHDX can also be used to study population heterogeneity within a protein formulation. For example, spray-dried formulations have shown better heterogeneity compared to the corresponding lyophilized samples. Although ssHDX- MS has proven to be a useful tool for predicting the stability of solid pharmaceutical proteins, it can also be used to develop more robust protein formulations.

3. Methods for Aggregation Studies

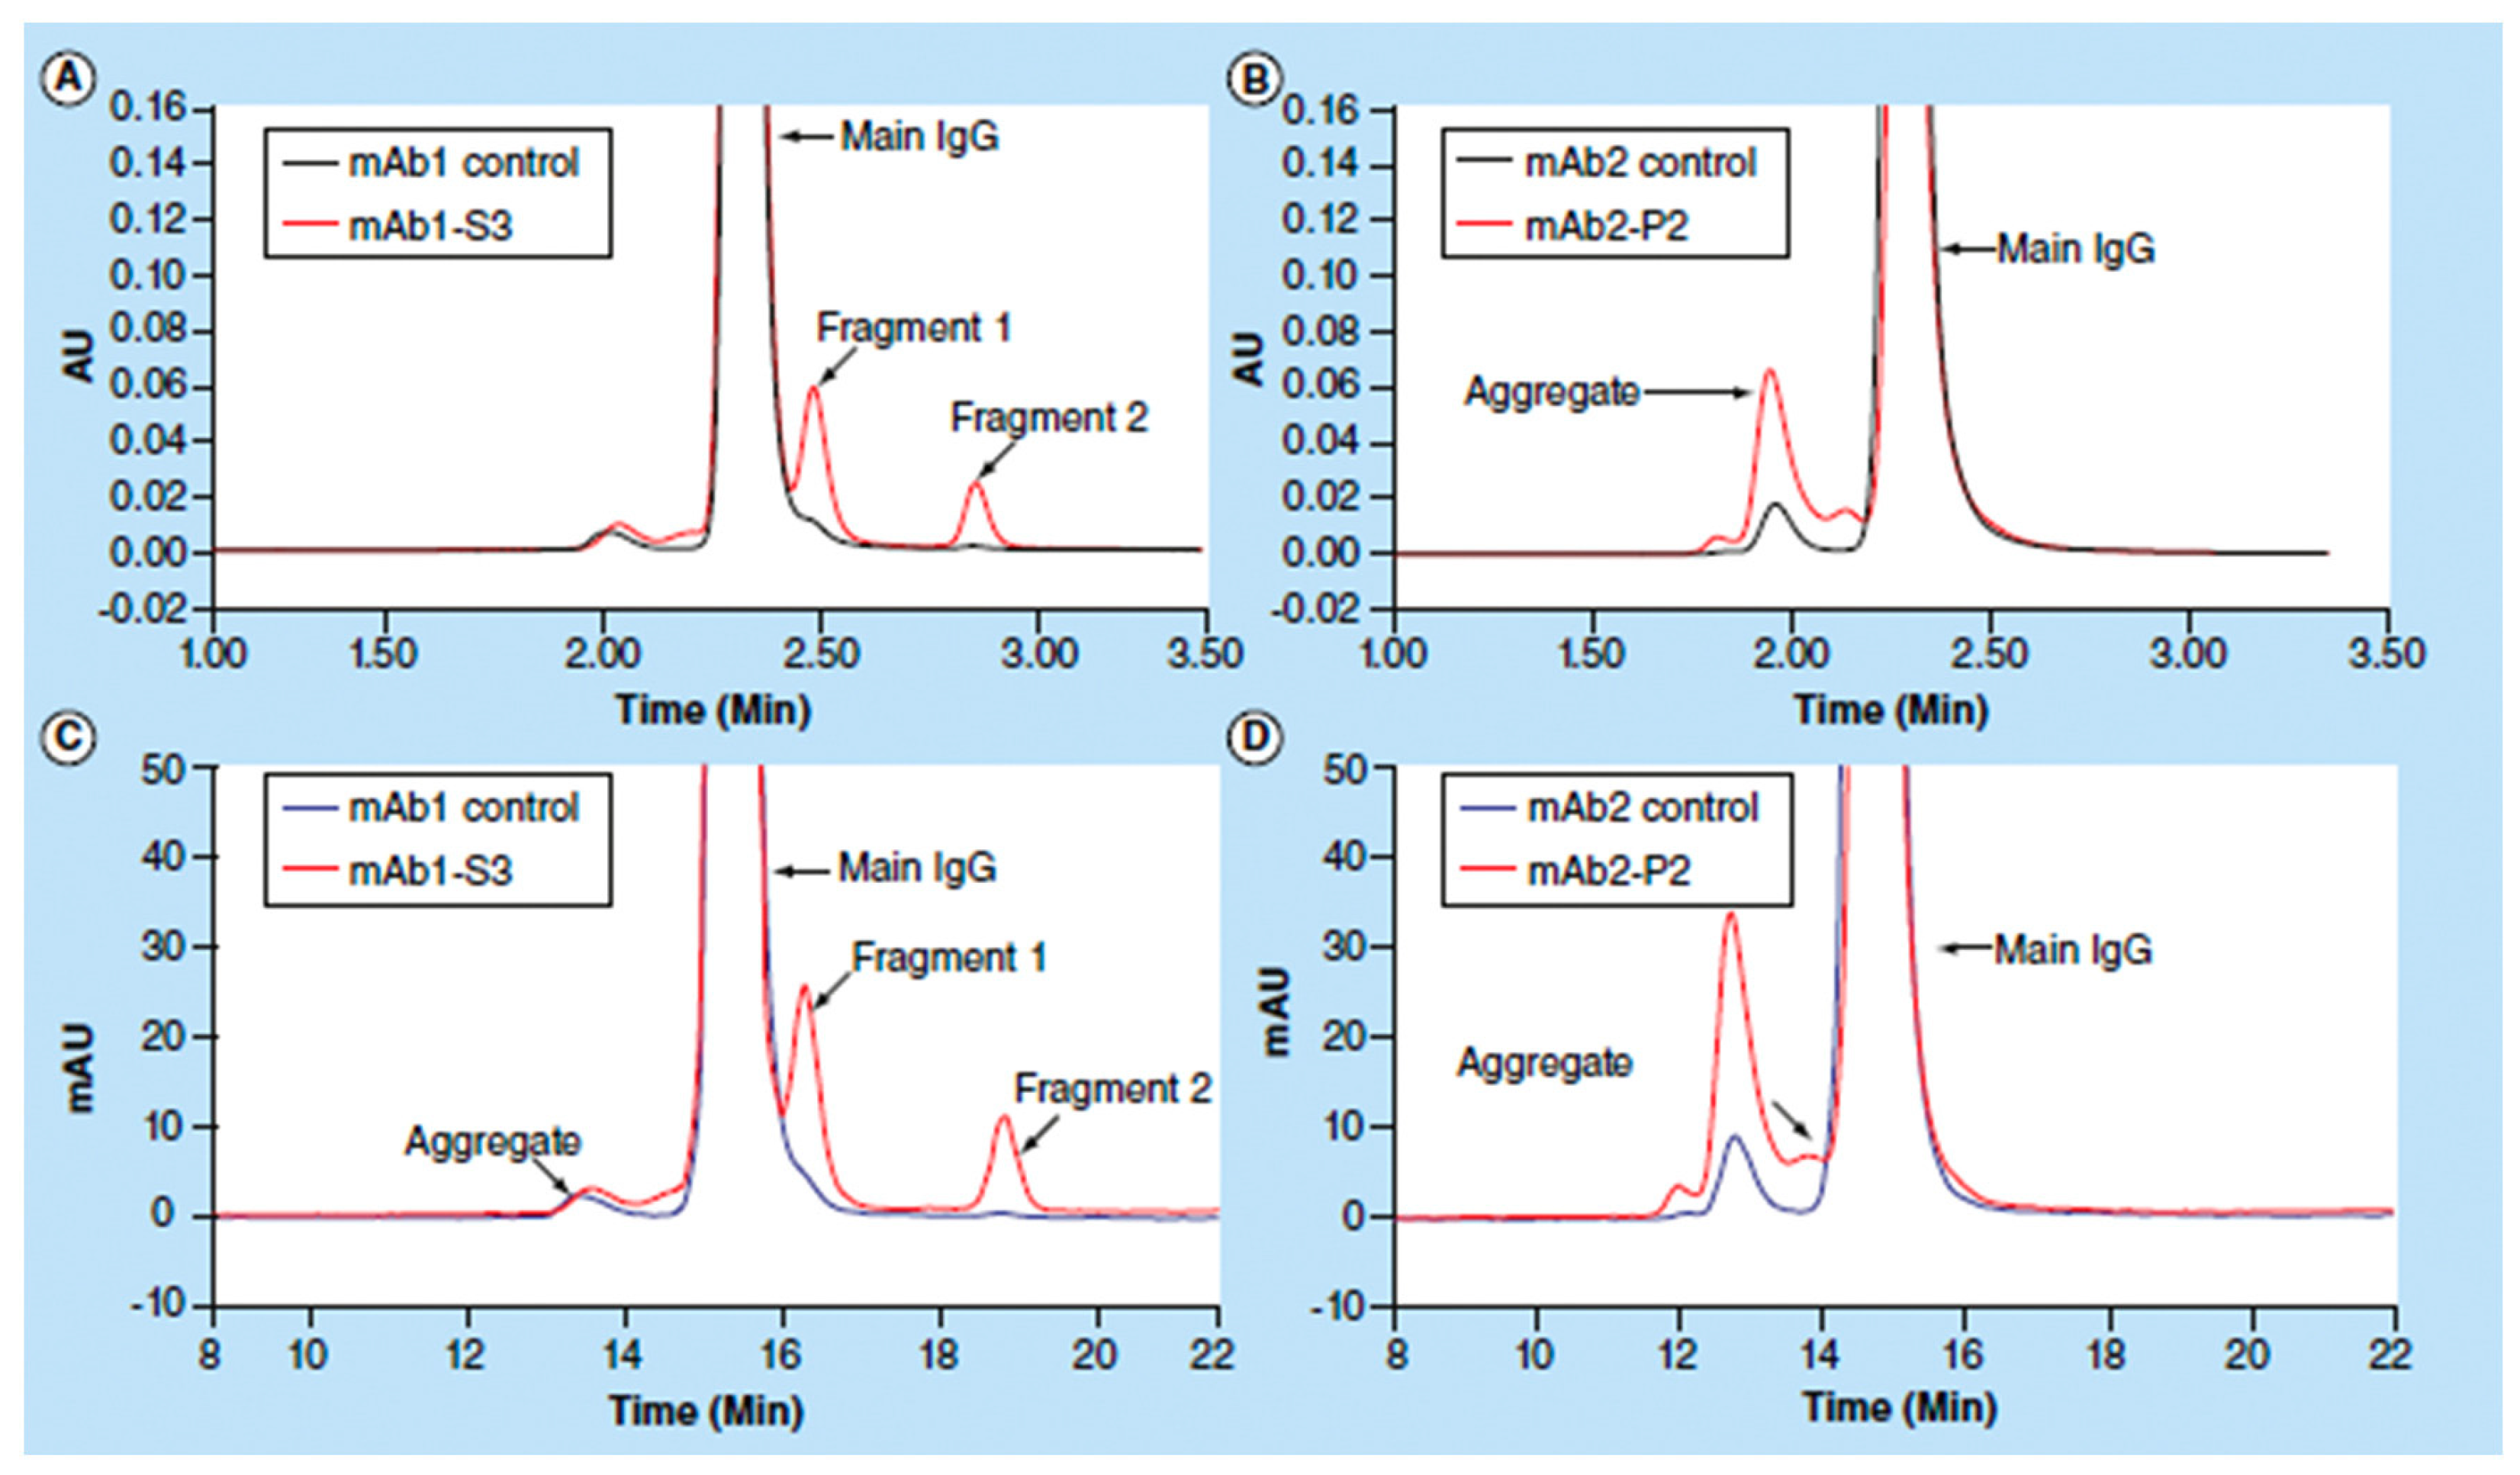
3.1. Size-Exclusion Chromatography (SEC)

As a loss of higher order structure, protein denaturation can occur and lead to aggregation or chemical instability. When the protein is denatured (partially or completely), more hydrophobic parts are exposed, as well as greater flexibility of the whole molecule [177,178]. However, aggregates and denatured protein species may still have a considerable amount of secondary structure and are therefore indistinguishable from native species using techniques such as FTIR spectroscopy [95]. This could be due to the lack of sensitivity of FTIR spectroscopy, combined with secondary structural changes in only small parts of the protein leading to aggregation [36]. Because spectroscopic techniques provide only general information about the overall secondary structure of the sample, aggregation could also be caused by a change in the secondary structure of only a small population of molecules that may not be detected [39]. Therefore, significant parts of the secondary structure are retained upon aggregation and only changes in tertiary structure may occur. Finally, proteins in lyophilized pharmaceuticals can aggregate without any detectable change in secondary structure [179].
Size-exclusion chromatography (SEC) has emerged as the method of choice for the detection and study of protein aggregation, particularly for drug discovery applications [176,180,181]. SEC can separate protein species based on their hydrodynamic size under native conditions. SEC columns can be used in both high-performance liquid chromatography (HPLC; formerly called high-pressure liquid chromatography) and ultra-high-performance liquid chromatography (UHPLC). Although primarily intended for the detection of soluble aggregates, SEC can also be used for the analysis of truncated species (fragments) in a protein sample [182].
SEC columns are usually silica-based with high recovery and resolution. Proteins from 10 kD up to 150 kD in size (protein pharmaceuticals) have been successfully separated and analyzed using such columns. For hydrophobic proteins, which tend to have poor recovery, polymer-based columns can be used, but at the expense of resolution compared to their silica-based counterparts. Mobile phases for SEC analysis of lyophilized proteins are typically phosphate-based buffers containing 100 to 500 mM sodium chloride, at a pH near neutrality. Sodium chloride can be substituted with sodium sulfate or even sodium perchlorate [183]. To prevent tailing or poor recovery for proteins that may interact too strongly with silica columns, arginine was used to minimize adsorption [184].
Using SEC analysis, both high molecular weight (HMW) species belonging to aggregates and low molecular weight (LMW) species can be detected and characterized. The LMW species represent degradation (denaturation) products, e.g., from backbone hydrolysis or other fragmentation [89].
A nice example of a SEC study in the context of formulation development is the work by Wang et al. on the influence of sucrose content on the storage stability of proteins, where the correlation between aggregation, protein structure, and molecular mobility was investigated [185]. Another article worth mentioning is the review paper by Goyon et al. on modern SEC, where the current possibilities for characterization of protein pharmaceuticals are discussed. Some of the SEC chromatograms from this study are shown in Figure 15 [186]. Furthermore, Andya et al. used SEC in combination with some other methods such as DSC, FTIR, and CD to investigate the mechanisms of aggregation and stabilization by carbohydrate excipients [32]. Last but not least, SEC has also been used together with ssHDX- MS to study the effect of drying method and excipient on structure and stability of protein solids (Figure 16) [175].

3.2. Dynamic Light Scattering (DLS)

As a non-destructive complementary method to Size-exclusion chromatography (SEC), dynamic light scattering (DLS) can be used to detect protein aggregates that cannot be detected by SEC analyzes. A typical DLS study data results can be seen in Figure 17 [187]. DLS is one of the size-based analyzes used to determine the size distribution of particles. Its principle is based on the fact that the intensity of light scattered from a sample is proportional to the particle size and its concentration. DLS can be used to measure particles in the diameter range from 1 nm to 5 μm, and the results can be reported in a volume-based distribution [181,188]. Because it is a qualitative screening technique for characterizing protein solutions, it can be used to distinguish a homogeneous from an aggregated sample. Although it has good sensitivity for detecting large aggregates, it is difficult to perform quantification analysis [181,189]. Its resolution is also limited [190]. However, DLS is generally used as an analytical tool for comparing different samples rather than for absolute measurements. Therefore, different lyophilized protein formulations are usually analyzed and compared [191].
DLS has been used as a standard method for determining protein size analysis and aggregation patterns [192]. Furthermore, DLS was also used for characterization in the PEGylated erythropoietin (EPO) study [193]. In addition, DLS was used in monitoring the aggregation of carbonic anhydrase [194,195], and β-amyloid peptide [196,197]. Hawe and Friess studied the correlation between pH and aggregation and showed that the percentage of aggregated species increased with higher pH values [198]. DLS was also used to study the effects of excipients on aggregation [199] and to study the effects of pH and buffer concentration on the thermal stability of etanercept, a biopharmaceutical used to treat autoimmune diseases [200]. In addition, Sukumar et al. used dynamic light scattering to check the opalescence of some IgG1 antibody samples for possible aggregation at high concentrations [201].

4. Method Summary

Table 3 gives an overview of the methods described above with some of the “must know” information.
Table 4 presents a comparison of different methods used to study same or similar samples of lyophilized formulations. Powders containing one of proteins (myoglobin, bovine serum albumin, lysozyme, β-lactoglobulin) were formulated with sucrose, trehalose, or mannitol and dried using lyophilization or spray-drying. The samples were analyzed by FTIR, fluorescence, XRD, DSC, and ssHDX-MS. Protein instability was determined by loss of monomeric peak using SEC [175].

5. Conclusions

Since the increased use of protein-based biopharmaceuticals in the form of lyophilized solid powders, there is a high demand for good analytical methods with high resolution to characterize these drugs. Preservation of the native structures of the proteins is critical for the development of a safe, efficient, and high quality drug. Although most analytical methods evaluate the properties of proteins in solution, an increasing number of methods for solid-state characterization of protein pharmaceuticals have been used. These methods can characterize and monitor changes in the secondary and tertiary structures of proteins with relatively good accuracy. FTIR and Raman spectroscopy can be routinely used to evaluate secondary structure in biopharmaceutical products and their changes. FTIR has the advantage of providing sample spectra quickly and is a nondestructive method that has simple and not expensive equipment. Raman analysis, on the other hand, takes a little more time to get a correct measurement, but is a complementary method to FTIR. NIR spectroscopy is a non-invasive and non-destructive technique that can monitor the secondary structure of proteins, and serves as an in-line tool for tracking structural changes throughout the whole lyophilization process. Similar to FTIR, NIR also has equipment that is not expensive and easy to set up. Samples can be analyzed and recovered in just a few minutes. In addition, no inert gas purge is required. On the other hand, FTIR, NIR, and Raman do not correlate as well with storage stability and analysis can only be done on a global scale. Solid-state fluorescence and UV–Vis spectroscopy can be used to derive information about the tertiary structure of proteins. These two methods are similar to FTIR and NIR, delivering spectra in short time and preserving the sample during the analysis. Moreover, here the results usually do not correlate well with aggregates formation. CD can provide insight into both secondary and tertiary structural changes. The advantage of this method is that one can measure the degree of structure both in the solid and in the solution. The disadvantage of the method is that in some cases the changes in the spectra are rather small and concentrated samples must be used. XRD analysis is the method of choice to obtain information on powder structure (amorphous/crystalline). While the crystallinity analyses are very good, the samples here are damaged by X-ray irradiation and, therefore, cannot be recovered. In addition, the measurements are made on a global scale. Protein dynamics is generally studied using ssNMR, DSC, and DRS. The information from protein dynamics has shown very good correlation with their stability in the solid state. These three methods are sensitive, but the sample cannot be recovered. This can be a particular problem with ssNMR, as a relatively large amount of sample is required. All three methods require a certain amount of time to produce results (the ssNMR experiment may run overnight, for example). ssHDX-MS has emerged as a relatively new tool for studying protein structure and dynamics, showing better correlation with physical stability than some of the conventional characterization methods mentioned above (very good correlation with aggregates formation). Another advantage is the ability to analyze samples on a global and local scale. On the other hand, the method requires relatively expensive equipment and the measurements are not as fast as other routinely used techniques. Moreover, ssHDX- MS can also reveal population heterogeneity within a protein formulation. Finally, for the study of aggregation phenomena, which is of great importance for successful drug development, SEC and DLS have been found to be the most reliable and widely used analytical techniques. SEC is the method of choice here because it can give good and reliable results with good resolution, whereas DLS sometimes cannot distinguish some particle types. On the other hand, DLS can detect some particles that are not observed with SEC. Therefore, the two methods complement each other, and it is advisable to analyze the samples with both.

Author Contributions

Conceptualization, A.B. and S.G.; writing—original draft preparation, A.B.; writing—review and editing, A.B. and S.G.; visualization, A.B.; supervision, S.G.; project administration, A.B. and S.G.; funding acquisition, A.B. and S.G. Both authors have read and agreed to the published version of the manuscript.

Funding

The authors acknowledge financial support from the Ministry of Education, Science, and Sport, Republic of Slovenia (Grant 5442-1/2018/405 to A.B.) and the Slovenian Research Agency (research core financing P1-0208).

Conflicts of Interest

The authors declare no conflict of interest.

References

  1. Wang, W.; Ohtake, S. Science and art of protein formulation development. Int. J. Pharm. 2019, 568, 118–505. [Google Scholar] [CrossRef]
  2. Abdul-Fattah, A.M.; Kalonia, D.S.; Pikal, M.J. The Challenge of Drying Method Selection for Protein Pharmaceuticals: Product Quality Implications. J. Pharm. Sci. 2007, 96, 1886–1916. [Google Scholar] [CrossRef] [PubMed]
  3. Dong, A.; Prestrelski, S.J.; Allison, S.D.; Carpenter, J.F. Infrared spectroscopic studies of lyophilization- and temperature-induced protein aggregation. J. Pharm. Sci. 1995, 84, 415–424. [Google Scholar] [CrossRef] [PubMed]
  4. Prestrelski, S.J.; Tedeschi, N.; Arakawa, T.; Carpenter, J.F. Dehydration-induced conformational transitions in proteins and their inhibition by stabilizers. Biophys. J. 1993, 65, 661–671. [Google Scholar] [CrossRef] [Green Version]
  5. Prestrelski, S.J.; Pikal, K.A.; Arakawa, T. Optimization of Lyophilization Conditions for Recombinant Human Interleukin-2 by Dried-State Conformational Analysis Using Fourier-Transform Infrared Spectroscopy. Pharm. Res. Off. J. Am. Assoc. Pharm. Sci. 1995, 12, 1250–1259. [Google Scholar] [CrossRef]
  6. Chang, B.S.; Beauvais, R.M.; Dong, A.; Carpenter, J.F. Physical Factors Affecting the Storage Stability of Freeze-Dried Interleukin-1 Receptor Antagonist: Glass Transition and Protein Conformation. Arch. Biochem. Biophys. 1996, 331, 249–258. [Google Scholar] [CrossRef] [Green Version]
  7. Carpenter, J.F.; Prestrelski, S.J.; Dong, A. Application of infrared spectroscopy to development of stable lyophilized protein formulations. Eur. J. Pharm. Biopharm. 1998, 45, 231–238. [Google Scholar] [CrossRef]
  8. Ken-ichi, I.; Sumie, Y.; Tadao, T. Stabilization of β-galactosidase by amphiphilic additives during freeze-drying. Int. J. Pharm. 1993, 90, 187–194. [Google Scholar] [CrossRef]
  9. Cicerone, M.T.; Pikal, M.J.; Qian, K.K. Stabilization of proteins in solid form. Adv. Drug Deliv. Rev. 2015, 93, 14–24. [Google Scholar] [CrossRef] [Green Version]
  10. Lam, X.M.; Costantino, H.R.; Overcashier, D.E.; Nguyen, T.H.; Hsu, C.C. Replacing succinate with glycolate buffer improves the stability of lyophilized interferon-. Int. J. Pharm. 1996, 142, 85–95. [Google Scholar] [CrossRef]
  11. Carpenter, J.F.; Crowe, J.H. The mechanism of cryoprotection of proteins by solutes. Cryobiology 1988, 25, 244–255. [Google Scholar] [CrossRef]
  12. Chang, B.S.; Kendrick, B.S.; Carpenter, J.F. Surface-induced denaturation of proteins during freezing and its inhibition by surfactants. J. Pharm. Sci. 1996, 85, 1325–1330. [Google Scholar] [CrossRef] [PubMed]
  13. Crowe, J.H.; Carpenter, J.F.; Crowe, L.M.; Anchordoguy, T.J. Are freezing and dehydration similar stress vectors? A comparison of modes of interaction of stabilizing solutes with biomolecules. Cryobiology 1990, 27, 219–231. [Google Scholar] [CrossRef]
  14. Prestrelski, S.J.; Arakawa, T.; Carpenter, J.F. Separation of freezing- and drying-induced denaturation of lyophilized proteins using stress-specific stabilization: II. Structural studies using infrared spectroscopy. Arch. Biochem. Biophys. 1993, 303, 465–473. [Google Scholar] [CrossRef]
  15. Carpenter, J.F.; Prestrelski, S.J.; Arakawa, T. Separation of Freezing- and Drying-Induced Denaturation of Lyophilized Proteins Using Stress-Specific Stabilization: I. Enzyme Activity and Calorimetric Studies. Arch. Biochem. Biophys. 1993, 303, 456–464. [Google Scholar] [CrossRef] [PubMed]
  16. Crowe, L.M.; Reid, D.S.; Crowe, J.H. Is trehalose special for preserving dry biomaterials? Biophys. J. 1996, 71, 2087–2093. [Google Scholar] [CrossRef] [Green Version]
  17. Izutsu, K.I.; Yoshioka, S.; Kojima, S. Increased Stabilizing Effects of Amphiphilic Excipients on Freeze-Drying of Lactate Dehydrogenase (LDH) by Dispersion into Sugar Matrices. Pharm. Res. Off. J. Am. Assoc. Pharm. Sci. 1995, 12, 838–843. [Google Scholar] [CrossRef]
  18. Ramos, A.; Raven, N.D.H.; Sharp, R.J.; Bartolucci, S.; Rossi, M.; Cannio, R.; Lebbink, J.; Van Der Oost, J.; De Vos, W.M.; Santos, H. Stabilization of Enzymes against Thermal Stress and Freeze-Drying by Mannosylglycerate. Appl. Environ. Microbiol. 1997, 63, 4020–4025. [Google Scholar] [CrossRef] [Green Version]
  19. Wahl, V.; Khinast, J.; Paudel, A. Lyophilized protein powders: A review of analytical tools for root cause analysis of lot-to-lot variability. TrAC Trends Anal. Chem. 2016, 82, 468–491. [Google Scholar] [CrossRef]
  20. Moorthy, B.; Iyer, L.; Topp, E. Characterizing Protein Structure, Dynamics and Conformation in Lyophilized Solids. Curr. Pharm. Des. 2015, 21, 5845–5853. [Google Scholar] [CrossRef] [Green Version]
  21. Wang, W. Lyophilization and development of solid protein pharmaceuticals. Int. J. Pharm. 2000, 203, 1–60. [Google Scholar] [CrossRef]
  22. Duddu, S.P.; Zhang, G.; Dal Monte, P.R. The relationship between protein aggregation and molecular mobility below the glass transition temperature of lyophilized formulations containing a monoclonal antibody. Pharm. Res. 1997, 14, 596–600. [Google Scholar] [CrossRef] [PubMed]
  23. Wang, W. Protein aggregation and its inhibition in biopharmaceutics. Int. J. Pharm. 2005, 289, 1–30. [Google Scholar] [CrossRef] [PubMed]
  24. Pieters, S.; Vander Heyden, Y.; Roger, J.M.; D’Hondt, M.; Hansen, L.; Palagos, B.; De Spiegeleer, B.; Remon, J.P.; Vervaet, C.; De Beer, T. Raman spectroscopy and multivariate analysis for the rapid discrimination between native-like and non-native states in freeze-dried protein formulations. Eur. J. Pharm. Biopharm. 2013, 85, 263–271. [Google Scholar] [CrossRef] [Green Version]
  25. Bandekar, J. Amide modes and protein conformation. Biochim. Biophys. Acta (BBA)/Protein Struct. Mol. 1992, 1120, 123–143. [Google Scholar] [CrossRef]
  26. Cooper, E.A.; Knutson, K. Fourier transform infrared spectroscopy investigations of protein structure. Pharm. Biotechnol. 1995, 7, 101–143. [Google Scholar] [CrossRef]
  27. Jiskoot, W.; Crommelin, D. Methods for Structural Analysis of Protein Pharmaceuticals. Available online: https://books.google.com/books?id=CyeilBm5az8C&pgis=1 (accessed on 8 January 2021).
  28. Barth, A.; Zscherp, C. What vibrations tell us about proteins. Q. Rev. Biophys. 2002, 35, 369–430. [Google Scholar] [CrossRef]
  29. Barth, A. Infrared spectroscopy of proteins. Biochim. Biophys. Acta Bioenerg. 2007, 1767, 1073–1101. [Google Scholar] [CrossRef] [Green Version]
  30. Savitzky, A.; Golay, M.J.E. Smoothing and Differentiation of Data by Simplified Least Squares Procedures. Anal. Chem. 1964, 36, 1627–1639. [Google Scholar] [CrossRef]
  31. Tian, F.; Middaugh, C.R.; Offerdahl, T.; Munson, E.; Sane, S.; Rytting, J.H. Spectroscopic evaluation of the stabilization of humanized monoclonal antibodies in amino acid formulations. Int. J. Pharm. 2007, 335, 20–31. [Google Scholar] [CrossRef] [PubMed]
  32. Andya, J.D.; Hsu, C.C.; Shire, S.J. Mechanisms of aggregate formation and carbohydrate excipient stabilization of lyophilized humanized monoclonal antibody formulations. AAPS J. 2003, 5, 21–31. [Google Scholar] [CrossRef] [PubMed] [Green Version]
  33. Abdul-Fattah, A.M.; Truong-Le, V.; Yee, L.; Nguyen, L.; Kalonia, D.S.; Cicerone, M.T.; Pikal, M.J. Drying-induced variations in physico-chemical properties of amorphous pharmaceuticals and their impact on stability (I): Stability of a monoclonal antibody. J. Pharm. Sci. 2007, 96, 1983–2008. [Google Scholar] [CrossRef] [PubMed]
  34. Xu, Y.; Carpenter, J.F.; Cicerone, M.T.; Randolph, T.W. Contributions of local mobility and degree of retention of native secondary structure to the stability of recombinant human growth hormone (rhGH) in glassy lyophilized formulations. Soft Matter 2013, 9, 7855–7865. [Google Scholar] [CrossRef]
  35. Allison, S.D.; Chang, B.; Randolph, T.W.; Carpenter, J.F. Hydrogen bonding between sugar and protein is responsible for inhibition of dehydration-induced protein unfolding. Arch. Biochem. Biophys. 1999, 365, 289–298. [Google Scholar] [CrossRef] [PubMed]
  36. Griebenow, K.; Klibanov, A.M. Lyophilization-induced reversible changes in the secondary structure of proteins. Proc. Natl. Acad. Sci. USA 1995, 92, 10969–10976. [Google Scholar] [CrossRef] [PubMed] [Green Version]
  37. Schüle, S.; Frieß, W.; Bechtold-Peters, K.; Garidel, P. Conformational analysis of protein secondary structure during spray-drying of antibody/mannitol formulations. Eur. J. Pharm. Biopharm. 2007, 65, 1–9. [Google Scholar] [CrossRef] [PubMed]
  38. Chang, L.L.; Shepherd, D.; Sun, J.; Tang, X.C.; Pikal, M.J. Effect of sorbitol and residual moisture on the stability of lyophilized antibodies: Implications for the mechanism of protein stabilization in the solid state. J. Pharm. Sci. 2005, 94, 1445–1455. [Google Scholar] [CrossRef]
  39. Van De Weert, M.; Haris, P.I.; Hennink, W.E.; Crommelin, D.J.A. Fourier transform infrared spectrometric analysis of protein conformation: Effect of sampling method and stress factors. Anal. Biochem. 2001, 297, 160–169. [Google Scholar] [CrossRef]
  40. Costantino, H.R.; Carrasquillo, K.G.; Cordero, R.A.; Mumenthaler, M.; Hsu, C.C.; Griebenow, K. Effect of excipients on the stability and structure of lyophilized recombinant human growth hormone. J. Pharm. Sci. 1998, 87, 1412–1420. [Google Scholar] [CrossRef]
  41. Chang, L.; Shepherd, D.; Sun, J.; Ouellette, D.; Grant, K.L.; Tang, X.; Pikal, M.J. Mechanism of protein stabilization by sugars during freeze-drying and storage: Native structure preservation, specific interaction, and/or immobilization in a glassy matrix? J. Pharm. Sci. 2005, 94, 1427–1444. [Google Scholar] [CrossRef]
  42. Wang, B.; Tchessalov, S.; Warne, N.W.; Pikal, M.J. Impact of sucrose level on storage stability of proteins in freeze-dried solids: I. Correlation of protein-sugar interaction with native structure preservation. J. Pharm. Sci. 2009, 98, 3131–3144. [Google Scholar] [CrossRef]
  43. Moorthy, B.S.; Schultz, S.G.; Kim, S.G.; Topp, E.M. Predicting protein aggregation during storage in lyophilized solids using solid state amide hydrogen/deuterium exchange with mass spectrometric analysis (ssHDX-MS). Mol. Pharm. 2014, 11, 1869–1879. [Google Scholar] [CrossRef]
  44. Blanco, M.; Coello, J.; Iturriaga, H.; Maspoch, S.; De La Pezuela, C. Near-infrared spectroscopy in the pharmaceutical industry. Analyst 1998, 123, 135R–150R. [Google Scholar] [CrossRef]
  45. Ciurczak, E.W. Uses of near-infrared spectroscopy in pharmaceutical analysis. Appl. Spectrosc. Rev. 1987, 23, 147–163. [Google Scholar] [CrossRef]
  46. Morisseau, K.M.; Rhodes, C.T. Pharmaceutical uses of near-infrared spectroscopy. Drug Dev. Ind. Pharm. 1995, 21, 1071–1090. [Google Scholar] [CrossRef]
  47. Miyazawa, M.; Sonoyama, M. Studies on the Structural Characterisation of Proteins M Second derivative near infrared studies on the structural characterisation of proteins. J. Near Infrared Spectrosc. 1998, 6, 253–257. [Google Scholar] [CrossRef]
  48. Chan, H.K.; Ongpipattanakul, B.; Au-Yeung, J. Aggregation of rhDNase occurred during the compression of KBr pellets used for FTIR spectroscopy. Pharm. Res. 1996, 13, 238–242. [Google Scholar] [CrossRef]
  49. Luner, P.E.; Majuru, S.; Seyer, J.J.; Kemper, M.S. Quantifying crystalline form composition in binary powder mixtures using near-infrared reflectance spectroscopy. Pharm. Dev. Technol. 2000, 5, 231–246. [Google Scholar] [CrossRef] [PubMed]
  50. Inagaki, T.; Watanabe, T.; Tsuchikawa, S. The effect of path length, light intensity and co-added time on the detection limit associated with NIR spectroscopy of potassium hydrogen phthalate in aqueous solution. PLoS ONE 2017, 12, e0176920. [Google Scholar] [CrossRef] [PubMed]
  51. Bai, S.; Nayar, R.; Carpenter, J.F.; Manning, M.C. Noninvasive determination of protein conformation in the solid state using near infrared (NIR) spectroscopy. J. Pharm. Sci. 2005, 94, 2030–2038. [Google Scholar] [CrossRef] [PubMed]
  52. Derksen, M.W.J.; Van De Oetelaar, P.J.M.; Maris, F.A. The use of near-infrared spectroscopy in the efficient prediction of a specification for the residual moisture content of a freeze-dried product. J. Pharm. Biomed. Anal. 1998, 17, 473–480. [Google Scholar] [CrossRef]
  53. Jones, J.A.; Last, I.R.; MacDonald, B.F.; Prebble, K.A. Development and transferability of near-infrared methods for determination of moisture in a freeze-dried injection product. J. Pharm. Biomed. Anal. 1993, 11, 1227–1231. [Google Scholar] [CrossRef]
  54. Last, I.R.; Prebble, K.A. Suitability of near-infrared methods for the determination of moisture in a freeze-dried injection product containing different amounts of the active ingredient. J. Pharm. Biomed. Anal. 1993, 11, 1071–1076. [Google Scholar] [CrossRef]
  55. Sadler, A.J.; Horsch, J.G.; Lawson, E.Q.; Harmatz, D.; Brandau, D.T.; Middaugh, C.R. Near-infrared photoacoustic spectroscopy of proteins. Anal. Biochem. 1984, 138, 44–51. [Google Scholar] [CrossRef]
  56. Dufour, E.; Devaux, M.F.; Mouhous, N.; Robert, P. Monitoring the Secondary Structure of Proteins by Near-Infrared Spectroscopy. Appl. Spectrosc. 1999, 53, 226–232. [Google Scholar]
  57. Sakuri, K.; Cho, R.-K.; Miura, T.; Liu, Y.; Ozaki, Y. Studies on Spectra/Structure Correlations in Near-Infrared Spectra of Proteins and Polypeptides. Part I: A Marker Band for Hydrogen Bonds. Appl. Spectrosc. 1994, 48, 1249–1254. [Google Scholar]
  58. Katayama, D.S.; Carpenter, J.F.; Menard, K.P.; Manning, M.C.; Randolph, T.W. Mixing Properties of Lyophilized Protein Systems: A Spectroscopic and Calorimetric Study. J. Pharm. Sci. 2009, 98, 2954–2969. [Google Scholar] [CrossRef] [PubMed]
  59. Izutsu, K.; Fujimaki, Y.; Kuwabara, A.; Hiyama, Y.; Yomota, C.; Aoyagi, N. Near-infrared analysis of protein secondary structure in aqueous solutions and freeze-dried solids. J. Pharm. Sci. 2006, 95, 781–789. [Google Scholar] [CrossRef]
  60. Pieters, S.; De Beer, T.; Vander Heyden, Y. Near-Infrared and Raman Spectroscopy: Potential Tools for Monitoring of Protein Conformational Instability during Freeze-Drying Processes. Available online: https://www.americanpharmaceuticalreview.com/Featured-Articles/38367-Near-infrared-and-Raman-Spectroscopy-Potential-Tools-for-Monitoring-of-Protein-Conformational-Instability-during-Freeze-drying-Processes/ (accessed on 10 April 2021).
  61. Wen, Z. Raman spectroscopy of protein pharmaceuticals. J. Pharm. Sci. 2007, 96, 2861–2878. [Google Scholar] [CrossRef]
  62. Paudel, A.; Raijada, D.; Rantanen, J. Raman spectroscopy in pharmaceutical product design. Adv. Drug Deliv. Rev. 2015, 89, 3–20. [Google Scholar] [CrossRef] [Green Version]
  63. Bunaciu, A.A.; Aboul-Enein, H.Y.; Hoang, V.D. Raman spectroscopy for protein analysis. Appl. Spectrosc. Rev. 2015, 50, 377–386. [Google Scholar] [CrossRef]
  64. De Beer, T.R.M.; Vercruysse, P.; Burggraeve, A.; Quinten, T.; Ouyang, J.; Zhang, X.; Vervaet, C.; Remon, J.P.; Baeyens, W.R.G. In-line and real-time process monitoring of a freeze drying process using Raman and NIR spectroscopy as complementary process analytical technology (PAT) tools. J. Pharm. Sci. 2009, 98, 3430–3446. [Google Scholar] [CrossRef] [PubMed]
  65. Roessl, U.; Leitgeb, S.; Pieters, S.; De Beer, T.; Nidetzky, B. In situ protein secondary structure determination in ice: Raman spectroscopy-based process analytical tool for frozen storage of biopharmaceuticals. J. Pharm. Sci. 2014, 103, 2287–2295. [Google Scholar] [CrossRef] [PubMed]
  66. Hedoux, A.; Paccou, L.; Achir, S.; Guinet, Y. Mechanism of protein stabilization by trehalose during freeze-drying analyzed by in situ micro-raman spectroscopy. J. Pharm. Sci. 2013, 102, 2484–2494. [Google Scholar] [CrossRef] [PubMed]
  67. Hédoux, A.; Paccou, L.; Achir, S.; Guinet, Y. In Situ Monitoring of Proteins during Lyophilization using Micro-Raman Spectroscopy: A Description of Structural Changes induced by Dehydration. J. Pharm. Sci. 2012, 101, 2316–2326. [Google Scholar] [CrossRef]
  68. Kauppinen, A.; Toiviainen, M.; Aaltonen, J.; Korhonen, O.; Järvinen, K.; Juuti, M.; Pellinen, R.; Ketolainen, J. Microscale freeze-drying with Raman spectroscopy as a tool for process development. Anal. Chem. 2013, 85, 2109–2116. [Google Scholar] [CrossRef]
  69. Elkordy, A.A.; Forbes, R.T.; Barry, B.W. Study of protein conformational stability and integrity using calorimetry and FT-Raman spectroscopy correlated with enzymatic activity. Eur. J. Pharm. Sci. 2008, 33, 177–190. [Google Scholar] [CrossRef] [Green Version]
  70. Sane, S.U.; Wong, R.; Hsu, C.C. Raman Spectroscopic Characterization of Drying-Induced Structural Changes in a Therapeutic Antibody: Correlating Structural Changes with Long-Term Stability. J. Pharm. Sci. 2004, 93, 1005–1018. [Google Scholar] [CrossRef] [PubMed]
  71. Tattini, V.; Parra, D.F.; Polakiewicz, B.; Pitombo, R.N.M. Effect of lyophilization on the structure and phase changes of PEGylated-bovine serum albumin. Int. J. Pharm. 2005, 304, 124–134. [Google Scholar] [CrossRef] [PubMed]
  72. Ichikawa, T.; Terada, H. Estimation of state and amount of phenylalanine residues in proteins by second derivative spectrophotometry. BBA Protein Struct. 1979, 580, 120–128. [Google Scholar] [CrossRef]
  73. Kueltzo, L.A.; Ersoy, B.; Ralston, J.P.; Middaugh, C.R. Derivative absorbance spectroscopy and protein phase diagrams as tools for comprehensive protein characterization: A bGCSF case study. J. Pharm. Sci. 2003, 92, 1805–1820. [Google Scholar] [CrossRef] [PubMed]
  74. Kuś, S.; Marczenko, Z.; Obarski, N. Derivative UV-VIS spectrophotometry in analytical chemistry. Chem. Anal. 1996, 41, 899–929. [Google Scholar]
  75. Ichikawa, T.; Terada, H. Second derivative spectrophotometry as an effective tool for examining phenylalanine residues in proteins. BBA Protein Struct. 1977, 494, 267–270. [Google Scholar] [CrossRef]
  76. Kueltzo, L.A.; Wang, W.; Randolph, T.W.; Carpenter, J.F. Effects of Solution Conditions, Processing Parameters, and Container Materials on Aggregation of a Monoclonal Antibody during Freeze-Thawing. J. Pharm. Sci. 2008, 97, 1801–1812. [Google Scholar] [CrossRef] [PubMed]
  77. Ragone, R.; Colonna, G.; Balestrieri, C.; Servillo, L.; Irace, G. Determination of Tyrosine Exposure in Proteins by Second-Derivative Spectroscopy. Biochemistry 1984, 23, 1871–1875. [Google Scholar] [CrossRef]
  78. Donovan, J.W. [21] Ultraviolet difference spectroscopy—New techniques and applications. Methods Enzymol. 1973, 27, 497–525. [Google Scholar] [CrossRef] [PubMed]
  79. Mach, H.; Middaugh, C.R. Simultaneous Monitoring of the Environment of Tryptophan, Tyrosine, and Phenylalanine Residues in Proteins by Near-Ultraviolet Second-Derivative Spectroscopy. Anal. Biochem. 1994, 222, 323–331. [Google Scholar] [CrossRef]
  80. Balestrieri, C.; Colonna, G.; Giovane, A.; Irace, G.; Servillo, L. Second-Derivative Spectroscopy of Proteins: A Method for the Quantitiative Determination of Aromatic Amino Acids in Proteins. Eur. J. Biochem. 1978, 90, 433–440. [Google Scholar] [CrossRef]
  81. Kueltzo, L.A.; Normand, N.; O’Hare, P.; Middaugh, C.R. Conformational lability of herpesvirus protein VP22. J. Biol. Chem. 2000, 275, 33213–33221. [Google Scholar] [CrossRef] [Green Version]
  82. Mach, H.; Thomson, J.A.; Middaugh, C.R.; Lewis, R.V. Examination of phenylalanine microenvironments in proteins by second-derivative absorption spectroscopy. Arch. Biochem. Biophys. 1991, 287, 33–40. [Google Scholar] [CrossRef]
  83. Lange, R.; Balny, C. UV-visible derivative spectroscopy under high pressure. Biochim. Biophys. Acta Protein Struct. Mol. Enzymol. 2002, 1595, 80–93. [Google Scholar] [CrossRef]
  84. Kueltzo, L.A.; Middaugh, C.R. Structural characterization of bovine granulocyte colony stimulating factor: Effect of temperature and pH. J. Pharm. Sci. 2003, 92, 1793–1804. [Google Scholar] [CrossRef] [PubMed]
  85. Ramachander, R.; Jiang, Y.; Li, C.; Eris, T.; Young, M.; Dimitrova, M.; Narhi, L. Solid state fluorescence of lyophilized proteins. Anal. Biochem. 2008, 376, 173–182. [Google Scholar] [CrossRef] [PubMed]
  86. Sharma, V.K.; Kalonia, D.S. Steady-state tryptophan fluorescence spectroscopy study to probe tertiary structure of proteins in solid powders. J. Pharm. Sci. 2003, 92, 890–899. [Google Scholar] [CrossRef] [PubMed]
  87. Schersch, K.; Betz, O.; Garidel, P.; Muehlau, S.; Bassarab, S.; Winter, G. Systematic investigation of the effect of lyophilizate collapse on pharmaceutically relevant proteins I: Stability after freeze-drying. J. Pharm. Sci. 2010, 99, 2256–2278. [Google Scholar] [CrossRef]
  88. Schersch, K.; Betz, O.; Garidel, P.; Muehlau, S.; Bassarab, S.; Winter, G. Systematic investigation of the effect of lyophilizate collapse on pharmaceutically relevant proteins, part 2: Stability during storage at elevated temperatures. J. Pharm. Sci. 2012, 101, 2288–2306. [Google Scholar] [CrossRef]
  89. Park, J.; Nagapudi, K.; Vergara, C.; Ramachander, R.; Laurence, J.S.; Krishnan, S. Effect of pH and excipients on structure, dynamics, and long-term stability of a model IgG1 monoclonal antibody upon freeze-drying. Pharm. Res. 2013, 30, 968–984. [Google Scholar] [CrossRef]
  90. Lakowicz, J.R. Principles of Fluorescence Spectroscopy; Springer: Berlin/Heidelberg, Germany, 2006; ISBN 0387312781. [Google Scholar]
  91. Royer, C.A. Probing protein folding and conformational transitions with fluorescence. Chem. Rev. 2006, 106, 1769–1784. [Google Scholar] [CrossRef]
  92. Demeule, B.; Gurny, R.; Arvinte, T. Detection and characterization of protein aggregates by fluorescence microscopy. Int. J. Pharm. 2007, 329, 37–45. [Google Scholar] [CrossRef]
  93. Gabellieri, E.; Strambini, G.B. Perturbation of Protein Tertiary Structure in Frozen Solutions Revealed by 1-Anilino-8-Naphthalene Sulfonate Fluorescence. Biophys. J. 2003, 85, 3214–3220. [Google Scholar] [CrossRef] [Green Version]
  94. Kelly, S.; Price, N. The Use of Circular Dichroism in the Investigation of Protein Structure and Function. Curr. Protein Pept. Sci. 2005, 1, 349–384. [Google Scholar] [CrossRef] [Green Version]
  95. Sharma, V.K.; Kalonia, D.S. Temperature- and pH-Induced Multiple Partially Unfolded States of Recombinant Human Interferon-α2a: Possible Implications in Protein Stability. Pharm. Res. 2003, 20, 1721–1729. [Google Scholar] [CrossRef]
  96. Tsai, A.M.; van Zanten, J.H.; Betenbaugh, M.J. I. Study of protein aggregation due to heat denaturation: A structural approach using circular dichroism spectroscopy, nuclear magnetic resonance, and static light scattering. Biotechnol. Bioeng. 1998, 59, 273–280. [Google Scholar] [CrossRef]
  97. Knubovets, T.; Osterhout, J.J.; Klibanov, A.M. Structure of lysozyme dissolved in neat organic solvents as assessed by NMR and CD spectroscopies. Biotechnol. Bioeng. 1999, 63, 242–248. [Google Scholar] [CrossRef]
  98. Kelly, S.M.; Jess, T.J.; Price, N.C. How to study proteins by circular dichroism. Biochim. Biophys. Acta Proteins Proteom. 2005, 1751, 119–139. [Google Scholar] [CrossRef] [PubMed]
  99. Liu, D.; Ren, D.; Huang, H.; Dankberg, J.; Rosenfeld, R.; Cocco, M.J.; Li, L.; Brems, D.N.; Remmele, R.L. Structure and stability changes of human IgG1 Fc as a consequence of methionine oxidation. Biochemistry 2008, 47, 5088–5100. [Google Scholar] [CrossRef] [PubMed]
  100. Harn, N.; Allan, C.; Oliver, C.; Middaugh, C.R. Highly concentrated monoclonal antibody solutions: Direct analysis of physical structure and thermal stability. J. Pharm. Sci. 2007, 96, 532–546. [Google Scholar] [CrossRef] [PubMed]
  101. Joshi, V.; Shivach, T.; Yadav, N.; Rathore, A.S. Circular dichroism spectroscopy as a tool for monitoring aggregation in monoclonal antibody therapeutics. Anal. Chem. 2014, 86, 11606–11613. [Google Scholar] [CrossRef] [PubMed]
  102. Vermeer, A.W.P.; Norde, W. The thermal stability of immunoglobulin: Unfolding and aggregation of a multi-domain protein. Biophys. J. 2000, 78, 394–404. [Google Scholar] [CrossRef] [Green Version]
  103. Harada, T.; Moriyama, H. Solid-State Circular Dichroism Spectroscopy. In Encyclopedia of Polymer Science and Technology; John Wiley & Sons, Inc.: Hoboken, NJ, USA, 2013. [Google Scholar]
  104. Castiglioni, E.; Biscarini, P.; Abbate, S. Experimental aspects of solid state circular dichroism. Chirality 2009, 21, E28–E36. [Google Scholar] [CrossRef]
  105. Kawamura, I.; Sato, H. Solid-state vibrational circular dichroism studies of L- and D-serine. Anal. Biochem. 2019, 580, 14–20. [Google Scholar] [CrossRef]
  106. Bak, K.H.; Thulstrup, P.W.; Orlien, V. Spectroscopic studies on the effect of high pressure treatment on the soluble protein fraction of porcine longissimus dorsi. Food Chem. 2014. [Google Scholar] [CrossRef]
  107. Paudel, A.; Geppi, M.; Mooter, G. Van den Structural and Dynamic Properties of Amorphous Solid Dispersions: The Role of Solid-State Nuclear Magnetic Resonance Spectroscopy and Relaxometry. J. Pharm. Sci. 2014, 103, 2635–2662. [Google Scholar] [CrossRef]
  108. Storey, R.A.; Ymén, I. Solid State Characterization of Pharmaceuticals. Solid State Charact. Pharm. 2011. [Google Scholar] [CrossRef]
  109. Yoshioka, S.; Aso, Y. Correlations between molecular mobility and chemical stability during storage of amorphous pharmaceuticals. J. Pharm. Sci. 2007, 96, 960–981. [Google Scholar] [CrossRef] [PubMed]
  110. Yoshioka, S.; Forney, K.M.; Aso, Y.; Pikal, M.J. Effect of sugars on the molecular motion of freeze-dried protein formulations reflected by NMR relaxation times. Pharm. Res. 2011, 28, 3237–3247. [Google Scholar] [CrossRef]
  111. Luthra, S.A.; Hodge, I.M.; Utz, M.; Pikal, M.J. Correlation of annealing with chemical stability in lyophilized pharmaceutical glasses. J. Pharm. Sci. 2008, 97, 5240–5251. [Google Scholar] [CrossRef] [PubMed]
  112. Yoshioka, S.; Aso, Y.; Kojima, S. The effect of excipients on the molecular mobility of lyophilized formulations, as measured by glass transition temperature and NMR relaxation- based critical mobility temperature. Pharm. Res. 1999, 16, 135–140. [Google Scholar] [CrossRef]
  113. Yoshioka, S.; Aso, Y.; Kojima, S.; Sakurai, S.; Fujiwara, T.; Akutsu, H. Molecular mobility of protein in lyophilized formulations linked to the molecular mobility of polymer excipients, as determined by high resolution 13C solid-state NMR. Pharm. Res. 1999, 16, 1621–1625. [Google Scholar] [CrossRef] [PubMed]
  114. Yoshioka, S.; Miyazaki, T.; Aso, Y.; Kawanishi, T. Significance of local mobility in aggregation of β-galactosidase lyophilized with trehalose, sucrose or stachyose. Pharm. Res. 2007, 24, 1660–1667. [Google Scholar] [CrossRef] [PubMed]
  115. Suihko, E.J.; Forbes, R.T.; Apperley, D.C. A solid-state NMR study of molecular mobility and phase separation in co-spray-dried protein–sugar particles. Eur. J. Pharm. Sci. 2005, 25, 105–112. [Google Scholar] [CrossRef]
  116. Lam, Y.H.; Bustami, R.; Phan, T.; Chan, H.K.; Separovic, F. A solid-state NMR study of protein mobility in lyophilized protein-sugar powders. J. Pharm. Sci. 2002, 91, 943–951. [Google Scholar] [CrossRef]
  117. Separovic, F.; Lam, Y.H.; Ke, X.; Chan, H.K. A solid-state NMR study of protein hydration and stability. Pharm. Res. 1998, 15, 1816–1821. [Google Scholar] [CrossRef] [PubMed]
  118. Yoshioka, S. Molecular Mobility of freeze-dried formulations as determined by NMR relaxation, and its effect on storage stability. In Freeze-Drying/Lyophilization of Bharmaceutical and Biological Products; Taylor & Francis Group: London, UK, 2004; ISBN 9780203021323. [Google Scholar]
  119. Yoshioka, S.; Aso, Y.; Nakai, Y.; Kojima, S. Effect of high molecular mobility of poly(vinyl alcohol) on protein stability of lyophilized γ-globulin formulations. J. Pharm. Sci. 1998, 87, 147–151. [Google Scholar] [CrossRef] [PubMed]
  120. Yoshioka, S.; Aso, Y.; Kojima, S. Softening temperature of lyophilized bovine serum albumin and γ- globulin as measured by spin-spin relaxation time of protein protons. J. Pharm. Sci. 1997, 86, 470–474. [Google Scholar] [CrossRef] [PubMed]
  121. Gill, P.; Moghadam, T.T.; Ranjbar, B. Differential scanning calorimetry techniques: Applications in biology and nanoscience. J. Biomol. Tech. 2010, 21, 167–193. [Google Scholar]
  122. Pikal, M.J.; Rigsbee, D.; Roy, M.L. Solid state stability of proteins III: Calorimetric (DSC) and spectroscopic (FTIR) characterization of thermal denaturation in freeze dried human growth hormone (hGH). J. Pharm. Sci. 2008, 97, 5122–5131. [Google Scholar] [CrossRef] [PubMed]
  123. Swarbrick, J. Thermal Analysis of Drugs and Drug Products. Encycl. Pharm. Technol. 2019, 304–329. [Google Scholar] [CrossRef]
  124. Matheus, S.; Friess, W.; Mahler, H.-C. FTIR and nDSC as Analytical Tools for High-Concentration Protein Formulations. Pharm. Res. 2006, 23, 1350–1363. [Google Scholar] [CrossRef]
  125. Han, Y.; Jin, B.S.; Lee, S.B.; Sohn, Y.; Joung, J.W.; Lee, J.H. Effects of sugar additives on protein stability of recombinant human serum albumin during lyophilization and storage. Arch. Pharm. Res. 2007, 30, 1124–1131. [Google Scholar] [CrossRef]
  126. Ihnat, P.M.; Vellekamp, G.; Obenauer-Kutner, L.J.; Duan, J.; Han, M.A.; Witchey-Lakshmanan, L.C.; Grace, M.J. Comparative thermal stabilities of recombinant adenoviruses and hexon protein. Biochim. Biophys. Acta Gen. Subj. 2005, 1726, 138–151. [Google Scholar] [CrossRef] [PubMed]
  127. Davidson, P.; Sun, W.Q. Effect of sucrose/raffinose mass ratios on the stability of co-lyophilized protein during storage above the Tg. Pharm. Res. 2001, 18, 474–479. [Google Scholar] [CrossRef] [PubMed]
  128. Strickley, R.G.; Anderson, B.D. Solid-state stability of human insulin II. Effect of water on reactive intermediate partitioning in lyophiles from pH 2-5 solutions: Stabilization against covalent dimer formation. J. Pharm. Sci. 1997, 86, 645–653. [Google Scholar] [CrossRef] [PubMed]
  129. Darrington, R.T.; Anderson, B.D. The Role of Intramolecular Nucleophilic Catalysis and the Effects of Self-Association on the Deamidation of Human Insulin at Low pH. Pharm. Res. Off. J. Am. Assoc. Pharm. Sci. 1994, 11, 784–793. [Google Scholar] [CrossRef]
  130. Craig, D.Q.M.; Royall, P.G.; Kett, V.L.; Hopton, M.L. The relevance of the amorphous state to pharmaceutical dosage forms: Glassy drugs and freeze dried systems. Int. J. Pharm. 1999, 179, 179–207. [Google Scholar] [CrossRef] [Green Version]
  131. Höhne, G.W.H.; Hemminger, W.F.; Flammersheim, H.-J. Differential Scanning Calorimetry; Springer: Berlin/Heidelberg, Germany, 2003; ISBN 978-3-642-05593-5. [Google Scholar]
  132. Breen, E.D.; Curley, J.G.; Overcashier, D.E.; Hsu, C.C.; Shire, S.J. Effect of moisture on the stability of a lyophilized humanized monoclonal antibody formulation. Pharm. Res. 2001, 18, 1345–1353. [Google Scholar] [CrossRef]
  133. Duru, C.; Swann, C.; Dunleavy, U.; Mulloy, B.; Matejtschuk, P. The importance of formulation in the successful lyophilization of influenza reference materials. Biologicals 2015, 43, 110–116. [Google Scholar] [CrossRef] [Green Version]
  134. El Moznine, R.; Smith, G.; Polygalov, E.; Suherman, P.M.; Broadhead, J. Dielectric properties of residual water in amorphous lyophilized mixtures of sugar and drug. J. Phys. D Appl. Phys. 2003, 36, 330–335. [Google Scholar] [CrossRef]
  135. Searles, J.A.; Carpenter, J.F.; Randolph, T.W. Annealing to optimize the primary drying rate, reduce freezing-induced drying rate heterogeneity, and determine T′g pharmaceutical lyophilization. J. Pharm. Sci. 2001, 90, 872–887. [Google Scholar] [CrossRef]
  136. Chang, L.L.; Milton, N.; Rigsbee, D.; Mishra, D.S.; Tang, X.C.; Thomas, L.C.; Pikal, M.J. Using modulated DSC to investigate the origin of multiple thermal transitions in frozen 10% sucrose solutions. Thermochim. Acta 2006, 444, 141–147. [Google Scholar] [CrossRef]
  137. Moussa, E.M.; Singh, S.K.; Kimmel, M.; Nema, S.; Topp, E.M. Probing the Conformation of an IgG1 Monoclonal Antibody in Lyophilized Solids Using Solid-State Hydrogen-Deuterium Exchange with Mass Spectrometric Analysis (ssHDX-MS). Mol. Pharm. 2018, 15, 356–368. [Google Scholar] [CrossRef]
  138. Pearson, D.S.; Smith, G. Dielectric analysis as a tool for investigating the lyophilization of proteins. Pharm. Sci. Technol. Today 1998, 1, 108–117. [Google Scholar] [CrossRef]
  139. Duddu, S.P.; Sokoloski, T.D. Dielectric analysis in the characterization of amorphous pharmaceutical solids. 1. Molecular mobility in poly(vinylpyrrolidone)–water systems in the glassy state. J. Pharm. Sci. 1995, 84, 773–776. [Google Scholar] [CrossRef] [PubMed]
  140. Schirò, G.; Cupane, A.; Vitrano, E.; Bruni, F. Dielectric relaxations in confined hydrated myoglobin. J. Phys. Chem. B 2009, 113, 9606–9613. [Google Scholar] [CrossRef] [PubMed]
  141. Jansson, H.; Swenson, J. The protein glass transition as measured by dielectric spectroscopy and differential scanning calorimetry. Biochim. Biophys. Acta Proteins Proteom. 2010, 1804, 20–26. [Google Scholar] [CrossRef] [PubMed] [Green Version]
  142. Smith, G.; Duffy, A.P.; Shen, J.; Olliff, C.J. Dielectric relaxation spectroscopy and some applications in the pharmaceutical sciences. J. Pharm. Sci. 1995, 84, 1029–1044. [Google Scholar] [CrossRef] [PubMed]
  143. Khodadadi, S.; Pawlus, S.; Sokolov, A.P. Influence of hydration on protein dynamics: Combining dielectric and neutron scattering spectroscopy data. J. Phys. Chem. B 2008, 112, 14273–14280. [Google Scholar] [CrossRef] [PubMed]
  144. Saleki-Gerhardt, A.; Ahlneck, C.; Zografi, G. Assessment of disorder in crystalline solids. Int. J. Pharm. 1994, 101, 237–247. [Google Scholar] [CrossRef]
  145. Shah, B.; Kakumanu, V.K.; Bansal, A.K. Analytical techniques for quantification of amorphous/crystalline phases in pharmaceutical solids. J. Pharm. Sci. 2006, 95, 1641–1665. [Google Scholar] [CrossRef] [PubMed]
  146. Young, A.L. Powder X-ray diffraction and its application to biotherapeutic formulation development. Am. Pharm. Rev. 2012, 15, 1–10. [Google Scholar]
  147. Shalaev, E.Y. The impact of buffer on processing and stability of freeze-dried dosage forms, part 1: Solution freezing behavior. Am. Pharm. Rev. 2005, 8, 80–87. [Google Scholar]
  148. Izutsu, K.I.; Kadoya, S.; Yomota, C.; Kawanishi, T.; Yonemochi, E.; Terada, K. Stabilization of protein structure in freeze-dried amorphous organic acid buffer salts. Chem. Pharm. Bull. 2009, 57, 1231–1236. [Google Scholar] [CrossRef] [Green Version]
  149. Johnson, R.E.; Kirchhoff, C.F.; Gaud, H.T. Mannitol-sucrose mixtures—Versatile formulations for protein lyophilization. J. Pharm. Sci. 2002, 91, 914–922. [Google Scholar] [CrossRef]
  150. Nunes, C.; Suryanarayanan, R.; Botez, C.E.; Stephens, P.W. Characterization and crystal structure of D-mannitol hemihydrate. J. Pharm. Sci. 2004, 93, 2800–2809. [Google Scholar] [CrossRef]
  151. Pitkänen, I.; Perkkalainen, P.; Rautiainen, H. Thermoanalytical studies on phases of D-mannitol. Thermochim. Acta 1993, 214, 157–162. [Google Scholar] [CrossRef]
  152. Telang, C.; Suryanarayanan, R.; Yu, L. Crystallization of D-Mannitol in Binary Mixtures with NaCl: Phase Diagram and Polymorphism. Pharm. Res. 2003, 20, 1939–1945. [Google Scholar] [CrossRef] [PubMed]
  153. Hawe, A.; Frieß, W. Physico-chemical lyophilization behavior of mannitol, human serum albumin formulations. Eur. J. Pharm. Sci. 2006, 28, 224–232. [Google Scholar] [CrossRef]
  154. Su, W.; Zhang, Y.; Liu, J.; Ma, M.; Guo, P.; Liu, X.; Wang, H.; Li, C. Molecular Dynamic Simulation of D-Mannitol Polymorphs in Solid State and in Solution Relating With Spontaneous Nucleation. J. Pharm. Sci. 2020, 109, 1537–1546. [Google Scholar] [CrossRef]
  155. Norrman, M.; Hubálek, F.; Schluckebier, G. Structural characterization of insulin NPH formulations. Eur. J. Pharm. Sci. 2007, 30, 414–423. [Google Scholar] [CrossRef] [PubMed]
  156. Zhang, Z.; Smith, D.L. Determination of amide hydrogen exchange by mass spectrometry: A new tool for protein structure elucidation. Protein Sci. 1993, 2, 522–531. [Google Scholar] [CrossRef] [PubMed] [Green Version]
  157. Konermann, L.; Pan, J.; Liu, Y.H. Hydrogen exchange mass spectrometry for studying protein structure and dynamics. Chem. Soc. Rev. 2011, 40, 1224–1234. [Google Scholar] [CrossRef]
  158. Tsutsui, Y.; Wintrode, P. Hydrogen/Deuterium Exchange-Mass Spectrometry: A Powerful Tool for Probing Protein Structure, Dynamics and Interactions. Curr. Med. Chem. 2007, 14, 2344–2358. [Google Scholar] [CrossRef] [PubMed]
  159. Engen, J.R. Analysis of protein conformation and dynamics by hydrogen/deuterium exchange MS. Anal. Chem. 2009, 81, 7870–7875. [Google Scholar] [CrossRef] [Green Version]
  160. Kaltashov, I.A.; Bobst, C.E.; Abzalimov, R.R. H/D exchange and mass spectrometry in the studies of protein conformation and dynamics: Is there a need for a top-down approach? Anal. Chem. 2009, 81, 7892–7899. [Google Scholar] [CrossRef] [PubMed] [Green Version]
  161. Krishna, M.M.G.; Hoang, L.; Lin, Y.; Englander, S.W. Hydrogen exchange methods to study protein folding. Methods 2004, 34, 51–64. [Google Scholar] [CrossRef] [PubMed]
  162. Wales, T.E.; Engen, J.R. Hydrogen exchange mass spectrometry for the analysis of protein dynamics. Mass Spectrom. Rev. 2006, 25, 158–170. [Google Scholar] [CrossRef]
  163. Rosa, J.J.; Richards, F.M. An experimental procedure for increasing the structural resolution of chemical hydrogen-exchange measurements on proteins: Application to ribonuclease S peptide. J. Mol. Biol. 1979, 133, 399–416. [Google Scholar] [CrossRef]
  164. Woods, V.L.; Hamuro, Y. High resolution, high-throughput amide deuterium exchange-mass spectrometry (DXMS) determination of protein binding site structure and dynamics: Utility in pharmaceutical design. J. Cell. Biochem. 2001, 84, 89–98. [Google Scholar] [CrossRef] [PubMed]
  165. Moorthy, B.S.; Zarraga, I.E.; Kumar, L.; Walters, B.T.; Goldbach, P.; Topp, E.M.; Allmendinger, A. Solid-State Hydrogen-Deuterium Exchange Mass Spectrometry: Correlation of Deuterium Uptake and Long-Term Stability of Lyophilized Monoclonal Antibody Formulations. Mol. Pharm. 2018, 15, 1–11. [Google Scholar] [CrossRef]
  166. Li, Y.; Williams, T.D.; Schowen, R.L.; Topp, E.M. Trehalose and calcium exert site-specific effects on calmodulin conformation in Amorphous solids. Biotechnol. Bioeng. 2007, 97, 1650–1653. [Google Scholar] [CrossRef]
  167. Li, Y.; Williams, T.D.; Schowen, R.L.; Topp, E.M. Characterizing protein structure in amorphous solids using hydrogen/deuterium exchange with mass spectrometry. Anal. Biochem. 2007, 366, 18–28. [Google Scholar] [CrossRef] [PubMed]
  168. Sinha, S.; Li, Y.; Williams, T.D.; Topp, E.M. Protein conformation in amorphous solids by FTIR and by hydrogen/deuterium exchange with mass spectrometry. Biophys. J. 2008, 95, 5951–5961. [Google Scholar] [CrossRef] [PubMed] [Green Version]
  169. Moorthy, B.S.; Iyer, L.K.; Topp, E.M. Mass Spectrometric Approaches to Study Protein Structure and Interactions in Lyophilized Powders. J. Vis. Exp. 2015, 98, 52503. [Google Scholar] [CrossRef] [Green Version]
  170. Majumdar, R.; Middaugh, C.R.; Weis, D.D.; Volkin, D.B. Hydrogen-Deuterium Exchange Mass Spectrometry as an Emerging Analytical Tool for Stabilization and Formulation Development of Therapeutic Monoclonal Antibodies. J. Pharm. Sci. 2015, 104, 327–345. [Google Scholar] [CrossRef]
  171. French, D.L.; Arakawa, T.; Li, T. Fourier Transformed Infrared Spectroscopic Investigation of Protein Conformation in Spray-Dried Protein/Trehalose Powders. Biopolymers 2004, 73, 524–531. [Google Scholar] [CrossRef]
  172. Desai, U.R.; Klibanoy, A.M.; Osterhout, J.J. Protein Structure in the Lyophilized State: A Hydrogen Isotope Exchange/NMR Study with Bovine Pancreatic Trypsin Inhibitor. J. Am. Chem. Soc. 1994, 116, 9420–9422. [Google Scholar] [CrossRef]
  173. Sophocleous, A.M.; Zhang, J.; Topp, E.M. Localized Hydration in Lyophilized Myoglobin by Hydrogen–Deuterium Exchange Mass Spectrometry. 1. Exchange Mapping. Mol. Pharm. 2012, 9, 718–726. [Google Scholar] [CrossRef] [Green Version]
  174. Sophocleous, A.M.; Topp, E.M. Localized hydration in lyophilized myoglobin by hydrogen-deuterium exchange mass spectrometry. 2. Exchange kinetics. Mol. Pharm. 2012, 9, 727–733. [Google Scholar] [CrossRef] [Green Version]
  175. Wilson, N.E.; Topp, E.M.; Zhou, Q.T. Effects of drying method and excipient on structure and stability of protein solids using solid-state hydrogen/deuterium exchange mass spectrometry (ssHDX-MS). Int. J. Pharm. 2019, 567. [Google Scholar] [CrossRef]
  176. Beck, A.; Wagner-Rousset, E.; Ayoub, D.; Van Dorsselaer, A.; Sanglier-Cianférani, S. Characterization of therapeutic antibodies and related products. Anal. Chem. 2013, 85, 715–736. [Google Scholar] [CrossRef] [PubMed]
  177. Manning, M.C.; Patel, K.; Borchardt, R.T. Stability of Protein Pharmaceuticals. Pharm. Res. Off. J. Am. Assoc. Pharm. Sci. 1989, 6, 903–918. [Google Scholar] [CrossRef]
  178. Manning, M.C.; Chou, D.K.; Murphy, B.M.; Payne, R.W.; Katayama, D.S. Stability of protein pharmaceuticals: An update. Pharm. Res. 2010, 27, 544–575. [Google Scholar] [CrossRef] [PubMed]
  179. Mahler, H.C.; Müller, R.; Frieß, W.; Delille, A.; Matheus, S. Induction and analysis of aggregates in a liquid IgG1-antibody formulation. Eur. J. Pharm. Biopharm. 2005, 59, 407–417. [Google Scholar] [CrossRef] [PubMed]
  180. Hong, P.; Koza, S.; Bouvier, E.S.P. A review size-exclusion chromatography for the analysis of protein biotherapeutics and their aggregates. J. Liq. Chromatogr. Relat. Technol. 2012, 35, 2923–2950. [Google Scholar] [CrossRef] [Green Version]
  181. Den Engelsman, J.; Garidel, P.; Smulders, R.; Koll, H.; Smith, B.; Bassarab, S.; Seidl, A.; Hainzl, O.; Jiskoot, W. Strategies for the assessment of protein aggregates in pharmaceutical biotech product development. Pharm. Res. 2011, 28, 920–933. [Google Scholar] [CrossRef] [PubMed] [Green Version]
  182. Lu, C.; Liu, D.; Liu, H.; Motchnik, P. Characterization of monoclonal antibody size variants containing extra light chains. MAbs 2013, 5, 102–113. [Google Scholar] [CrossRef] [Green Version]
  183. Qian, J.; Tang, Q.; Cronin, B.; Markovich, R.; Rustum, A. Development of a high performance size exclusion chromatography method to determine the stability of Human Serum Albumin in a lyophilized formulation of Interferon alfa-2b. J. Chromatogr. A 2008, 1194, 48–56. [Google Scholar] [CrossRef] [PubMed]
  184. Ejima, D.; Yumioka, R.; Arakawa, T.; Tsumoto, K. Arginine as an effective additive in gel permeation chromatography. J. Chromatogr. A 2005, 1094, 49–55. [Google Scholar] [CrossRef]
  185. Goyon, A.; Fekete, S.; Beck, A.; Veuthey, J.L.; Guillarme, D. Unraveling the mysteries of modern size exclusion chromatography—The way to achieve confident characterization of therapeutic proteins. J. Chromatogr. B Anal. Technol. Biomed. Life Sci. 2018, 1092, 368–378. [Google Scholar] [CrossRef] [Green Version]
  186. Wang, B.; Tchessalov, S.; Cicerone, M.T.; Warne, N.W.; Pikal, M.J. Impact of sucrose level on storage stability of proteins in freeze-dried solids: II. Correlation of aggregation rate with protein structure and molecular mobility. J. Pharm. Sci. 2009, 98, 3145–3166. [Google Scholar] [CrossRef]
  187. Al-Ghobashy, M.A.; Mostafa, M.M.; Abed, H.S.; Fathalla, F.A.; Salem, M.Y. Correlation between Dynamic Light Scattering and Size Exclusion High Performance Liquid Chromatography for Monitoring the Effect of pH on Stability of Biopharmaceuticals. J. Chromatogr. B Anal. Technol. Biomed. Life Sci. 2017, 1060, 1–9. [Google Scholar] [CrossRef]
  188. Carpenter, D.K. Dynamic Light Scattering with Applications to Chemistry, Biology, and Physics (Berne, Bruce J.; Pecora, Robert). J. Chem. Educ. 1977, 54, A430. [Google Scholar] [CrossRef] [Green Version]
  189. Nobbmann, U.; Connah, M.; Fish, B.; Varley, P.; Gee, C.; Mulot, S.; Chen, J.; Zhou, L.; Lu, Y.; Sheng, F.; et al. Dynamic light scattering as a relative tool for assessing the molecular integrity and stability of monoclonal antibodies. Biotechnol. Genet. Eng. Rev. 2007, 24, 117–128. [Google Scholar] [CrossRef] [PubMed] [Green Version]
  190. Wang, W.; Roberts, C.J. Protein aggregation—Mechanisms, detection, and control. Int. J. Pharm. 2018, 550, 251–268. [Google Scholar] [CrossRef]
  191. Arkawa, T.; Philo, J.S.; Ejima, D.; Tsumoto, K.; Arisaka, F. Aggregation analysis of therapeutic proteins, part 2. Bioprocess Int. 2007, 5, 36–47. [Google Scholar]
  192. Muthukutty, P.; Kato, T.; Park, E.Y. Production of human papillomavirus 6b L1 virus-like particles incorporated with enhanced green fluorescent whole protein in silkworm larvae. Biotechnol. Bioprocess Eng. 2013, 18, 514–519. [Google Scholar] [CrossRef] [Green Version]
  193. Cohan, R.A.; Madadkar-Sobhani, A.; Khanahmad, H.; Roohvand, F.; Aghasadeghi, M.R.; Hedayati, M.H.; Barghi, Z.; Ardestani, M.S.; Inanlou, D.N.; Norouzian, D. Design, modeling, expression, and chemoselective PEGylation of a new nanosize cysteine analog of erythropoietin. Int. J. Nanomed. 2011, 6, 1217. [Google Scholar] [CrossRef] [Green Version]
  194. Cleland, J.L.; Wang, D.I.C. Transient Association of the First Intermediate during the Refolding of Bovine Carbonic Anhydrase B. Biotechnol. Prog. 1992, 8, 97–103. [Google Scholar] [CrossRef] [PubMed]
  195. Hammarström, P.; Persson, M.; Freskgård, P.O.; Mårtensson, L.G.; Andersson, D.; Jonsson, B.H.; Carlsson, U. Structural mapping of an aggregation nucleation site in a molten globule intermediate. J. Biol. Chem. 1999, 274, 32897–32903. [Google Scholar] [CrossRef] [Green Version]
  196. Tomski, S.J.; Murphy, R.M. Kinetics of aggregation of synthetic β-amyloid peptide. Arch. Biochem. Biophys. 1992, 294, 630–638. [Google Scholar] [CrossRef]
  197. Lomakin, A.; Teplow, D.B.; Kirschner, D.A.; Benedeki, G.B. Kinetic theory of fibrillogenesis of amyloid β-protein. Proc. Natl. Acad. Sci. USA 1997, 94, 7942–7947. [Google Scholar] [CrossRef] [PubMed] [Green Version]
  198. Hawe, A.; Friess, W. Development of HSA-free formulations for a hydrophobic cytokine with improved stability. Eur. J. Pharm. Biopharm. 2008, 68, 169–182. [Google Scholar] [CrossRef]
  199. Ahrer, K.; Buchacher, A.; Iberer, G.; Jungbauer, A. Thermodynamic stability and formation of aggregates of human immunoglobulin G characterised by differential scanning calorimetry and dynamic light scattering. J. Biochem. Biophys. Methods 2006, 66, 73–86. [Google Scholar] [CrossRef] [PubMed]
  200. Kim, N.A.; An, I.B.; Lim, D.G.; Lim, J.Y.; Lee, S.Y.; Shim, W.S.; Kang, N.-G.; Jeong, S.H. Effects of pH and Buffer Concentration on the Thermal Stability of Etanercept Using DSC and DLS. Biol. Pharm. Bull. 2014, 37, 808–816. [Google Scholar] [CrossRef] [PubMed] [Green Version]
  201. Sukumar, M.; Doyle, B.L.; Combs, J.L.; Pekar, A.H. Opalescent appearance of an IgG1 antibody at high concentrations and its relationship to noncovalent association. Pharm. Res. 2004, 21, 1087–1093. [Google Scholar] [CrossRef] [PubMed]
Figure 1. The most common analytical techniques for the structural characterization of proteins in solid pharmaceutical forms are presented with corresponding type of measurements. Changes in secondary/tertiary structure and conformation can be studied on a global and local scale. Protein dynamics can also be traced using some of the above methods. FTIR—fourier transform infrared; NIR—near-infrared; CD—circular dichroism; ss—solid-state, HDX-MS—hydrogen-deuterium exchange mass spectrometry; DSC—differential scanning calorimetry; NMR—nuclear magnetic resonance; DRS—dielectric relaxation spectroscopy.
Pharmaceutics 13 00534 g001
Figure 2. Second derivative FTIR (fourier transform infrared) spectra of lyophilized lactate dehydrogenase (LDH). Different types of secondary structures are shown, as well as different % of remaining LDH activity after reconstitution. Reproduced with permission from [24], Elsevier, 2013.
Pharmaceutics 13 00534 g002
Figure 3. Second derivative FTIR spectra of immunoglobulin G1 (IgG1) in solid form in two different formulations with sucrose—sucrose:IgG1 = 4:1 (A) and sucrose:IgG1 = 1:4 (B). Formulations with higher sucrose content show better stability and thus preservation of the native secondary structure. Reproduced with permission from [33], Wiley, 2007.
Pharmaceutics 13 00534 g003
Figure 4. Second derivative FTIR spectra of lyophilized antibody formulations with different excipients used. The ratio between the sugars and the antibody is 1:1. Native structure spectra were recorded with pure antibody in 5 mM phosphate buffer at pH 7. Reproduced with permission from [41], Elsevier, 2005.
Pharmaceutics 13 00534 g004
Figure 5. NIR (near-infrared) spectra as second derivatives of structural studies on lyophilized cytochrome c. The influence of sucrose content on the preservation of secondary structure is shown in the left spectra, while the influence of temperature on protein stability can be seen in the right ones. Reproduced with permission from [51], Wiley, 2005.
Pharmaceutics 13 00534 g005
Figure 6. Raman spectra of native-like and denatured (non-native) freeze-dried LDH. Sample concentration 9 mg/mL, 6.5 mg of material used. Reproduced with permission from [24], Elsevier, 2013.
Pharmaceutics 13 00534 g006
Figure 7. Second derivative absorbance spectra for UV–Vis analysis of IgG at three different pH values without KCl. The largest shifts were observed for the two peaks at approximately 284 and 292 nm. Reproduced with permission from [76], Elsevier, 2008.
Pharmaceutics 13 00534 g007
Figure 8. Second derivative UV–Vis spectra for IgG. The effect of different pH is presented for five characteristic peaks. Reproduced with permission from [76], Elsevier, 2008.
Pharmaceutics 13 00534 g008
Figure 9. Solid-state (ss) fluorescence study of temperature stress effect on lyophilized protein stability. Subfigure (A) presents the fluorescence spectra at various time points during incubation at 60 °C. The decrease in intensity can be clearly observed. Further, the subfigure (B) presents the absolute fluorescence intensity versus time Reproduced with permission from [85], Elsevier, 2008.
Pharmaceutics 13 00534 g009
Figure 10. Circular dichroism (CD) spectra for reconstituted lyophilized protein incubated at two different temperatures. Changes in tertiary structure are seen in the near-UV CD spectra on the left, while changes in secondary structure are shown in the far-UV CD spectra on the right. Red spectra—lyophilized protein (control), green spectra—incubation at 37 °C, pink spectra—incubation at 60 °C. Reproduced with permission from [85], Elsevier, 2008.
Pharmaceutics 13 00534 g010
Figure 11. ssNMR study of several lyophilized protein formulations containing different amounts of lysozyme and trehalose. On the left average T is plotted against relative humidity (% RH), whereas on the right average T1 is plotted against % RH. Pharmaceutics 13 00534 i001—trehalose; Pharmaceutics 13 00534 i002—80% trehalose, 20% lysozyme; □—20% trehalose, 80% lysozyme; Pharmaceutics 13 00534 i003—lysozyme. Reproduced with permission from [116], Elsevier, 2002.
Pharmaceutics 13 00534 g011
Figure 12. Typical dielectric relaxation spectroscopy (DRS) spectra of lyophilized horse myoglobin powder. Real part (permittivity) and imaginary part (dielectric loss) are presented. Reproduced with permission from [140], ACS, 2009.
Pharmaceutics 13 00534 g012
Figure 13. XRD analysis of lyophilized human serum albumin (HSA) formulations with different amounts of mannitol (M) is depicted in figure (A). Reproduced with permission from [153], Elsevier, 2006. In figure (B) the three forms of mannitol (a—alpha, b—beta and c—delta) are depicted in structural arrangements. Reproduced with permission from [154], Elsevier, 2020.
Pharmaceutics 13 00534 g013
Figure 14. Time dependence of deuterium exchange for lyophilized monoclonal antibody in several different formulations (exposure to D2O vapor at 11% RH and 22 °C). Formulations: M3, mannitol 3:1; M1, mannitol 1:1; S6, sucrose 6:1; S3, sucrose 3:1; S2.7, sucrose 2.7:1; S1, sucrose 1:1; T3, trehalose 3:1; T1, trehalose 1:1; H3, histidine 3:1; H2, histidine 2:1; NE (no-excipient), without excipient. Ratios represent excipient/antibody w/w ratio. Reproduced with permission from [137], ACS, 2018.
Pharmaceutics 13 00534 g014
Figure 15. Size-exclusion chromatography (SEC) analyses of control monoclonal antibodies mAb1 and mAb2, antibody mAb1 after thermal stability studies for 3 months and an in-process antibody mAb2. Chromatograms (A,B) were obtained using UHPLC (ultra high-performance liquid chromatography), whereas chromatograms (C,D) were obtained by HPLC. Reproduced with permission from [185], Elsevier, 2018.
Pharmaceutics 13 00534 g015
Figure 16. SEC studies on stability of samples containing myoglobin (A), BSA (bovine serum albumine) (B), β-lactoglobulin (C), or lysozyme (D). Formulations are lyophilized (Lyo) or spray-dried (SD) and have three sugar excipients (sucrose—Suc, trehalose—Tre, mannitol—Mann). Reproduced with permission from [175], Elsevier, 2019.
Pharmaceutics 13 00534 g016
Figure 17. Dynamic light scattering (DLS) analyses for a desorbed quadrivalent human papillomavirus virus-like particles (HPV VLP) vaccine at different pH values: (A) at pH 6.2, (B) at pH 4.0, (C) at pH 8.0. Data are shown as intensity size distribution. Aggregate formation by forced degradation conditions can be observed in Figures (B,C), pH 4.0 and 8.0, respectively. Reproduced with permission from [187], Elsevier, 2017.
Pharmaceutics 13 00534 g017
Table 1. Characteristic amide band frequencies and their associated secondary structures [64].
Frequency of the Band (cm−1)Amide RegionVibrationsType of 2nd Structure
1680
1670–1680
1650–1655
1640
Amide IH-bonded C=O stretchβ-Turn
β-Sheet and β-barrel
α-Helix
Loose β-sheet
1300–1340Amide IIIN–H and C–H bendα-Helix
1260Disordered
1235–1250β-Sheet
930–950BackboneN–Cα–C stretchα-Helix
Table 2. The effect of sucrose and histidine as excipients on Tg is presented in the table. The moisture content was measured by Karl Fischer titration [137].
FormulationspHSucrose/mAb
Ratio (w/w)
Histidine/mAb Ratio (w/w)Moisture
Content
Tg
5H25 2:12.82 ± 1.3194
5S151:1 2.72 ± 0.24ND
5S1H0.551:10.5:11.67 ± 0.7790
5S1H151:11:12.57 ± 0.0190
6H26 2:12.79 ± 0.67106
6S161:1 2.01 ± 0.2293
6S1H0.561:10.5:11.60 ± 0.3995
6S1H161:11:11.95 ± 0.38101
H26.8 2:10.99 ± 0.34105
S16.81:1 1.10 ± 0.03ND
S1H0.56.81:10.5:12.55 ± 0.1394
S1H16.81:11:12.12 ± 0.7698
Table 3. Overview of the methods discussed above with some.
MethodPhysical PrinciplesSensitivityPotential Damages ProsCons
FTIRC=O, N–H and C–N vibrations are measured as absorption or emission due to infrared lightLow to medium (on a global level)Protein can be damage if too much pressure is applied when analyzing in ATR modeFast measurement, easy setup, non-expensive equipment, no hazardous chemicals are used, with ATR mode the sample can be recovered, small amount of sample neededOnly secondary structure can be evaluated, if KBr pellet mode is used, the sample cannot be recover, only analysis on a global level can be done and cannot provide site-specific information
on specific portions of the protein sequence and their
interactions with excipients, often unable to detect subtle structural differences
NIRC=O, N–H and C–N vibrations are measured in the near-infrared regionLow to medium (on a global level)No damagesFast analysis, small amount of sample needed, no inert gas purging, easy setup and non-expensive equipmentOnly secondary structure on a global level can be evaluated, water can interfere within protein spectra in some cases, cannot provide site-specific information
on specific portions of the protein sequence and their
interactions with excipients, often unable to detect subtle structural differences
RamanC=O, N–H and C–N vibrations are measured as inelastic scattering after light excitationMedium to high
(on a global level)
Samples are usually damaged due to laser light irradiationVery small amount of sample needed, Samples cannot be recovered, longer time needed for measurements, more difficult equipment setup, only global level analysis
UV–VisDisplacement of absorption (of UV or visible light) peaks is measuredLow to medium (on a global level)No damagesEasy and non-expensive equipment setup, samples can be recovered, fast analysisOnly global level analysis of tertiary structure, cannot provide site-specific information
on specific portions of the protein sequence and their
interactions with excipients, often unable to detect subtle structural differences
FluorescenceEmission of residual aromatic amino acids is measured after absorption of light or electromagnetic radiationMedium (on a local level)No damagesTertiary structure on a local level, intensity and peak maxima position can be measuredHigher amount of sample needed, sample preparation for measurement is crucial
CDDifference in absorbance is measured, involving circularly polarized light (left- and right-handed light)Medium
(on a global level)
No damage (except when temperature dependence experiment is applied)Secondary and tertiary structure can be analyzed, small amount of sample neededOnly global level analysis, if temperature dependent experiment is applied the sample cannot be recovered, nitrogen gas purging needed
ssNMR1H, 13C, 15N chemical shifts are measured after magnetic field excitation of the nuclei sampleHigh
(on a global and local level)
No damageConformation and dynamics can be measured on a global and local level, different nuclei can be analyzed (proton, carbon, nitrogen)Expensive equipment, long measurement time, higher amounts of sample are needed, only in some cases the samples can be recovered
DSCChange in heat capacity at Tg is measured (the difference in the amount of heat required to increase the temperature of a sample and reference is measured as a function of temperature)High to medium
(on a global level)
Sample is damaged and cannot be recoveredConformational changes and crystallinity of the sample can be evaluatedSample cannot be recovered, only global level analysis, necessary to have well-characterized drug compounds
DRSRational motions of dipole-bearing groups are measured (as a function of frequency)High to medium
(on a global and local level)
Sample can be damagedGlobal and local analysisSample usually cannot be recovered, higher amounts of sample are needed, difficult sample preparation, water may interfere with the sample analysis
XRDCrystal structure is evaluated by irradiating the sample material with X-rays and measuring the intensities and scattering angles that leave the materialHigh
(on a global level)
Samples can be damaged due to X-ray irradiationConformation and crystallinity of samples can be evaluatedOnly global level analysis, sample usually cannot be recovered, expensive equipment
ssHDX-MSAmide hydrogen exchange with deuterium in solid (by exposure to D2O) is measured with LC–MSHigh
(on a global and local level)
Samples are damaged due to deuteration and MS analysisVery good correlation with aggregates formation and physical stability on storage, when peptide digestion is employed the samples can be analyzed on a local level providing also site-specific
information on interactions between the protein and excipients
Samples cannot be recovered, difficult setup and expensive equipment
SECChromatographic method in which molecules are separated by size, and in some cases molecular weightHigh
(on a global level)
Can be damage in some cases by mobile phase or columnStandard method for aggregation studies, small amount of sample is needed, fast method if automation is employed, also degradation products can be detectedExpensive equipment, some particles may not be detected or separated
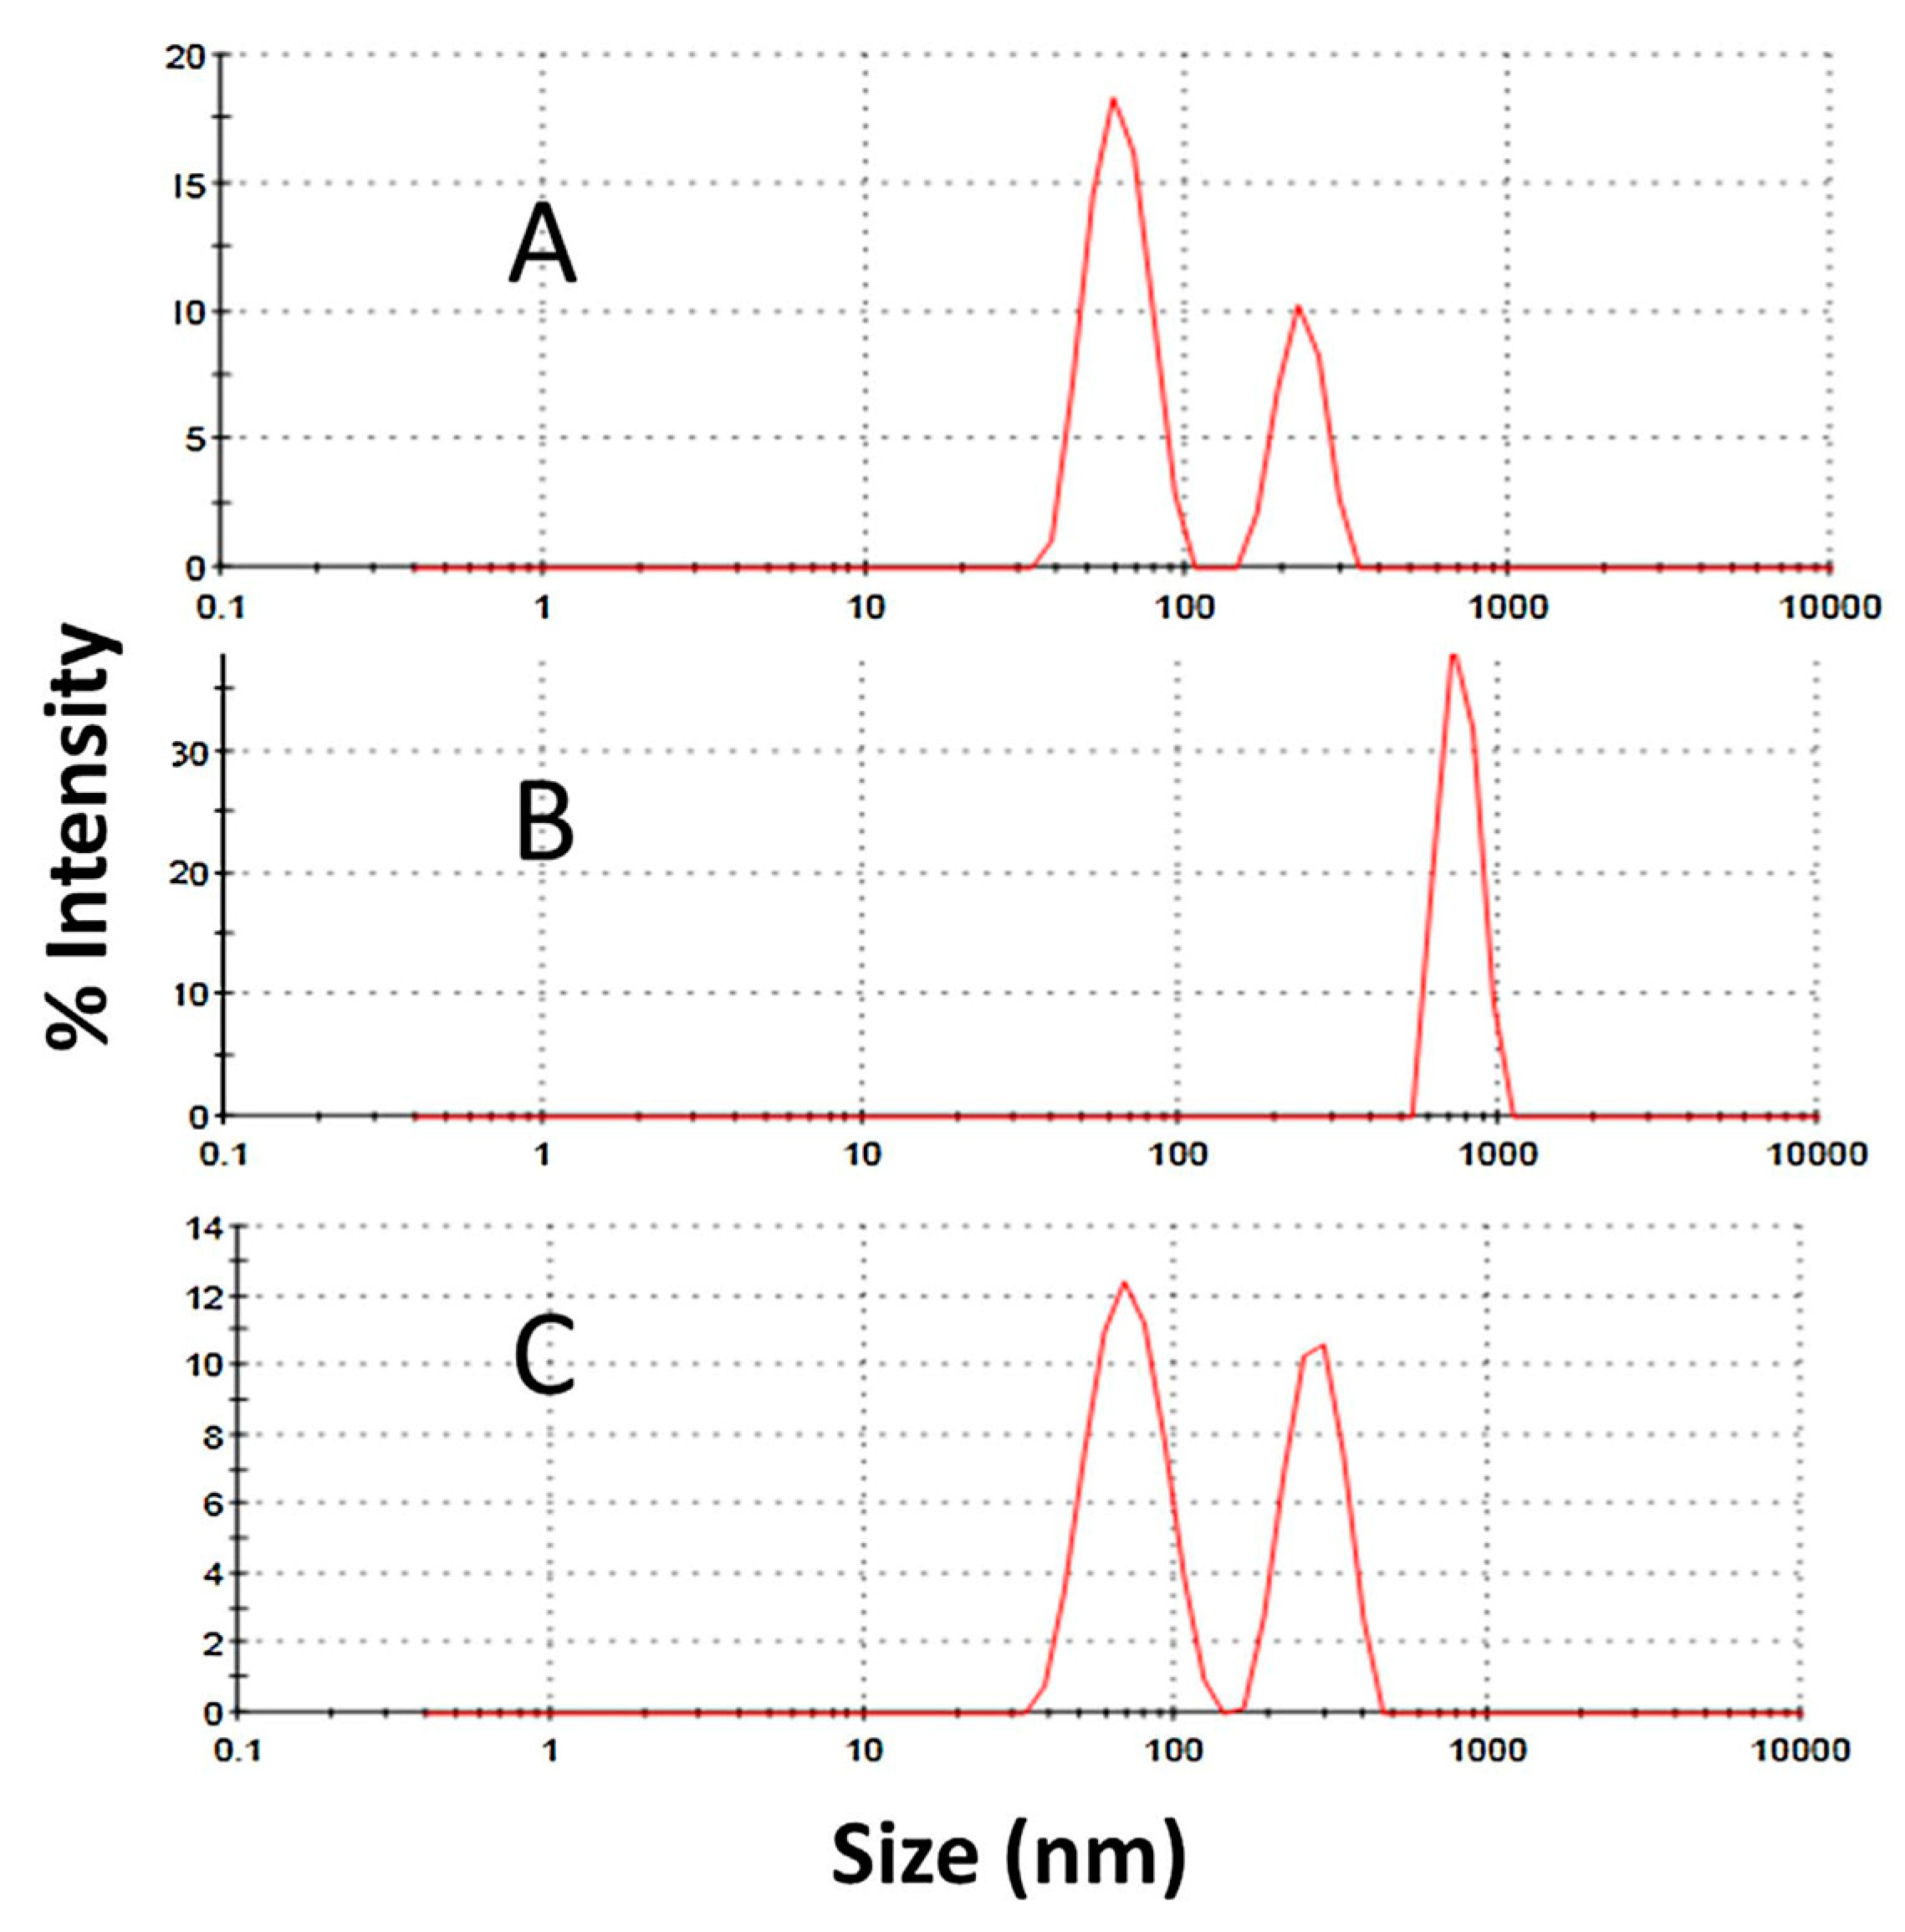
DLSMeasures the Brownian motion of macromolecules in solution that arises due to bombardment from solvent molecules, and relates this motion to the size of particles to determine their size distribution High
(on a global level)
If temperature dependence or zeta-potential is measured, samples are damaged (aggregated)Can analyze particles that may not be seen with SEC, easy setup and non-expensive equipment, fast analysisCannot differentiate molecules that are closely related (monomer and dimer) since it is a low- resolution method, it must be used on highly dilute solutions, restricted to transparent samples, very sensitive to temperature and solvent viscosity
Abbreviations: FTIR—fourier transform infrared; NIR—near-infrared; CD—circular dichroism, ssNMR—solid-state nuclear magnetic resonance; DSC—differential scannign calorimetry; DRS—dielectric relaxation spectroscopy; XRD—X-ray diffraction; ssHDX-MS—solid-state hydrogen-deuterium exchange mass spectrometry; SEC—size-exclusion; DLS—dynamic light scattering; ATR—attenuated total reflectance; Tg—glass transition temperature; LC-MS—liquid chromatography with mass sepctrometry; MS—mass spectrometry.
Table 4. Comparison of different methods used for analysis of the same or similar protein sample.
MethodProsConsInformation Comparison with Other Methods
FTIRSecondary structure determination, samples can be recovered, small amount of sample needed.Structure determination only on a global level, poor correlation with other methods and especially SEC.Amide I region was analyzed for each formulation and used to compare protein secondary structure. Little difference was observed with either changes in excipient or processing conditions, with the exception of β-lactoglobulin, where for spray-dried samples an increase in the heterogeneity can be deducted.In comparison to ssHDX-MS, the results were relatively inconsistent and poor correlation was observed with results from SEC analysis. On the other hand is the only method in this study to characterize proteins secondary structures in solid. Further, is a fast and routinely analysis.
FluorescenceTertiary structure determination, samples can be recovered.Poorer correlation with stability studies than with the ssHXD-MS. Measurements are not possible with lower concentrations.Changes in tertiary structure correspond to shifts in the peak. Fluorescence spectra showed process related differences for BSA, they may be attributed to hydration differences, since spray-dried samples have lower moisture content. Lysozyme samples showed significant differences in peak position that is depended on formulation and processing conditions. Mannitol-containing formulations displayed red shifts, whereas sucrose samples displayed the blue ones. No difference was observed with trehalose samples.In comparison to ssHDX-MS has weak correlation with long-term storage stability. On the other hand is quicker and has an easy equipment setup. Similar to FTIR is the only method for tertiary structure characterization, which is relatively fast and routinely.
XRDOnly method with DSC for sugars crystallization analysis.Information only on global level with no sample recovery.Formulations containing sucrose or trehalose were all completely amorphous, whereas mannitol samples showed minor peaks on XRD, indicating the presence of crystalline mannitol.Mannitol samples showed some crystallization, which was observed also with DSC. The mannitol crystallization might be reflected in poorer storage stability, which was confirmed with ssHDX-MS and SEC.
DSCTogether with XRD analyzes and confirms samples crystallinity, as well as measures samples Tg, which can be compared. Samples cannot be recovered, the information only on a global level only.Tg values were determined for sucrose and trehalose formulations, whereas Tm was determined for mannitol formulations. Sucrose samples had lower Tg, whereas trehalose samples showed process-dependent differences in Tg, with higher values for spray-dried samples. For samples with mannitol, the Tm confirmed crystallinity.The results do not correlate good with storage stability measured by SEC, except for mannitol samples, which have shown to be crystalline and therefore less stable on long-term. Mannitol crystallization was observed also in XRD analysis.
ssHDX-MSGood correlation with storage stability, analysis on global and local level (if peptide digestion is employed).Expensive and rather complex equipment. Samples cannot be recovered after analysis. Longer times require for the experiments.Mannitol formulations showed greater deuterium uptake and, hence, decreased storage stability (probably due to phase separation caused by the crystallization of the excipient), which correlates great with highest aggregate content measured by SEC. Similar results were obtained with either the deconvoluted peak area or the maximum deuterium incorporation.In contrast to FTIR and fluorescence, ssHXD-MS gives a very good and consistent correlation with aggregation studies with SEC. On the other hand, the method requires much longer times for the analyses and it is not yet a routinely measurement.
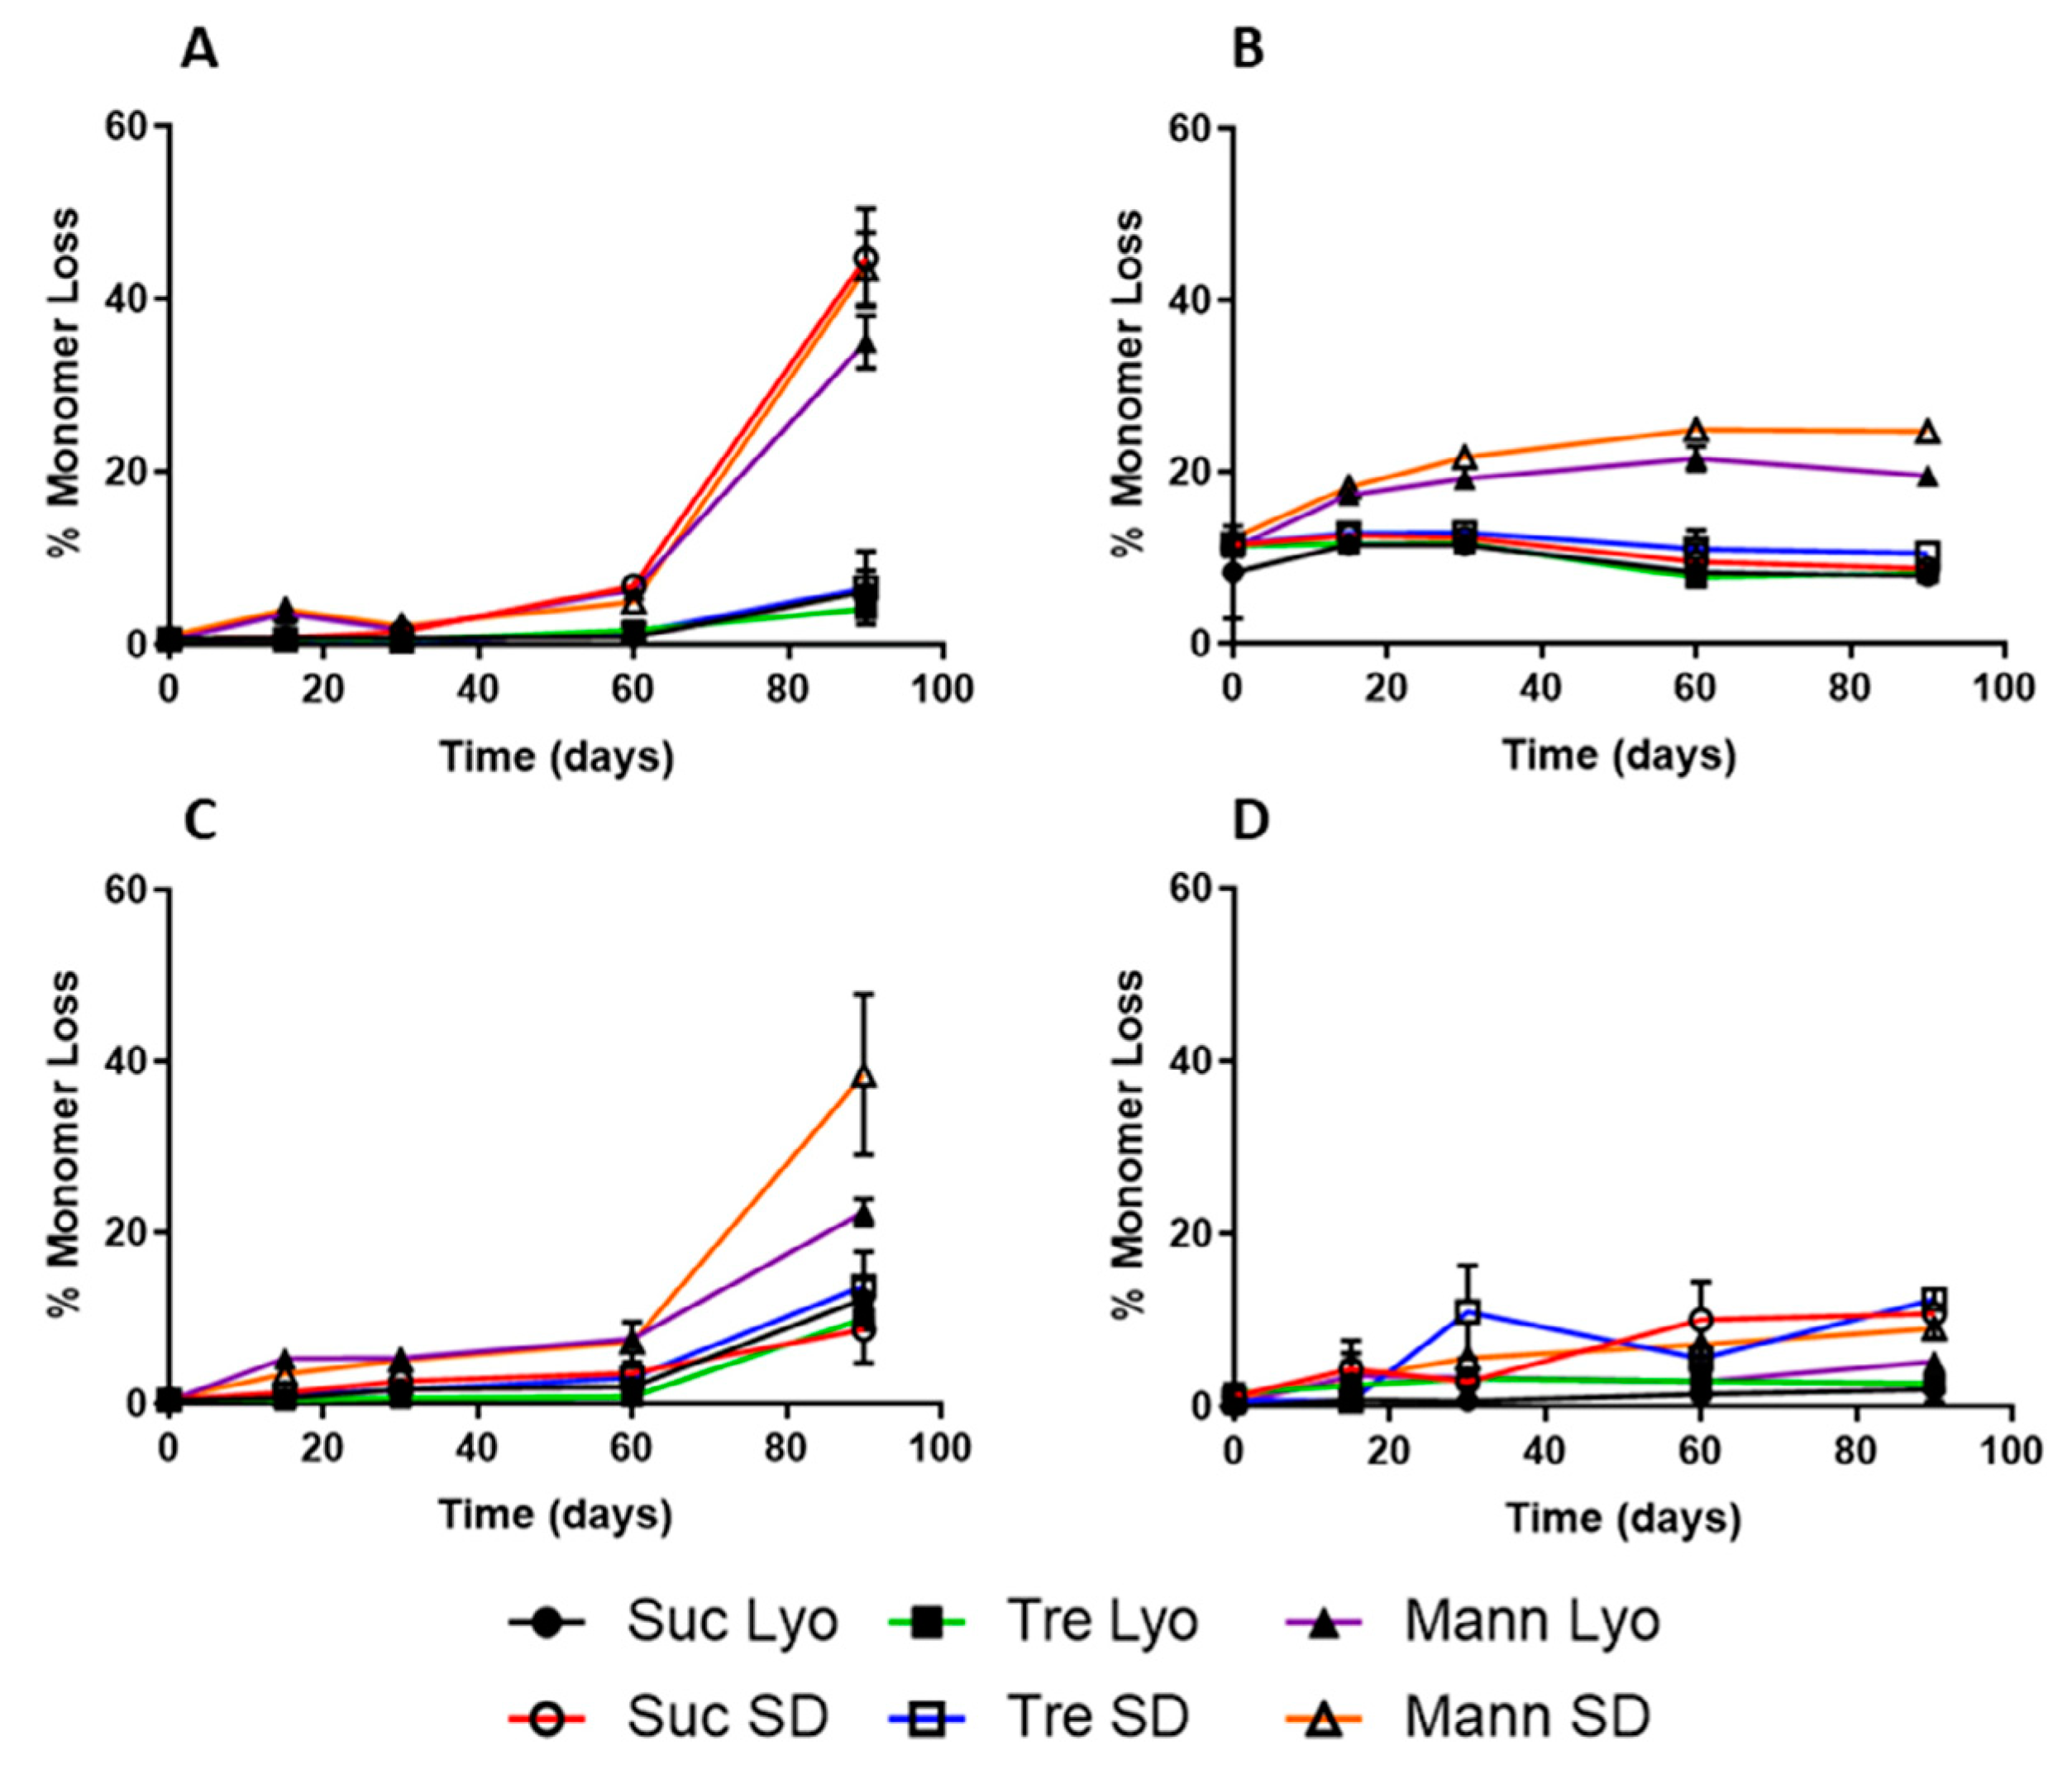
SECVery good and reliable (standard) method for aggregation analysis and storage stability studies.Measurements are done in solution—conditions only after the reconstitution of proteins; more expensive equipment.The percentage of aggregates was greatest in mannitol formulations containing mannitol, with the exception of myoglobin spray-dried with sucrose and all formulations of lysozyme (spray-dried samples had greater aggregate content).Provides information on long-term stability as measures the loss of monomer (aggregates formation). Despite ssHDX-MS, that can predict aggregation to certain degree due to good correlation with storage stability, SEC is the only method to really measure the extent of aggregation that occurred within the samples.
Abbreviations: FTIR—fourier transform infrared; XRD—X-ray diffraction; DSC—differential scannign calorimetry; ssHDX-MS—solid-state hydrogen-deuterium exchange mass spectrometry; SEC—size-exclusion.
Publisher’s Note: MDPI stays neutral with regard to jurisdictional claims in published maps and institutional affiliations.

