Abstract
A transcriptome-wide analysis of human liver for demonstrating differences between young and old humans has not yet been performed. However, identifying major age-related alterations in hepatic gene expression may pinpoint ontogenetic shifts with important hepatic and systemic consequences, provide novel pharmacogenetic information, offer clues to efficiently counteract symptoms of old age, and improve the overarching understanding of individual decline. Next-generation sequencing (NGS) data analyzed by the Mann–Whitney nonparametric test and Ensemble Feature Selection (EFS) bioinformatics identified 44 transcripts among 60,617 total and 19,986 protein-encoding transcripts that significantly (p = 0.0003 to 0.0464) and strikingly (EFS score > 0.3:16 transcripts; EFS score > 0.2:28 transcripts) differ between young and old livers. Most of these age-related transcripts were assigned to the categories ‘regulome’, ‘inflammaging’, ‘regeneration’, and ‘pharmacogenes’. NGS results were confirmed by quantitative real-time polymerase chain reaction. Our results have important implications for the areas of ontogeny/aging and the age-dependent increase in major liver diseases. Finally, we present a broadly substantiated and testable hypothesis on a genetically governed ‘aging cascade’, wherein PPP1R10 acts as a putative ontogenetic master regulator, prominently flanked by IGFALS and DUSP1. This transcriptome-wide analysis of human liver offers potential clues towards developing safer and improved therapeutic interventions against major liver diseases and increased insights into key mechanisms underlying aging.
1. Introduction
According to present-day criteria, the script for the evolutionarily founded dramaturgy of the individual lifetime of early Homo sapiens lacks a chapter for old age: The average life expectancy of Paleolithic hunter–gatherers from the appearance of Homo sapiens ~200,000 years ago was ~30 years [1]. While there was an increase in longevity in modern humans of the Early Upper Paleolithic ~50,000 years ago [2], our species has only today arrived at an average global life expectancy of 72.81 years (United Nations figure for 2021). Centenarians are rare, and the longest confirmed lifespan among supercentenarians is 122 years [3]. In the distant past, an individual thus left the stage long before entering old age as we understand it today. The genetic underpinnings of humans were therefore shaped on the requirement to optimize and adapt biological functions for a phase of life nowadays considered as young. Current lifespans were out of reach and their needs, therefore, biologically irrelevant. This bequeathed today’s humans with genetic hardware whose regulation and copyediting in progressed age increasingly suffer from error and inaccuracy, thus entailing age-related disease and premature demise. Our work joins previous efforts to deal with this imperfect legacy.
With its well-known altruistic function, but also fending for itself, the liver stands out as an organ of major systemic importance. This justifies the approach of a whole-transcriptome analysis of the human liver, with the objective to reveal decisive differences between young and old transcriptomes. Aiming to identify all functional elements in the human genome [4], the ENCODE Project could in 2012 assign functions to ~80% of the genome in particular outside of well-studied protein-coding regions, including sequence variants linked to human disease [5]. Similarly, it was interesting for us to see whether previously inapparent transcripts stand out prominently upon age-related liver transcriptome analysis. We thus for the first time identified the most salient aging-related differences in the liver transcriptome. Data relevance was validated by statistical significance and a bioinformatics approach determining Ensemble Feature Selection (EFS) scores [6].
Importantly, mRNA translation rates prognosticate associated protein levels with median correlations of ~0.9 between predictions and measurements [7]. Doubts about the soundness of this reasoning [8] were refuted convincingly [9]. Thus, our findings on the liver transcriptome can serve for harnessing their inherent opportunities to better address hepatological, pharmacological, and geriatric needs, as well as to gain further insight into the overarching topic of aging. Data were assigned to distinct functional categories, where most important age-dependent differences were found in the ‘regulome’ [10,11] category and the ‘regulome–regeneration–inflammaging’ intersection. Certain genetic components of the regulome thus are of major biological relevance with regard to individual aging. They were harmonized with an ‘axis of aging’ characterized previously [12,13] to be expanded into a regulatory ‘aging cascade’ in our present article.
2. Patients, Materials and Methods
2.1. Liver Tissue
The study protocol conformed to the revised 2008 Declaration of Helsinki and was approved by the Ethics Committees of the University Hospitals Essen (file number: 12-5232-BO; 6 December 2012) and Magdeburg (file number: 208/17; 8 January 2018). Liver tissue samples were collected during the periods of 2013–2017 (Essen) or 2018–2019 (Magdeburg), respectively.
All patients were of Caucasian descent. They provided informed consent before undergoing partial liver resections due to the underlying diseases specified in Table S1. This table also provides further demographic information and clinical characteristics, including comorbidities and further information gathered from the patients’ files.
According to standard good practice, the major portions of resected tissue—including both diseased as well as surrounding healthy tissue—were examined by the pathologist. For the present study, we therefore only investigated liver tissue samples from the periphery of resected tissue that, because of unimpaired appearance and structure, were considered as ‘normal’. After quality inspection, liver tissue samples eventually underwent the methodologic steps required for enabling transcriptome-wide analysis (see below).
2.2. RNA Preparation
Tissue was homogenized in 1 mL of Trizol using the QIAshredder equipment (Qiagen, Hilden, Germany), and RNA was isolated as described before [14]. Pellets were resuspended in 100 µL of nuclease-free water and purified using the RNeasy Mini Kit (Qiagen). RNA was eluted with 50 µL of nuclease-free water. Concentration and purity were determined with the NanoDrop One spectrophotometer (Thermo Fisher, Dreieich, Germany). Samples were treated with DNAse (Turbo DNA-free kit (Ambion/Invitrogen, Thermo Fisher)) at 37 °C for 60 min. RNA was precipitated overnight with ethanol containing sodium acetate at −80 °C. Precipitates were collected by centrifugation (30 min, 17,000× g, 4 °C). Pellets were dried for 30 min at RT and resuspended in 50 µL nuclease-free water (or 30 µL in case that the amount of RNA measured before DNase digestion was <200 ng/µL) according to the amount of RNA measured before DNase digestion. For confirmation or correction, RNA concentrations and purities were determined again (cf. above). Samples were stored at –80 °C until processing.
2.3. RNA Quality Assessment
Using 20 µL preparations, each, of DNA-free RNA from 37 patients, the RNA quality number (RQN) for each RNA preparation was determined using the Qubit system (Thermo Fisher) and by electrophoretic separation. While an RQN > 7 was considered suitable for sequencing, slightly lower RQNs (minimum: 6.2) were considered sufficient in the absence of degradation evidenced by chromatography. Subsequently, next-generation sequencing was performed.
2.4. Next-Generation Sequencing (NGS)
RNA obtained from homogenized liver tissue samples was subjected to NGS. Samples were assigned to Group I (Young; <49 years. (23–48, median: 34.3); 3 males, 6 females) and Group II (Old: >74 years. (75–79, median: 78.6); 6 males, 2 females) (cf. Table S1). Transcriptome-wide analysis revealed a total of 60,617 RNA transcripts. Counts ranged from 1.156–1.865 × 10⁷ (Group I) and 1.020–2.080 × 10⁷ (Group II). In transcriptome profiling by RNA sequencing, the number of mapped reads for a given gene depends on its expression level, length, and sequencing depth. Thus, transcript expression levels are normalized as transcripts per million (TPM), which represent the relative transcript abundance among a population of sequenced transcripts [15]. We defined values of >50 TPM for ≥1/group as relevant for further investigation (see also the Results section).
2.5. Quantitative Real-Time Polymerase Chain Reaction (qRT-PCR)
Remainders of the RNA preparations applied to NGS were adjusted to 125 ng/µL. RNA at 1 µg per sample was transcribed to cDNA using the QuantiNova Reverse Transcription Kit (Qiagen, Hilden, Germany) in a Mastercycler gradient (Eppendorf, Hamburg, Germany) at 25 °C (3 min), 45 °C (12 min), 85 °C (5 min), and 20 °C (2 min). The reaction volume of 20 µL was diluted to 10 ng/µL by adding 80 µL of nuclease-free water and stored at −20 °C. Wet lab-validated primers from the QuantiNova LNR PCR assay (Qiagen) were deployed for the following targets given in alphabetical order: AGO2, CFLAR, CYP3A43, DUSP1, EGR1, FAH, FLNA, GATA4, HSD17B14, IGFALS, ITSN1, KIAA0040, LIPC, PALLD, PPP1R10, and TFF3, as well as PPIA as a reference (for sequences, see Table S2). QRT-PCRs were performed in a LightCycler 480 (Roche Diagnostics, Rotkreuz, Switzerland) with the QuantiNova SYBR Green PCR Kit (Qiagen) in reaction volumes of 18 µL/well containing 2 µL (20 ng) template, 2 µL probe assay (10× primer or reference), 9 µL QuantiNova probe master mix, and 5 µL RNase-free water. Amplification was executed at 95 °C (2 min), with 45 cycles at 95 °C (5 s, each), 60 °C (10 s, each), and 70 °C (30 s), with the melting curve from 70 °C to 95 °C in 50 cycles increasing by 0.5 °C/s per cycle. Differences in relative gene expressions were calculated from the crossing point (Cp) values for Groups I and II:
2.6. Data Analyses
2.6.1. Statistics
Statistical analyses were performed with Microsoft Office Excel 2019 (Microsoft, Redmond, WA, USA) and Graph Pad 8.0 (GraphPad Software, La Jolla, CA, USA). Differences of gene expressions between Groups I and II were calculated in MS Excel by the Mann-Whitney non-parametric test using the Real Statistics Resource Pack add-on, which is available at http://www.real-statistics.com (accessed on 4 March 2021). Significant p-values (<0.05) of 257 genes were confirmed with Graph Pad 8.0.
2.6.2. EFS
Feature selection methods are part of the development of classification strategies within the supervised learning area of artificial intelligence. They are often used to address the problem of identifying characteristic subsets of features present in large and complex datasets by ranking features in order of importance, and by allowing for the elimination of features irrelevant to the classification question, thus reducing the dimensionality and complexity of the data [16]. EFS addresses limitations identified by the use of single feature selection strategies often used in medical modeling (such as the Gini index), which have been shown to produce unstable results [17] by the aggregation of multiple feature selection methods. This strategy has been successfully applied to direct oncogene discovery from cancer screening data [18], predict metastasis [19], and identify early sepsis molecular signatures [20]. We here applied the EFS method as described in [6], where eight different Single Feature selection methods are combined, with their outputs normalized to avoid biases inherent to any single method. EFS software can be downloaded free of charge as an R-package from the Comprehensive R Archive Network (CRAN) [6] or, alternatively, used as a web application at http://EFS.heiderlab.de (accessed on 7 March 2021). ‘R’ stands for the programming language, i.e., R ≥ 3.0.2.
2.7. Data Availability
All raw and processed sequencing data generated in this study have been submitted to the NCBI Gene Expression Omnibus (GEO; https://www.ncbi.nlm.nih.gov/geo/, accessed on 7 March 2021). The datasets and the computer code produced in this study are available in the following databases: https://www.ncbi.nlm.nih.gov/geo/query/acc.cgi?acc=GSE183915 accessed on 7 March 2021.
3. Results and Discussion
3.1. Methodology and Strategy
Tumor-surrounding healthy areas of resected tissue from patients undergoing surgical intervention for malignancy were processed for whole-transcriptome analysis to investigate age-dependent differences between protein-encoding mRNAs. As detailed in the Patients and Methods section, isolated and quality-assured RNA was subjected to next-generation sequencing (NGS). Total transcripts were normalized to transcripts per million (TPM), and protein-encoding transcripts were identified and narrowed down to transcripts of high age-dependent (Group I: <40 years; Group II: >74 years) relevance by applying both the Mann–Whitney nonparametric test and EFS software generating EFS scores (Figure 1a).
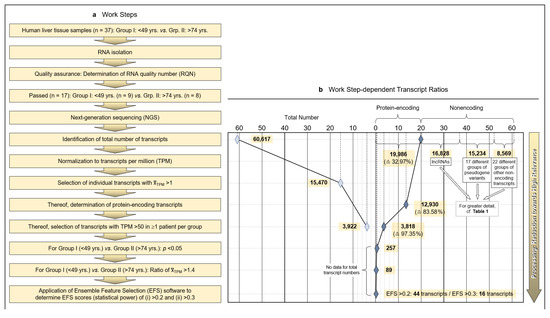
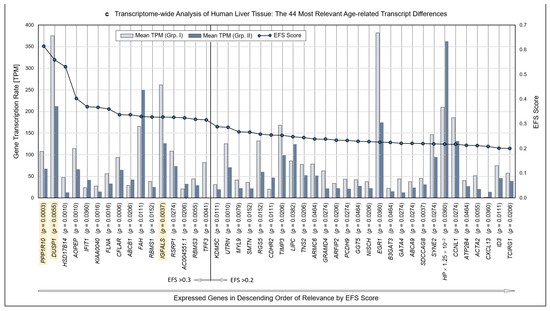
Figure 1.
Methodology and strategy for transcriptome-wide analysis of human liver tissue, resulting protein-encoding and non-encoding transcripts, and most relevant age-related transcript differences. (a) Flow diagram of the works steps from the initial sampling of human liver tissue and the detection of a total of 60,617 hepatic RNA transcripts down to the eventual EFS software-supported pinpointing of 16 gene transcripts of major interest related to their different expressions in age Groups I and II. (b) Diagram depicting the ratios upon narrowing down the complete transcriptome of the human liver to the most relevant age-related differences in hepatic gene expression, with Ensemble Feature Selection (EFS) scores of >0.2 or >0.3, respectively. Step-wise results are even-leveled with the respective work steps in panel (a) and are differentiated between total transcripts (left) and protein-encoding vs. non-encoding RNAs (right). After selecting for >50 transcripts per million (TPM) (cf. panel (a)), only protein-encoding transcripts were determined. Transcripts initially enumerated comprised 19,986 protein-encoding and 40,631 nonencoding RNAs, with the latter differentiated as shown in panel (b) and further broken down into their biotypes in Table 1. (c) Comparisons of the 44 mean gene transcription rates between Groups I and II resulting from the final processing step in panel (b), aligned in sequence of descending EFS scores.
3.2. Limitation of Gene Expression to Exceptional Age-Dependent Differences
Initially, a total number of 60,617 hepatic transcripts was identified, which included 19,986 protein-encoding transcripts. Employing the step-wise procedure sketched in Figure 1a, this number was narrowed down to 44 transcripts of high (EFS scores > 0.2) and 16 transcripts of outstanding relevance (EFS scores > 0.3) as to their age-dependent differences between Groups I (Young) and II (Old) (Figure 1b; Table S3). Note that after selecting for >50 TPM, only protein-encoding transcripts were determined. Table 1 details the biotypes of the initially detected transcripts.

Table 1.
Biotypes 1 of initially detected transcripts. 2 (Abbreviation: TPM, transcripts per million.).
3.3. Identification of Transcripts Displaying High Age-Dependent Differences
Identified RNAs are aligned in sequence of descending EFS scores, further mentioning the p values of the transcripts’ age-dependent differences (Figure 1c; the genes highlighted therein will be referred to below). For the complete set of associated data, see Table S3. Further accompanying information is presented in Table S4. As detailed therein, ≥3 of the high-relevance transcripts, each, accumulated on chromosomes 1, 3, 5, 11, and 22; these associations may spur further research as to whether certain genes or groups of genes might be transcriptionally co-regulated.
3.4. Functional Categorization of Selected Transcripts
Because to their functional profiles, 25 of the 44 protein-encoding transcripts displayed in Figure 1c were assigned to the categories ‘regulome’, ‘regeneration’, ‘inflammaging’, ‘pharmacogenes’, and ‘miscellaneous’ (Figure 2 and Figure 3) and to the prominent intersections ‘regulome-regeneration’ and ‘regulome-inflammaging’ (Figure 3). These categories are the basis for expanding below on the general age-related implications, disease-specific associations, and overarching ontogenetic importance of these hepatic transcripts.
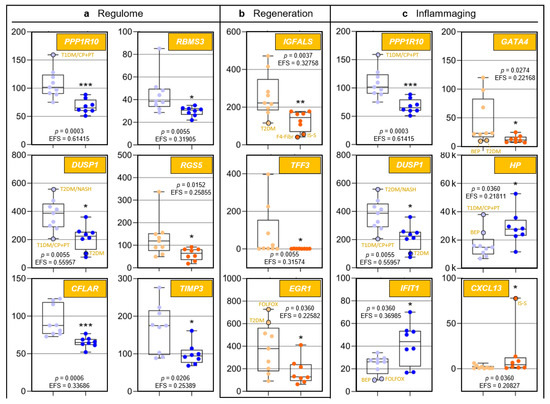
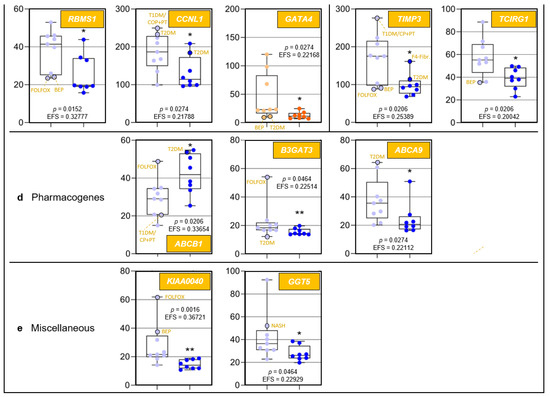
Figure 2.
Age-related differences of transcripts assigned to regulome, inflammaging, liver regeneration, and pharmacogenes, as well as non-assigned hepatic transcripts. In each category, data are depicted in sequence of their relevance determined by Ensemble Feature Selection (EFS). Each graph compares Group I/Young (left) to Group II/Old (right). Where ratios between Groups I and II differ by at least a factor of × 2, data are depicted in red; all other data are shown in blue (cf. Table S3). Results are expressed as means ± standard deviation (SD) in the form of box and whisker plots. Significances between Group I vs. II transcript expressions range from p = 0.0464 to p = 0.0006 (i.e., *, **, or ***, respectively). If relevant, graphs are represented in different categories. (a) Regulome: CASP8- and FADD-like apoptosis regulator (CFLAR); RNA-binding motif single-stranded interacting protein 1 (RBMS1); RNA-binding motif single-stranded interacting protein 3 (RBMS3); and regulator of G protein signaling 5 (RGS5). (b) Regeneration: insulin-like growth factor-binding protein acid-labile subunit (IGFALS), trefoil factor 3 (TFF3), early growth response 1 (EGR1), and cyclin L1 (CCNL1). (c) Inflammaging: interferon-induced protein with tetratricopeptide repeats 1 (IFIT1); tissue inhibitor of metalloproteinase 3 (TIMP3); GATA-binding protein 4 (GATA4); C-X-C motif chemokine ligand 13 (CXCL13); and T-cell immune regulator 1, ATPase H+ transporting V0 subunit a3 (TCIRG1). (d) Pharmacogenes (we not only include enzymes, but also systemic and cellular drug transporters into the definition of this term): ATP-binding cassette subfamily B member 1 (ABCB1); β-1,3-glucuronyltransferase 3 (B3GAT3); ATP-binding cassette subfamily A member 9 (ABCA9); and haptoglobin (HP). (e) Miscellaneous: The unknown protein KIAA0040 (KIAA0040); and γ-glutamyltransferase 5 (GGT5). For an integrated systematic representation and classification of the findings, see Figure 3. For additional information, we encircled datapoints (black) denoting extremes or outliers potentially associated with certain treatment regimens or comorbidities, respectively. Abbreviations (orange lettering) for preoperative treatments in context with the indications requiring partial liver resection or for diseases in addition to those indications: CP/PT, carboplatin + paclitaxel; F4-Fibr, fibrosis grade 4; FOLFOX, folinic acid + fluorouracil + oxaliplatin; IS-S, in-situ split (preoperatively); BEP, bleomycin + etoposide + cisplatin; NASH, non-alcoholic steatohepatitis; T1DM, type 1 diabetes mellitus; T2DM, type 2 diabetes mellitus.
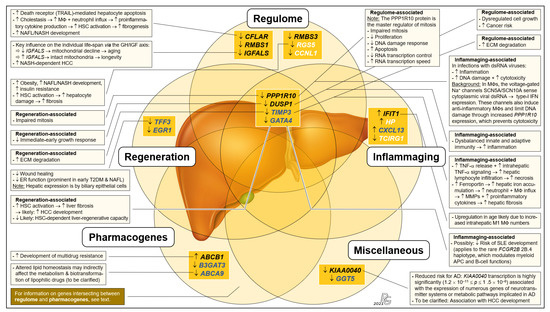
Figure 3.
Integrated systematic representation and classification of the age-dependent expression of the liver transcriptome. Transcripts assigned to the categories ‘regulome’, ‘inflammaging’, ‘liver regeneration’, ‘pharmacogenes’, and ‘miscellaneous’ are depicted as overlapping sets. In each set, transcribed genes are listed in sequence of their EFS scores. The singular ‘regulome’ category and the ‘regulome–liver regeneration–inflammaging’ intersection include the genes IGFALS as well as PPP1R10 and DUSP1, respectively, which are proposed as key elements of an ‘aging cascade’ discussed below and depicted in Figure 4. According to age-related differences, transcripts are either most relevant (EFS > 0.3; black font), display broader variances in Group I (cf. Figure 2) (EFS > 0.2; blue), or are other relevant transcripts (EFS > 0.2; white). Transcript changes in Group II vs. Group I are indicated as downregulated (↓) or upregulated (↑), and the most important consequences in aged individuals are characterized as downregulated/decreased (↓), upregulated/increased (↑), or process/consequence (→) (see text for greater detail). For gene abbreviations, cf. legend to Figure 2. Further abbreviations: AD, alcohol dependence; APC, antigen-presenting cell; dsRNA, double-stranded RNA; ECM, extracellular matrix; ER, endoplasmic reticulum; HSC, hepatic stellate cell; IFN, interferon; M1, M2, pro- and anti-inflammatory MΦ polarization states; MMP, matrix metalloproteinases; MΦ, macrophage; T2DM, type-2 diabetes mellitus; TNF-α, tumor necrosis factor α; TRAIL, TNF-related apoptosis-inducing ligand (a death receptor).
3.5. Confirmation of NGS Results by qRT-PCR
In order to confirm/verify the whole-transcriptome data of human liver, we performed qRT-PCR analyses employing a selection of transcripts from the high-relevance RNAs, plus a set of control transcripts. As a result, the transcript ratios obtained by NGS for the high-relevance RNAs were generally confirmed by the ‘fold-change’ data determined via qRT-PCR. Only the control transcripts of the genes encoding for fumarylacetoacetate hydrolase (FAH) and for lipase C (LIPC) revealed contrary results (Table 2).
Table 2.
Confirmation of next-generation sequencing (NGS) results of select transcripts of relevance by qRT-PCR. Hepatic transcript expressions are listed in the order of relevance. The transcript ratios obtained by NGS were generally confirmed by fold-change via qRT-PCR. Only the transcripts of the genes FAH and LIPC revealed contrary results. (Abbreviations: CV, coefficient of variation; Cp, crossing point; Grp., Group).
3.6. Interpretations and Implications Related to Functional Gene/Transcript Categories
To our knowledge, this is the first whole-transcriptome analysis of human liver aiming at identifying major age-dependent differences in gene expression. However, due to the liver’s overarching role and importance, hepatic gene expressions must also be viewed in the systemic context. Here, the regulome comes into play, which comprises all regulatory components in health and disease [10,11,21,22]. Discussing the major implications of our findings concerning liver regeneration, inflammaging, pharmacogenes, and certain diseases clearly highlights the overall importance of distinct ‘regulome’-assigned transcripts.
3.6.1. ‘Regeneration’-Assigned Transcripts
In humans, the liver is the only solid organ using self-regenerative mechanisms enabled by hepatocytes and cholangiocytes that can transdifferentiate into each other as facultative stem cells [23]. We assigned the transcripts of the genes protein phosphatase 1 regulatory subunit 10 (PPP1R10) (also known as phosphatase 1 nuclear targeting subunit (PNUTS)), dual specificity phosphatase 1 (DUSP1) (also known as map kinase phosphatase-1), and TIMP metallopeptidase inhibitor 3 (TIMP3) to the ‘regulome–regeneration’ intersection (Figure 3). While no studies have been performed on the contribution of PPP1R10 to liver regeneration, its central function in this category is obvious from its key role as a master regulator of mitosis [24,25,26,27]. DUSP1, an immediate-early growth response gene, is activated in liver regeneration [28] and upregulated 1–2 h after liver injury [29]. As for TIMP3, liver regeneration requires the restoration of cellular mass and extracellular matrix (ECM) remodeling: Matrix metalloproteinases (MMPs) and their TIMP inhibitors regulate ECM turnover as well as growth factor and cytokine processing. TIMP3 is significantly induced during liver regeneration [30]; its complete loss in age thus entails increased ECM degradation. Hepatic expression of trefoil factor 3 (TFF3) by biliary epithelial cells contributes to their migration and proliferation in wound healing [31,32]. Approximately 50% of the individuals in Group I showed different degrees of upregulated TFF3 expression demonstrating ongoing regeneration, while complete downregulation in Group II indicates that hepatic regeneration requirements are underserved in age. Moreover, unfolded protein accumulation in the endoplasmic reticulum (ER) causes ER stress. Complete TFF3 silencing linked to impaired ER function is prominent in early type-2 diabetes mellitus (T2DM) and hepatic steatosis [33]. TFF3 modulation might thus be a future option for antagonizing ER stress and support liver regeneration in older people with non-alcoholic fatty liver disease (NAFLD). Collectively, significant downregulation of certain ‘regeneration’-assigned transcripts indicates a considerably impaired liver-regenerative capacity in age.
3.6.2. ‘Inflammaging’-Assigned Transcripts
Inflammaging [34] entails greater disease susceptibility, increased morbidity/mortality [34,35], and frailty [36]. Significantly increased IL-6, TNF-α, and the acute-phase pentraxin, CRP (exclusively produced by hepatocytes [37]) are associated with frailty [35]. The transcripts assigned to the categories ‘regulome–inflammaging’ and ‘inflammaging’ (Figure 3) are a rich source for novel insight into inflammaging: In human macrophages (MΦs), the SCN5A and SCN10A splice variant products of a voltage-gated Na+ channel gene sense viral dsRNA, which upregulates the expression of type-I interferons. The channel prevents cytotoxicity via increased PPP1R10 expression, which polarizes MΦs to an anti-inflammatory phenotype [38]. In age, upregulated inflammation in certain viral infections due to strongly reduced PPP1R10 expression thus may contribute to inflammaging. The DUSP1 protein is a central regulator of both innate and adaptive immunity, and altered DUSP1 expression is implicated in chronic inflammation [39,40,41]. Profoundly downregulated DUSP1 expression in age thus suggests a prominent role in inflammaging. TIMP3 expression is intimately connected with the release of TNF-α and IL-6: Specifically, rapid and powerful anti-infectious immunity is, inter alia, enabled by the shedding of preformed membrane-bound TNF-α [42], which is inhibited by TIMP3. Loss of TIMP3 leads to hepatic lymphocyte infiltration and necrosis [43]. In TIMP3−/− mice, enhanced TNF-α signaling is indicated by elevated serum IL-6 [42]. Therefore, age-dependently reduced TIMP3 expression may underly the significant increase in TNF-α and IL-6 in inflammaging and frailty [35]. Finally, evidence supports a key role of increased IFIT1 expression in inflammaging: Proinflammatory proteins induced in M1 MΦs prominently include gene products transcriptionally controlled by interferon regulatory factor 1, which strongly upregulates IFIT1/-2/-3 expression [44]. Indeed, both M1 and M2 MΦ numbers increase in the aged liver [45]. IFIT1 also strongly interferes with viral mRNA translation, propagation, and pathogenicity [46,47,48]. While increased IFIT1 expression in age thus might suggest improved antiviral immunity, overall anti-infective immunity actually erodes in aging [49,50], which entails more frequent and severe viral infections [51]. However, as age-related deteriorated antiviral immunity is due to defective T cell responsivity [52], increased IFIT1 expression might be a compensatory mechanism. The fact that inflammaging in (super)centenarians is always counteracted by anti-inflammaging mechanisms may be one of the secrets underlying longevity [53].
3.6.3. ‘Pharmacogene’-Assigned Transcripts
The Pharmacogenomics Knowledgebase (PharmGKB): https://www.pharmgkb.org (accessed on 20 August 2021) comprises a set of ‘very important pharmacogenes’ (VIPs) [54]. However, its underlying data have been determined in young adults, while age-dependent changes profoundly influence VIP expressions and, therefore, the efficacy and biotransformation of pharmaceuticals. Striking differences vs. adults were demonstrated in fetuses [55], children, and adolescents [56], so that alterations are expected to occur throughout individual development, including in old age. For example, drug-induced liver injury in age is most likely caused by antibiotics and cardiovascular drugs [57]. Moreover, pharmacogenes are not limited to the PharmGKB’s current VIP set: We show that the differences in the transcription of PPP1R10, IGFALS, and DUSP1 between Groups I and II are among the most striking detected for all hepatic transcripts (Figure 1c: orange). However, while generally listed by the PharmGKB, no clinical or variant annotations are mentioned in there on PPP1R10 (https://www.pharmgkb.org/gene/PA33612, accessed on 7 March 2021), IGFALS is completely absent from this database (https://www.pharmgkb.org/gene/PA29702, accessed on 7 March 2021), and for DUSP1, the PharmGKB provides clinical (https://www.pharmgkb.org/clinicalAnnotation/1447961329, accessed on 7 March 2021) and variant annotations (https://www.pharmgkb.org/gene/PA27519/variantAnnotation, accessed on 7 March 2021) only for salbutamol, a β2-sympathomimetic asthma drug. In stark contrast, the University of Santa Cruz’s genome browser (https://genome.ucsc.edu, accessed on 7 March 2021) lists dozens of pharmaceuticals that interact with PPP1R10, IGFALs, and DUSP1. Both the high-level biological roles of these genes as well as their extremely high age-dependent transcription differences strongly imply that such interactions may be of utmost importance for age-appropriate drug administration and should be duly acknowledged as VIPs. In addition, we identified ABCB1 and ABCA9 (integral membrane transporters of the ATP-binding cassette (ABC) superfamily [58,59]) as potential pharmacogenes (Figure 3). Already listed as a VIP (https://www.pharmgkb.org/vip/PA166170352, accessed on 7 March 2021) and known to be involved in multidrug resistance [60], upregulated ABCB1 expression in Group II now suggests its contribution to increased multidrug resistance in old age [61]. ABCA9 transcription is induced in monocytes during MΦ differentiation and is suppressed by cholesterol import [62]. The ABCA9 gene might therefore play a role in inflammaging, but its expression in Kupffer cells has not yet been determined.
Medawar’s mutation accumulation hypothesis suggested aging to be a consequence of the gradually declining force of natural selection [63]. Turan and colleagues confirmed its prediction that highly expressed genes in old adults are under a weaker selection pressure. They identified an age-related decrease in hepatic transcriptome conservation, which included genes for responses to age-associated tissue damage [64]. In long-lived individuals however, the expression of inflammaging- and senescence-related genes in human blood and skin cells (liver cells were not examined) was most strictly controlled when compared with mature and old individuals [65]. Consequently, an integrated view of the results of both studies suggests that, in older patients, hepatic pharmacogenes should be tested for their expression stability to arrive at individualized pharmacologic treatment recommendations.
3.6.4. Transcripts Assigned to the Category ‘Miscellaneous’
The category ‘miscellaneous’ holds the genes/transcripts KIAA0040 (encoding a protein of unknown function) and γ-glutamyltransferase 5 (GGT5) (Figure 3). KIAA0040 is highly significantly associated with alcohol dependence, which let the authors conclude that this gene might harbor a causal variant for this disorder [66]. Having found a prominent young-vs.-old transcript discrepancy for KIAA0040 (Figure 2e), we thus cautiously assume that aged individuals might be less prone for developing alcohol dependence, but this conjecture must be critically scrutinized in view of numerous other genetic risk factors [67]. GGT5, which encodes a leukotriene C4→D4-converting enzyme, is expressed by hepatic Kupffer cells [68]. Presently, the lack of evidence does not justify assigning GGT5 to the ‘inflammaging’ category. However, the highly relevant difference in its expression between Groups I and II may stimulate further clarifying research in this direction.
3.7. Implications for Non-Alcoholic Fatty Liver Disease and Hepatocellular Carcinoma
Non-alcoholic fatty liver disease (NAFLD) with its sub-entities non-alcoholic fatty liver (NAFL) and non-alcoholic steatohepatitis (NASH) as well as hepatocellular carcinoma (HCC) are among the liver diseases with the highest global prevalences and incidences, and they are constantly on the rise [69]. However, and in stark contrast to the consequential urgent and obvious medical needs, current treatments are limited. Therefore, the prospect for any novel therapy options offering improvements in safety and efficacy is highly welcome. Our results suggest such options: As detailed hereafter, prominent age-dependent differences in the expression of especially three hepatic genes demonstrably entail an increased risk for and occurrence of liver disease that might be specifically counteracted:
- (i).
- The CASP8- and FADD-like apoptosis regulator (CFLAR)-encoded protein blocks apoptosis by inhibiting procaspase-8 [70,71]. Expression of the ‘regulome’-assigned CFLAR gene is strongly downregulated in age (Figure 2a), which increases death receptor-mediated hepatocyte apoptosis [70,72]. Cholestatic liver injury characterized by rapid increases in intrahepatic proinflammatory parameters, hepatocyte death, hepatic stellate cell (HSC) activation, and fibrogenesis in mice exhibiting CFLAR–/– hepatocytes [73] suggests an increased risk of cholestasis upon drastically reduced CFLAR expression in age. By targeting MAP3K5 kinase (thus blocking downstream signaling), CFLAR also suppresses NASH [74], which indicates that reduced CFLAR expression increases the likelihood for NASH development.
- (ii).
- Expression of the ‘regulome’-assigned regulator of G-protein signaling 5 (RGS5) is downregulated in age. While RGS5 protects from NAFL/NASH development [75], reduced RGS5 expression increases obesity, hepatic steatosis, inflammation, and insulin resistance [76,77]. Therefore, RGS5 might serve as a target for NAFL/NASH-preventive approaches in progressed age. Moreover, RGS5 downregulation induces HSC-driven liver fibrosis [78], so that therapeutic induction of RGS5 in older individuals might also serve as an approach for tackling liver fibrosis.
- (iii).
- Aging goes along with downregulated expression of GATA4, the developmental master regulator of liver sinusoidal endothelial cells (LSECs). GATA4 deficiency in murine LSECs causes perisinusoidal liver fibrosis, hepatopathy, and impaired liver regeneration, and GATA4+ LSEC numbers are reduced in human cirrhotic livers. Targeting GATA4 thus may be promising to prevent/treat liver fibrosis for reducing cirrhosis, liver failure, and/or the development of fibrosis/cirrhosis-dependent HCC [79].
Evidence thus indicates that the increase in NAFLD, liver fibrosis/cirrhosis, and HCC in progressed age [80] are promoted by downregulated CFLAR, RGS5, and/or GATA4 expression. This understanding may offer clues for developing more potent therapeutics in the face of the insidious NAFLD pandemic and the increasing incidence of HCC [81].
3.8. Evidence for a Genetically Governed ‘Aging Cascade’: A Testable Hypothesis
Based on the role of the liver as an organ of major systemic relevance; highly significant age-related differences in the expression of PPP1R10, IGFALS, and DUSP1; and ample evidence on the action of their protein products on central aging-associated downstream processes, we now present a broadly substantiated hypothesis on a PPP1R10/IGFALS/DUSP1-governed ‘aging cascade’. Using a mouse model of aging, Sahin et al. earlier elegantly combined progressive DNA damage and mitochondrial decline via p53 as an ‘axis of aging’. This axis implicates a chain reaction leading from telomere dysfunction to the induction of p53, and the resultant repression of PPARγ coactivators 1α and 1β, which detrimentally affects key cellular mechanisms, hence propelling the process of aging [12]. Our hierarchically arranged hypothesis embraces and extends this model: Therein, three ‘regulome’-assigned genes assume paramount positions (Figure 4).
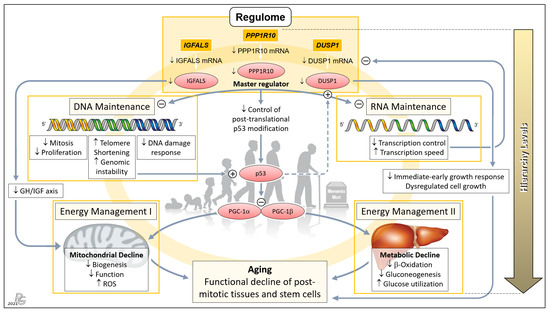
Figure 4.
Concept of a genetically anchored regulatory ‘aging cascade’. This hierarchical top-down structure embraces the telomere–p53–PGC ‘axis of aging’ proposed earlier by Sahin and colleagues to cause the functional decline of post-mitotic tissues and stem cells [12,13]. The first hierarchical level comprises PPP1R10, IGFALS, and DUSP1 whose transcripts were among the group of 16 mRNAs displaying the most relevant old-vs.-young differences in terms of p and EFS score, being led by PPP1R10 and DUSP1 (cf. Figure 1b). We propose that these three ‘Regulome’-assigned genes govern the process of aging. PPP1R10 acts as the master regulator of the second hierarchical level comprising the key tasks of DNA and RNA Maintenance. Downregulation of PPP1R10 transcription in age substantially reduces fundamental DNA-associated cellular processes and, conversely, increases telomere shortening and genomic instability. The latter were the top aspects of the earlier proposed ‘axis of aging’, leading to induction of p53 and the resultant repression of PPARγ coactivators 1α and 1β (PGC-1α; PGC-1β), which detrimentally affect the third hierarchical level comprising Energy Management I and II. Downregulation of the PPP1R10 transcript also negatively impinges upon RNA Maintenance at the second hierarchical level, which, in a negative feedback loop, further impairs the transcription of PPP1R10, IGFALS, and DUSP1 (as well as, obviously, other transcripts in progressed age). Next, downregulation of IGFALS transcription/translation, via impairing the essential growth hormone/insulin-like growth factor (GH/IGF) axis, causes substantial mitochondrial decline and aging. Finally, downregulated DUSP1 transcription/translation acts to the detriment of the immediate-early growth response and causes dysregulated cell growth, which entails serious cellular impairment and aging. Besides belonging to the ‘regulome’ category, PPP1R10 and IGFALS intersect with the ‘regeneration’ and ‘inflammaging” categories (Figure 3), which further enhances their impact upon downregulated expression in age. The proposed ‘aging cascade’ is visualized by a light orange ring connecting the three hierarchical levels and the consequence of aging. (Abbreviation: ROS, reactive oxygen species.) Background image: clipartstation.com (modified).
The PPP1R10 transcript displayed by far the most significant and striking age-related difference among all protein-encoding hepatic transcripts (Figure 1c and Figure 2a). This difference, together with the essential functions of PPP1R10, clearly underscores its dominance as an ontogenetic master regulator. The PPP1R10-encoded enzyme harnesses the protein kinase A-regulated serine/threonine protein phosphatase 1 (PP1) to establish a PPP1R10:PP1 holoenzyme [82] that comprehensively acts on the upstream DNA and RNA levels and—via the established ‘axis of aging’—the downstream levels of energy management (Figure 4). At the DNA/RNA levels, this gene acts as the master regulator of mitosis/proliferation/apoptosis [24,25,26,27], influences the DNA damage response [83,84], controls RNA processing [25,83], and negatively regulates the RNA transcription speed [85]. Dwindling transcription in aging thus lets PPP1R10 gradually lose its grip on these fundamental processes. Element #1 of the ‘axis of aging’—telomere shortening/genomic instability—results from reduced nuclear concentrations of PPP1R10:PP1 [86,87,88]. In aging, the loss of control by PPP1R10 over RNA processing and transcription speed creates a negative feedback loop on the transcription of PPP1R10, IGAFLS, and DUSP1, which further accelerates the aging process. Next, PPP1R10 usually plays an important role in controlling cell death in response to cellular stresses by post-translational p53 modification [89]. Thus, p53—i.e., element #2 of the ‘axis of aging’—escapes PPP1R10 control once its expression drops. Moreover, the induction and regulation of DUSP1 transcription by p53 [90,91] is further undermined by the impaired PPP1R10-dependent RNA maintenance in age (Figure 4: Dashed arrow).
Hierarchically subordinate to PPP1R10, IGFALS, and DUSP1 (cf. Figure 1c and Figure 2a) act on the downstream aspects of aging only. First, the gene for insulin-like growth factor-binding protein acid-labile subunit (IGFALS) significantly contributes to an individual’s lifetime. As an essential component of the GH/IGF axis with its proven role in longevity, it prolongs the half-life of insulin-like growth factor (IGF)-I and IGF-II [92]. In contrast, serious developmental harm or disease result from IGFALS defects [93,94,95], mutations [96], or IGFALS protein deficiency [97,98]. The same axis regulates mitochondrial processes whose decline upon reduced IGFALS concentrations are hallmarks of aging [99] (Figure 4). Second, downregulated transcription of the dual specificity phosphatase 1 (DUSP1) gene impairs the immediate-early growth response and entails dysregulated cell growth [28,29], which fundamentally weakens the body’s regenerative capacities. Concerted PPP1R10/IGFALS/ DUSP1 action funnels into the aging-associated functional decline of post-mitotic tissues and stem cells. Therefore, a hierarchically arranged network emerges whose main components connect as an ‘aging cascade’ (Figure 4).
To address the question of whether the proposed governance by PPP1R10, IGFALS, and DUSP1 can be generalized from the hepatic transcriptome to an entire organism, we selected respective data from the Genotype-Tissue Expression (GTEx) project obtained from 53 tissues of 570 donors (Figure 5). For a complete overview of the GTEx project’s tissue and sample statistics, we refer to the respective condensed information provided on its portal: https://www.gtexportal.org/home/tissueSummaryPage (accessed on 7 March 2021). According to the GTEx data, (i) the expression of PPP1R10 as a global master regulator is ubiquitous and tightly regulated; (ii) the expression of IGFALS is essentially confined to the liver, but by serving as a transporter for IGF-I/IGF-II its protein product is crucial for the functionality of the systemic GH/IGF axis whereby assuming a key role in steering an individual’s development and lifespan; and (iii) the expression of DUSP1 as a gene implicated in immediate-early and overall cell growth is regulated locally depending on a tissues’ specific growth requirements. Therefore, the findings/ interpretations for the liver transcriptome on these genes can, at least in principle, be generalized to the individual. All data, supportive information, and derivations thus justify postulating a genetically anchored regulatory ‘aging cascade’.
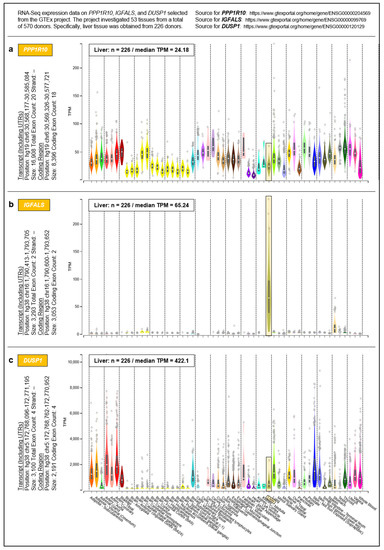
Figure 5.
Systemic expressions of (a) PPP1R10, (b) IGFALS, and (c) DUSP1. Expressions were determined by the GTEx project in a total of 53 tissues. For inter-tissue comparison, the expressions of PPP1R10, IGFALS, and DUSP1 in the liver are highlighted.
If confirmed experimentally, further research will, inter alia, need to clarify the following:
- (i).
- The potential existence and role of ethnic differences;
- (ii).
- Whether the expressions of the individually specific MHC I proteins and PPP1R10 are jointly regulated, as PPP1R10 is intriguingly encoded on chromosome 6 within the MHC I region: https://www.pharmgkb.org/gene/PA33612 (accessed on 7 March 2021);
- (iii).
- In which way PPP1R10 is interconnected with the organism’s central clock located in the suprachiasmatic nucleus and its regulation of melatonin secretion (with resultant pro- and anti-inflammatory effects, among others) [100,101] as well as the recently identified inflammatory aging clock [102], and with the age-dependent reprogramming of the circadian transcriptome discovered in the murine liver [103]; and
- (iv).
- Especially from a clinician’s point of view, whether pharmaceuticals modifying the transcription of PPP1R10, IGFALS, and DUSP1 (Table S5) may affect an individual’s lifetime.
In addition, potential modulatory effects of age-dependent differences in other RNA species—e.g., the long non-coding RNAs (lncRNAs) (cf. Table 1)—still largely remain to be analyzed in humans. Indeed, results by White and colleagues in the aging mouse liver point in exactly this direction by showing upregulation of distinct lncRNAs in the aging liver whereby suggesting a putative regulatory hotspot locus in aging liver, as well as discrete roles of certain lncRNAs within interaction networks that, for instance, are implicated in inflammaging and regeneration [104].
If key issues such as these can be resolved, one might theoretically envision measures to counteract the gradual loss in PPP1R10 expression, which is supposed to chiefly time an individual’s biological decline. However, interfering with this presumptive ontogenetic master regulator would promise to be a most critical and potentially highly perilous undertaking, and it will inevitably be burdened by profound ethical considerations.
Supplementary Materials
The following are available online at https://www.mdpi.com/article/10.3390/pharmaceutics13122009/s1, Table S1. Patients’ age and gender in order of increasing age. (Abbreviations: m, male; f, female.), Table S2. Human target transcripts for qRT-PCR. The list starts with the reference gene, followed by genes of the transcripts investigated in alphabetical order, Table S3. Gene expressions of interest identified by applying EFS software. Transcripts are listed from most relevant to least relevant according to their EFS scores (>0.3: 16 transcripts/>0.2: 28 further transcripts). For full names of protein products, cf. Table 2. Increases in EFS scores indicate increasing relevance when comparing young and old patients. Ratios between Group (Grp.) I and Group II differing by a factor of at least × 2 (i.e., ≤0.5 or ≥2.0) are boxed (red data in Figure 2), while ratios between >0.5 and <2.0 are underlined (blue data in Figure 2). Data for all 44 transcripts are at least statistically significant (p < 0.05). (Abbreviations: Grp., Group; TPM, transcripts per million.), Table S4. Specifications for gene transcripts identified by EFS software. Genes related to the 44 hepatic transcripts matching the EFS score cutoff of >0.2 are tabulated according to their chromosome (Chr) location, wherein listed alphabetically according their gene designations. Especially high ortholog/paralog1 ratios (with ≤9 paralogs) are boxed. As summarized in the bottom section, gene transcripts of relevance were expressed from all human chromosomes, except for Chr 18 and Chr Y. Hence, no statistically significant age-dependent transcript differences were attributable to the male sex chromosome. Transcript numbers (##) with relevant age-dependent differences were six for Chr 1; four for Chr 22; three for Chr 3, 5, and 11; two for Chr 2, 6, 10, 12, 15, 16, 19, and X; and one for Chr 4, 7, 8, 9, 13, 14, 17, 20, and 21, respectively. Information was compiled from https://www.ensembl.org/Homo_sapiens/Info/Index (accessed on 16 April 2021), Table S5. Pharmaceuticals modifying the mRNA expression of select regulome-assigned hepatic genes that display highly significant age-dependent differences in expression. Active pharmaceutical ingredients (APIs) that affect (A), decrease (↓), or increase (↑) the transcription of PPP1R10, IGFALS, or DUSP1 are listed in alphabetical order. The term, ‘affects’, indicates that the respective studies referred to in the Comparative Toxicogenomics Database generated ambiguous results. APIs interfering with the expression of ≥2 of the three regulome-assigned genes are boxed.
Author Contributions
Conceptualization, A.C.; Data curation, T.S., R.K.G., R.V.-V., R.J., J.-P.S. and S.K.-S.; Formal analysis, T.S., R.K.G., R.V.-V. and R.J.; Funding acquisition, A.L. and A.C.; Investigation, T.S., R.V.-V., R.J., J.-P.S., R.B., R.S.C. and J.W.T.; Methodology, T.S., R.V.-V., R.J., S.K.-S., R.B., R.S.C. and J.W.T.; Project administration, A.C.; Resources, T.S., R.K.G., R.V.-V., R.J. and S.K.-S.; Software, R.V.-V. and R.J.; Validation, T.S., R.K.G., R.V.-V., R.J., A.L. and A.C.; Visualization, R.K.G. Writing—original draft, R.K.G.; Formulation of the ‘aging cascade’ hypothesis, R.K.G.; Writing—review and editing, T.S., R.K.G., A.L. and A.C. All authors have read and agreed to the published version of the manuscript.
Funding
This research was funded by the German Research Foundation (Deutsche Forschungsgemeinschaft, DFG), project number 250798584 (CA267/13-3 and CA267/14-1) to A.C. and T.S.; the Dr. Heinz-Horst Deichmann Foundation to A.C.; the Wilhelm Laupitz Foundation to A.C.; the European Commission, European Funds for Regional Development (EFRE) to A.L. and R.V.V.; the Ministry of Economy, Science and Digitalization (Ministerium für Wirtschaft, Wissenschaft und Digitalisierung) of the German State of Saxony-Anhalt as part of the ‘Autonomy in Old Age’ (AiA) research group for the ‘LiLife’ Project (ZS/2018/11/95324) to A.L. and R.V.V.; and by the German Federal Ministry of Education and Research (Bundesministerium für Bildung und Forschung, BMBF) within the ‘Medical Informatics Funding Scheme’ (FKZ 01ZZ1801H) to MIRACUM.
Institutional Review Board Statement
The study was conducted according to the guidelines of the Declaration of Helsinki, and approved by the Ethics Committees of the University Hospitals Essen (file number: 12-5232-BO) and Magdeburg (file number: 208/17).
Informed Consent Statement
Informed consent was obtained from all subjects involved in the study before undergoing partial liver resections due to the indications specified in Table S1.
Data Availability Statement
All raw and processed sequencing data generated in this study have been submitted to the NCBI Gene Expression Omnibus (GEO; https://www.ncbi.nlm.nih.gov/geo/, accessed on 7 March 2021). The datasets and the computer code produced in this study are available under: https://www.ncbi.nlm.nih.gov/geo/query/acc.cgi?acc=GSE183915 (accessed on 7 March 2021).
Acknowledgments
We are grateful to the Helmholtz Center for Infection Research (Braunschweig, Germany) for RNA quality determination, and to the team of the Data Integration Center at the University Medicine Magdeburg for local data analysis solutions. We further thank Theodor Baars (Dept. of Internal Medicine, University Hospital, Ruhr University Bochum, Bochum, Germany) for support with manuscript processing; Lea Ann Dailey (Dept. of Pharmaceutical Technology and Biopharmacy, University of Vienna, Vienna, Austria) for constructive comments; Barbara E. Engelhardt (Dept. of Computer Science, Princeton University, Princeton, NJ, USA)—a key member of the GTEx Consortium—for fruitful exchange; Rüdiger Hardeland (Johann Friedrich Blumenbach Institute of Zoology and Anthropology, University of Göttingen, Göttingen, Germany) for intellectual exchange; Magnus Ingelman-Sundberg (Dept. of Physiology and Pharmacology, Karolinska Institutet, Stockholm, Sweden) for advice; and the anonymous reviewers for their thorough and insightful comments.
Conflicts of Interest
The authors declare no conflict of interest. The funders had no role in the design of the study; in the collection, analyses, or interpretation of data; in the writing of the manuscript; or in the decision to publish the results.
References
- Gurven, M.; Kaplan, H. Longevity among hunter-gatherers: A cross-cultural examination. Popul. Dev. Rev. 2007, 33, 321–365. [Google Scholar] [CrossRef]
- Caspari, R.; Lee, S.H. Older age becomes common late in human evolution. Proc. Natl. Acad. Sci. USA 2004, 101, 10895–10900. [Google Scholar] [CrossRef]
- Allard, M.; Lèbre, V.; Robine, J.-M. Jeanne Calment: From Van Gogh’s Time to Ours: 122 Extraordinary Years; W. H. Freeman: New York, NY, USA, 1998. [Google Scholar]
- Consortium, E.P. The ENCODE (ENCyclopedia of DNA Elements) Project. Science 2004, 306, 636–640. [Google Scholar]
- Consortium, E.P. An integrated encyclopedia of DNA elements in the human genome. Nature 2012, 489, 57–74. [Google Scholar] [CrossRef]
- Neumann, U.; Genze, N.; Heider, D. EFS: An ensemble feature selection tool implemented as R-package and web-application. BioData Min. 2017, 10, 21. [Google Scholar] [CrossRef] [PubMed]
- Wilhelm, M.; Schlegl, J.; Hahne, H.; Gholami, A.M.; Lieberenz, M.; Savitski, M.M.; Ziegler, E.; Butzmann, L.; Gessulat, S.; Marx, H.; et al. Mass-spectrometry-based draft of the human proteome. Nature 2014, 509, 582–587. [Google Scholar] [CrossRef]
- Fortelny, N.; Overall, C.M.; Pavlidis, P.; Freue, G.V.C. Can we predict protein from mRNA levels? Nature 2017, 547, E19–E20. [Google Scholar] [CrossRef] [PubMed]
- Wilhelm, M.; Hahne, H.; Savitski, M.; Marx, H.; Lemeer, S.; Bantscheff, M.; Kuster, B. Wilhelm et al. reply. Nature 2017, 547, E23. [Google Scholar] [CrossRef] [PubMed]
- Gerstein, M.B.; Bruce, C.; Rozowsky, J.S.; Zheng, D.; Du, J.; Korbel, J.O.; Emanuelsson, O.; Zhang, Z.D.; Weissman, S.; Snyder, M. What is a gene, post-ENCODE? History and updated definition. Genome Res. 2007, 17, 669–681. [Google Scholar] [CrossRef]
- Ooi, L.; Wood, I.C. Chromatin crosstalk in development and disease: Lessons from REST. Nat. Rev. Genet. 2007, 8, 544–554. [Google Scholar] [CrossRef] [PubMed]
- Sahin, E.; Colla, S.; Liesa, M.; Moslehi, J.; Müller, F.L.; Guo, M.; Cooper, M.; Kotton, D.; Fabian, A.J.; Walkey, C.; et al. Telomere dysfunction induces metabolic and mitochondrial compromise. Nature 2011, 470, 359–365. [Google Scholar] [CrossRef] [PubMed]
- Sahin, E.; DePinho, R.A. Axis of ageing: Telomeres, p53 and mitochondria. Nat. Rev. Mol. Cell Biol. 2012, 13, 397–404. [Google Scholar] [CrossRef]
- Rio, D.C.; Ares, M.; Hannon, G.J.; Nilsen, T.W. Purification of RNA using TRIzol (TRI reagent). Cold Spring Harb. Protoc. 2010, 2010, pdb.prot5439. [Google Scholar] [CrossRef] [PubMed]
- Zhao, S.; Ye, Z.; Stanton, R. Misuse of RPKM or TPM normalization when comparing across samples and sequencing protocols. RNA 2020, 26, 903–909. [Google Scholar] [CrossRef] [PubMed]
- Remeseiro, B.; Bolon-Canedo, V. A review of feature selection methods in medical applications. Comput. Biol. Med. 2019, 112, 103375. [Google Scholar] [CrossRef] [PubMed]
- Sandri, M.; Zuccolotto, M. A Bias Correction Algorithm for the Gini Variable Importance Measure in Classification Trees. J. Comput. Graph. Stat. 2008, 17, 611–628. [Google Scholar] [CrossRef]
- Moody, L.; Chen, H.; Pan, Y.X. Considerations for feature selection using gene pairs and applications in large-scale dataset integration, novel oncogene discovery, and interpretable cancer screening. BMC Med. Genom. 2020, 13 (Suppl. 10), 148. [Google Scholar] [CrossRef]
- Adnan, N.; Liu, Z.; Huang, T.H.M.; Ruan, J. Comparative evaluation of network features for the prediction of breast cancer metastasis. BMC Med. Genom. 2020, 13 (Suppl. 5), 40. [Google Scholar] [CrossRef]
- Bandyopadhyay, S.; Lysak, N.; Adhikari, L.; Velez, L.M.; Sautina, L.; Mohandas, R.; Lopez, M.C.; Ungaro, R.; Peng, Y.C.; Kadri, F.; et al. Discovery and Validation of Urinary Molecular Signature of Early Sepsis. Crit. Care Explor. 2020, 2, e0195. [Google Scholar] [CrossRef]
- Kondro, W. Molecular biology. Consortium tackles mouse regulome. Science 2004, 304, 942. [Google Scholar] [CrossRef]
- Sandve, G.K.; Gundersen, S.; Rydbeck, H.; Glad, I.K.; Holden, L.; Holden, M.; Liestøl, K.; Clancy, T.; Drabløs, F.; Ferkingstad, E.; et al. The differential disease regulome. BMC Genom. 2011, 12, 353. [Google Scholar] [CrossRef] [PubMed]
- Michalopoulos, G.K.; Bhushan, B. Liver regeneration: Biological and pathological mechanisms and implications. Nat. Rev. Gastroenterol. Hepatol. 2021, 18, 40–55. [Google Scholar] [CrossRef]
- Landsverk, H.B.; Kirkhus, M.; Bollen, M.; Küntziger, T.; Collas, P. PNUTS enhances in vitro chromosome decondensation in a PP1-dependent manner. Biochem. J. 2005, 390, 709–717. [Google Scholar] [CrossRef] [PubMed]
- Choy, M.S.; Hieke, M.; Kumar, G.S.; Lewis, G.R.; Gonzalez-DeWhitt, K.R.; Kessler, R.P.; Stein, B.J.; Hessenberger, M.; Nairn, A.C.; Peti, W.; et al. Understanding the antagonism of retinoblastoma protein dephosphorylation by PNUTS provides insights into the PP1 regulatory code. Proc. Natl. Acad. Sci. USA 2014, 111, 4097–4102. [Google Scholar] [CrossRef]
- Fisher, L.A.; Wang, L.; Wu, L.; Peng, A. Phosphatase 1 nuclear targeting subunit is an essential regulator of M-phase entry, maintenance, and exit. J. Biol. Chem. 2014, 289, 23745–23752. [Google Scholar] [CrossRef] [PubMed]
- Wang, F.; Wang, L.; Fisher, L.A.; Li, C.; Wang, W.; Peng, A. Phosphatase 1 Nuclear Targeting Subunit (PNUTS) Regulates Aurora Kinases and Mitotic Progression. Mol. Cancer Res. 2019, 17, 10–19. [Google Scholar] [CrossRef]
- Factor, V.M.; Seo, D.; Ishikawa, T.; Kaposi-Novak, P.; Marquardt, J.U.; Andersen, J.B.; Conner, E.A.; Thorgeirsson, S.S. Loss of c-Met disrupts gene expression program required for G2/M progression during liver regeneration in mice. PLoS ONE 2010, 5, e12739. [Google Scholar] [CrossRef]
- Tran, D.D.H.; Koch, A.; Saran, S.; Armbrecht, M.; Ewald, F.; Koch, M.; Wahlicht, T.; Wirth, D.; Braun, A.; Nashan, B.; et al. Extracellular-signal regulated kinase (Erk1/2), mitogen-activated protein kinase-activated protein kinase 2 (MK2) and tristetraprolin (TTP) comprehensively regulate injury-induced immediate early gene (IEG) response in in vitro liver organ culture. Cell Signal. 2016, 28, 438–447. [Google Scholar] [CrossRef]
- Mohammed, F.F.; Pennington, C.J.; Kassiri, Z.; Rubin, J.S.; Soloway, P.D.; Ruther, U.; Edwards, D.R.; Khokha, R. Metalloproteinase inhibitor TIMP-1 affects hepatocyte cell cycle via HGF activation in murine liver regeneration. Hepatology 2005, 41, 857–867. [Google Scholar] [CrossRef]
- Nozaki, I.; Lunz, J.G., 3rd; Specht, S.; Park, J.I.; Giraud, A.S.; Murase, N.; Demetris, A.J. Regulation and function of trefoil factor family 3 expression in the biliary tree. Am. J. Pathol. 2004, 165, 1907–1920. [Google Scholar] [CrossRef]
- Jiang, G.X.; Zhong, X.Y.; Cui, Y.F.; Liu, W.; Tai, S.; Wang, Z.D.; Shi, Y.G.; Zhao, S.Y.; Li, C.L. IL-6/STAT3/TFF3 signaling regulates human biliary epithelial cell migration and wound healing in vitro. Mol. Biol. Rep. 2010, 37, 3813–3818. [Google Scholar] [CrossRef]
- Šešelja, K.; Bazina, I.; Welss, J.; Schicht, M.; Paulsen, F.; Bijelić, N.; Rođak, E.; Horvatić, A.; Gelemanović, A.; Mihalj, M.; et al. Effect of Tff3 Deficiency and ER Stress in the Liver. Int. J. Mol. Sci. 2019, 20, 4389. [Google Scholar] [CrossRef] [PubMed]
- Franceschi, C.; Bonafè, M.; Valensin, S.; Olivieri, F.; De Luca, M.; Ottaviani, E.; De Benedictis, G. Inflamm-aging. An evolutionary perspective on immunosenescence. Ann. N. Y. Acad. Sci. 2000, 908, 244–254. [Google Scholar] [CrossRef]
- Marcos-Pérez, D.; Sánchez-Flores, M.; Proietti, S.; Bonassi, S.; Costa, S.; Teixeira, J.P.; Fernández-Tajes, J.; Pásaro, E.; Laffon, B.; Valdiglesias, V. Association of inflammatory mediators with frailty status in older adults: Results from a systematic review and meta-analysis. GeroScience 2020, 42, 1451–1473. [Google Scholar] [CrossRef] [PubMed]
- Fried, L.P.; Tangen, C.M.; Walston, J.; Newman, A.B.; Hirsch, C.; Gottdiener, J.; Seeman, T.; Tracy, R.; Kop, W.J.; Burke, G.; et al. Frailty in older adults: Evidence for a phenotype. J. Gerontol. A Biol. Sci. Med. Sci. 2001, 56, M146–M156. [Google Scholar] [CrossRef] [PubMed]
- Thompson, D.; Pepys, M.B.; Wood, S.P. The physiological structure of human C-reactive protein and its complex with phosphocholine. Structure 1999, 7, 169–177. [Google Scholar] [CrossRef]
- White, C.R.; Dungan, M.; Carrithers, M.D. Activation of human macrophage sodium channels regulates RNA processing to increase expression of the DNA repair protein PPP1R10. Immunobiology 2019, 224, 80–93. [Google Scholar] [CrossRef]
- Abraham, S.M.; Clark, A.R. Dual-specificity phosphatase 1: A critical regulator of innate immune responses. Biochem. Soc. Trans. 2006, 34, 1018–1023. [Google Scholar] [CrossRef]
- Korhonen, R.; Moilanen, E. Mitogen-activated protein kinase phosphatase 1 as an inflammatory factor and drug target. Basic Clin. Pharmacol. Toxicol. 2014, 114, 24–36. [Google Scholar] [CrossRef]
- Hoppstädter, J.; Ammit, A.J. Role of Dual-Specificity Phosphatase 1 in Glucocorticoid-Driven Anti-inflammatory Responses. Front. Immunol. 2019, 10, 1446. [Google Scholar] [CrossRef]
- Smookler, D.S.; Mohammed, F.F.; Kassiri, Z.; Duncan, G.S.; Mak, T.W.; Khokha, R. Tissue inhibitor of metalloproteinase 3 regulates TNF-dependent systemic inflammation. J. Immunol. 2006, 176, 721–725. [Google Scholar] [CrossRef] [PubMed]
- Mohammed, F.F.; Smookler, D.S.; Taylor, S.E.; Fingleton, B.; Kassiri, Z.; Sanchez, O.H.; English, J.L.; Matrisian, L.M.; Au, B.; Yeh, W.C.; et al. Abnormal TNF activity in Timp3-/- mice leads to chronic hepatic inflammation and failure of liver regeneration. Nat. Genet. 2004, 36, 969–977. [Google Scholar] [CrossRef] [PubMed]
- Huang, C.; Lewis, C.; Borg, N.A.; Canals, M.; Diep, H.; Drummond, G.R.; Goode, R.J.; Schittenhelm, R.B.; Vinh, A.; Zhu, M.; et al. Proteomic Identification of Interferon-Induced Proteins with Tetratricopeptide Repeats as Markers of M1 Macrophage Polarization. J. Proteome Res. 2018, 17, 1485–1499. [Google Scholar] [CrossRef] [PubMed]
- Bloomer, S.A.; Moyer, E.D.; Brown, K.E.; Kregel, K.C. Aging results in accumulation of M1 and M2 hepatic macrophages and a differential response to gadolinium chloride. Histochem. Cell Biol. 2020, 153, 37–48. [Google Scholar] [CrossRef] [PubMed]
- Pichlmair, A.; Lassnig, C.; Eberle, C.A.; Górna, M.W.; Baumann, C.L.; Burkard, T.R.; Bürckstümmer, T.; Stefanovic, A.; Krieger, S.; Bennett, K.L.; et al. IFIT1 is an antiviral protein that recognizes 5’-triphosphate RNA. Nat. Immunol. 2011, 12, 624–630. [Google Scholar] [CrossRef]
- Pingale, K.D.; Kanade, G.D.; Karpe, Y.A. Hepatitis E virus polymerase binds to IFIT1 to protect the viral RNA from IFIT1-mediated translation inhibition. J. Gen. Virol. 2019, 100, 471–483. [Google Scholar] [CrossRef] [PubMed]
- Dobieżyńska, A.; Miszkiewicz, J.; Darżynkiewicz, Z.M.; Tyras, M.; Stankiewicz-Drogoń, A.; Trylska, J.; Darżynkiewicz, E.; Grzela, R. Development of bis-ANS-based modified fluorescence titration assay for IFIT/RNA studies. Biochem. Biophys. Res. Commun. 2020, 533, 391–396. [Google Scholar] [CrossRef]
- Goronzy, J.J.; Weyand, C.M. Successful and Maladaptive T Cell Aging. Immunity 2017, 46, 364–378. [Google Scholar] [CrossRef] [PubMed]
- Nikolich-Žugich, J. The twilight of immunity: Emerging concepts in aging of the immune system. Nat. Immunol. 2018, 19, 10–19. [Google Scholar] [CrossRef] [PubMed]
- Targonski, P.V.; Jacobson, R.M.; Poland, G.A. Immunosenescence: Role and measurement in influenza vaccine response among the elderly. Vaccine 2007, 25, 3066–3069. [Google Scholar] [CrossRef]
- Kim, C.; Jadhav, R.R.; Gustafson, C.E.; Smithey, M.J.; Hirsch, A.J.; Uhrlaub, J.L.; Hildebrand, W.H.; Nikolich-Žugich, J.; Weyand, C.M.; Goronzy, J.J. Defects in Antiviral T Cell Responses Inflicted by Aging-Associated miR-181a Deficiency. Cell Rep. 2019, 29, 2202–2216.e2205. [Google Scholar] [CrossRef] [PubMed]
- Minciullo, P.L.; Catalano, A.; Mandraffino, G.; Casciaro, M.; Crucitti, A.; Maltese, G.; Morabito, N.; Lasco, A.; Gangemi, S.; Basile, G. Inflammaging and Anti-Inflammaging: The Role of Cytokines in Extreme Longevity. Arch. Immunol. Ther. Exp. 2016, 64, 111–126. [Google Scholar] [CrossRef]
- Whirl-Carrillo, M.; McDonagh, E.M.; Hebert, J.M.; Gong, L.; Sangkuhl, K.; Thorn, C.F.; Altman, R.B.; Klein, T.E. Pharmacogenomics knowledge for personalized medicine. Clin. Pharmacol. Ther. 2012, 92, 414–417. [Google Scholar] [CrossRef]
- Huse, S.M.; Gruppuso, P.A.; Boekelheide, K.; Sanders, J.A. Patterns of gene expression and DNA methylation in human fetal and adult liver. BMC Genom. 2015, 16, 981. [Google Scholar] [CrossRef] [PubMed]
- Meier, R.; Bi, C.; Gaedigk, R.; Heruth, D.P.; Ye, S.Q.; Leeder, J.S.; Fridley, B.L. Ontogeny-related pharmacogene changes in the pediatric liver transcriptome. Pharmacogenet. Genom. 2018, 28, 86–94. [Google Scholar] [CrossRef]
- Lucena, M.I.; Sanabria, J.; García-Cortes, M.; Stephens, C.; Andrade, R.J. Drug-induced liver injury in older people. Lancet Gastroenterol. Hepatol. 2020, 5, 862–874. [Google Scholar] [CrossRef]
- Dean, M.; Rzhetsky, A.; Allikmets, R. The human ATP-binding cassette (ABC) transporter superfamily. Genome Res. 2001, 11, 1156–1166. [Google Scholar] [CrossRef]
- Rees, D.C.; Johnson, E.; Lewinson, O. ABC transporters: The power to change. Nat. Rev. Mol. Cell Biol. 2009, 10, 218–227. [Google Scholar] [CrossRef]
- Liu, X. ABC Family Transporters. Adv. Exp. Med. Biol. 2019, 1141, 13–100. [Google Scholar]
- Denkinger, C.M.; Grant, A.D.; Denkinger, M.; Gautam, S.; D’Agata, E.M. Increased multi-drug resistance among the elderly on admission to the hospital—A 12-year surveillance study. Arch. Gerontol. Geriatr. 2013, 56, 227–230. [Google Scholar] [CrossRef]
- Piehler, A.; Kaminski, W.E.; Wenzel, J.J.; Langmann, T.; Schmitz, G. Molecular structure of a novel cholesterol-responsive A subclass ABC transporter, ABCA9. Biochem. Biophys. Res. Commun 2002, 295, 408–416. [Google Scholar] [CrossRef]
- Medawar, P.B. An Unsolved Problem of Biology. In The Uniqueness of the Individual, 2nd ed.; H. K. Lewis: London, UK, 1952; (Reprinted in Medawar, P.B. 1981. Dover: New York, NY, USA, pp. 28–54.). [Google Scholar]
- Turan, Z.G.; Parvizi, P.; Dönertaş, H.M.; Tung, J.; Khaitovich, P.; Somel, M. Molecular footprint of Medawar’s mutation accumulation process in mammalian aging. Aging Cell 2019, 18, e12965. [Google Scholar] [CrossRef] [PubMed]
- Barth, E.; Srivastava, A.; Stojiljkovic, M.; Frahm, C.; Axer, H.; Witte, O.W.; Marz, M. Conserved aging-related signatures of senescence and inflammation in different tissues and species. Aging 2019, 11, 8556–8572. [Google Scholar] [CrossRef] [PubMed]
- Zuo, L.; Gelernter, J.; Zhang, C.K.; Zhao, H.; Lu, L.; Kranzler, H.R.; Malison, R.T.; Li, C.S.; Wang, F.; Zhang, X.Y.; et al. Genome-wide association study of alcohol dependence implicates KIAA0040 on chromosome 1q. Neuropsychopharmacology 2012, 37, 557–566. [Google Scholar] [CrossRef]
- Zuo, L.; Lu, L.; Tan, Y.; Zuo, L.; Lu, L.; Tan, Y.; Pan, X.; Cai, Y.; Wang, X.; Hong, J.; et al. Genome-wide association discoveries of alcohol dependence. Am. J. Addict. 2014, 23, 526–539. [Google Scholar] [CrossRef]
- Hanigan, M.H.; Gillies, E.M.; Wickham, S.; Wakeham, N.; Wirsig-Wiechmann, C.R. Immunolabeling of gamma-glutamyl transferase 5 in normal human tissues reveals that expression and localization differ from gamma-glutamyl transferase 1. Histochem. Cell Biol. 2015, 143, 505–515. [Google Scholar] [CrossRef]
- Canbay, A.; Kachru, N.; Haas, J.S.; Sowa, J.P.; Meise, D.; Ozbay, A.B. Patterns and predictors of mortality and disease progression among patients with non-alcoholic fatty liver disease. Aliment. Pharmacol. Ther. 2020, 52, 1185–1194. [Google Scholar] [CrossRef]
- Yamaguchi, Y.; Shiraki, K.; Fuke, H.; Yamaguchi, Y.; Shiraki, K.; Fuke, H.; Inoue, T.; Miyashita, K.; Yamanaka., Y.; Nakano, T.; et al. Adenovirus-mediated transfection of caspase-8 sensitizes hepatocellular carcinoma to TRAIL- and chemotherapeutic agent-induced cell death. Biochim. Biophys. Acta 2006, 1763, 844–853. [Google Scholar] [CrossRef][Green Version]
- Piao, X.; Komazawa-Sakon, S.; Nishina, T.; Koike, M.; Piao, J.H.; Ehlken, H.; Kurihara, H.; Hara, M.; Van Rooijen, N.; Schütz, G.; et al. c-FLIP maintains tissue homeostasis by preventing apoptosis and programmed necrosis. Sci. Signal. 2012, 5, ra93. [Google Scholar] [CrossRef]
- Schattenberg, J.M.; Zimmermann, T.; Wörns, M.; Sprinzl, M.F.; Kreft, A.; Kohl, T.; Nagel, M.; Siebler, J.; Schulze Bergkamen, H.; He, Y.W.; et al. Ablation of c-FLIP in hepatocytes enhances death-receptor mediated apoptosis and toxic liver injury in vivo. J. Hepatol. 2011, 55, 1272–1280. [Google Scholar] [CrossRef]
- Gehrke, N.; Nagel, M.; Straub, B.K.; Wörns, M.A.; Schuchmann, M.; Galle, P.R.; Schattenberg, J.M. Loss of cellular FLICE-inhibitory protein promotes acute cholestatic liver injury and inflammation from bile duct ligation. Am. J. Physiol. Gastrointest. Liver Physiol. 2018, 314, G319–G333. [Google Scholar] [CrossRef] [PubMed]
- Wang, P.X.; Ji, Y.X.; Zhang, X.J.; Zhao, L.P.; Yan, Z.Z.; Zhang, P.; Shen, L.J.; Yang, X.; Fang, J.; Tian, S.; et al. Targeting CASP8 and FADD-like apoptosis regulator ameliorates nonalcoholic steatohepatitis in mice and nonhuman primates. Nat. Med. 2017, 23, 439–449. [Google Scholar] [CrossRef]
- Wang, J.; Ma, J.; Nie, H.; Zhang, X.J.; Zhang, P.; She, Z.G.; Li, H.; Ji, Y.X.; Cai, J. Hepatic Regulator of G Protein Signaling 5 Ameliorates Nonalcoholic Fatty Liver Disease by Suppressing Transforming Growth Factor Beta-Activated Kinase 1-c-Jun-N-Terminal Kinase/p38 Signaling. Hepatology 2021, 73, 104–125. [Google Scholar] [CrossRef] [PubMed]
- Seki, N.; Sugano, S.; Suzuki, Y.; Nakagawara, A.; Ohira, M.; Muramatsu, M.; Saito, T.; Hori, T. Isolation, tissue expression, and chromosomal assignment of human RGS5, a novel G-protein signaling regulator gene. J. Hum. Genet. 1998, 43, 202–205. [Google Scholar] [CrossRef]
- Deng, W.; Wang, X.; Xiao, J.; Deng, W.; Wang, X.; Xiao, J.; Chen, K.; Zhou, H.; Shen, D.; Li, H.; et al. Loss of regulator of G protein signaling 5 exacerbates obesity, hepatic steatosis, inflammation and insulin resistance. PLoS ONE 2012, 7, e30256. Available online: https://journals.plos.org/plosone/article?id=10.1371/journal.pone.0030256 (accessed on 7 March 2021).
- Bahrami, A.J.; Gunaje, J.J.; Hayes, B.J.; Riehle, K.J.; Kenerson, H.L.; Yeung, R.S.; Stempien-Otero, A.S.; Campbell, J.S.; Mahoney, W.M., Jr. Regulator of G-protein signaling-5 is a marker of hepatic stellate cells and expression mediates response to liver injury. PLoS ONE 2014, 9, e108505. Available online: https://journals.plos.org/plosone/article?id=10.1371/journal.pone.0108505 (accessed on 7 March 2021).
- Winkler, M.; Staniczek, T.; Kürschner, S.W.; Schmid, C.D.; Schönhaber, H.; Cordero, J.; Kessler, L.; Mathes, A.; Sticht, C.; Neßling, M.; et al. Endothelial GATA4 controls liver fibrosis and regeneration by preventing a pathogenic switch in angiocrine signaling. J. Hepatol. 2021, 74, 380–393. [Google Scholar] [CrossRef] [PubMed]
- Perumpail, B.J.; Khan, M.A.; Yoo, E.R.; Cholankeril, G.; Kim, D.; Ahmed, A. Clinical epidemiology and disease burden of nonalcoholic fatty liver disease. World J. Gastroenterol. 2017, 23, 8263–8276. [Google Scholar] [CrossRef]
- Gottlieb, A.; Mosthael, W.; Sowa, J.P.; Canbay, A. Nonalcoholic-Fatty-Liver-Disease and Nonalcoholic Steatohepatitis: Successful Development of Pharmacological Treatment Will Depend on Translational Research. Digestion 2019, 100, 79–85. [Google Scholar] [CrossRef]
- Kim, Y.M.; Watanabe, T.; Allen, P.B.; Kim, Y.M.; Lee, S.J.; Greengard, P.; Nairn, A.C.; Kwon, Y.G. PNUTS, a protein phosphatase 1 (PP1) nuclear targeting subunit. Characterization of its PP1- and RNA-binding domains and regulation by phosphorylation. J. Biol. Chem. 2003, 278, 13819–13828. [Google Scholar] [CrossRef]
- Landsverk, H.B.; Mora-Bermúdez, F.; Landsverk, O.J.; Hasvold, G.; Naderi, S.; Bakke, O.; Ellenberg, J.; Collas, P.; Syljuåsen, R.G.; Küntziger, T. The protein phosphatase 1 regulator PNUTS is a new component of the DNA damage response. EMBO Rep. 2010, 11, 868–875. [Google Scholar] [CrossRef]
- Zhu, S.; Fisher, L.A.; Bessho, T.; Peng, A. Protein phosphatase 1 and phosphatase 1 nuclear targeting subunit-dependent regulation of DNA-dependent protein kinase and non-homologous end joining. Nucleic Acids Res. 2017, 45, 10583–10594. [Google Scholar] [CrossRef] [PubMed]
- Cortazar, M.A.; Sheridan, R.M.; Erickson, B.; Fong, N.; Glover-Cutter, K.; Brannan, K.; Bentley, D.L. Control of RNA Pol II Speed by PNUTS-PP1 and Spt5 Dephosphorylation Facilitates Termination by a “Sitting Duck Torpedo” Mechanism. Mol. Cell 2019, 76, 896–908.e894. [Google Scholar] [CrossRef]
- Kim, H.; Lee, O.H.; Xin, H.; Chen, L.Y.; Qin, J.; Chae, H.K.; Lin, S.Y.; Safari, A.; Liu, D.; Songyang, Z. TRF2 functions as a protein hub and regulates telomere maintenance by recognizing specific peptide motifs. Nat. Struct. Mol. Biol. 2009, 16, 372–379. [Google Scholar] [CrossRef]
- Turner, K.J.; Vasu, V.; Griffin, D.K. Telomere Biology and Human Phenotype. Cells 2019, 8, 73. [Google Scholar] [CrossRef] [PubMed]
- Boon, R.A.; Iekushi, K.; Lechner, S.; Seeger, T.; Fischer, A.; Heydt, S.; Kaluza, D.; Tréguer, K.; Carmona, G.; Bonauer, A.; et al. MicroRNA-34a regulates cardiac ageing and function. Nature 2013, 495, 107–110. [Google Scholar] [CrossRef]
- Lee, S.J.; Lim, C.J.; Min, J.K.; Lee, J.K.; Kim, Y.M.; Lee, J.Y.; Won, M.H.; Kwon, Y.G. Protein phosphatase 1 nuclear targeting subunit is a hypoxia inducible gene: Its role in post-translational modification of p53 and MDM2. Cell Death Differ. 2007, 14, 1106–1116. [Google Scholar] [CrossRef]
- Li, M.; Zhou, J.Y.; Ge, Y.; Matherly, L.H.; Wu, G.S. The phosphatase MKP1 is a transcriptional target of p53 involved in cell cycle regulation. J. Biol. Chem. 2003, 278, 41059–41068. [Google Scholar] [CrossRef] [PubMed]
- Liu, Y.X.; Wang, J.; Guo, J.; Wu, J.; Lieberman, H.B.; Yin, Y. DUSP1 is controlled by p53 during the cellular response to oxidative stress. Mol. Cancer Res. 2008, 6, 624–633. [Google Scholar] [CrossRef]
- Teumer, A.; Qi, Q.; Nethander, M.; Aschard, H.; Bandinelli, S.; Beekman, M.; Berndt, S.I.; Bidlingmaier, M.; Broer, L.; CHARGE Longevity Working Group; et al. Genomewide meta-analysis identifies loci associated with IGF-I and IGFBP-3 levels with impact on age-related traits. Aging Cell 2016, 15, 811–824. [Google Scholar] [CrossRef]
- Wit, J.M.; Oostdijk, W.; Losekoot, M. Spectrum of insulin-like growth factor deficiency. Endocr. Dev. 2012, 23, 30–41. Available online: https://www.karger.com/Article/Abstract/341739 (accessed on 7 March 2021).
- Walenkamp, M.J.; Losekoot, M.; Wit, J.M. Molecular IGF-1 and IGF-1 receptor defects: From genetics to clinical management. Endocr. Dev 2013, 24, 128–137. Available online: https://www.karger.com/Article/Abstract/342841 (accessed on 7 March 2021).
- Wit, J.M.; de Luca, F. Atypical defects resulting in growth hormone insensitivity. Growth Horm. IGF Res. 2016, 28, 57–61. [Google Scholar] [CrossRef]
- Li, G.L.; Niu, L.L.; Liu, H.F.; Guo, J.Z. Structure and function of insulin-like growth factor acid-labile subunits in mammalian homologues. Yi Chuan 2015, 37, 1185–1193. (In Chinese) [Google Scholar] [PubMed]
- Domené, H.M.; Hwa, V.; Argente, J.; Wit, J.M.; Camacho-Hübner, C.; Jasper, H.G.; Pozo, J.; van Duyvenvoorde, H.A.; Yakar, S.; Fofanova-Gambetti, O.V.; et al. Human acid-labile subunit deficiency: Clinical, endocrine and metabolic consequences. Horm. Res. 2009, 72, 129–141. Available online: https://www.karger.com/Article/FullText/232486 (accessed on 7 March 2021).
- Zaidman, D.; Wolfson, H.J. Protein-Peptide Interaction Design: PepCrawler and PinaColada. Methods Mol. Biol. 2017, 1561, 279–290. [Google Scholar] [PubMed]
- Poudel, S.B.; Dixit, M.; Neginskaya, M.; Nagaraj, K.; Pavlov, E.; Werner, H.; Yakar, S. Effects of GH/IGF on the Aging Mitochondria. Cells 2020, 9, 1384. [Google Scholar] [CrossRef] [PubMed]
- Hardeland, R.; Madrid, J.A.; Tan, D.X.; Reiter, R.J. Melatonin, the circadian multioscillator system and health: The need for detailed analyses of peripheral melatonin signaling. J. Pineal Res. 2012, 52, 139–166. [Google Scholar] [CrossRef]
- Hardeland, R. Melatonin in aging and disease—Multiple consequences of reduced secretion, options and limits of treatment. Aging Dis. 2012, 3, 194–225. Available online: https://www.ncbi.nlm.nih.gov/labs/pmc/articles/PMC3377831/pdf/ad-3-2-194.pdf (accessed on 7 March 2021).
- Sayed, N.; Huang, Y.; Nguyen, K.; Krejciova-Rajaniemi, Z.; Grawe, A.P.; Gao, T.; Tibshirani, R.; Hastie, T.; Alpert, A.; Cui, L.; et al. An inflammatory aging clock (iAge) based on deep learning tracks multi-morbidity, immunosenescence, frailty and cardiovascular aging. Nat. Aging 2021, 1, 598–615. [Google Scholar] [CrossRef]
- Sato, S.; Solanas, G.; Peixoto, F.O.; Bee, L.; Symeonidi, A.; Schmidt, M.S.; Brenner, C.; Masri, S.; Benitah, S.A.; Sassone-Corsi, P. Circadian Reprogramming in the Liver Identifies Metabolic Pathways of Aging. Cell 2017, 170, 664–677.e11. [Google Scholar] [CrossRef] [PubMed]
- White, R.R.; Milholland, B.; MacRae, S.L.; Lin, M.; Zheng, D.; Vijg, J. Comprehensive transcriptional landscape of aging mouse liver. BMC Genom. 2015, 16, 899. [Google Scholar] [CrossRef] [PubMed]
Publisher’s Note: MDPI stays neutral with regard to jurisdictional claims in published maps and institutional affiliations. |
© 2021 by the authors. Licensee MDPI, Basel, Switzerland. This article is an open access article distributed under the terms and conditions of the Creative Commons Attribution (CC BY) license (https://creativecommons.org/licenses/by/4.0/).