Whole Transcription Profile of Responders to Anti-TNF Drugs in Pediatric Inflammatory Bowel Disease


 , , , , , ,
  ,
,  add
Show full author list
add
Show full author list
Abstract
1. Introduction
2. Materials and Methods
2.1. Patient Samples
2.2. Ethics Statement
2.3. Extraction of Total RNA from Whole Blood
2.4. RNA Sequencing
2.5. Quantitative Reverse Transcription-Polymerase Chain Reaction (qRT-PCR)
2.6. Statistical Analysis
3. Results
3.1. Patients’ Characteristics
3.2. Differential Gene Expression Using RNAseq in the Response of Anti-TNF Agents Prior to Starting Treatment
3.3. Differential Gene Expression in Response to Anti-TNF Agents at Week 2 Post-Treatment
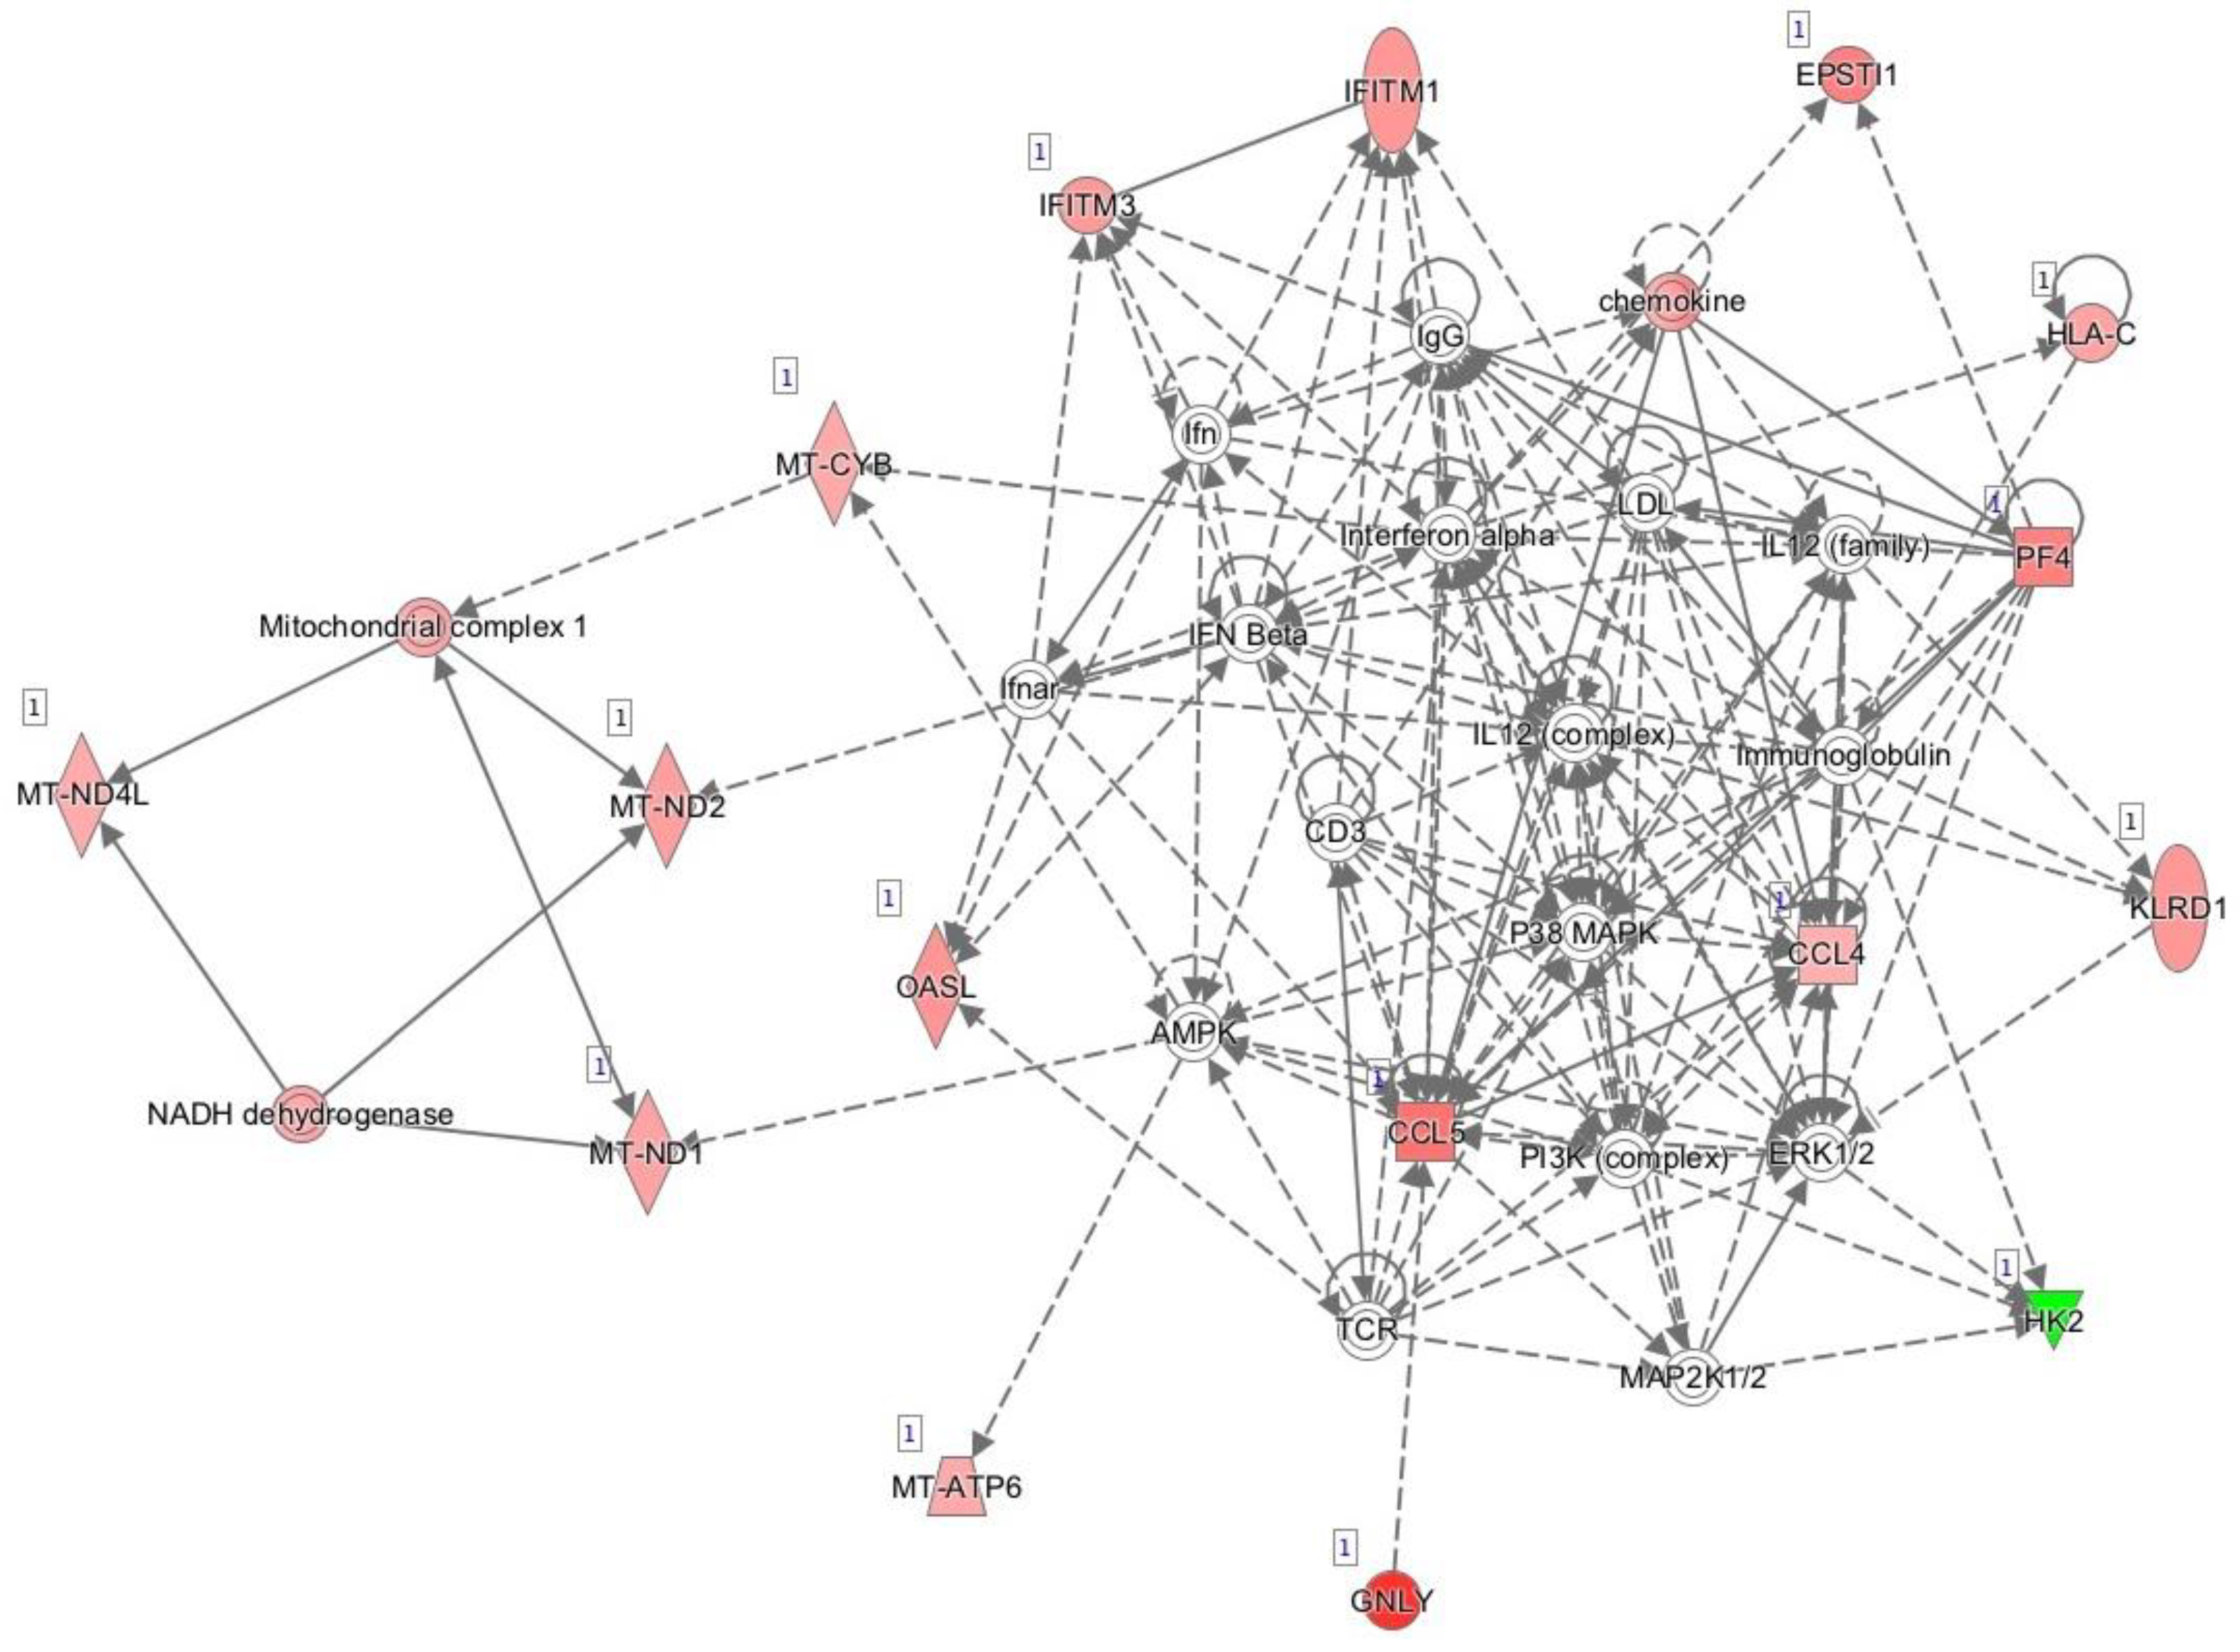
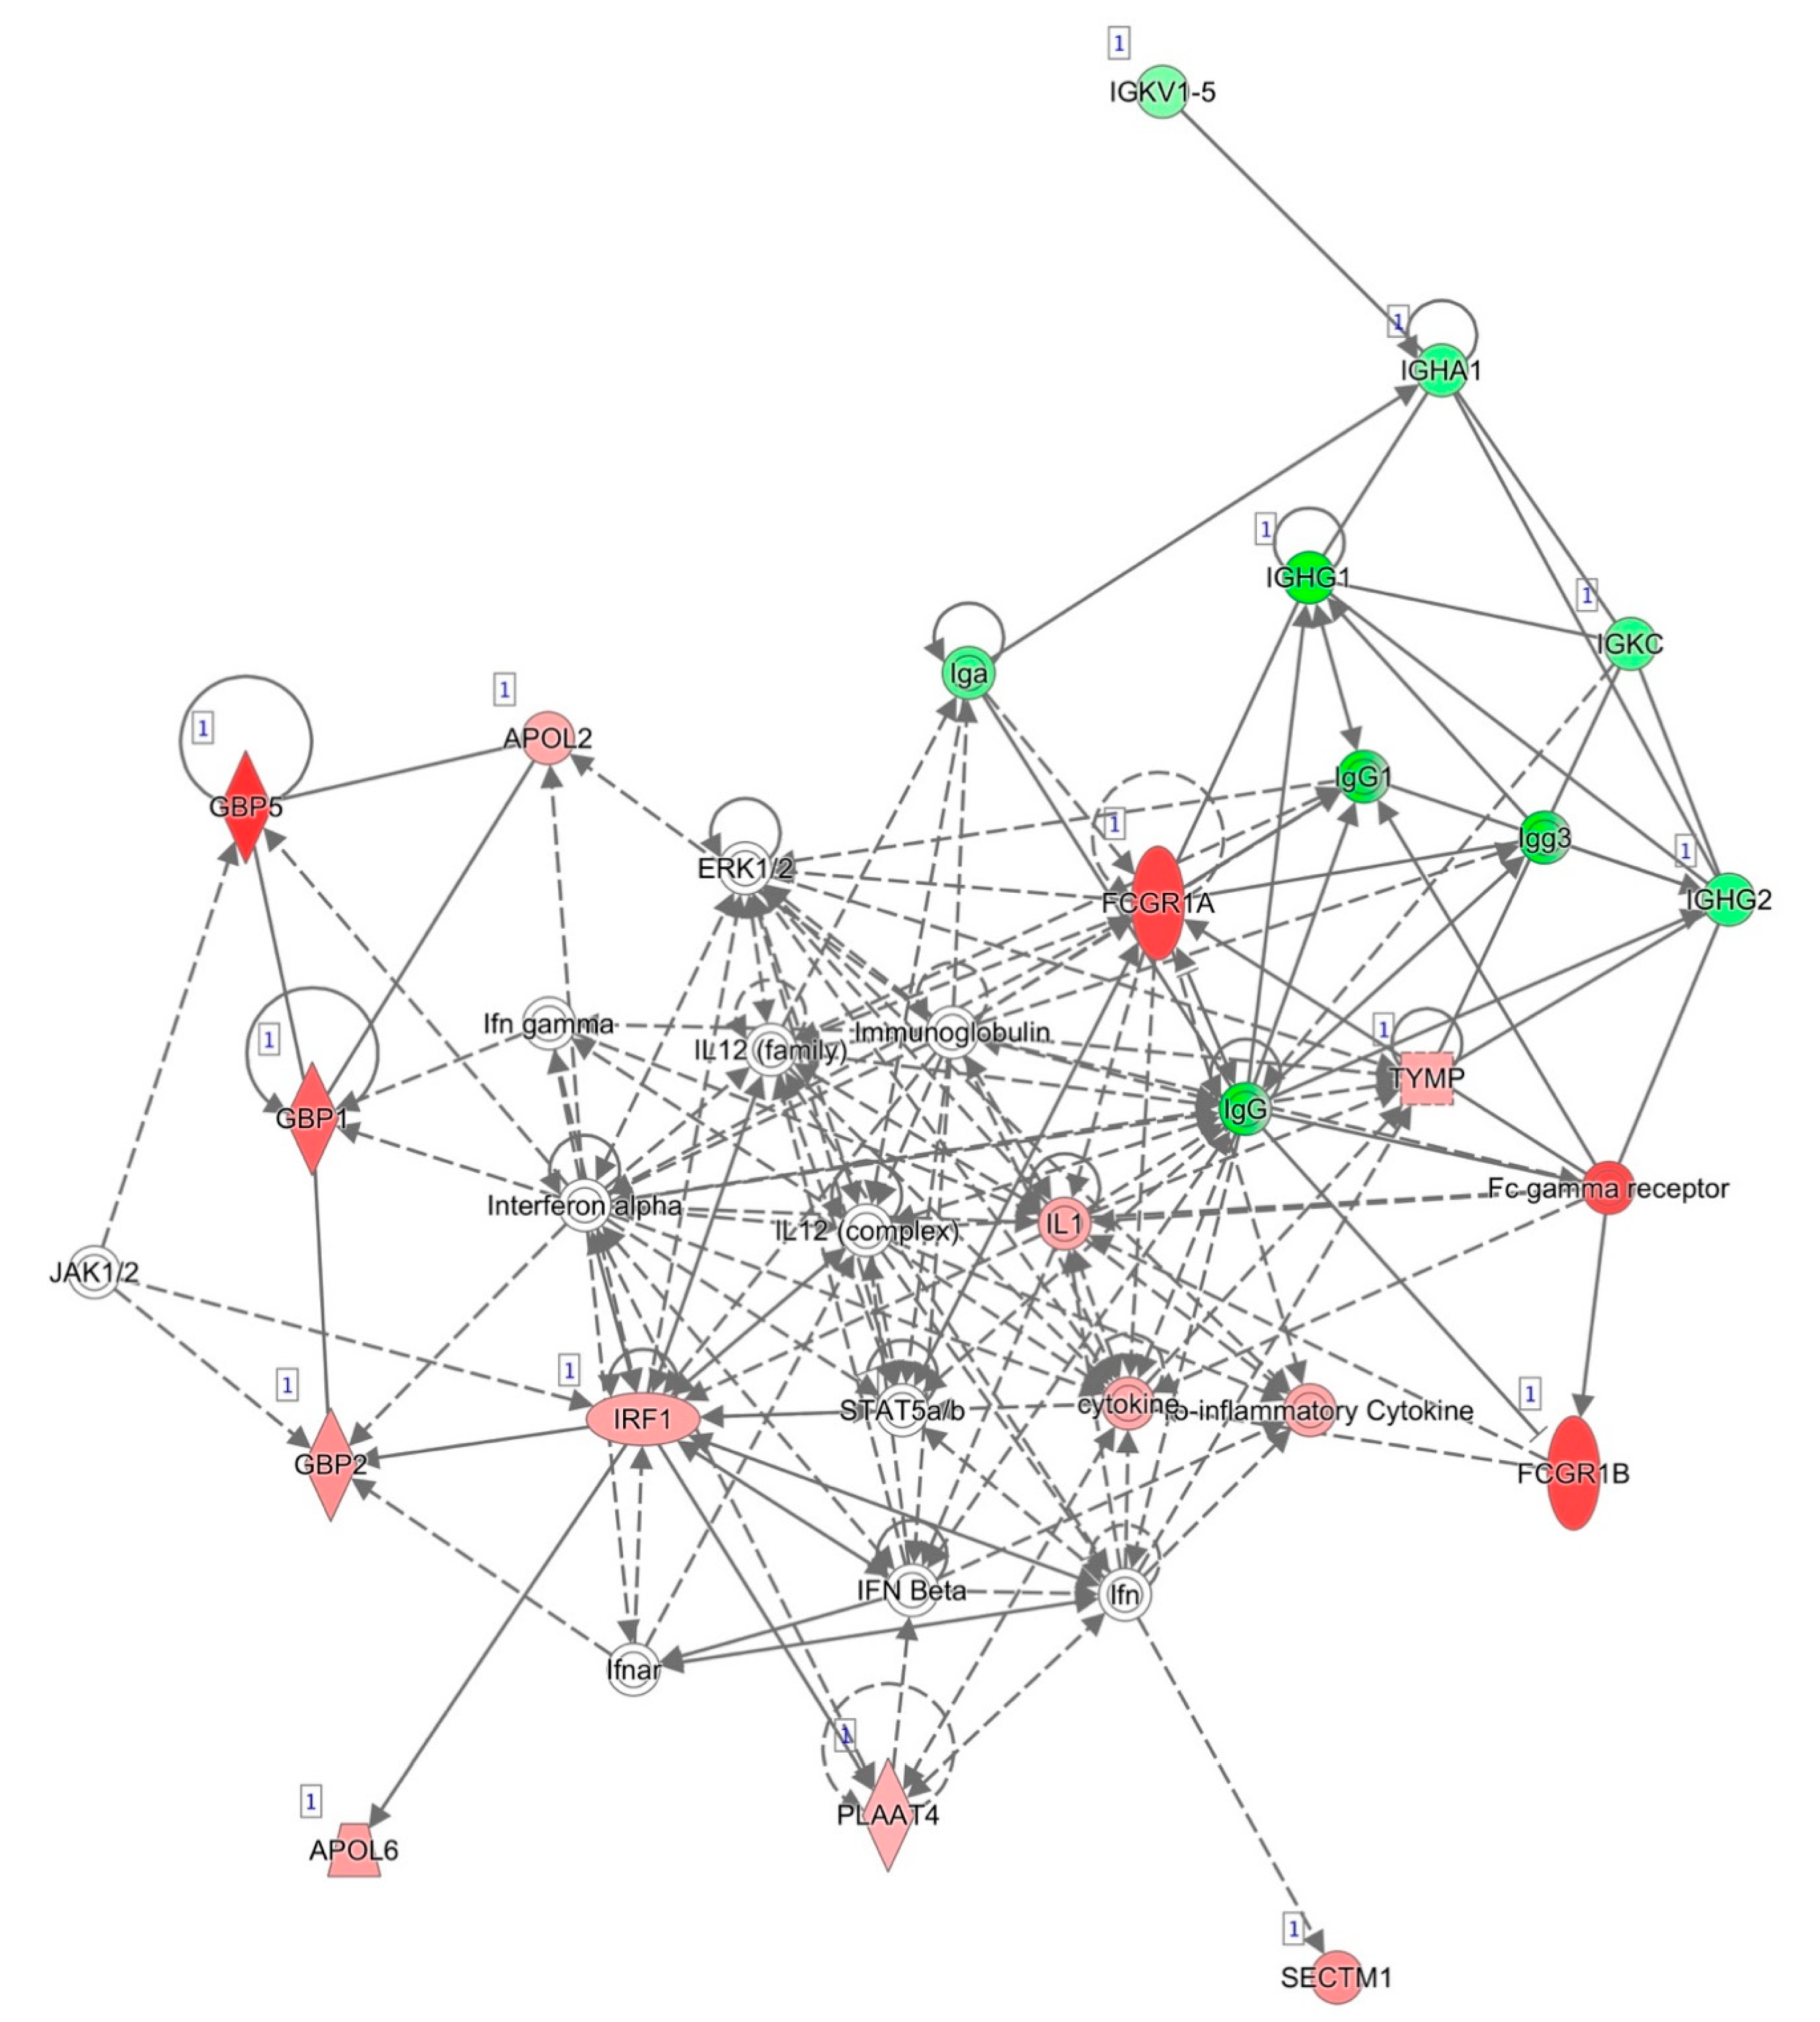
3.4. Functional in Silico Analysis
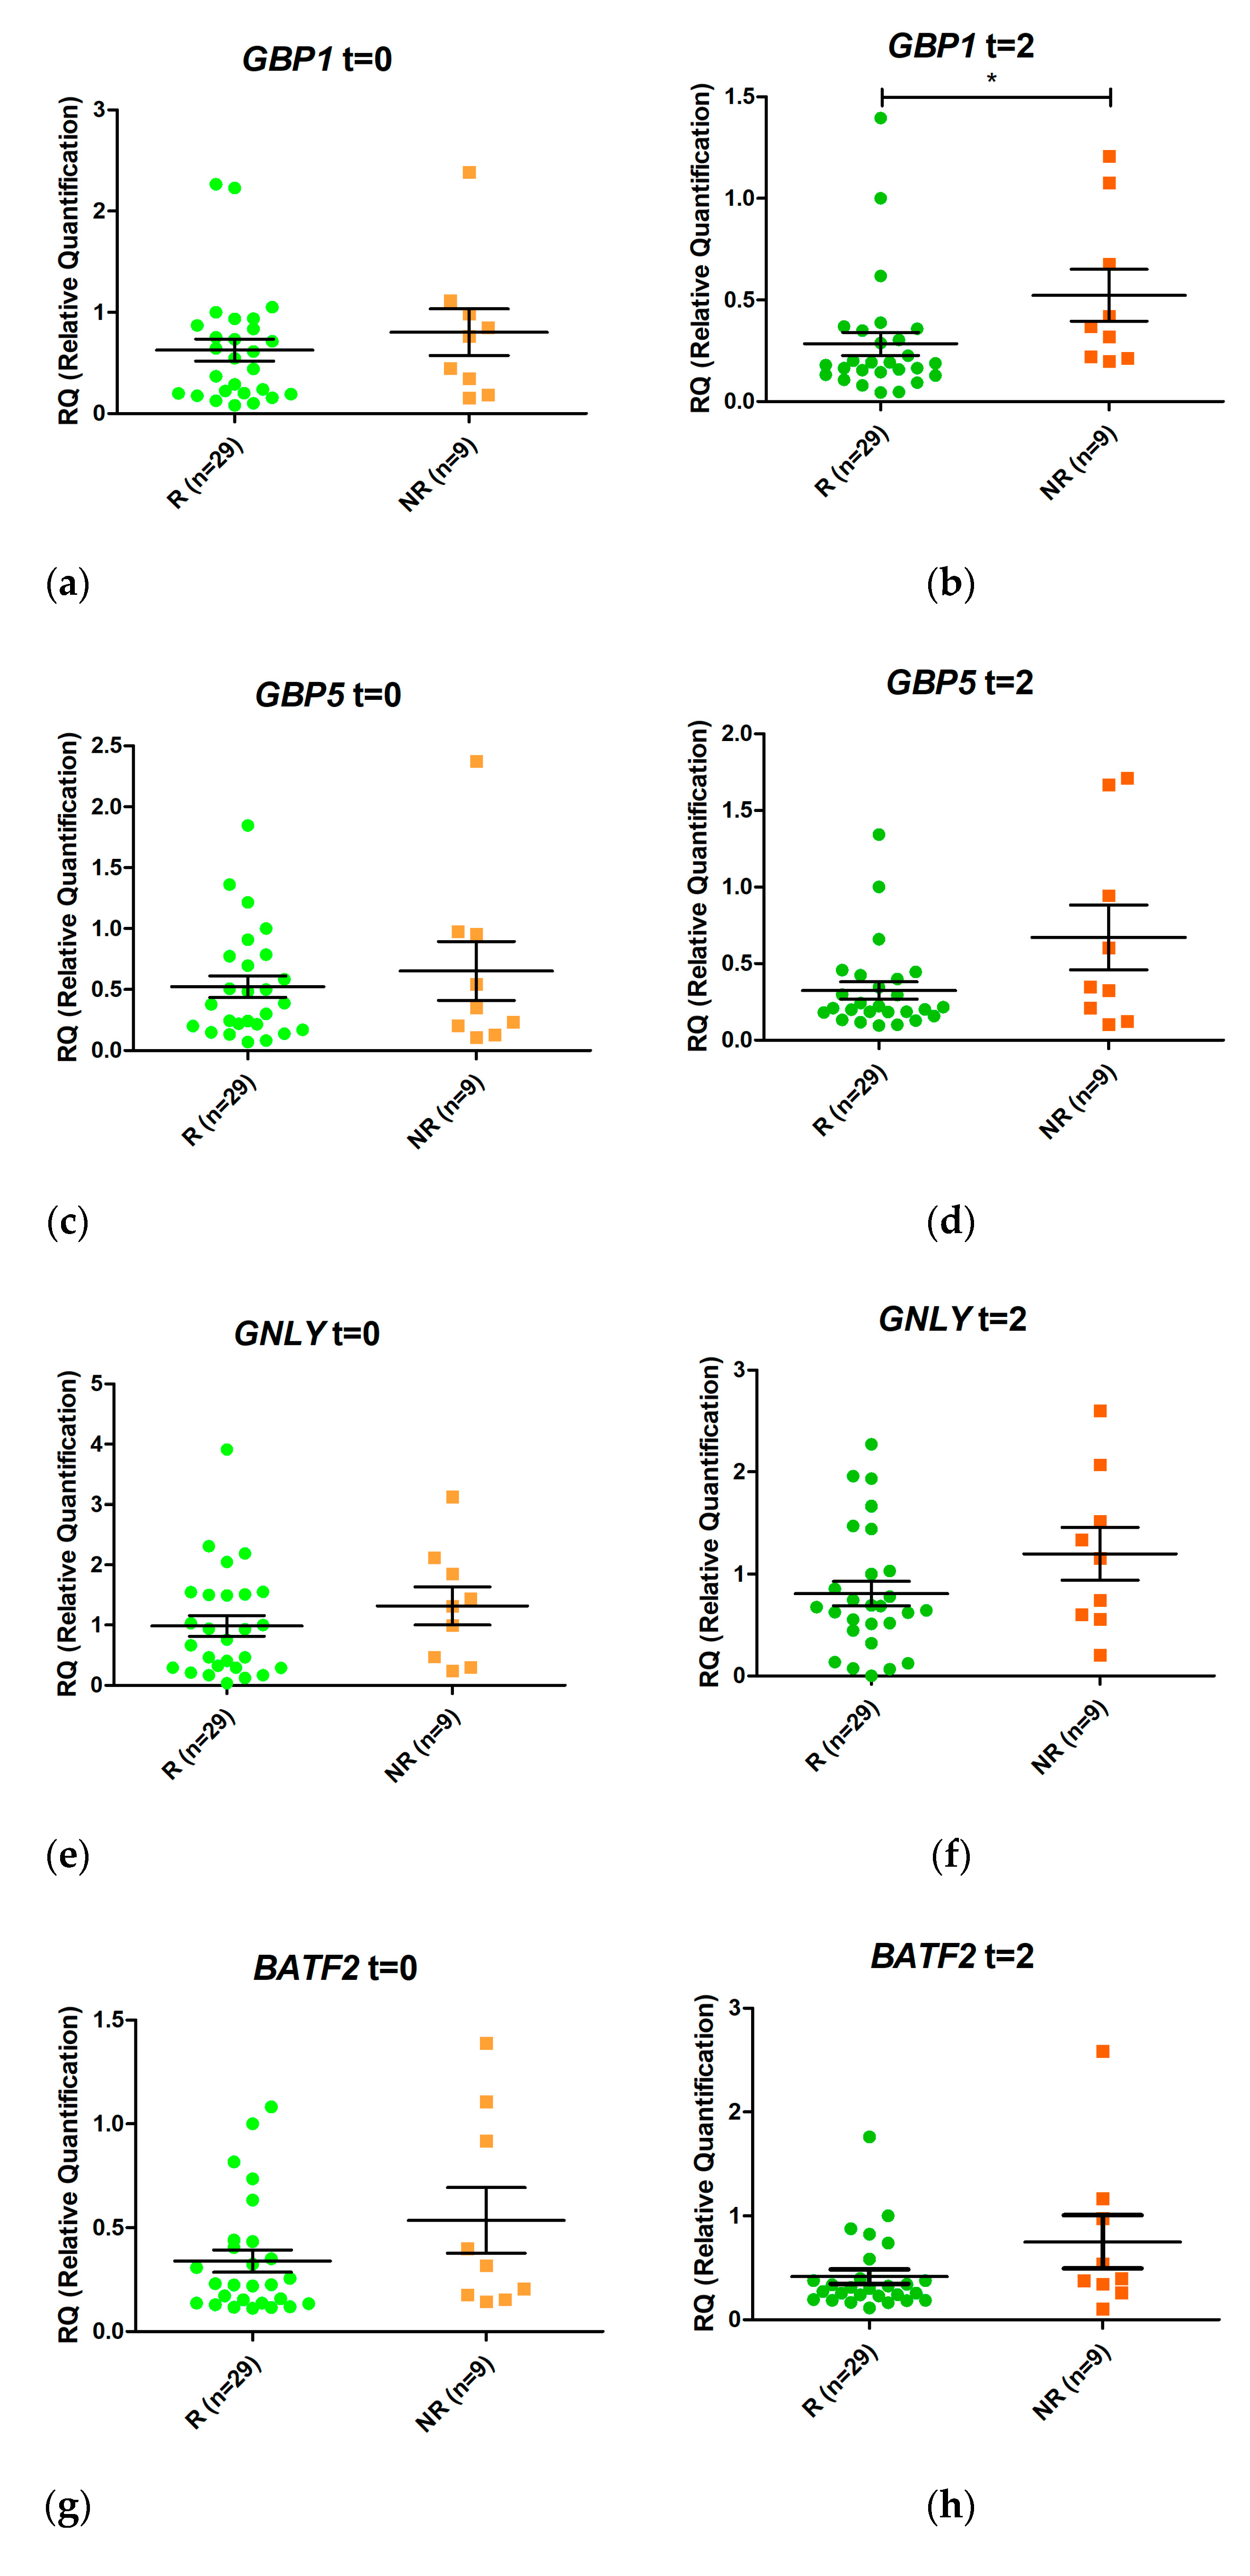
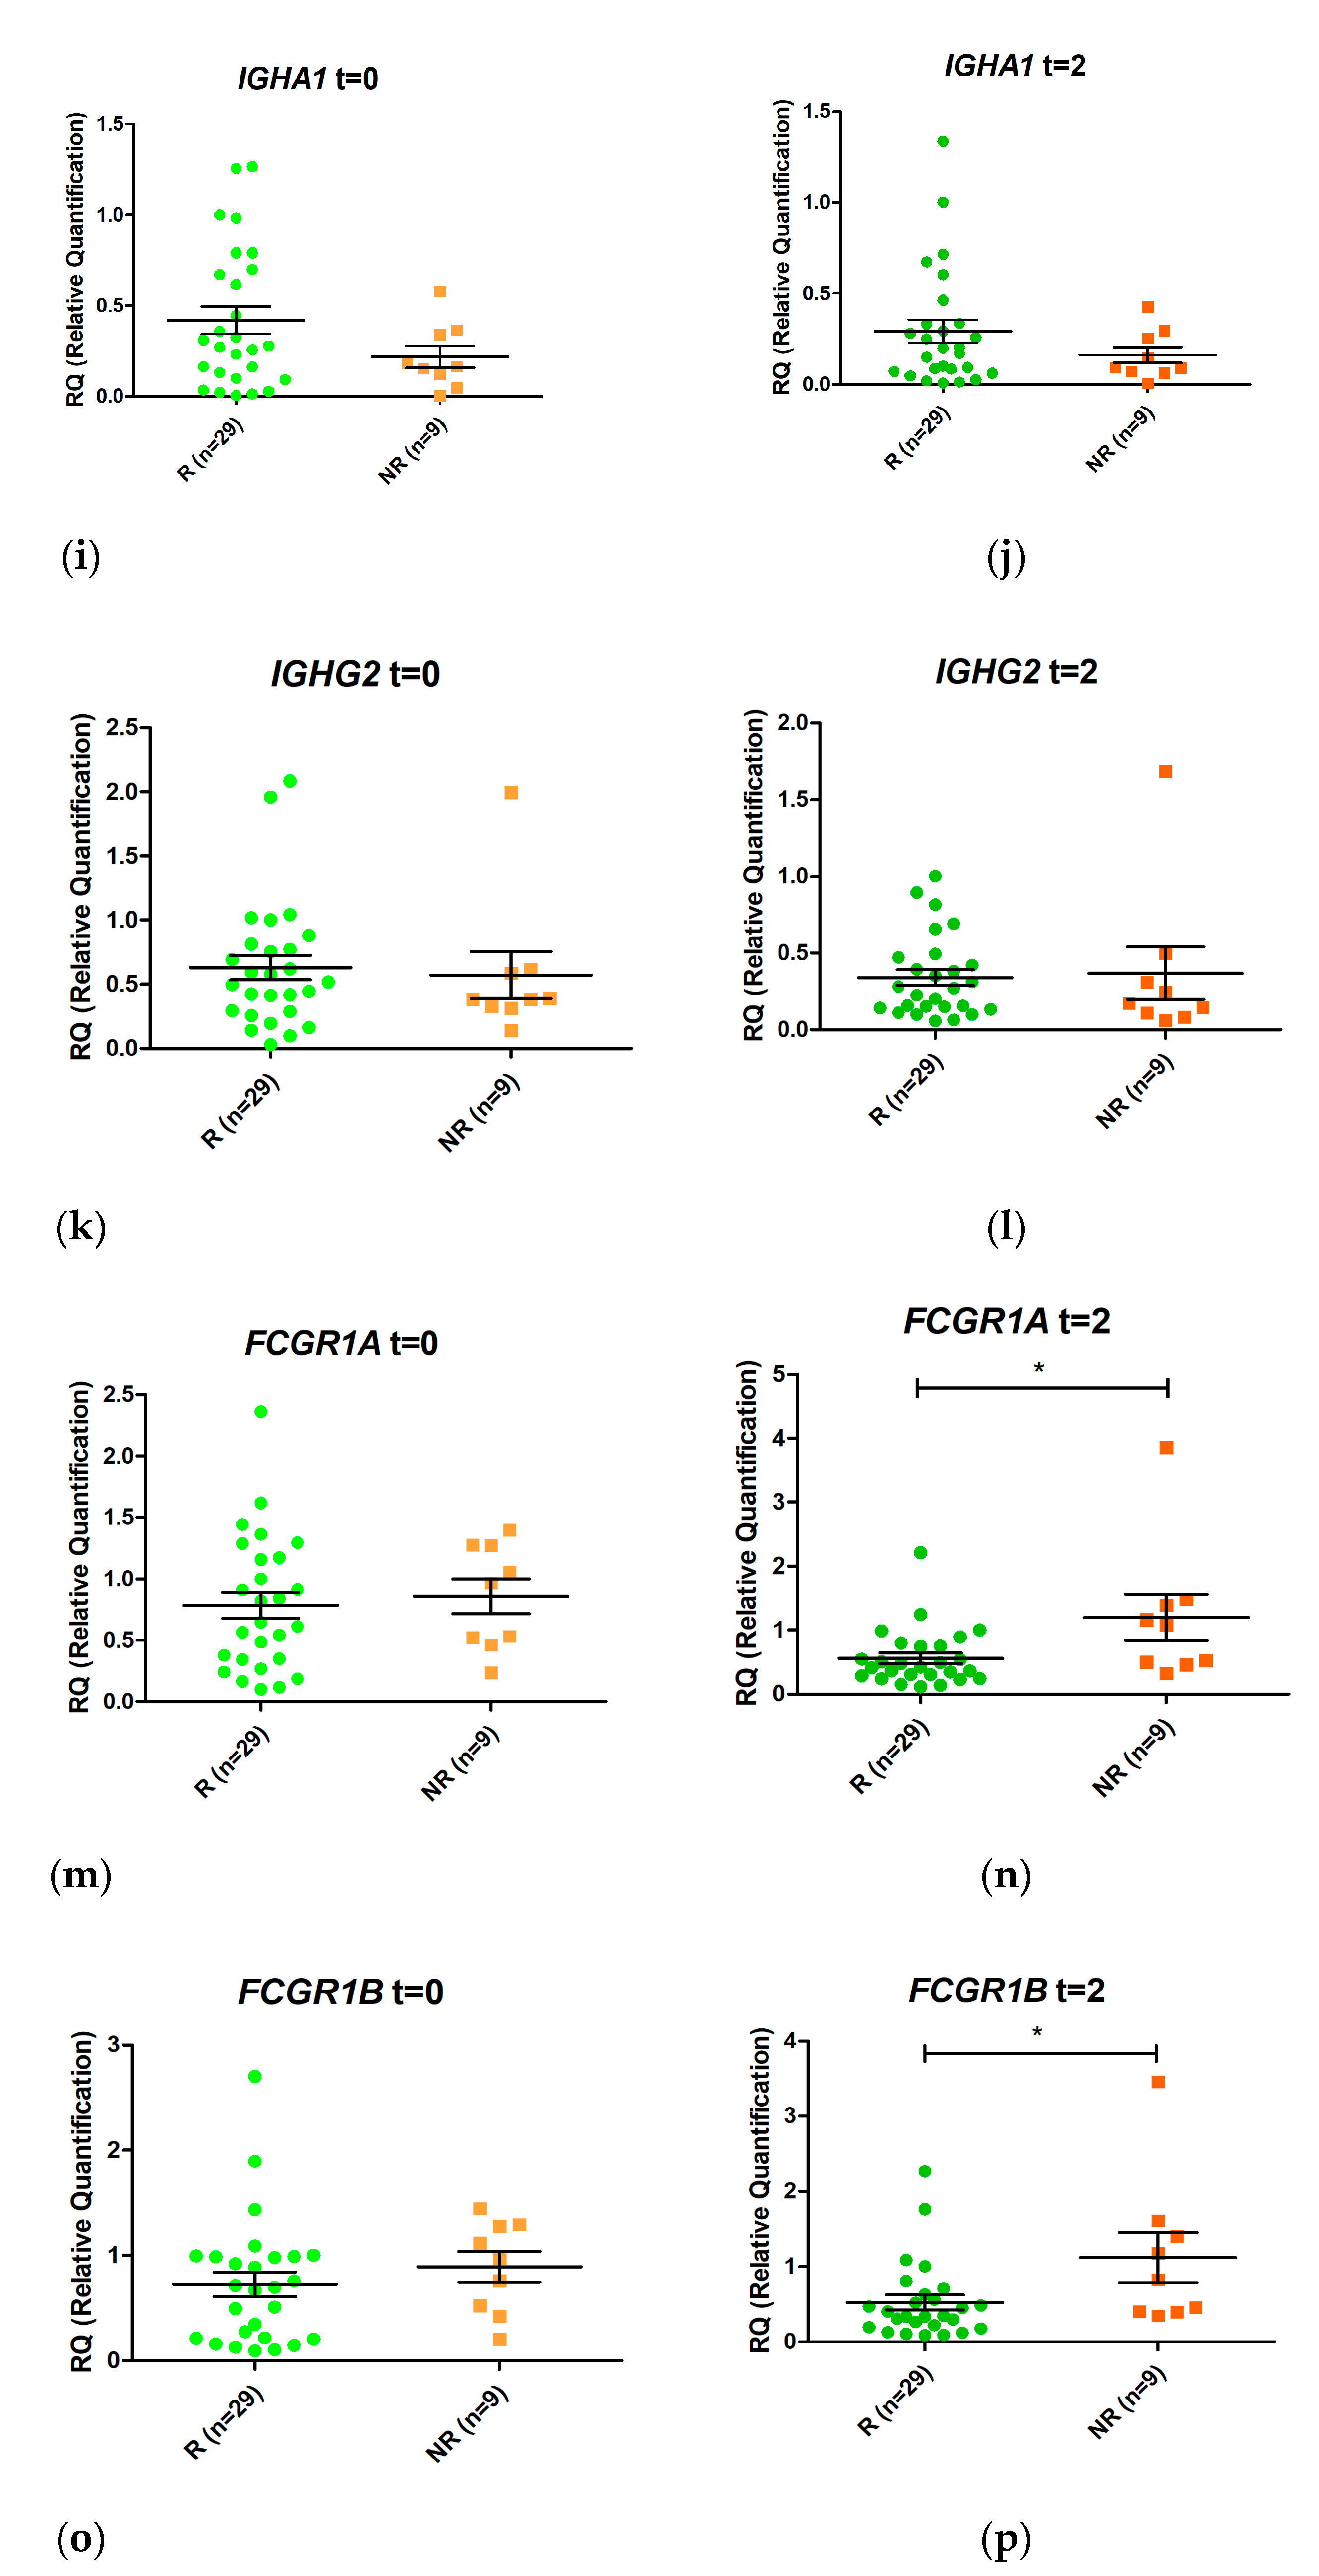
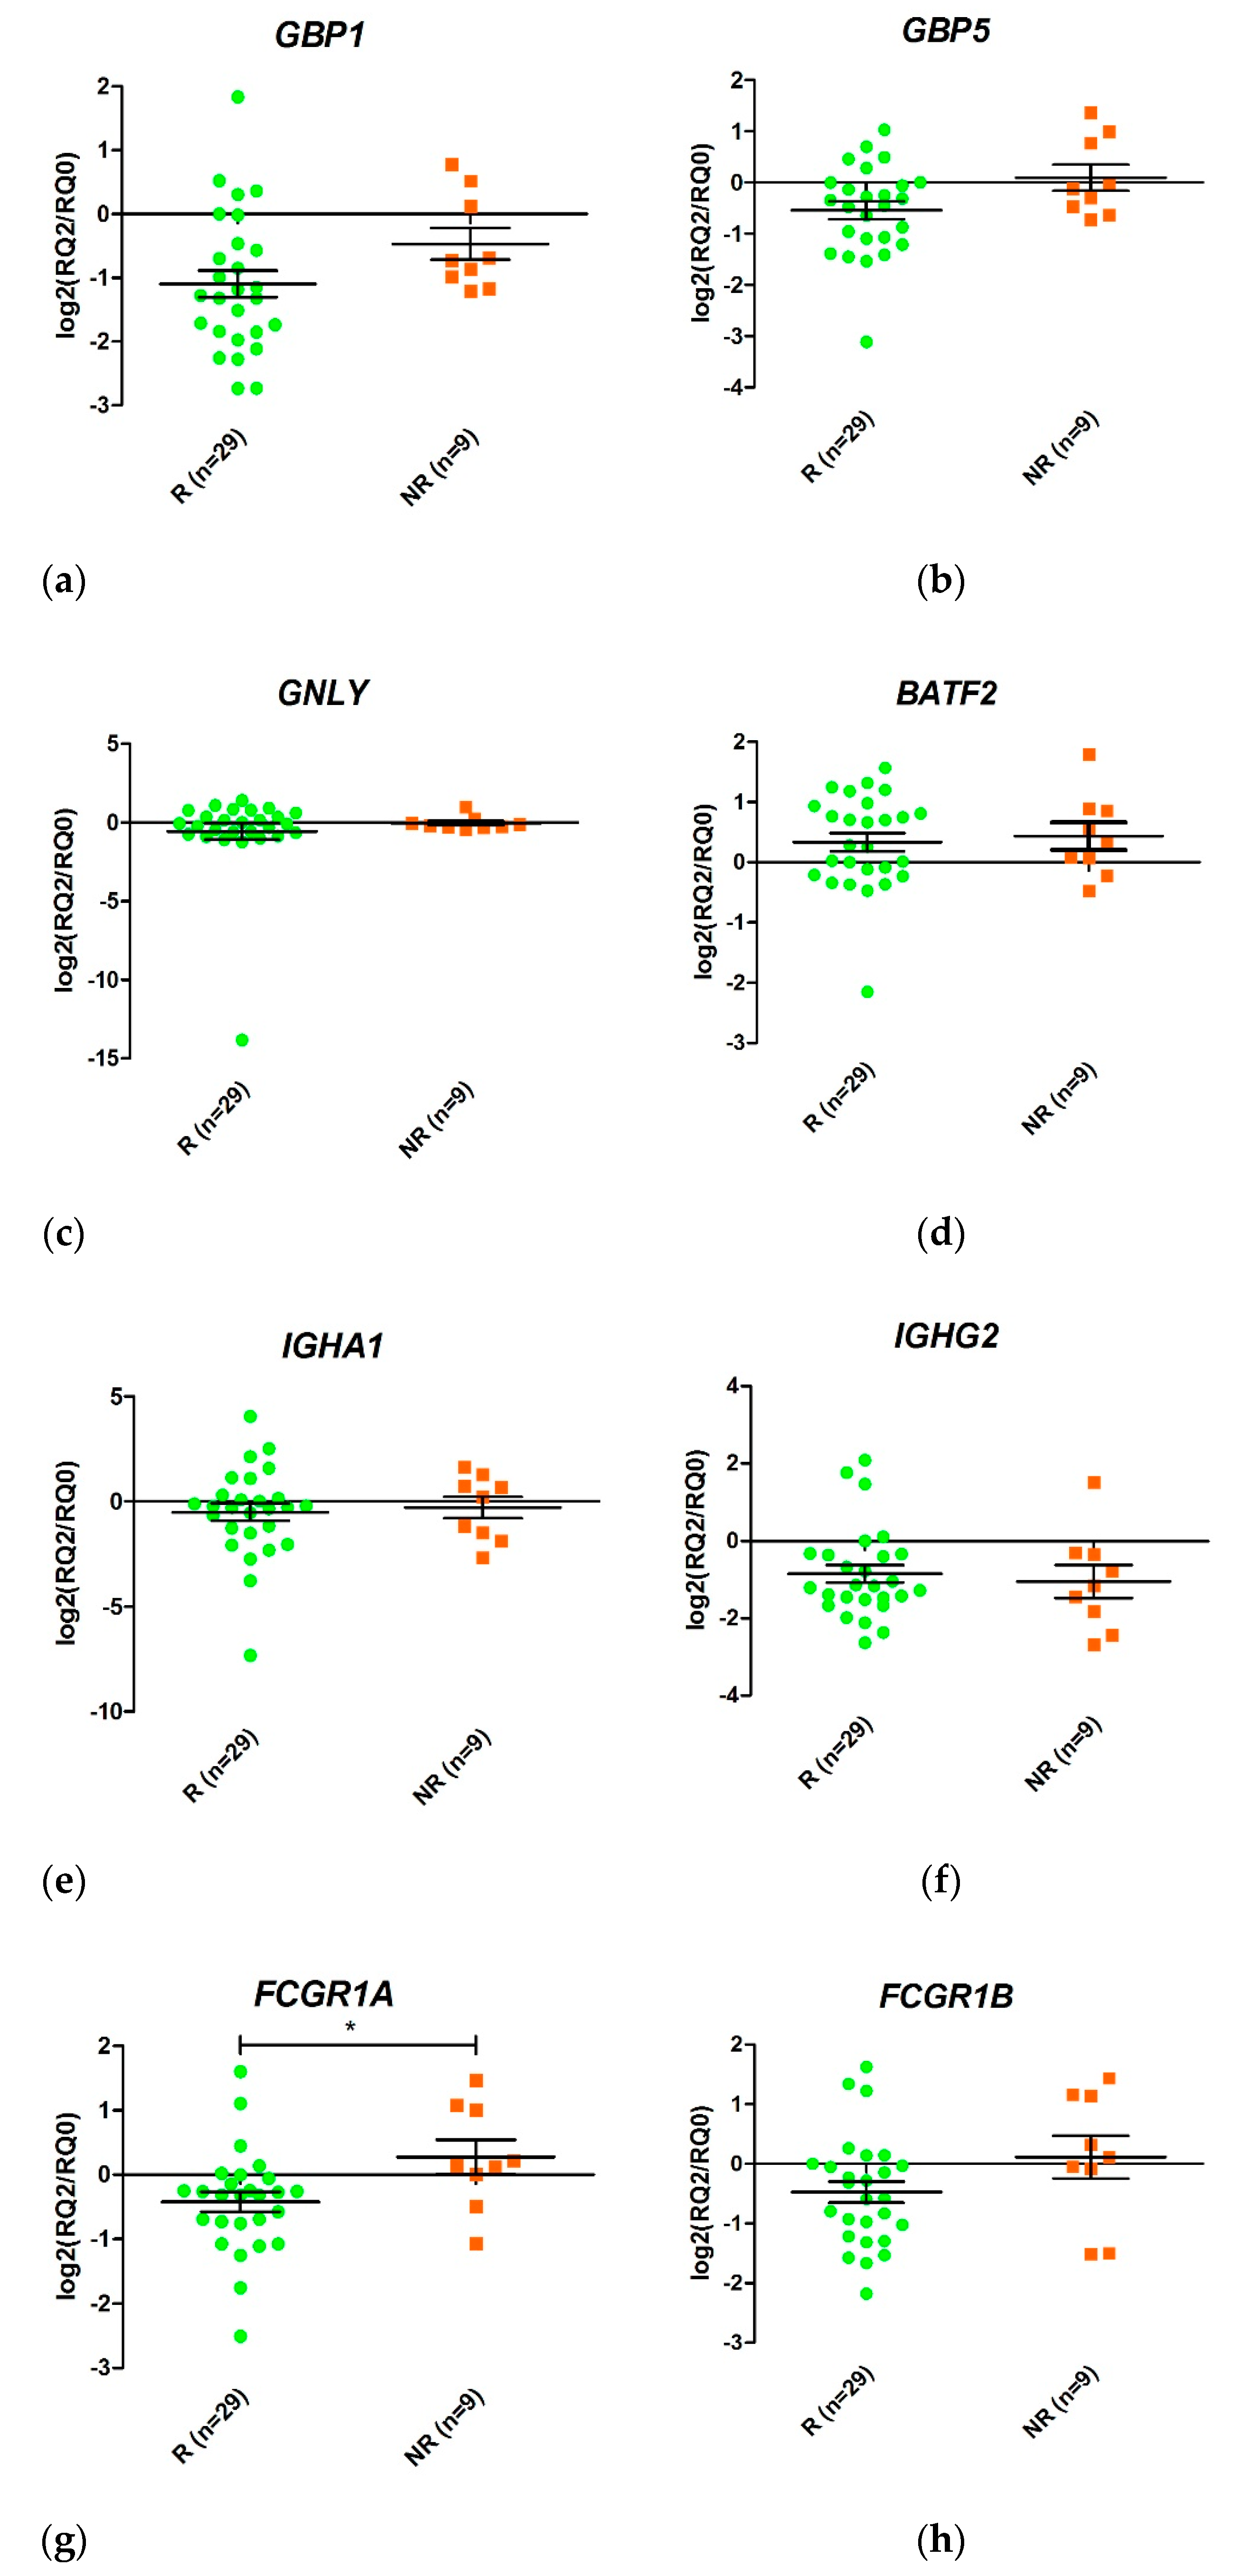
3.5. Validation of Differentially Expressed Genes by qRT-PCR
3.6. Prediction of Response to Anti-TNF Therapy Based on Expression of GBP1, FCGR1A, and FCGR1B after Two Weeks of Treatment
3.7. Differences in Gene Expression between Responders and Non-Responders during the First Two Weeks of Anti-TNF Therapy
4. Discussion
5. Conclusions
Supplementary Materials
Author Contributions
Funding
Institutional Review Board Statement
Informed Consent Statement
Data Availability Statement
Acknowledgments
Conflicts of Interest
References
- Gu, P.; Feagins, L.A. Dining with Inflammatory Bowel Disease: A Review of the Literature on Diet in the Pathogenesis and Management of IBD. Inflamm. Bowel Dis. 2019. [Google Scholar] [CrossRef] [PubMed]
- Kuhnen, A. Genetic and Environmental Considerations for Inflammatory Bowel Disease. Surg. Clin. N. Am. 2019, 99, 1197–1207. [Google Scholar] [CrossRef] [PubMed]
- Sawczenko, A.; Sandhu, B.K. Presenting features of inflammatory bowel disease in Great Britain and Ireland. Arch. Dis. Child. 2003, 88, 995–1000. [Google Scholar] [CrossRef] [PubMed]
- Henderson, P.; van Limbergen, J.E.; Wilson, D.C.; Satsangi, J.; Russell, R.K. Genetics of childhood-onset inflammatory bowel disease. Inflamm. Bowel Dis. 2011, 17, 346–361. [Google Scholar] [CrossRef]
- Hyams, J.; Crandall, W.; Kugathasan, S.; Griffiths, A.; Olson, A.; Johanns, J.; Liu, G.; Travers, S.; Heuschkel, R.; Markowitz, J.; et al. Reach Study Group Induction and Maintenance Infliximab Therapy for the Treatment of Moderate-to-Severe Crohn’s Disease in Children. Gastroenterology 2007, 132, 863–873. [Google Scholar] [CrossRef]
- Hendy, P.; Hart, A.; Irving, P. Anti-TNF drug and antidrug antibody level monitoring in IBD: A practical guide. Frontline Gastroenterol. 2016, 7, 122–128. [Google Scholar] [CrossRef]
- Kelly, O.B.; Donnell, S.O.; Stempak, J.M.; Steinhart, A.H.; Silverberg, M.S. Therapeutic Drug Monitoring to Guide Infliximab Dose Adjustment is Associated with Better Endoscopic Outcomes than Clinical Decision Making Alone in Active Inflammatory Bowel Disease. Inflamm. Bowel Dis. 2017, 23, 1202–1209. [Google Scholar] [CrossRef]
- Courbette, O.; Aupiais, C.; Viala, J.; Hugot, J.-P.; Roblin, X.; Candon, S.; Louveau, B.; Chatenoud, L.; Martinez-Vinson, C. Trough Levels of Infliximab at W6 Are Predictive of Remission at W14 in Pediatric Crohn Disease. J. Pediatr. Gastroenterol. Nutr. 2019, 70, 310–317. [Google Scholar] [CrossRef]
- Arijs, I.; Li, K.; Toedter, G.; Quintens, R.; Van Lommel, L.; Van Steen, K.; Leemans, P.; De Hertogh, G.; Lemaire, K.; Ferrante, M.; et al. Mucosal gene signatures to predict response to infliximab in patients with ulcerative colitis. Gut 2009, 58, 1612–1619. [Google Scholar] [CrossRef]
- Arijs, I.; Quintens, R.; Van Lommel, L.; Van Steen, K.; De Hertogh, G.; Lemaire, K.; Schraenen, A.; Perrier, C.; Van Assche, G.; Vermeire, S.; et al. Predictive value of epithelial gene expression profiles for response to infliximab in Crohn’s disease. Inflamm. Bowel Dis. 2010, 16, 2090–2098. [Google Scholar] [CrossRef]
- Julià, A.; Erra, A.; Palacio, C.; Tomas, C.; Sans, X.; Barceló, P.; Marsal, S. An eight-gene blood expression profile predicts the response to infliximab in rheumatoid arthritis. PLoS ONE 2009, 4, e7556. [Google Scholar] [CrossRef]
- Nakamura, S.; Suzuki, K.; Iijima, H.; Hata, Y.; Lim, C.R.; Ishizawa, Y.; Kameda, H.; Amano, K.; Matsubara, K.; Matoba, R.; et al. Identification of baseline gene expression signatures predicting therapeutic responses to three biologic agents in rheumatoid arthritis: A retrospective observational study. Arthritis Res. Ther. 2016, 18, 159. [Google Scholar] [CrossRef]
- Toedter, G.; Li, K.; Marano, C.; Ma, K.; Sague, S.; Huang, C.C.; Song, X.-Y.; Rutgeerts, P.; Baribaud, F. Gene Expression Profiling and Response Signatures Associated with Differential Responses to Infliximab Treatment in Ulcerative Colitis. Am. J. Gastroenterol. 2011, 106, 1272–1280. [Google Scholar] [CrossRef]
- Ostrowski, J.; Dabrowska, M.; Lazowska, I.; Paziewska, A.; Balabas, A.; Kluska, A.; Kulecka, M.; Karczmarski, J.; Ambrozkiewicz, F.; Piatkowska, M.; et al. Redefining the Practical Utility of Blood Transcriptome Biomarkers in Inflammatory Bowel Diseases. J. Crohn Colitis 2019, 13, 626–633. [Google Scholar] [CrossRef]
- Verstockt, B.; Verstockt, S.; Dehairs, J.; Ballet, V.; Blevi, H.; Wollants, W.-J.; Breynaert, C.; Van Assche, G.; Vermeire, S.; Ferrante, M. Low TREM1 expression in whole blood predicts anti-TNF response in inflammatory bowel disease. EBioMedicine 2019. [Google Scholar] [CrossRef]
- Toonen, E.J.M.; Gilissen, C.; Franke, B.; Kievit, W.; Eijsbouts, A.M.; den Broeder, A.A.; van Reijmersdal, S.V.; Veltman, J.A.; Scheffer, H.; Radstake, T.R.D.J.; et al. Validation Study of Existing Gene Expression Signatures for Anti-TNF Treatment in Patients with Rheumatoid Arthritis. PLoS ONE 2012, 7, e33199. [Google Scholar] [CrossRef]
- Salvador-Martín, S.; Raposo-Gutiérrez, I.; Navas-López, V.M.; Gallego-Fernández, C.; Moreno-álvarez, A.; Solar-Boga, A.; Muñoz-Codoceo, R.; Magallares, L.; Martínez-Ojinaga, E.; Fobelo, M.J.; et al. Gene signatures of early response to anti-TNF drugs in pediatric inflammatory bowel disease. Int. J. Mol. Sci. 2020, 21, 3364. [Google Scholar] [CrossRef]
- Harris, P.A.; Taylor, R.; Thielke, R.; Payne, J.; Gonzalez, N.; Conde, J.G. Research electronic data capture (REDCap)—A metadata—Driven methodology and workflow process for providing translational research informatics support. J. Biomed. Inform. 2009, 42, 377–381. [Google Scholar] [CrossRef]
- Edgar, R.; Domrachev, M.; Lash, A.E. Gene Expression Omnibus: NCBI gene expression and hybridization array data repository. Nucleic Acids Res. 2002, 30, 207–210. [Google Scholar] [CrossRef]
- Glas, A.S.; Lijmer, J.G.; Prins, M.H.; Bonsel, G.J.; Bossuyt, P.M.M. The diagnostic odds ratio: A single indicator of test performance. J. Clin. Epidemiol. 2003, 56, 1129–1135. [Google Scholar] [CrossRef]
- Gazouli, M.; Pachoula, I.; Panayotou, I.; Mantzaris, G.; Chrousos, G.; Anagnou, N.P.; Roma-Giannikou, E. NOD2/CARD15, ATG16L1 and IL23R gene polymorphisms and childhood-onset of Crohn’s disease. World J. Gastroenterol. 2010, 16, 1753–1758. [Google Scholar] [CrossRef] [PubMed]
- Moran, C.J.; Walters, T.D.; Guo, C.-H.; Kugathasan, S.; Klein, C.; Turner, D.; Wolters, V.M.; Bandsma, R.H.; Mouzaki, M.; Zachos, M.; et al. IL-10R polymorphisms are associated with very-early-onset ulcerative colitis. Inflamm. Bowel Dis. 2013, 19, 115–123. [Google Scholar] [CrossRef] [PubMed]
- Vaiopoulou, A.; Gazouli, M.; Papadopoulou, A.; Anagnostopoulos, A.K.; Karamanolis, G.; Theodoropoulos, G.E.; M’Koma, A.; Tsangaris, G.T. Serum protein profiling of adults and children with Crohn disease. J. Pediatr. Gastroenterol. Nutr. 2015, 60, 42–47. [Google Scholar] [CrossRef]
- Dubinsky, M.C.; Mei, L.; Friedman, M.; Dhere, T.; Haritunians, T.; Hakonarson, H.; Kim, C.; Glessner, J.; Targan, S.R.; McGovern, D.P.; et al. Genome wide association (GWA) predictors of anti-TNF α therapeutic responsiveness in pediatric inflammatory bowel disease. Inflamm. Bowel Dis. 2010, 16, 1357–1366. [Google Scholar] [CrossRef]
- Li, N.; Shi, R.-H. Updated review on immune factors in pathogenesis of Crohn’s disease. World J. Gastroenterol. 2018, 24, 15–22. [Google Scholar] [CrossRef]
- Tatiya-Aphiradee, N.; Chatuphonprasert, W.; Jarukamjorn, K. Immune response and inflammatory pathway of ulcerative colitis. J. Basic Clin. Physiol. Pharmacol. 2018, 30, 1–10. [Google Scholar] [CrossRef]
- Everaert, C.; Luypaert, M.; Maag, J.L.V.; Cheng, Q.X.; Dinger, M.E.; Hellemans, J.; Mestdagh, P. Benchmarking of RNA-sequencing analysis workflows using whole-transcriptome RT-qPCR expression data. Sci. Rep. 2017, 7, 1559. [Google Scholar] [CrossRef]
- Li, Y.; Zhang, L.; Li, R.; Zhang, M.; Li, Y.; Wang, H.; Wang, S.; Bao, Z. Systematic identification and validation of the reference genes from 60 RNA-Seq libraries in the scallop Mizuhopecten yessoensis. BMC Genom. 2019, 20, 288. [Google Scholar] [CrossRef]
- Zhang, Z.; Duan, Y.; Wu, Z.; Zhang, H.; Ren, J.; Huang, L. PPARD is an Inhibitor of Cartilage Growth in External Ears. Int. J. Biol. Sci. 2017, 13, 669–681. [Google Scholar] [CrossRef]
- Britzen-Laurent, N.; Herrmann, C.; Naschberger, E.; Croner, R.S.; Sturzl, M. Pathophysiological role of guanylate-binding proteins in gastrointestinal diseases. World J. Gastroenterol. 2016, 22, 6434–6443. [Google Scholar] [CrossRef]
- De Buhr, M.F.; Mahler, M.; Geffers, R.; Hansen, W.; Westendorf, A.M.; Lauber, J.; Buer, J.; Schlegelberger, B.; Hedrich, H.J.; Bleich, A. Cd14, Gbp1, and Pla2g2a: Three major candidate genes for experimental IBD identified by combining QTL and microarray analyses. Physiol. Genom. 2006, 25, 426–434. [Google Scholar] [CrossRef]
- Minar, P.; Haberman, Y.; Jurickova, I.; Wen, T.; Rothenberg, M.E.; Kim, M.-O.; Saeed, S.A.; Baldassano, R.N.; Stephens, M.; Markowitz, J.; et al. Utility of neutrophil Fc γ receptor I (CD64) index as a biomarker for mucosal inflammation in pediatric Crohn’s disease. Inflamm. Bowel Dis. 2014, 20, 1037–1048. [Google Scholar] [CrossRef]
- Tillinger, W.; Jilch, R.; Jilma, B.; Brunner, H.; Koeller, U.; Lichtenberger, C.; Waldhor, T.; Reinisch, W. Expression of the high-affinity IgG receptor FcRI (CD64) in patients with inflammatory bowel disease: A new biomarker for gastroenterologic diagnostics. Am. J. Gastroenterol. 2009, 104, 102–109. [Google Scholar] [CrossRef]
- Muthas, D.; Reznichenko, A.; Balendran, C.A.; Bottcher, G.; Clausen, I.G.; Karrman Mardh, C.; Ottosson, T.; Uddin, M.; MacDonald, T.T.; Danese, S.; et al. Neutrophils in ulcerative colitis: A review of selected biomarkers and their potential therapeutic implications. Scand. J. Gastroenterol. 2017, 52, 125–135. [Google Scholar] [CrossRef]
- Wojtal, K.A.; Rogler, G.; Scharl, M.; Biedermann, L.; Frei, P.; Fried, M.; Weber, A.; Eloranta, J.J.; Kullak-Ublick, G.A.; Vavricka, S.R. Fc γ receptor CD64 modulates the inhibitory activity of infliximab. PLoS ONE 2012, 7, e43361. [Google Scholar] [CrossRef]


| Forward (5′-3′) | Reverse (5′-3′) | |
|---|---|---|
| GBP1 | TTCTCCAGAGGAAGGTGGAA | TTTTCTTCATTAGCCCAATTGTT |
| GBP5 | CAAAGTCGGCAAGCAAATTTAT | GGTGTCTGCCTCCTCAGATT |
| IGHG2 | CAGGACTCTACTCCCTCAGCA | GCACTCGACACAACATTTGC |
| GNLY | AGGGTGACCTGTTGACCAAA | CAGCATTGGAAACACTTCTCTG |
| FCGR1A | CACTGCAAAGAGACGCTTCA | AGGCAAGATCTGGACTCTATGG |
| FCGR1B | TGTCAGGAACAAAAAGAAGAACA | GATGGCCACCAACTGAGC |
| ACTB | CTGTGCTGTGGAAGCTAAGT | GATGTCCACGTCACACTTCA |
| RPL4 | AGGCCAGGAATCACAAGCTC | AGGCCAGGAATCACAAGCTC |
| Characteristic | Overall (n = 38) | Responders (n = 29) | Non-Responders (n = 9) | p Value |
|---|---|---|---|---|
| Gender | ||||
| Male, n (%) | 20 (52.6%) | 15 (51.7%) | 5 (55.6%) | 1 |
| Female, n (%) | 18 (47.4%) | 14 (48.3%) | 4 (44.4%) | |
| Age (years) | ||||
| At diagnosis, median (IQR, range) | 10.5 (4.55, 0.7–17) | 10.5 (4.63, 2–17) | 10.2 (7.5, 0.7–13) | 0.137 |
| At start of treatment, median (IQR, range) | 11.9 (4.15, 1.1–17) | 12.2 (4.6, 3.5–17) | 11.5 (6, 1.1–14.1) | 0.263 |
| Type of IBD | ||||
| CD, n (%) | 30 (78.9%) | 22 (75.9%) | 8 (88.9%) | 0.650 |
| UC, n (%) | 8 (21.1%) | 7 (24.1%) | 1 (11.1%) | |
| Type of Anti-TNF | ||||
| Infliximab, n (%) | 21 (55.3%) | 14 (48.3%) | 7 (77.8%) | 0.148 |
| Adalimumab, n (%) | 17 (44.7%) | 15 (51.7%) | 2 (22.2%) | |
| PCDAI at start of treatment, median (IQR, range) | 28.75 (25.63, 5–60) | 32.5 (31.25, 5–60) | 16.25 (11.25, 7.5–30) | 0.045 ** |
| PUCAI at start of treatment, median (IQR, range) | 47.5 (35, 5–60) * | 50 (40, 5–60) | 45 * | - |
| CRP at start of treatment, median (IQR, range) | 14.09 (28.54, 0.4–110.9) | 22.3 (32.19, 0.4–110.9) | 8.45 (17.94, 4–27.5) | 0.042 ** |
| FC at start of treatment, median (IQR, range)Concomitant immunomodulator at start of treatment | 1800 (2253, 27–9543) | 2000 (2288, 27–9543) | 1207.5 (1432, 130–3167) | 0.106 |
| Azathioprine, n (%) | 26 (68.4%) | 22 (75.9%) | 4 (44.4%) | |
| Methotrexate, n (%) | 4 (10.5%) | 4 (13.8%) | 0 | 0.006 ** |
| None, n (%) | 8 (21.1%) | 3 (10.3%) | 5 (55.56%) |
| Gene Name | Mean TPM R | Mean TMM+1 R | Log2 R | Mean TPM NR | Mean TMM+1 NR | Log2 NR | Fold Change (Log2) | p Value |
|---|---|---|---|---|---|---|---|---|
| HK2 | 46.41 | 5.98 | 2.56 | 26.02 | 3.69 | 1.89 | −0.67 | 0.0254 |
| DNAJC13 | 32.18 | 4.19 | 2.07 | 16.19 | 2.67 | 1.42 | −0.65 | 0.0107 |
| TSPAN33 | 13.53 | 2.47 | 1.31 | 25.58 | 3.77 | 1.91 | 0.61 | 0.0096 |
| MAP3K7CL | 15.98 | 2.73 | 1.45 | 30.07 | 4.16 | 2.06 | 0.61 | 0.0110 |
| TRBC2 | 171.80 | 17.93 | 4.16 | 245.97 | 27.67 | 4.79 | 0.63 | 0.0180 |
| MT-CO3 | 1097.32 | 120.77 | 6.92 | 1767.21 | 187.72 | 7.55 | 0.64 | 0.0136 |
| CCL4 | 6.51 | 1.61 | 0.69 | 14.43 | 2.53 | 1.34 | 0.65 | 0.0276 |
| DDX11L10 | 3.54 | 1.39 | 0.47 | 12.37 | 2.18 | 1.13 | 0.65 | 0.0495 |
| MT-ND4L | 132.36 | 15.82 | 3.98 | 227.85 | 25.23 | 4.66 | 0.67 | 0.0392 |
| MT-ATP6 | 1024.97 | 115.51 | 6.85 | 1739.84 | 186.20 | 7.54 | 0.69 | 0.0253 |
| MT-CYB | 868.49 | 99.71 | 6.64 | 1494.58 | 162.26 | 7.34 | 0.70 | 0.0382 |
| ACRBP | 11.09 | 2.30 | 1.20 | 25.66 | 3.76 | 1.91 | 0.71 | 0.0020 |
| TREML1 | 13.74 | 2.71 | 1.44 | 31.99 | 4.50 | 2.17 | 0.73 | 0.0297 |
| MT-ND1 | 1094.43 | 126.98 | 6.99 | 1989.71 | 212.16 | 7.73 | 0.74 | 0.0423 |
| HLA-C | 1809.25 | 194.04 | 7.60 | 2990.89 | 325.05 | 8.34 | 0.74 | 0.0080 |
| HLA-H | 80.05 | 9.74 | 3.28 | 140.43 | 16.50 | 4.04 | 0.76 | 0.0361 |
| AP001189.1 | 10.66 | 2.32 | 1.21 | 26.74 | 3.92 | 1.97 | 0.76 | 0.0221 |
| MT-ATP8 | 107.65 | 13.26 | 3.73 | 202.76 | 22.62 | 4.50 | 0.77 | 0.0251 |
| MT-ND2 | 865.51 | 99.05 | 6.63 | 1596.88 | 169.80 | 7.41 | 0.78 | 0.0168 |
| SH3BGRL2 | 8.73 | 2.04 | 1.03 | 24.59 | 3.54 | 1.82 | 0.80 | 0.0294 |
| IFITM3 | 327.49 | 37.05 | 5.21 | 594.78 | 65.05 | 6.02 | 0.81 | 0.0181 |
| KLRD1 | 37.29 | 4.30 | 2.11 | 61.96 | 7.61 | 2.93 | 0.82 | 0.0491 |
| TUBB1 | 76.43 | 10.11 | 3.34 | 163.15 | 17.92 | 4.16 | 0.83 | 0.0259 |
| GP1BB | 22.65 | 3.79 | 1.92 | 53.23 | 6.71 | 2.75 | 0.83 | 0.0172 |
| IFITM1 | 373.17 | 43.37 | 5.44 | 727.55 | 77.03 | 6.27 | 0.83 | 0.0459 |
| OASL | 23.87 | 3.31 | 1.73 | 50.93 | 5.98 | 2.58 | 0.85 | 0.0423 |
| PF4 | 23.49 | 3.63 | 1.86 | 60.29 | 7.32 | 2.87 | 1.01 | 0.0049 |
| EPSTI1 | 41.88 | 4.57 | 2.19 | 83.41 | 9.27 | 3.21 | 1.02 | 0.0344 |
| MYL9 | 11.02 | 2.41 | 1.27 | 38.53 | 5.20 | 2.38 | 1.11 | 0.0269 |
| CCL5 | 122.76 | 13.85 | 3.79 | 276.24 | 30.37 | 4.92 | 1.13 | 0.0002 |
| MYOM2 | 2.67 | 1.23 | 0.30 | 15.28 | 2.86 | 1.52 | 1.22 | 0.0377 |
| GNLY | 62.70 | 6.77 | 2.76 | 191.26 | 21.55 | 4.43 | 1.67 | 0.0409 |
| Gene Name | Mean TPM R | Mean TMM+1 R | Log2 R | Mean TPM NR | Mean TMM+1 NR | Log2 NR | Fold Change (Log2) | p Value |
|---|---|---|---|---|---|---|---|---|
| IGHG1 | 492.65 | 54.71 | 5.77 | 98.10 | 11.26 | 3.49 | −2.28 | 0.0394 |
| IGKV3-20 | 92.59 | 11.12 | 3.47 | 37.71 | 4.50 | 2.17 | −1.30 | 0.0096 |
| IGHG2 | 163.72 | 19.68 | 4.30 | 71.31 | 8.06 | 3.01 | −1.29 | 0.0372 |
| IGHA1 | 510.70 | 57.75 | 5.85 | 254.62 | 25.75 | 4.69 | −1.17 | 0.0268 |
| IGKC | 1398.17 | 155.23 | 7.28 | 669.09 | 70.45 | 6.14 | −1.14 | 0.0159 |
| IGKV1-39 | 45.72 | 5.83 | 2.54 | 18.16 | 2.83 | 1.50 | −1.04 | 0.0313 |
| IGKV2D-28 | 35.88 | 5.17 | 2.37 | 15.11 | 2.54 | 1.34 | −1.03 | 0.0061 |
| IGHV4-59 | 14.97 | 2.63 | 1.40 | 5.01 | 1.45 | 0.54 | −0.86 | 0.0272 |
| IGKV1-5 | 42.43 | 5.66 | 2.50 | 21.94 | 3.14 | 1.65 | −0.85 | 0.0380 |
| IGHV3-74 | 12.98 | 2.48 | 1.31 | 4.11 | 1.40 | 0.49 | −0.82 | 0.0091 |
| IGKV3-11 | 32.50 | 4.50 | 2.17 | 15.11 | 2.56 | 1.36 | −0.81 | 0.0070 |
| IGKV3-15 | 39.70 | 5.50 | 2.46 | 21.91 | 3.14 | 1.65 | −0.81 | 0.0300 |
| IGKV1-12 | 15.46 | 2.63 | 1.40 | 6.00 | 1.59 | 0.67 | −0.72 | 0.0095 |
| IGHV3-7 | 16.04 | 2.85 | 1.51 | 7.78 | 1.74 | 0.80 | −0.72 | 0.0146 |
| IGHV3-48 | 8.96 | 1.95 | 0.97 | 2.03 | 1.20 | 0.26 | −0.70 | 0.0459 |
| IGLV1-44 | 28.69 | 4.13 | 2.05 | 15.36 | 2.54 | 1.35 | −0.70 | 0.0272 |
| RARRES3 | 27.27 | 4.05 | 2.02 | 46.58 | 6.15 | 2.62 | 0.60 | 0.0327 |
| RHBDF2 | 46.64 | 6.02 | 2.59 | 75.71 | 9.17 | 3.20 | 0.61 | 0.0281 |
| IGFLR1 | 22.43 | 3.47 | 1.80 | 40.98 | 5.39 | 2.43 | 0.63 | 0.0070 |
| APOL2 | 67.33 | 8.64 | 3.11 | 117.78 | 13.65 | 3.77 | 0.66 | 0.0385 |
| TYMP | 266.66 | 30.75 | 4.94 | 451.43 | 48.71 | 5.61 | 0.66 | 0.0444 |
| IL1B | 29.29 | 4.23 | 2.08 | 53.16 | 6.72 | 2.75 | 0.67 | 0.0226 |
| DNAJC25-GNG10 | 26.40 | 3.93 | 1.98 | 51.09 | 6.29 | 2.65 | 0.68 | 0.0397 |
| GZMA | 14.86 | 2.62 | 1.39 | 29.03 | 4.20 | 2.07 | 0.68 | 0.0493 |
| IRF1 | 307.23 | 35.90 | 5.17 | 538.82 | 58.4 | 5.87 | 0.70 | 0.0295 |
| HLA-C | 1710.59 | 197.19 | 7.62 | 2939.53 | 323.41 | 8.34 | 0.71 | 0.0096 |
| HLA-H | 77.17 | 9.96 | 3.32 | 139.23 | 16.44 | 4.04 | 0.72 | 0.0378 |
| APOL6 | 93.85 | 11.01 | 3.46 | 166.82 | 18.54 | 4.21 | 0.75 | 0.0205 |
| DHRS9 | 17.27 | 2.75 | 1.46 | 35.50 | 4.73 | 2.24 | 0.78 | 0.0197 |
| UBE2L6 | 91.58 | 11.15 | 3.48 | 168.82 | 19.24 | 4.27 | 0.79 | 0.0272 |
| ODF3B | 26.61 | 3.85 | 1.95 | 56.06 | 6.92 | 2.79 | 0.84 | 0.0273 |
| GBP2 | 200.76 | 23.37 | 4.55 | 393.53 | 42.06 | 5.39 | 0.85 | 0.0118 |
| SECTM1 | 128.31 | 15.52 | 3.96 | 252.39 | 28.29 | 4.82 | 0.87 | 0.0484 |
| FCGR1CP | 4.89 | 1.47 | 0.56 | 18.76 | 3.13 | 1.65 | 1.09 | 0.0313 |
| SERPING1 | 20.09 | 3.07 | 1.62 | 56.06 | 6.79 | 2.76 | 1.14 | 0.0293 |
| MYOM2 | 2.43 | 1.27 | 0.34 | 14.53 | 2.80 | 1.48 | 1.14 | 0.0389 |
| GBP1 | 84.92 | 9.85 | 3.30 | 208.64 | 22.49 | 4.49 | 1.19 | 0.0201 |
| ANKRD22 | 3.24 | 1.34 | 0.42 | 19.72 | 3.11 | 1.64 | 1.22 | 0.0382 |
| FCGR1B | 33.63 | 4.77 | 2.25 | 106.67 | 12.48 | 3.64 | 1.39 | 0.0293 |
| FCGR1A | 27.68 | 4.15 | 2.05 | 93.02 | 10.90 | 3.45 | 1.39 | 0.0212 |
| BATF2 | 6.67 | 1.69 | 0.76 | 36.71 | 4.89 | 2.29 | 1.53 | 0.0201 |
| GBP5 | 130.99 | 14.13 | 3.82 | 393.84 | 41.43 | 5.37 | 1.55 | 0.0373 |
| Gene | Log2FC NR/R T0 RNAseq | Log2FC NR/R T0 qPCR | Log2FC NR/R T2 RNAseq | Log2FC NR/R T2 qPCR |
|---|---|---|---|---|
| GBP1 | 0.69 | 0.49 | 1.19 * | 1.08 * |
| GBP5 | 0.95 | 0.19 | 1.55 * | 0.78 |
| GNLY | 1.67 * | 0.54 | 1.35 | 1.15 |
| BATF2 | 1.16 | 0.48 | 1.53 * | 0.55 |
| IGHA1 | −0.76 | −0.67 | −1.17 * | −0.34 |
| IGHG2 | −0.29 | −0.01 | −1.29 * | −0.23 |
| FCGR1A | 0.22 | 0.39 | 1.39 * | 1.05 * |
| FCGR1B | 0.25 | 0.66 | 1.39 * | 1.21 * |
| GBP11 | FCGR1A1 | FCGR1B1 | |
|---|---|---|---|
| Sensitivity | 67% | 78% | 89% |
| Specificity | 70% | 63%1 | 52% |
| PPV | 43% | 41% | 38% |
| NPV | 86% | 89% | 93% |
| Diagnostic odds ratio | 4.75 | 5.95 | 8.61 |
| +LR | 2,25 | 2.1 | 1.84 |
| –LR | 0.47 | 0.35 | 0.21 |
Publisher’s Note: MDPI stays neutral with regard to jurisdictional claims in published maps and institutional affiliations. |
© 2021 by the authors. Licensee MDPI, Basel, Switzerland. This article is an open access article distributed under the terms and conditions of the Creative Commons Attribution (CC BY) license (http://creativecommons.org/licenses/by/4.0/).
Share and Cite
Salvador-Martín, S.; Kaczmarczyk, B.; Álvarez, R.; Navas-López, V.M.; Gallego-Fernández, C.; Moreno-Álvarez, A.; Solar-Boga, A.; Sánchez, C.; Tolin, M.; Velasco, M.; et al. Whole Transcription Profile of Responders to Anti-TNF Drugs in Pediatric Inflammatory Bowel Disease. Pharmaceutics 2021, 13, 77. https://doi.org/10.3390/pharmaceutics13010077
Salvador-Martín S, Kaczmarczyk B, Álvarez R, Navas-López VM, Gallego-Fernández C, Moreno-Álvarez A, Solar-Boga A, Sánchez C, Tolin M, Velasco M, et al. Whole Transcription Profile of Responders to Anti-TNF Drugs in Pediatric Inflammatory Bowel Disease. Pharmaceutics. 2021; 13(1):77. https://doi.org/10.3390/pharmaceutics13010077
Chicago/Turabian StyleSalvador-Martín, Sara, Bartosz Kaczmarczyk, Rebeca Álvarez, Víctor Manuel Navas-López, Carmen Gallego-Fernández, Ana Moreno-Álvarez, Alfonso Solar-Boga, Cesar Sánchez, Mar Tolin, Marta Velasco, and et al. 2021. "Whole Transcription Profile of Responders to Anti-TNF Drugs in Pediatric Inflammatory Bowel Disease" Pharmaceutics 13, no. 1: 77. https://doi.org/10.3390/pharmaceutics13010077
APA StyleSalvador-Martín, S., Kaczmarczyk, B., Álvarez, R., Navas-López, V. M., Gallego-Fernández, C., Moreno-Álvarez, A., Solar-Boga, A., Sánchez, C., Tolin, M., Velasco, M., Muñoz-Codoceo, R., Rodriguez-Martinez, A., Vayo, C. A., Bossacoma, F., Pujol-Muncunill, G., Fobelo, M. J., Millán-Jiménez, A., Magallares, L., Martínez-Ojinaga, E., ... López-Fernández, L. A. (2021). Whole Transcription Profile of Responders to Anti-TNF Drugs in Pediatric Inflammatory Bowel Disease. Pharmaceutics, 13(1), 77. https://doi.org/10.3390/pharmaceutics13010077