3.1. Characterization of CO Polymorphs
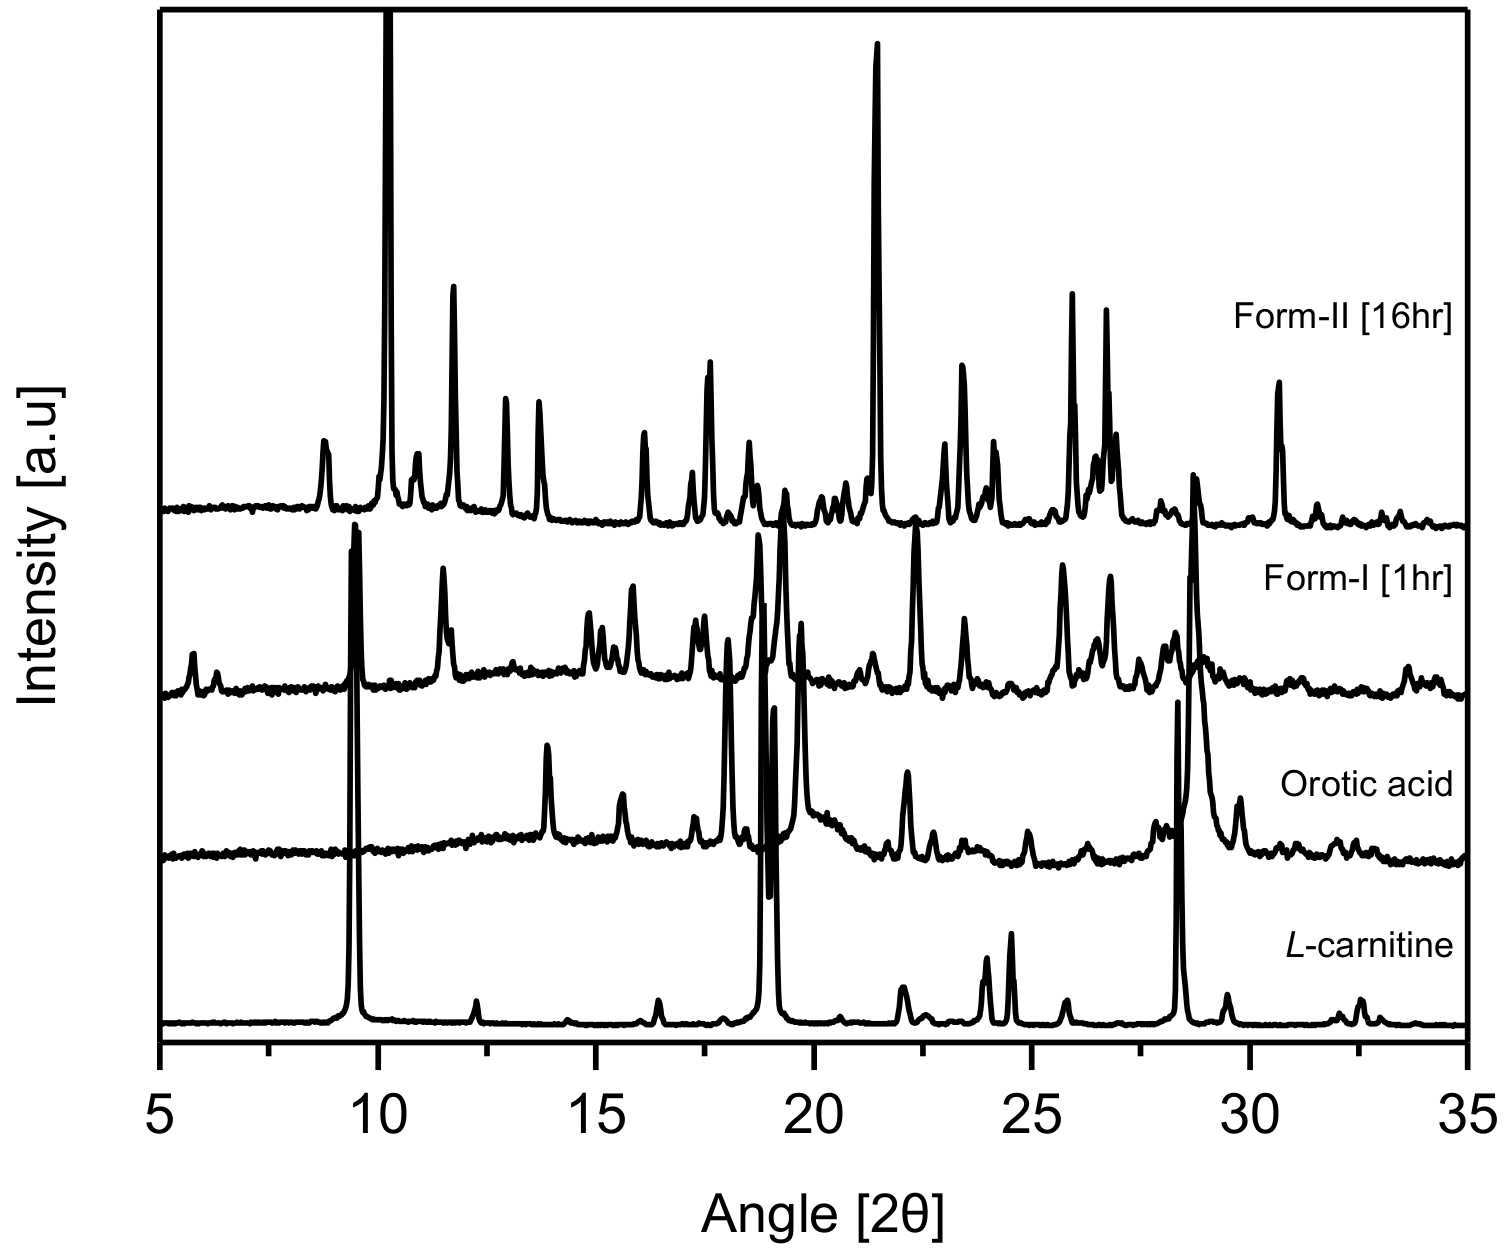
PXRD experiments were carried out on CO crystals obtained from MeOH after 1 h and 16 h, respectively, for their comparative evaluation with
l-Carn and OA. The results revealed that the PXRD patterns of CO crystals were completely different from
l-Carn and OA’s ones. Moreover, the PXRD patterns of CO crystals obtained after 1 h coincided with the PXRD patterns of CO form-I, which was previously reported by Kim et al. [
23]. However, from the same results, it was confirmed that CO crystals precipitated after 16 h possessed dissimilar PXRD patterns to those precipitated after 1 h. These patterns have not been reported yet in previous studies. Accordingly, it was ascertained that CO crystals collected after 16 h possess a different crystal structure from CO form-I (2 theta: 8.7, 10.3, 11.7, 12.9, 13.7, 16.1, 17.6, 21.5, 23.4, 25.9, 26.7, 30.6). These novel CO crystals were named form-II (2 theta: 9.5, 11.5, 15.8, 18.7, 19.3, 22.3, 25.7, 26.7, 28.7) (
Figure 2). As can be seen in
Figure 2, the characteristic diffraction peaks for CO form-I appear at 2 theta: 10.3, 21.5, 25.9, 26.7 and the characteristic peaks for CO form-II appear at 2 theta: 9.5, 11.5, 18.7, 19.3, 22.3.
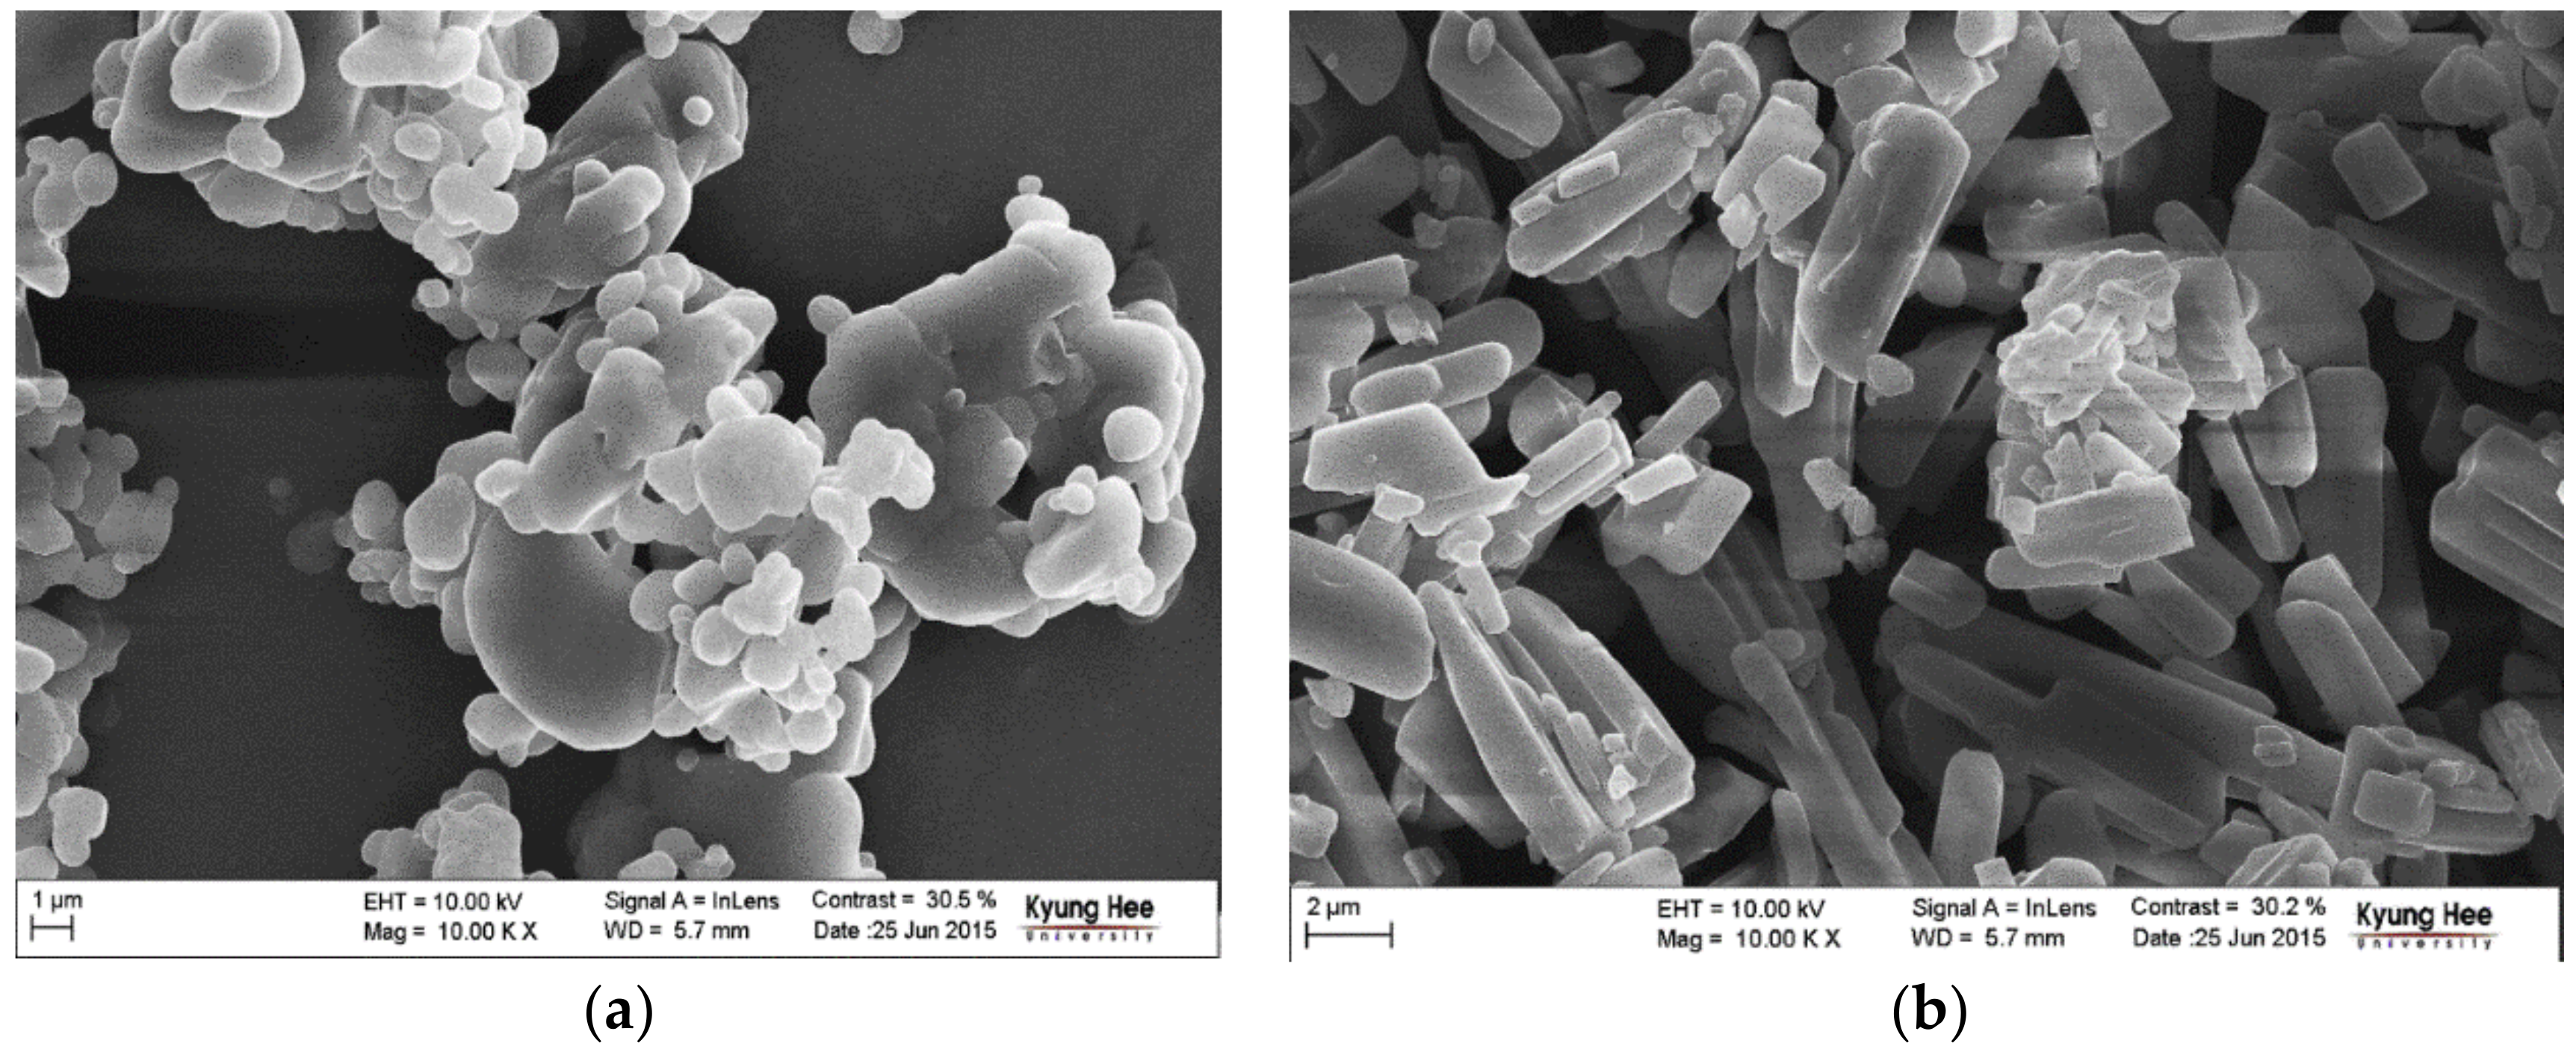
Figure 3 depicts the FE-SEM images of CO form-I and CO form-II crystals recorded at 100,000× magnification. The FE-SEM images revealed that CO form-I is condensed and sphere shaped, and CO form-II is long and rectangular shaped. Therefore, it was confirmed that CO form-I and CO form-II were morphologically distinct from each other. Several attempts were made to produce single CO form-I and CO form-II crystals; however, they were unsuccessful at producing good single CO form-I and CO form-II crystals. The non-obtention of single CO form-I crystals is presumably due to the aggregate behavior of CO form-I, which hinders the production of single crystals and leads only to the production of powder materials. However, we were able to obtain long rectangular finely shaped single CO form-II crystals. Here, single crystal X-ray diffraction (SXD) analysis was conducted to determine the crystal structure. However, the obtained transparent crystals changed to opaque crystals during the SXD analysis. Because of this, it was difficult to read the unit cell, and it was consequently hard to predict the crystal structure of CO form-II. Therefore, solid-state CP/MAS 13C NMR measurements, which have been suggested to be efficient analytical techniques for investigating the structural conformation and intermolecular or intermolecular interaction of solid materials [
25], were employed in this study for predicting the crystal structures of CO form-I and CO form-II.
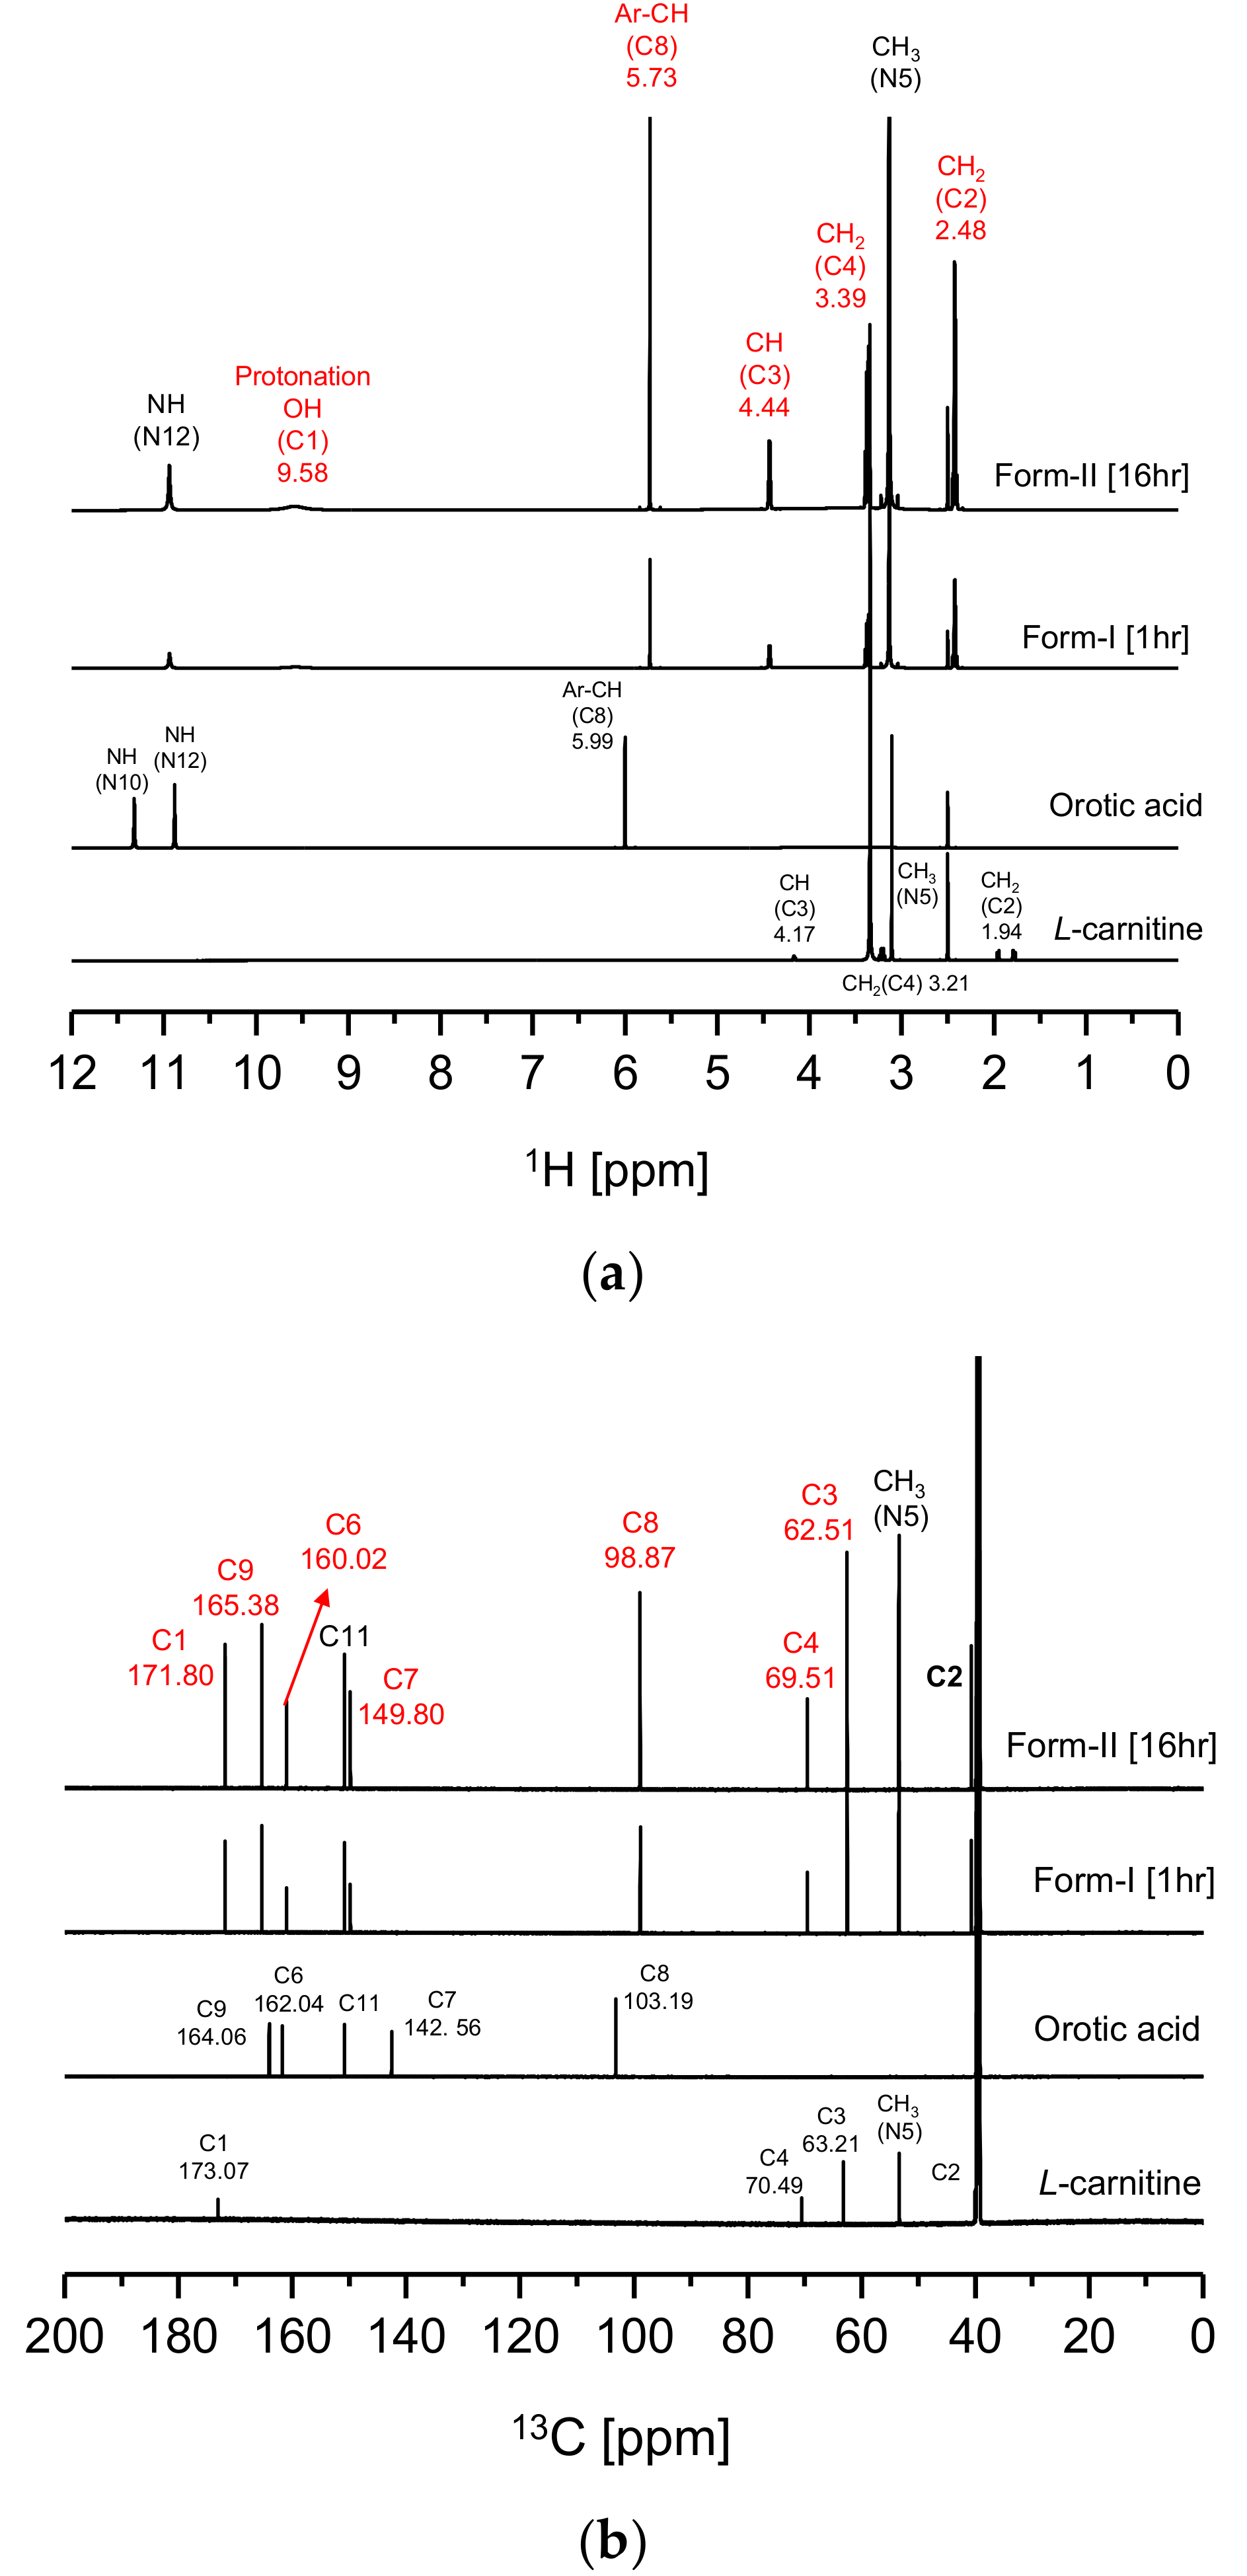
Figure 4 illustrates the solution-state 1D (
1H,
13C) NMR (DMSO-d
6) results for CO form-I, form-II,
l-Carn and OA. In
Figure 4a, a characteristic peak was noticed at 9.58 ppm on the CO form-I and form-II
1H-NMR spectra which does not appear on
l-Carn and OA
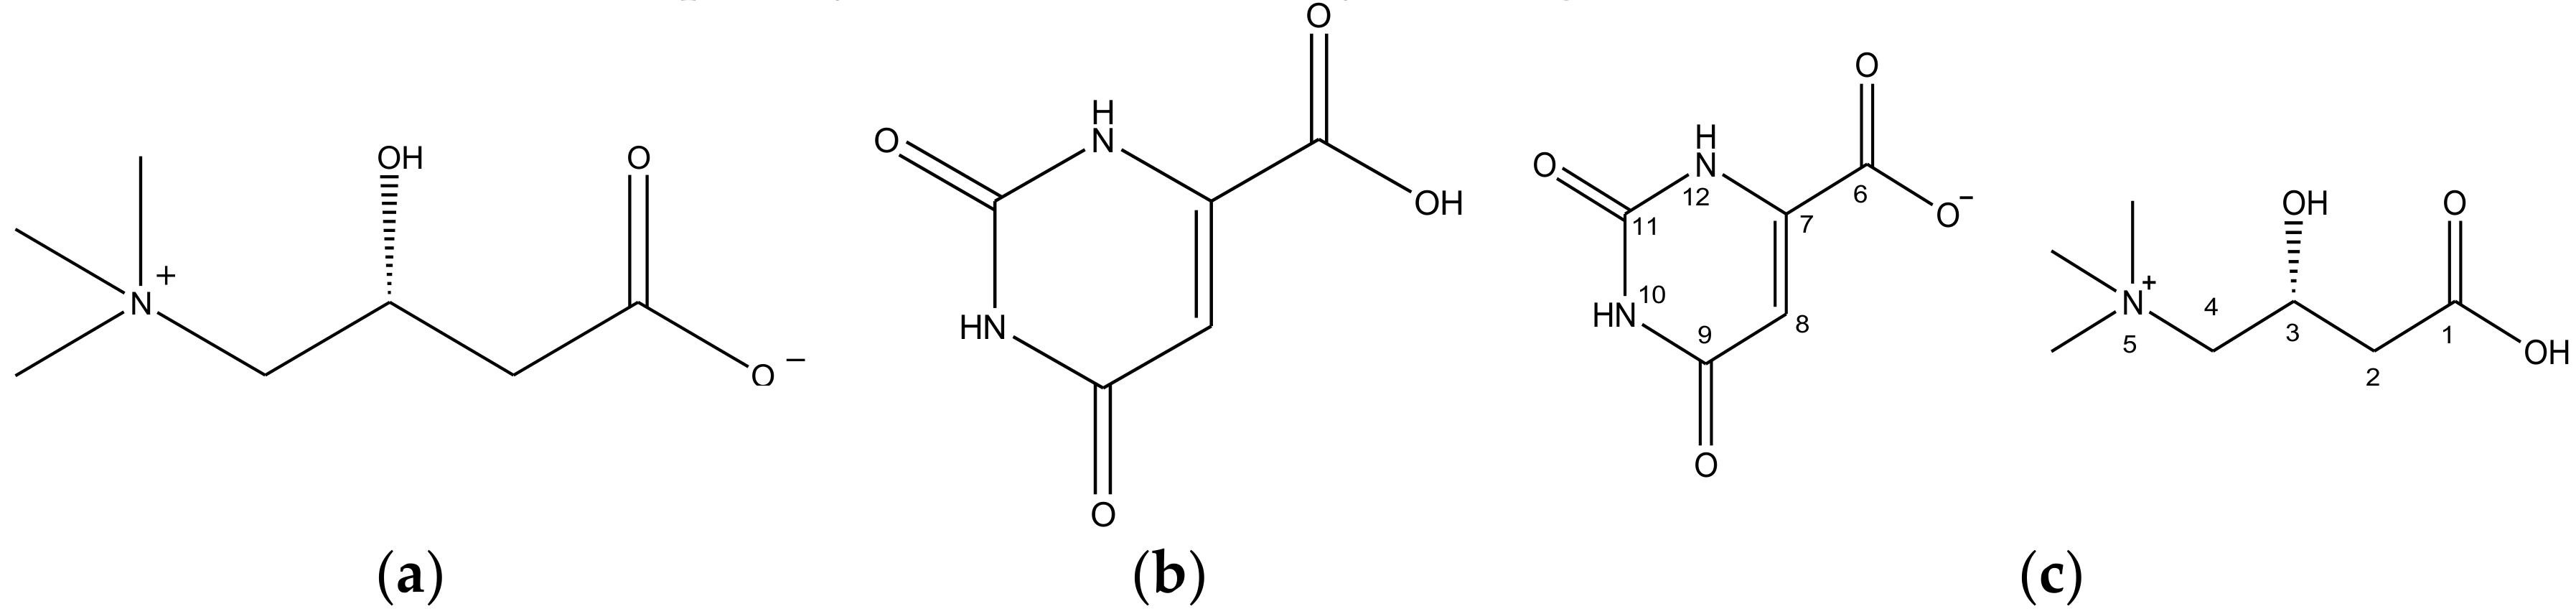
1H-NMR spectra. This characteristic peak is presumably the peak of the H atom interacting with the C1’s O atom of CO molecule (
Figure 1c). This peak is a result of the migration of the C6 OH’s H atom to C1’s O
-, resulting in protonation of the C1 region. Moreover, as can be observed from the CO form-I and form-II
1H-NMR spectrum in
Figure 4a, the peak related to the H of the C8 ring appears upfield at 5.73 ppm than the H peak of O8 (5.99 ppm) in OA spectrum. In addition, in
Figure 4b, carbon peaks related to C6 (160.02 ppm) and C8 (98.87 ppm) appear upfield, while peaks related to C7 (149.80 ppm) and C9 (165.38 ppm) appear downfield on the CO’s
13C-NMR spectra compared to OA
13C-NMR spectrum. The result is supposedly induced from the change in the electron density distribution at C6 region due to the deprotonation of C6’s OH. Furthermore, by examining
Figure 4a, it can also be noticed that peaks related to C2’s H, C3’s H and C4’s H in the CO molecule in
Figure 1c appear downfield, at 2.48 ppm, 3.39 ppm and 4.44 ppm, respectively, on the CO
1H-NMR spectra when compared to
l-Carn’s spectrum. Furthermore, by comparing the CO and
l-Carn’s
13C-NMR results, it was found that the peaks of C1 (171.80 ppm), C3 (62.51 ppm), C4 (69.51 ppm) appear upfield on the CO
13C-NMR spectrum in comparison to where they appear on
l-Carn’s spectrum. This result is a consequence of the change in electron density distribution provoked by the migration of the H from C6’s OH to C1’s O, i.e., due to the protonation of C1 region. From
Figure 4, it can be ascertained that CO form-I and form-II possess identical solution-state NMR spectra. This is because both compounds possess the same molecular structure. Based on the solution-state NMR spectra in
Figure 4, it was predicted that CO salt would be perfectly produced. Based on CO’s solution-state
1H-NMR spectrum integration results, it was confirmed that CO was composed of
l-Carn and OA in 1:1 ratio (
Figure S2). The solution-state 1D(
1H,
13C) NMR spectra for CO form-I, form-II,
l-Carn and OA illustrated in
Figure 4 were interpreted based on the solution-state 2D-NMR result, including
1H-
1H COSY,
1H-
13C HSQC, and
1H-
13C HMBC. First, the
1H-
1H COSY results were employed to assign the peaks observed in the
1H-NMR spectra in
Figure 3a. Afterwards,
1H-
13C HSQC analysis was conducted for the identification of covalent bond peaks made between carbon and hydrogen. Lastly,
1H-
13C HMBC analysis was carried out to determine and assess the peaks of all remaining carbons (
Figure S3,
Figure S4,
Figure S5,
Figure S6,
Figure S7,
Figure S8,
Figure S9,
Figure S10 and
Figure S11).
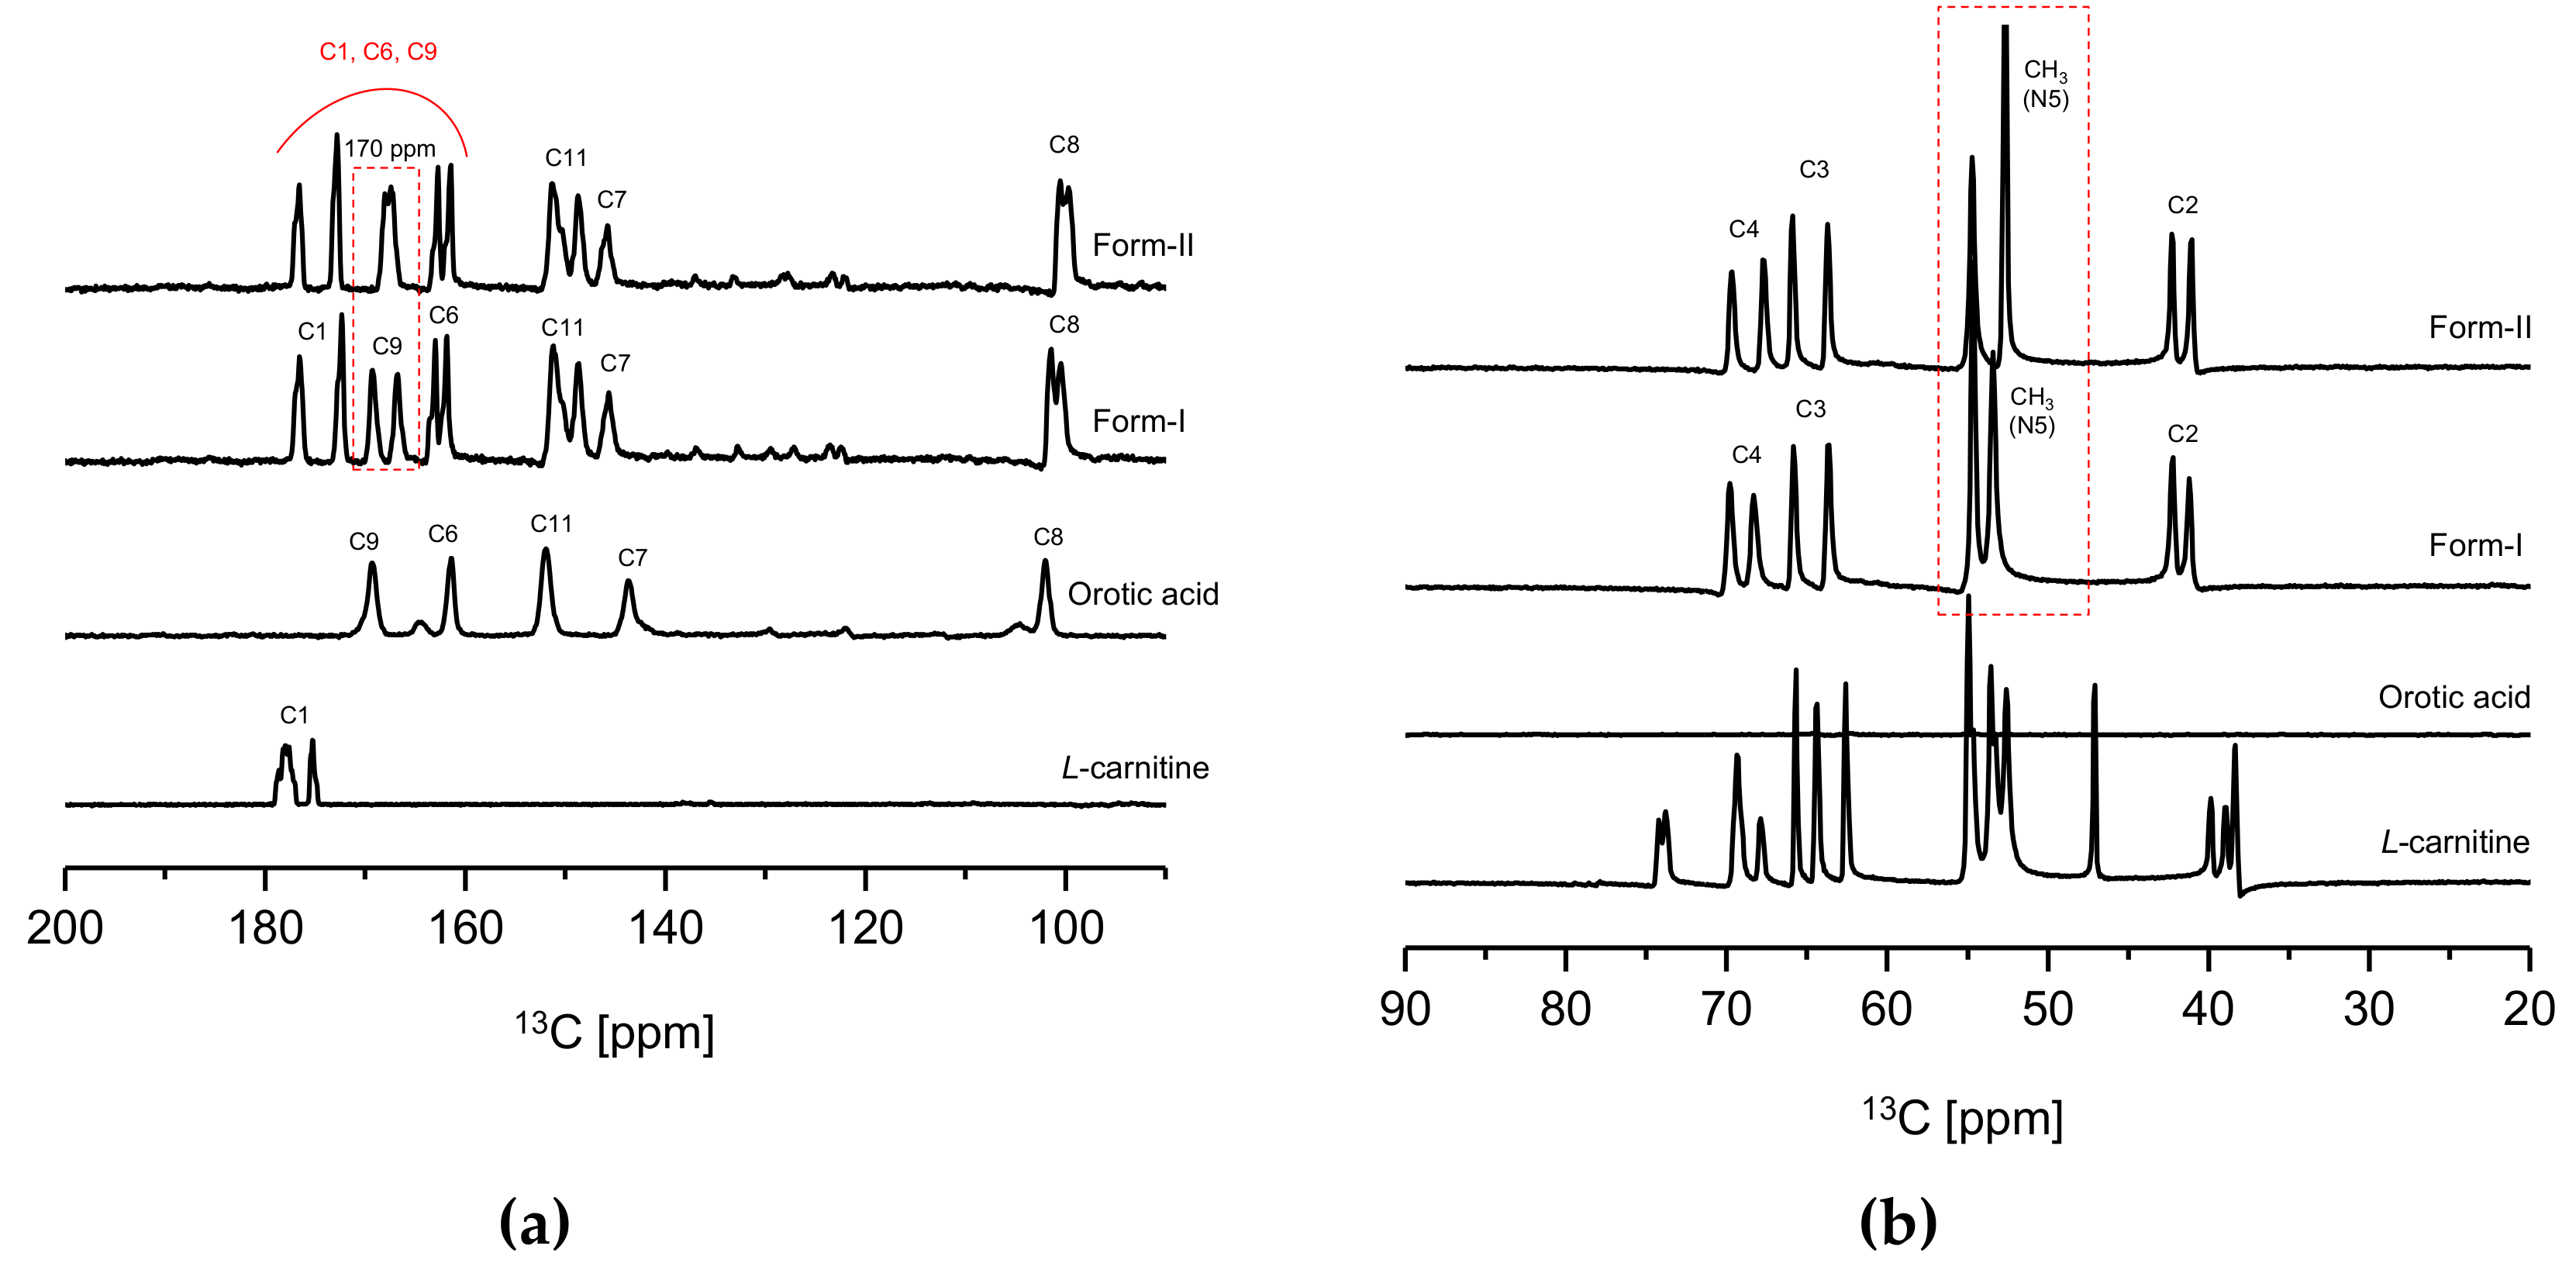
In
Figure 5, a significant difference in chemical shifts could be observed from the solid-state CP/MAS
13C NMR spectra of CO form-I and form-II,
l-Carn and OA. This is presumably due to the differences in the conformation and intermolecular or intermolecular interaction of these compounds [
25]. Accordingly, it was predicted that all crystals, namely CO form-I and form-II,
l-Carn and OA possess distinct crystal structures. However, in
Figure 5b, some difficulties hinder the accurate interpretation of the
l-Carn’s solid-state CP/MAS
13C NMR spectrum at 20 to 90 ppm region. This is because several peaks on the
l-Carn’s solid-state CP/MAS
13C NMR spectrum appeared to be split in this region. Hence, in order to provide detailed information about the above-mentioned region, the impact of counter ions on the conformational stability of
l-Carn was investigated. Here,
l-carnitine HCl salt purchased from Sigma-Aldrich was used for this study and was analyzed via solid-state CP/MAS
13C NMR.
l-carnitine HCl is a salt in which the orotate anion is replaced by chloride anion. As a result, most CO peaks in the CO spectrum in
Figure 4b split into doublets, while most
l-carnitine HCl ‘peaks in the
l-carnitine HCl spectrum are singlets (
Figure S12). This is presumably a result of the differences in chain conformation and orientational order of two salts impacted by the counter ions. However, the salt-free form of carnitine is assumed to be conformationally unstable. Therefore, owing to the conformational instability of
l-Carn, solid-state CP/MAS
13C NMR data difficult to be accurately interpreted were collected.
Furthermore, a clear difference in carbon peak corresponding to 170 ppm (C1, C6, C9) of the CO molecule (
Figure 1c) can be noticed when comparing the CO form-I and form-II’s solid-state CP/MAS
13C NMR spectra in
Figure 5a. In the solid-state CP/MAS
13C NMR spectrum of CO form-I, the 170 ppm peak appears as a doublet; however, the same peak appears as a singlet on CO form-II’s spectrum. Also, when comparing the solid-state CP/MAS 13C NMR spectra in
Figure 5b, it can be noticed that the peaks corresponding to CH3 groups, which are bound to the N5 in the CO molecule (
Figure 1c), shifted upfield on the form-II spectrum in comparison to the form-I spectrum. The difference in strength of the ionic interaction occurring within molecules in CO polymorphs and consequently the change in conformation of C6’s carboxylate group in
Figure 5a is presumed to be the reason; in
Figure 5a, the 170 ppm peak appears as a doublet on CO form-I spectrum and as a singlet on CO form-II’s spectrum. The same is assumed to be the reason for the shift of N5’s CH
3 peak on both CO form-I and CO form-II spectrums in
Figure 5b. Moreover, from the same solid-state CP/MAS
13C NMR spectra (
Figure 5), it can be observed that peaks corresponding to C1, C4, C8 of the CO molecule (
Figure 1c) have distinct chemical shifts on both CO form-I and form-II spectra. The result is attributed to the difference in conformation between the two CO polymorphs, which difference is influenced by the intermolecular or intramolecular hydrogen bonding occurring within these two CO polymorphs. Based on the solid-state CP/MAS
13C-NMR results in
Figure 5, it was confirmed that CO form-I and CO form-II possess dissimilar crystal structures.
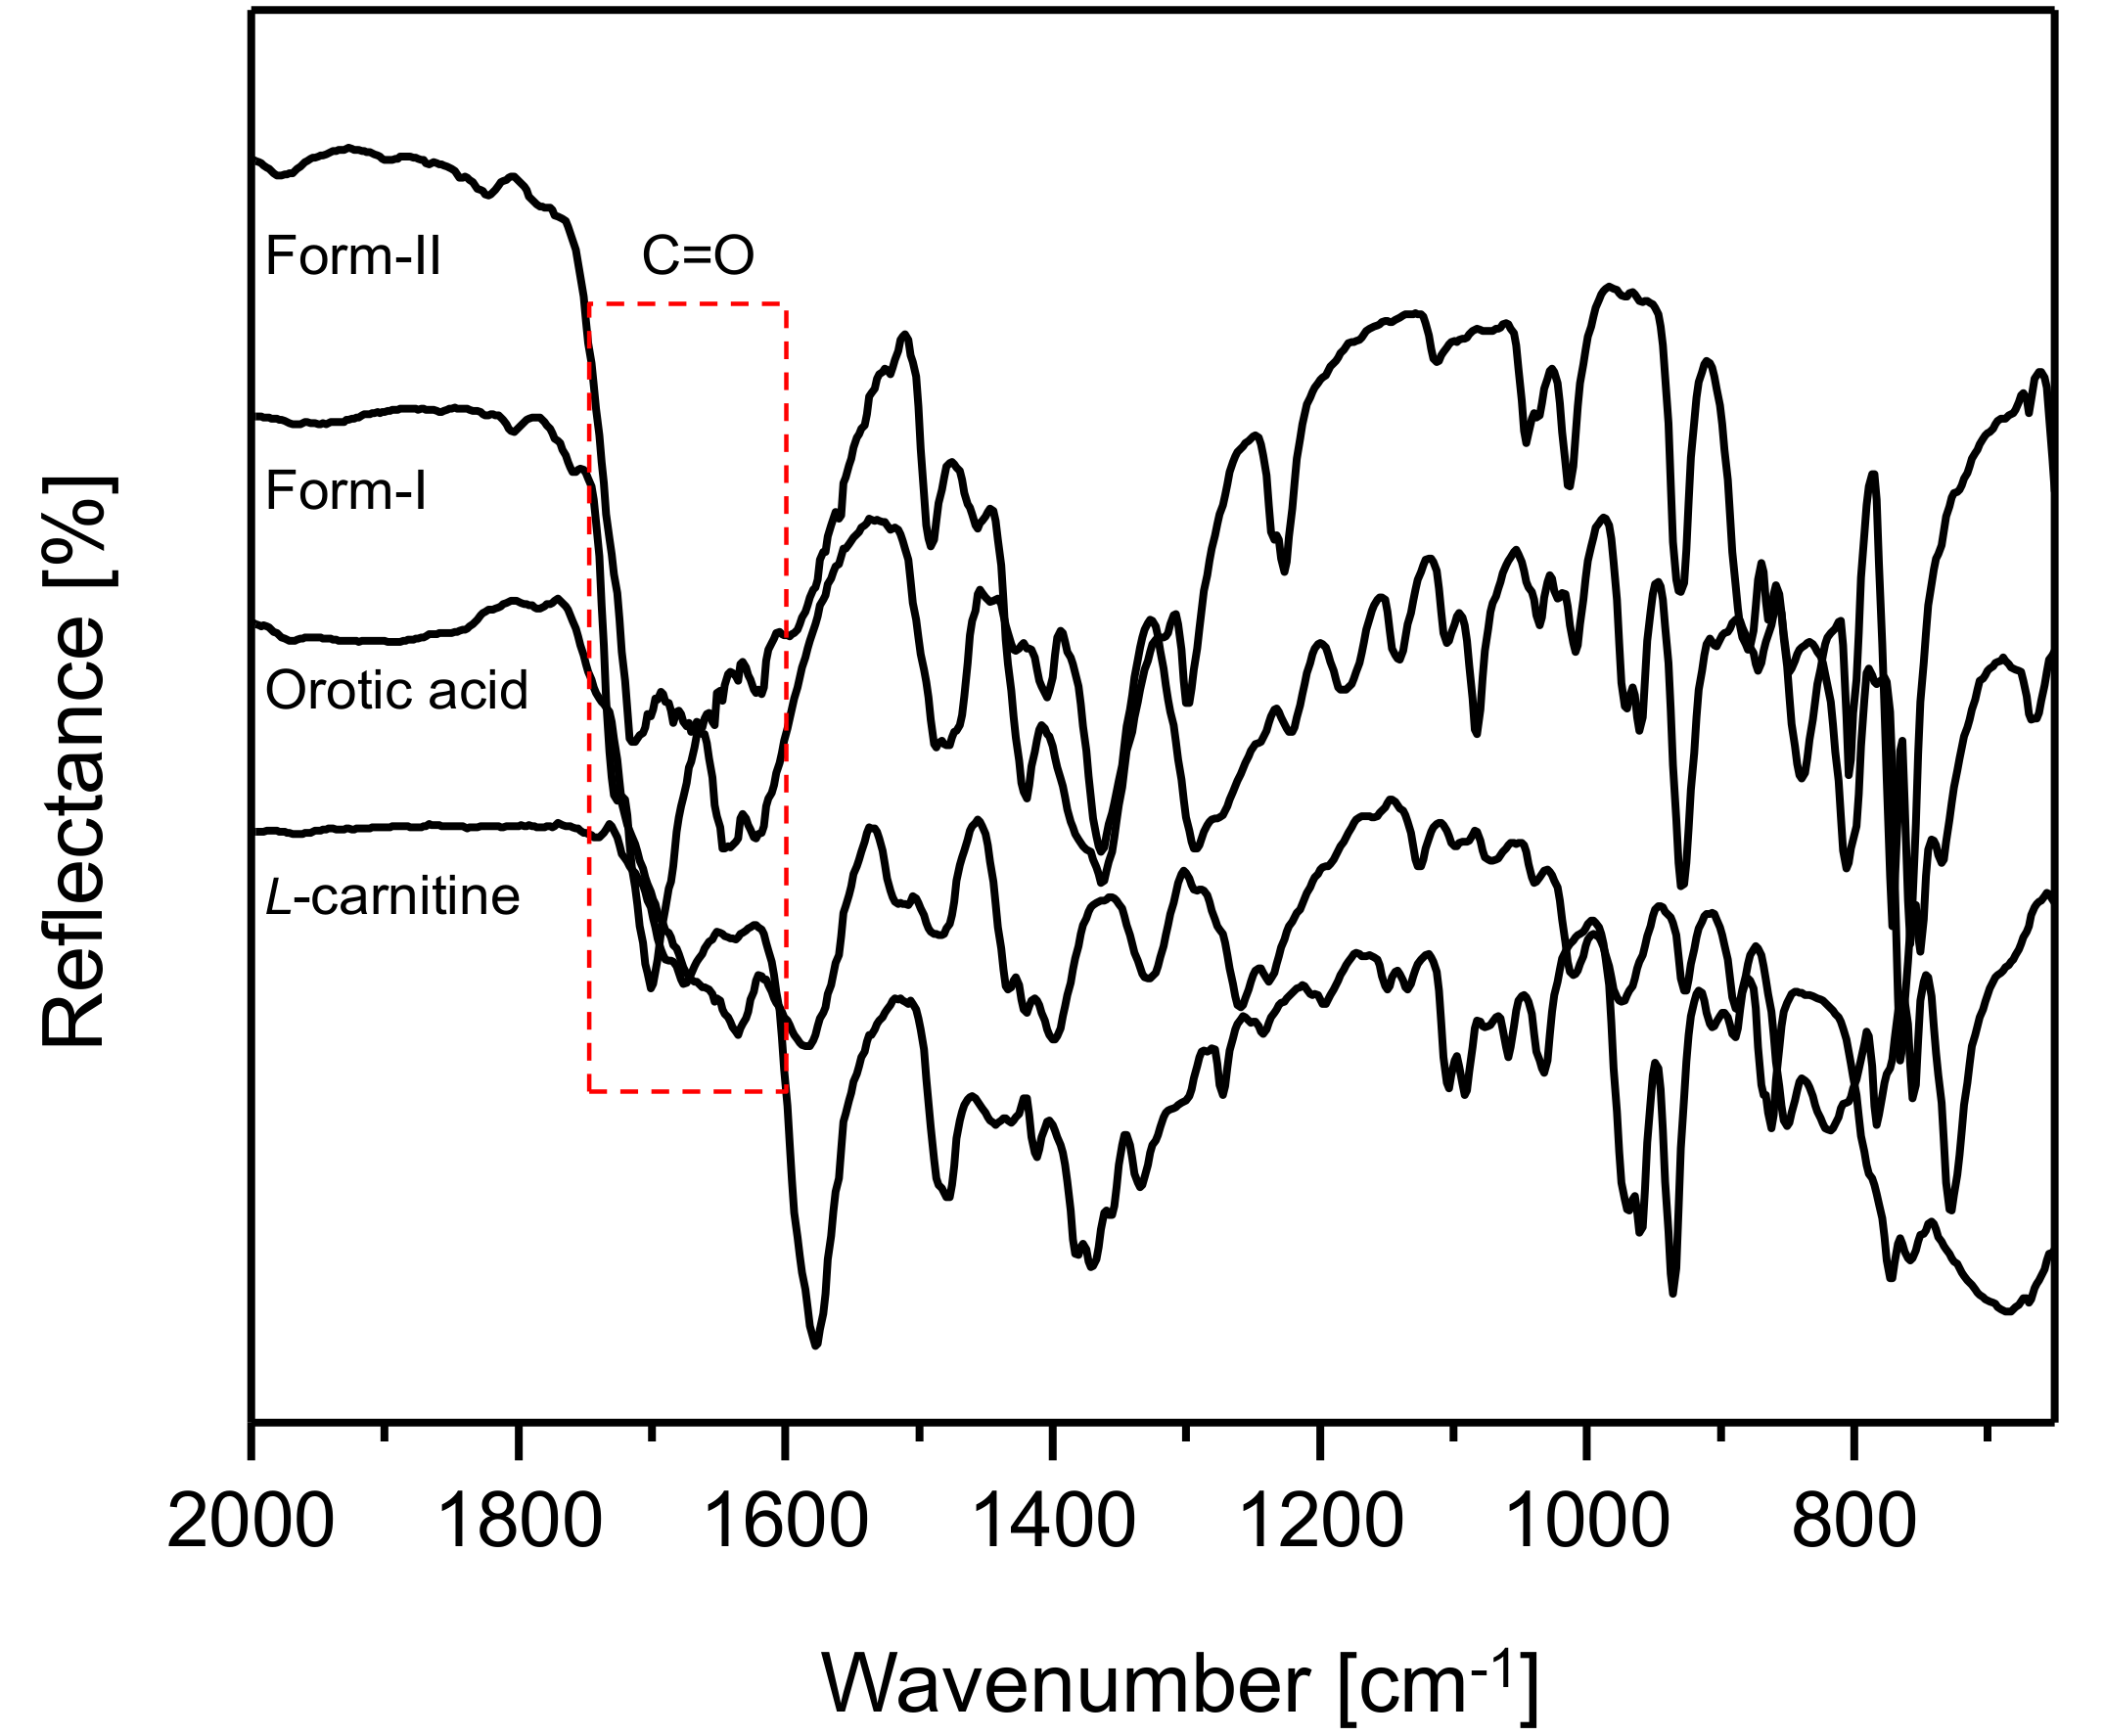
Figure 6 illustrates the ATR FT-IR spectral results for CO form-I and CO form-II,
l-Carn and OA (2000 cm
−1 to 650 cm
−1). The spectral results demonstrated that CO form-I and form-II, as well as
l-Carn and OA, possess FT-IR spectra that are distinct from one another. Moreover, CO form-I and CO form-II show a huge difference in the region of the C=O absorption peak, namely in the 1800 cm
−1 to 1600 cm
−1 region, when comparing their spectra. This is presumably due to the difference in the strength of the hydrogen boding between molecules in CO form-I and molecules in CO form-II.
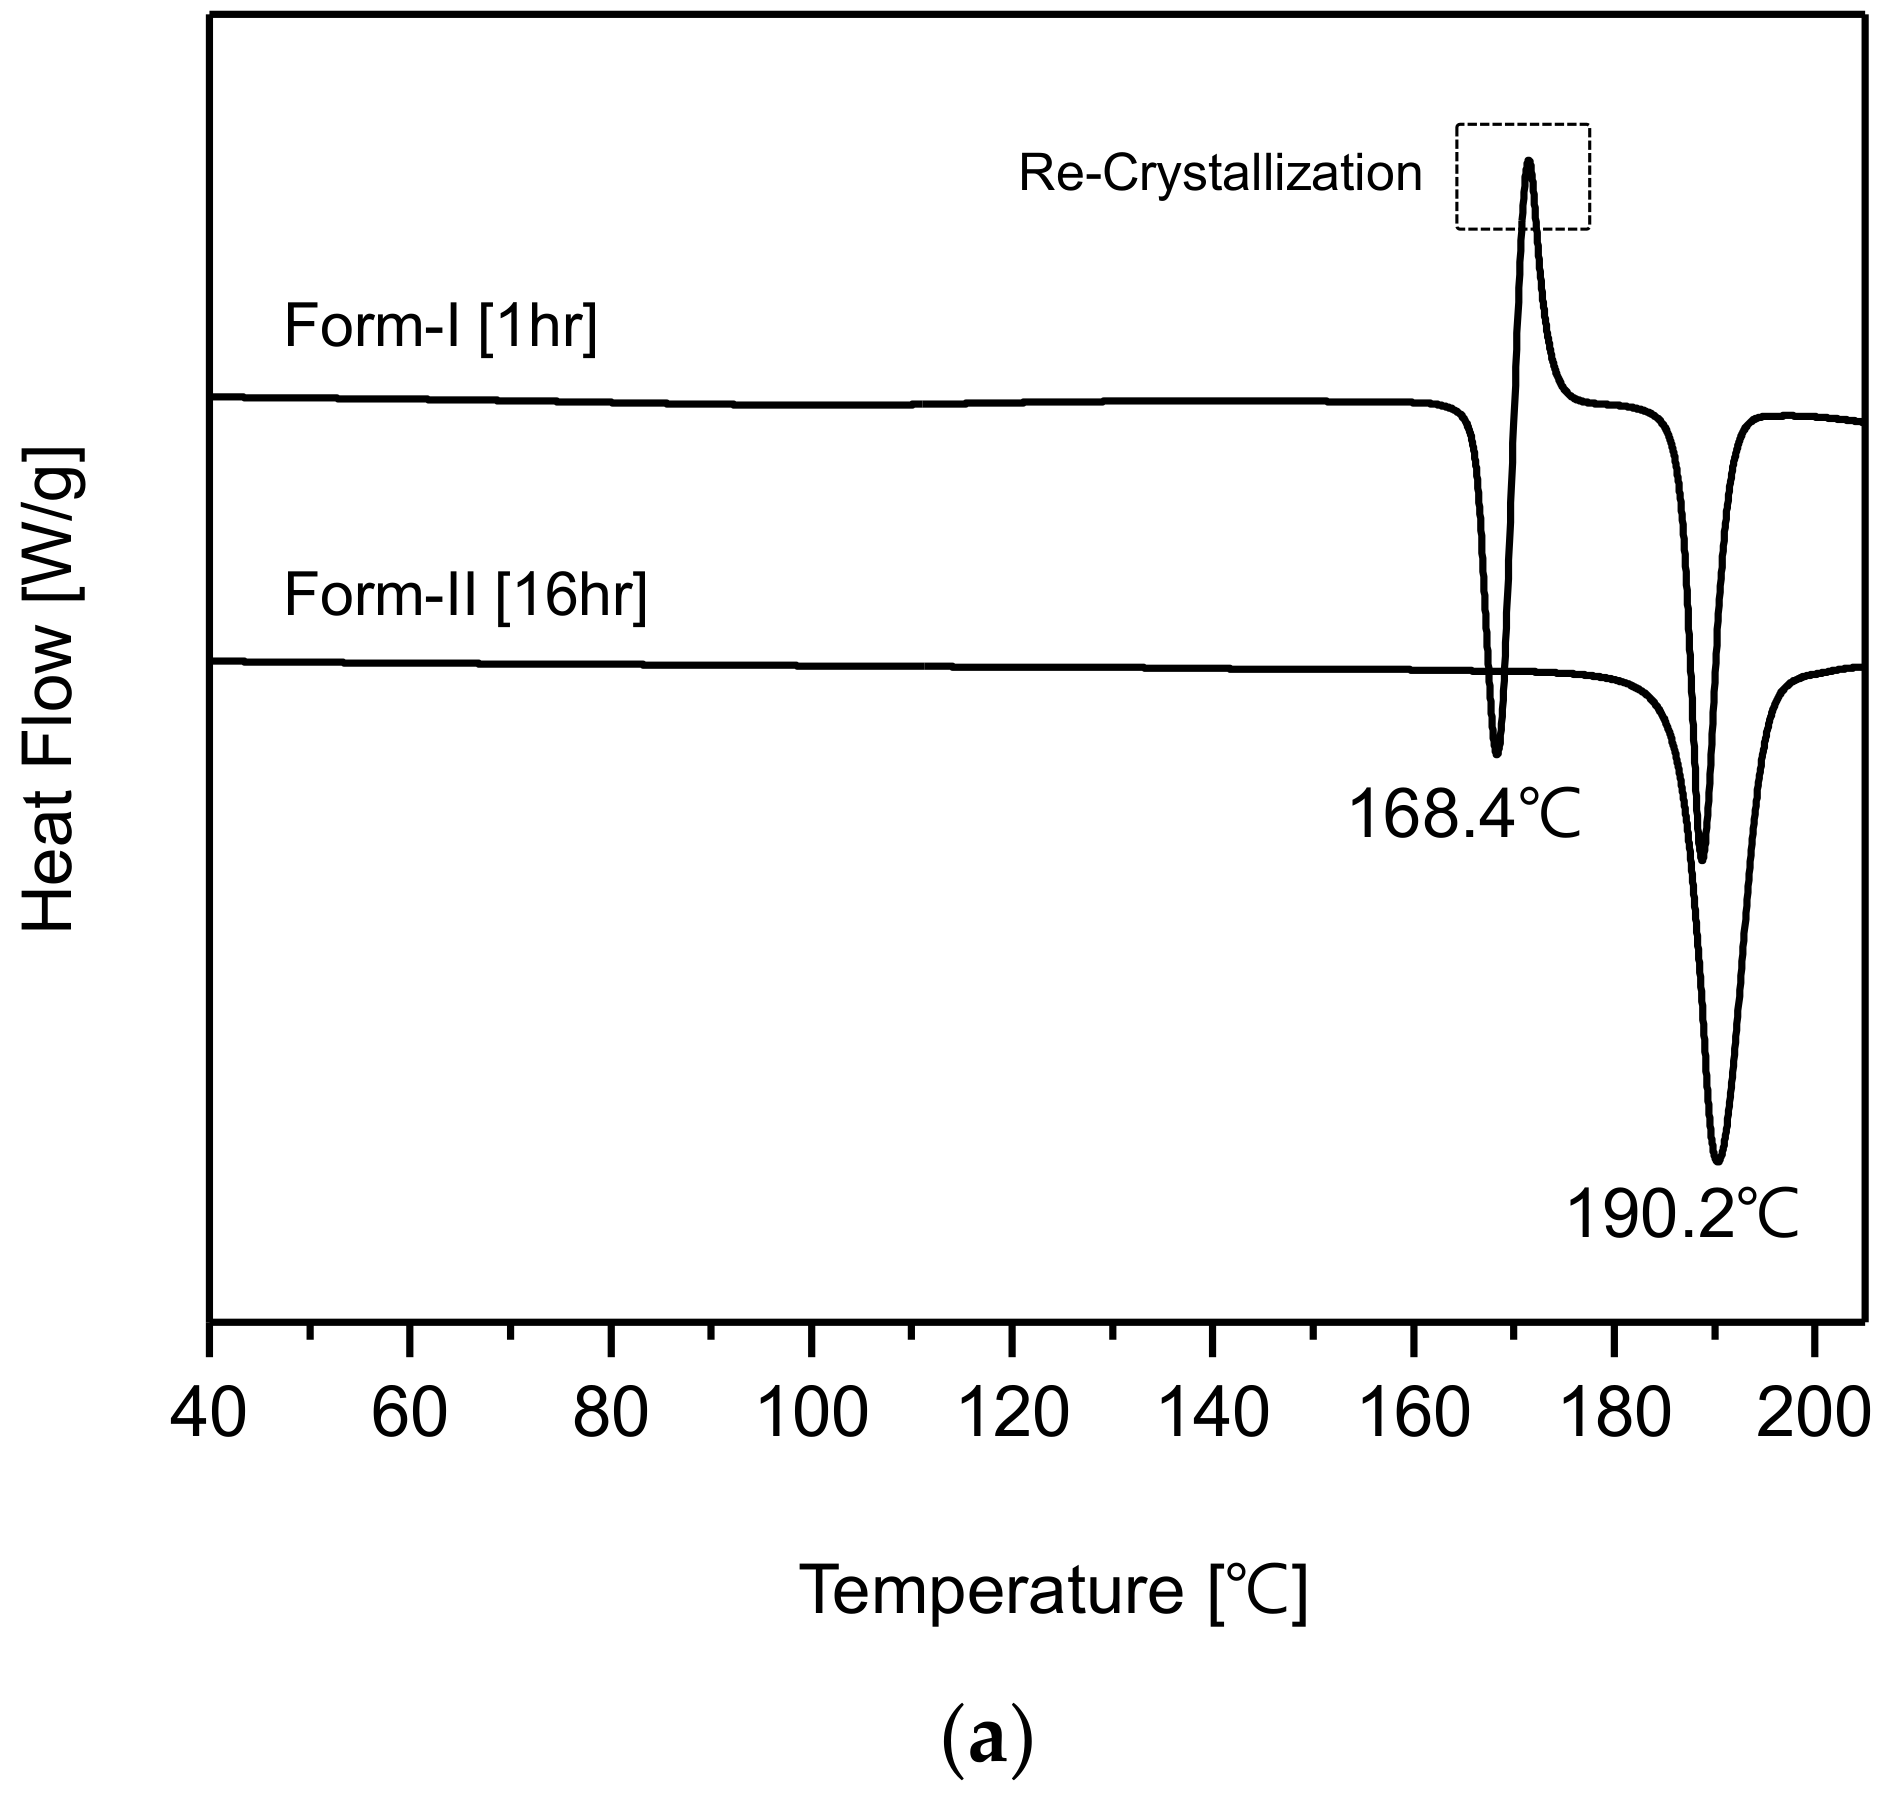
Figure 7a represents the DSC curves of CO form-I and form-II polymorphs. The CO form-I’s DSC curve shows an endothermic peak at 168.4 °C and a re-crystallization peak which is followed by another endothermic peak at 190.2 °C. This DSC curve coincides with that of CO form-I reported by Kim et al. [
20]. In addition, the DSC curve of form-II shows unique endothermic peak at 190.2 °C. By observing the DSC curves, it was predicted that CO form-I (endothermic peak 168.4 °C) could undergo polymorphic transformation to form-II (endothermic peak 190.2 °C). Accordingly, it was confirmed that CO form-I was metastable polymorph and form-II was stable polymorph.
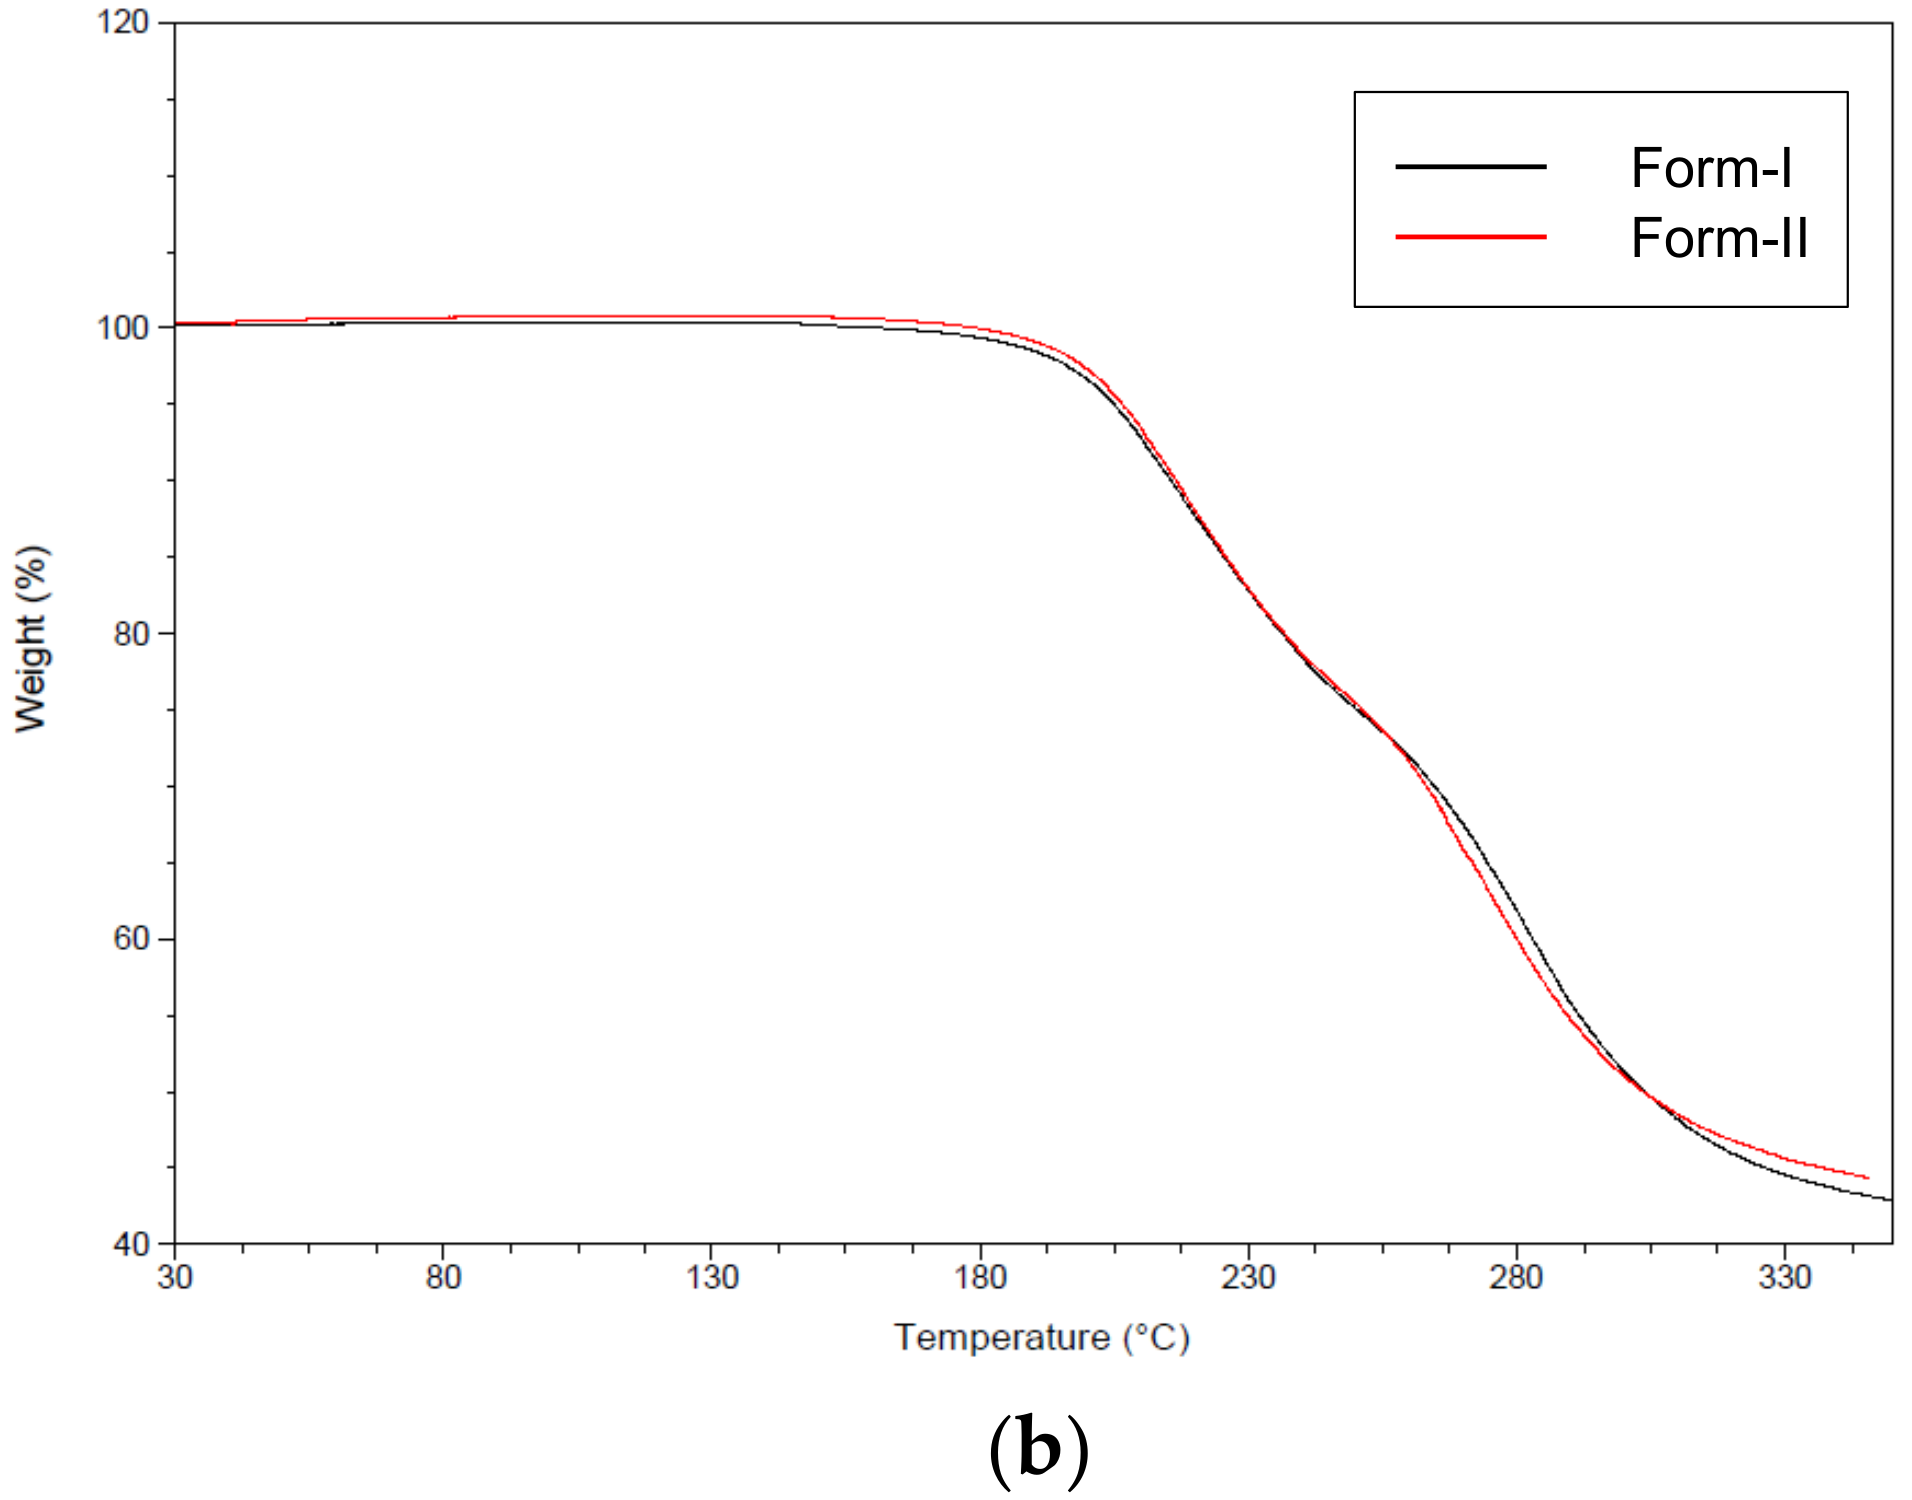
Figure 7b illustrates the TGA analysis results of CO polymorphs form-I and form-II. From this result, no loss in form-I and form-II mass due to the vaporization of solvent was observed. However, as can be seen in the TGA curves, the decomposition of both crystals occurred at approximatively 200 °C. Therefore, it was concluded that both form-I and form-II were ansolvates.
3.4. Solution-Mediated Polymorphic Transformation (SMPT) of CO Polymorphs
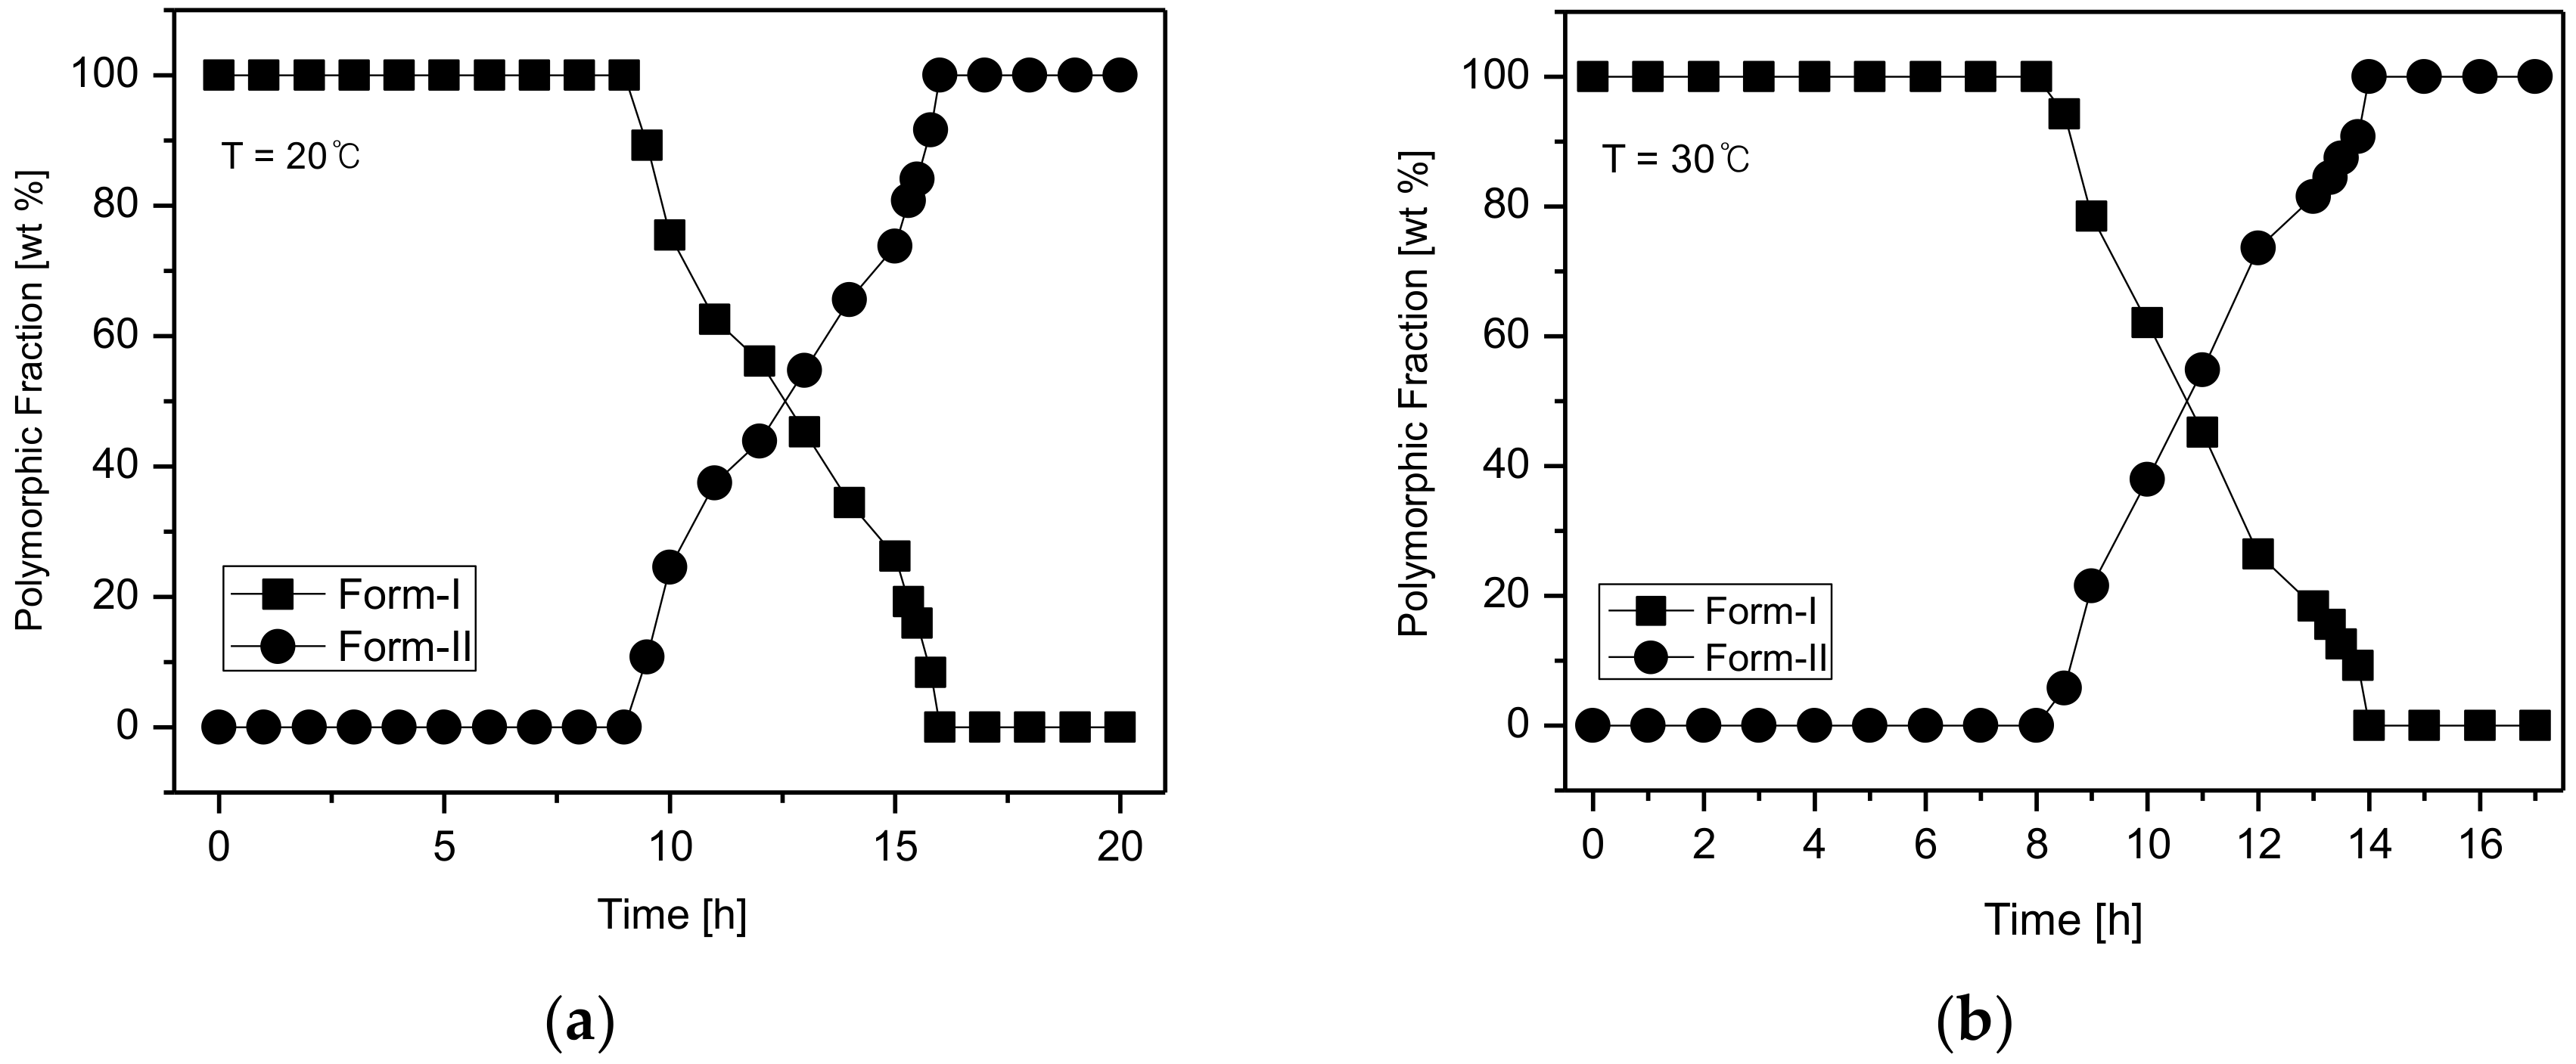
Figure 10 illustrates the temperature-dependent SMPT profile of CO form-I and form-II.
Figure 10a depicts the SMPT profile from CO form-I to CO form-II at 20 °C. The results suggest that at 20 °C, a phase transformation from CO form-I to CO form-II occurs after 15 h.
Figure 10b presents the SMPT profile of form-I to form-II at 30 °C. From these results, it was confirmed that CO form-I converts to CO form-II after 14 h. Likewise, the SMPT profile described in
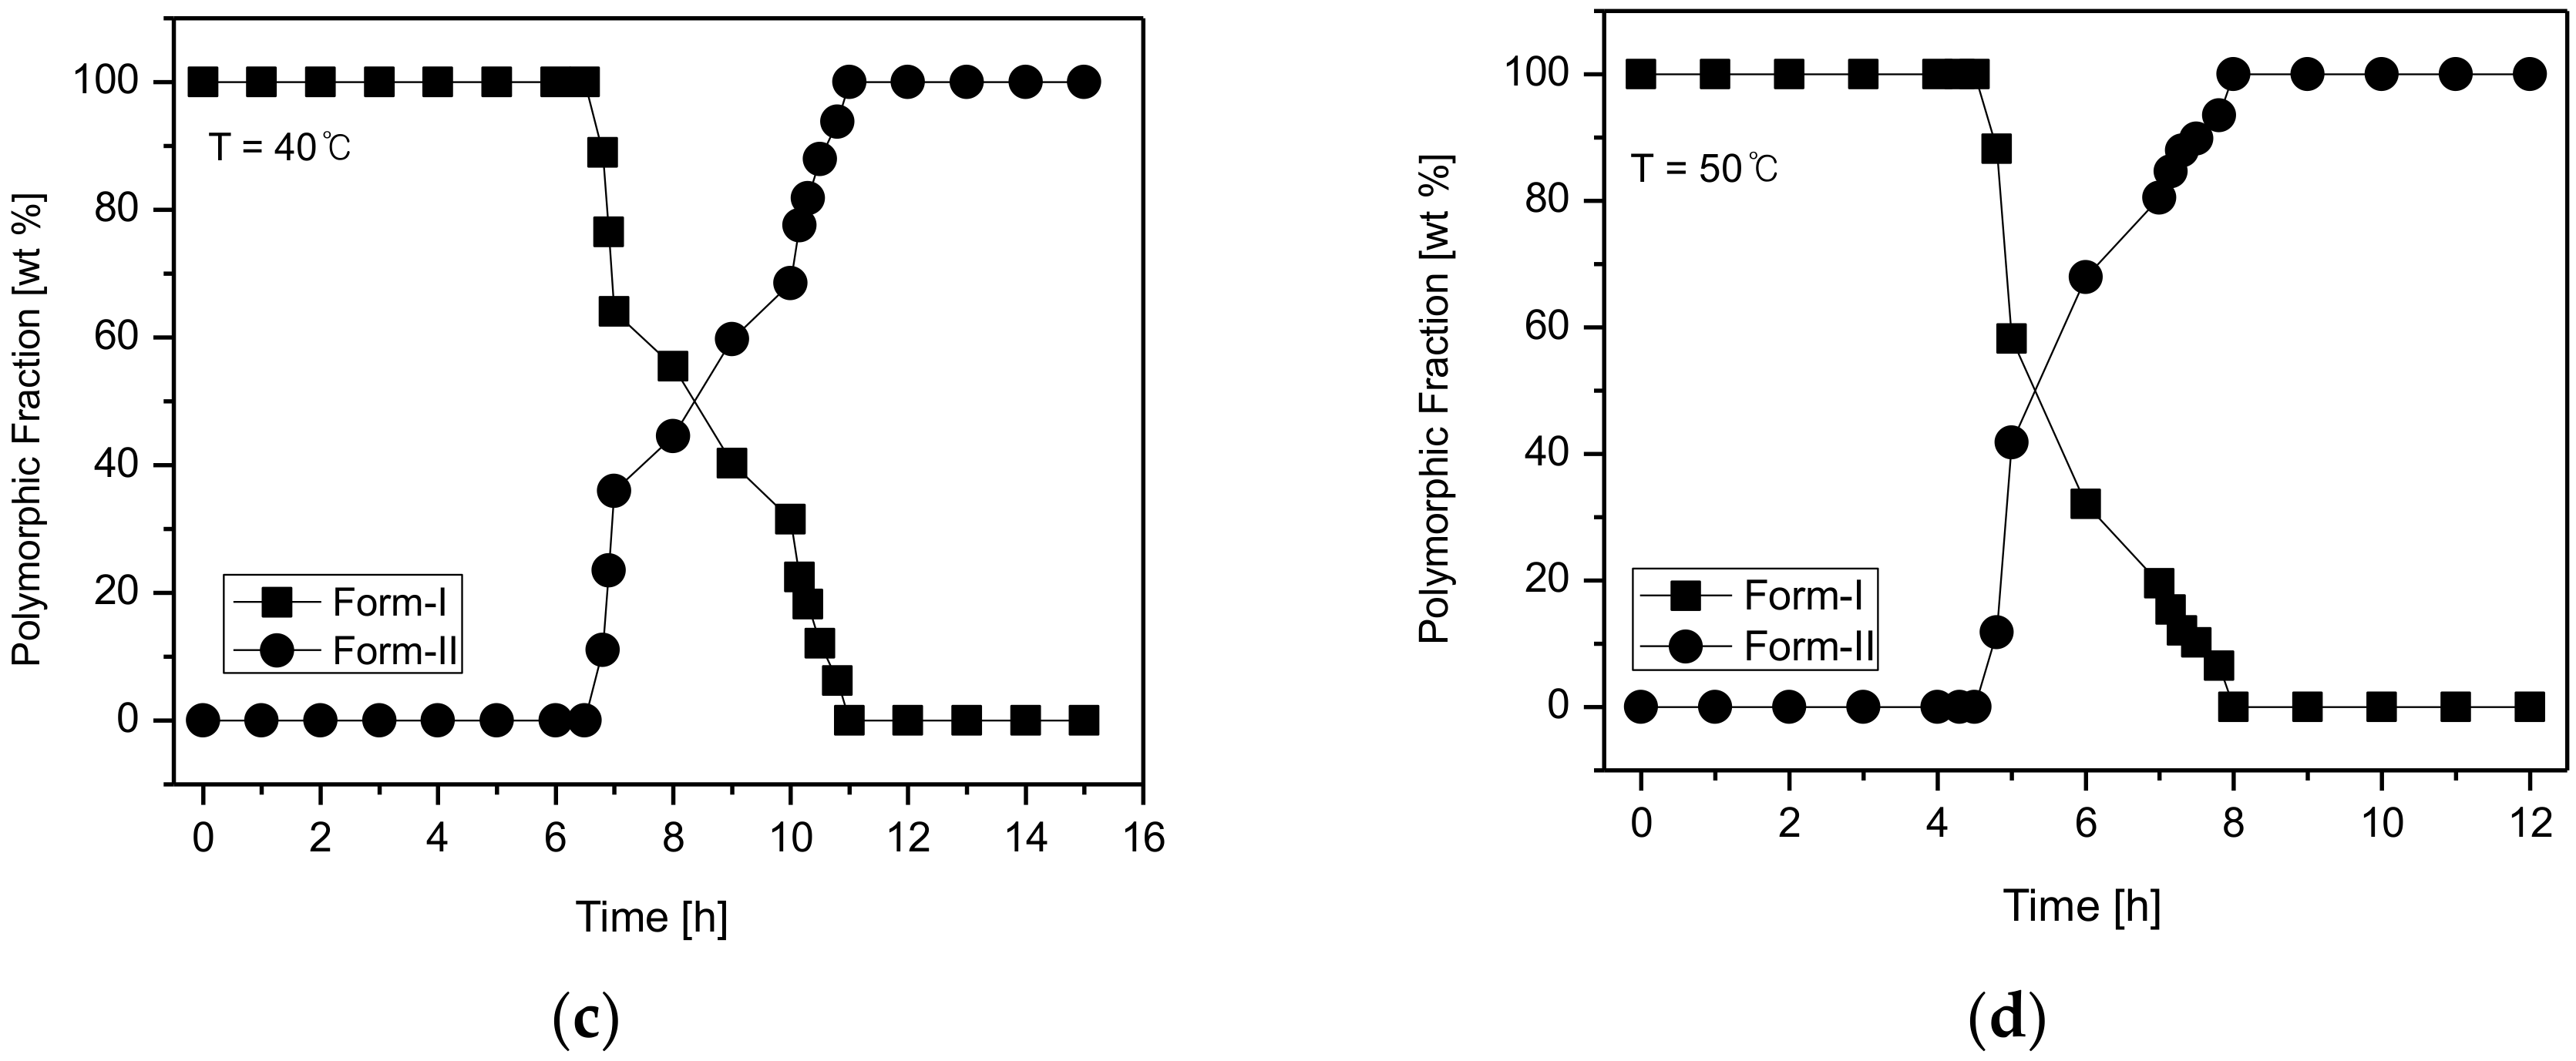
Figure 10c revealed that at 40 °C, the phase transformation from CO form-I to form-II occurs after 11 h. Lastly, the SMPT profile in
Figure 10d shows the SMPT at 50 °C; CO form-I undergoes polymorphic phase transformation to form-II after 8 h. By observing the SMPT profile provided in
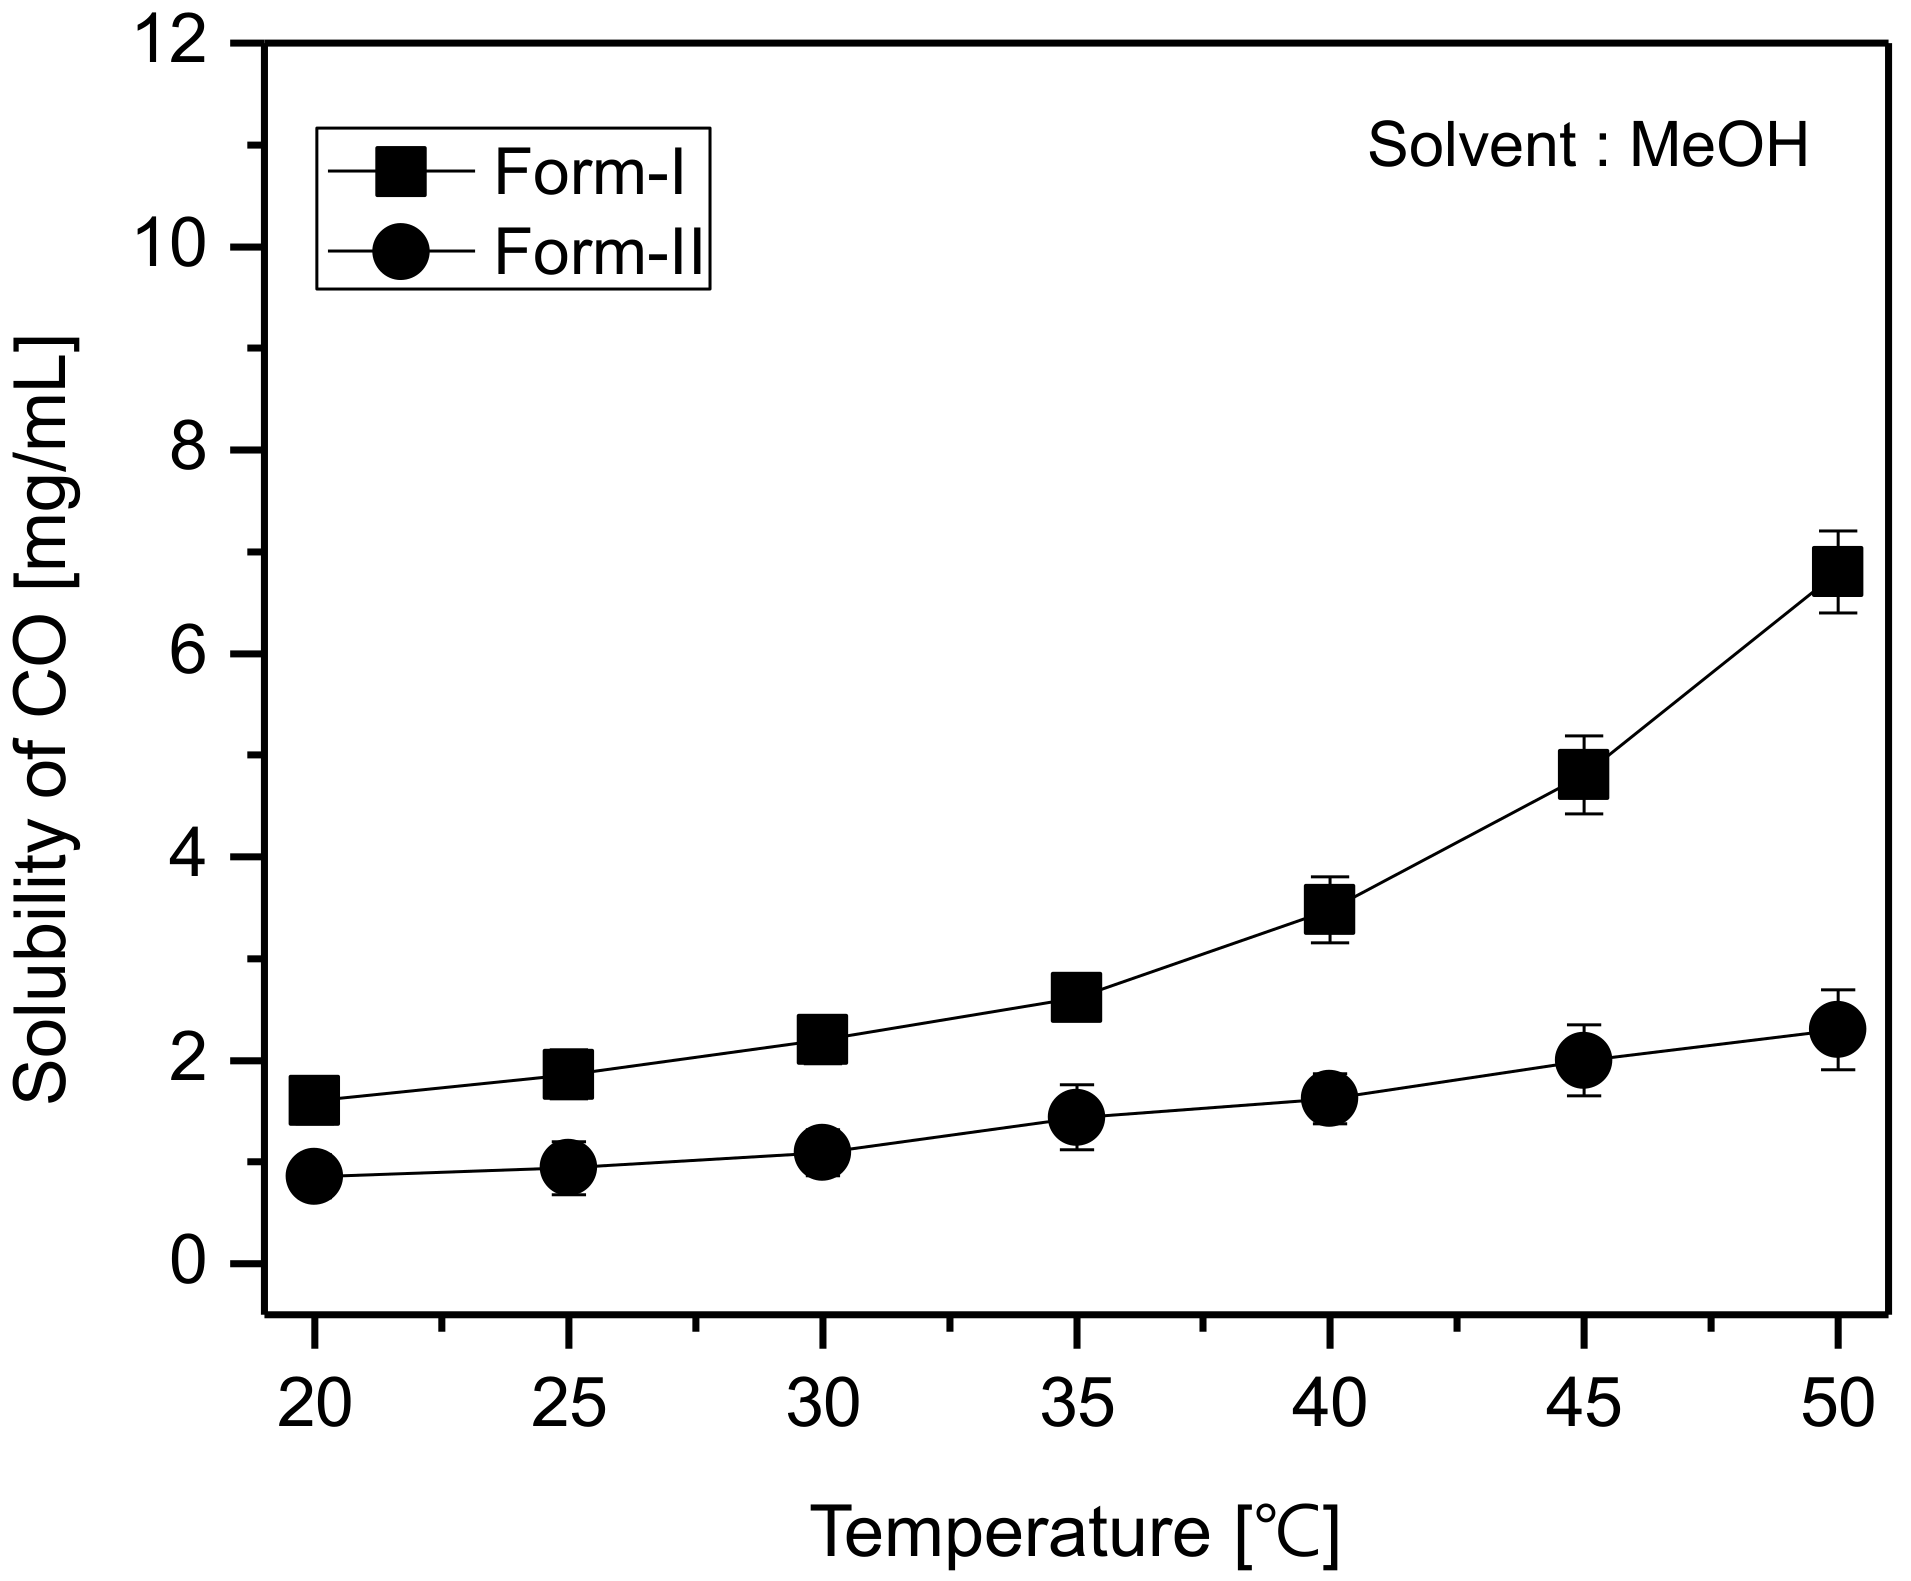
Figure 8, it can be predicted that the rate of polymorphic transformation tends to increase with the increase of temperature. Based on the solubility results observed in
Figure 9 and the SMPT profiles illustrated in
Figure 10, it was ascertained that CO form-I undergoes polymorphic transformation to form-II and two polymorphs are in monotropic relationship [
1,
2].
Generally, the SMPT process includes the simultaneous nucleation of stable crystals and dissolution of the metastable crystals, followed by the growth of stable crystals [
9]. Accordingly, for the quantitative determination of the SMPT, the induction time (t
I) was considered to be the period from the starting time of the SMPT in
Figure 8 to the starting time of nucleation, while the reconstruction time (t
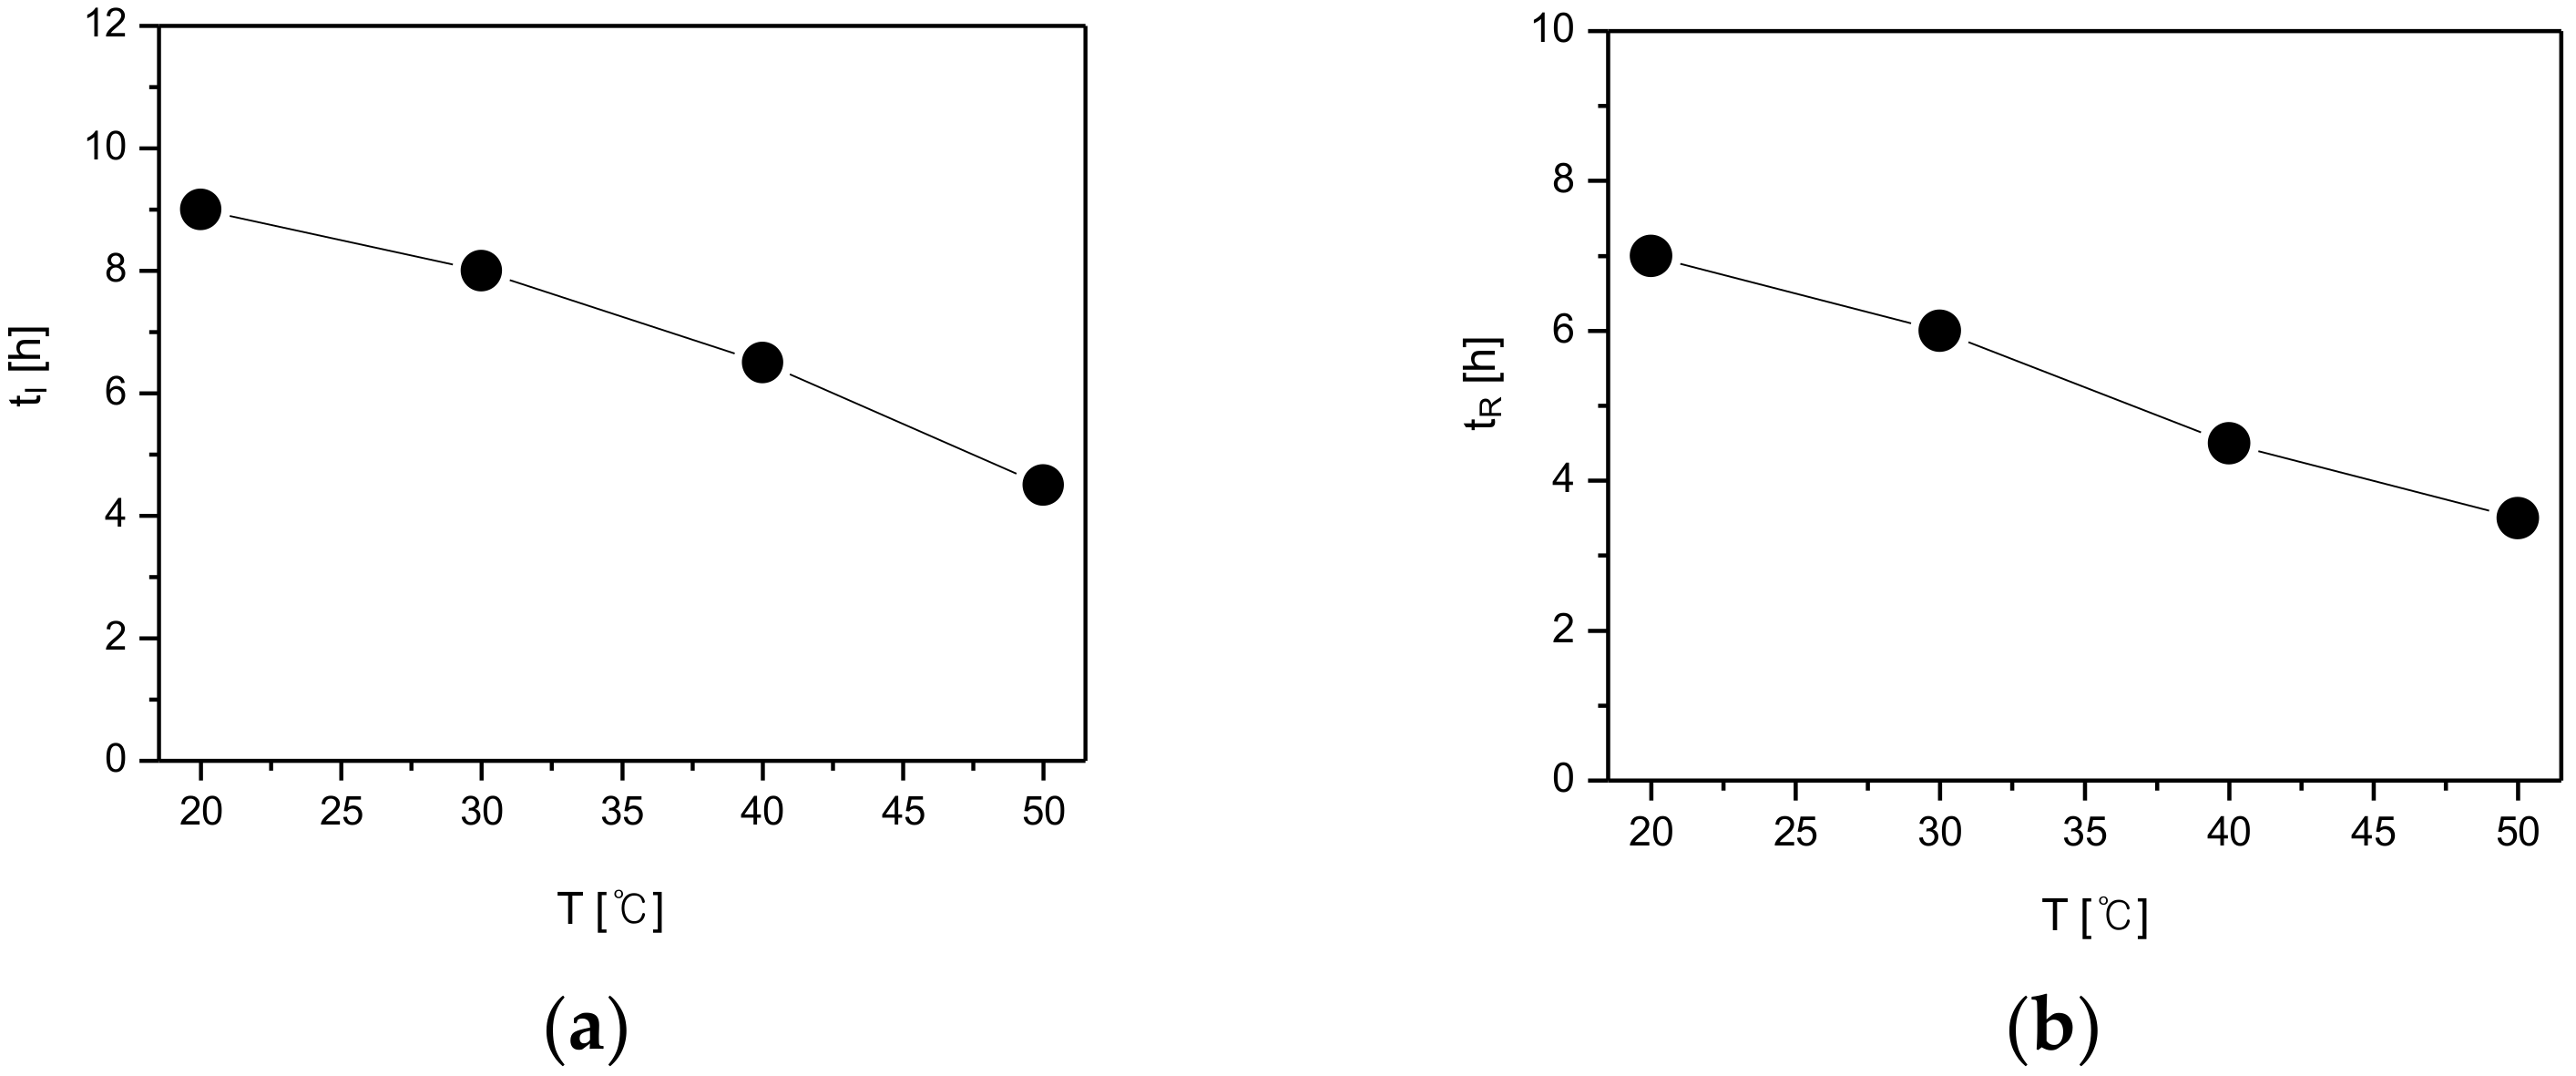
R) was considered to be the interval from the starting time of the phase transformation of the metastable crystals into the stable crystals until completion. The induction and reconstruction times are depicted in
Figure 11 based on the SMPT profile of the CO polymorphs illustrated in
Figure 10.
Figure 11a describes the induction time (t
I) of CO form-II under different temperature conditions. According to the results, the induction time was 9 h when the temperature was 20 °C, 8 h when temperature was 30 °C, 6 h 30min when the temperature was 40 °C, and lastly, 4 h 30 min when the temperature was 50 °C. Additionally, as demonstrated in
Figure 11b, with a change in temperature, the reconstruction time from form-I to form-II was 7 h at 20 °C, 6 h at 30 °C, 4 h 30 min at 40 °C, and 3 h 30 min when the temperature was 50 °C. By examining
Figure 11, it can be seen that both the induction time and the reconstruction time tend to decrease with the increase of temperature. This is assumed to result from the fact that the increase of temperature improves the solubility difference of CO form-I and form-II (
Figure 9), and therefore increases the supersaturation. Here, the increase of supersaturation is assumed to promote form-II’s nucleation and mass transfer rates, and subsequently impact the decrement of both the induction and reconstruction time (
Figure 11).
3.5. Investigation of Polymorphic Transformation Kinetics of CO Polymorphs
According to the Volmer’s model, the rate of nucleation depends on temperature and supersaturation. Based on the Volmer’s model, the induction time (t
I), which is inversely proportional to the nucleation rate, can be expressed in terms of absolute temperature (T) and supersaturation (S) [
6,
16,
18].
In Equation (1), the supersaturation (S) can be expressed as
S =
C*
meta/
C*
stable. This equation can be employed to calculate the supersaturation level. Also, as can be seen in Equation (1), the temperature and supersaturation promote the induction time. According to the Volmer’s model, there is a proportional relationship between the rate of nucleation, the temperature (T) and the supersaturation (S) [
6,
16,
18]. In this regard, the effects of temperature and supersaturation on the induction time (t
I) was quantitatively measured and the results are depicted in
Table 1. As demonstrated in
Figure 7, CO form-I and form-II’s solubility differences tend to increase with the increase of temperature. Moreover, the supersaturation (S) measurements in
Table 1 show that the supersaturation level (
S =
C*
form-I/
C*
form-II) increase with the increase in temperature. This result can explain the reason for the induction time in
Figure 9a has the tendency to decrease when the temperature increases. Here, the increase of temperature is assumed to impact the increase of CO polymorphs supersaturation level, which promotes form-II’s nucleation and consequently provoke the reduction of the induction time. As the induction time is inversely proportional to the nucleation rate [
6,
16,
18]. In the purpose of supporting the predicted result related to the induction time, experiments were carried out using the model equation (Equation (1)) to verify and confirm the accordance between the theoretical values and the experimental values (
Table 1). The theoretical results predicted using Equation (1) in
Table 1 confirmed that the increase in temperature influences the decrease in the induction time. Moreover,
Figure 9a and
Table 1 display the experimental results for the induction time, demonstrating that the induction time has the propensity to decrease when the temperature increases. Accordingly, it was assessed that the theoretical results were in good accordance with the experimental results. Based on these results, the decrement of the induction time depending on the increase of temperature is assumed to be a consequence of the improvement of form-II’s nucleation, provoked by the increase of the supersaturation level.
The reconstruction time (
tR) is inversely proportional to the mass transfer rate (
r) if the total amount of the transformed crystals is consistent. The following expression,
r~
k·Δ
C, is used when the mass transfer rate (
r) increases dependent on the transfer coefficient (
k) and concentration difference (Δ
C). Here, the concentration difference (Δ
C) is the difference between the solubility of meta stable polymorph and the stable polymorph (Δ
C =
C*
meta −
C*
stable). Moreover, the transfer coefficient (
k) is in direct proportion to the diffusivity (
DAB). Moreover, according to Stokes–Einstein equation, the diffusivity (
DAB) is directly proportional to temperature (
T) [
6,
16]. The Stokes–Einstein equation is as follows.
Therefore, if other parameters are maintained as constants and only the temperature is varied, the relation between reconstruction time (
tR) and mass transfer rate (
r) using the Stokes–Einstein equation (Equation (2)) can be expressed as below [
6,
16].
In
Table 2, the effect of temperature on the reconstruction time (
tR) behavior was evaluated and predicted using the temperature dependent-solubility data of CO form-I and form-II depicts in
Figure 7. As can be seen in
Table 2, the concentration difference (Δ
C) between form-I and form-II increases with the increase of temperature. Also, the experimental measurements show that the reconstruction time (
tR) decreases with the increase of temperature. The Equation (3) demonstrates that the reconstruction time (
tR) is inversely proportional to the temperature (T) and concentration difference (Δ
C). Moreover, in
Table 2, the theoretical measurements for the reconstruction time, predicted via Equation (3), revealed that the reconstruction time (
tR) tends to decrease with the increase of temperature. Accordingly, the experimental results for reconstruction time illustrated in
Figure 9b and
Table 2 were assessed to agree with the theoretical results. Here, the decrement in the reconstruction time is presumably due to the increase in temperature, the increase of which presumably promotes the solubility difference between CO form-I and form-II, and therefore improves the rate of mass transfer.
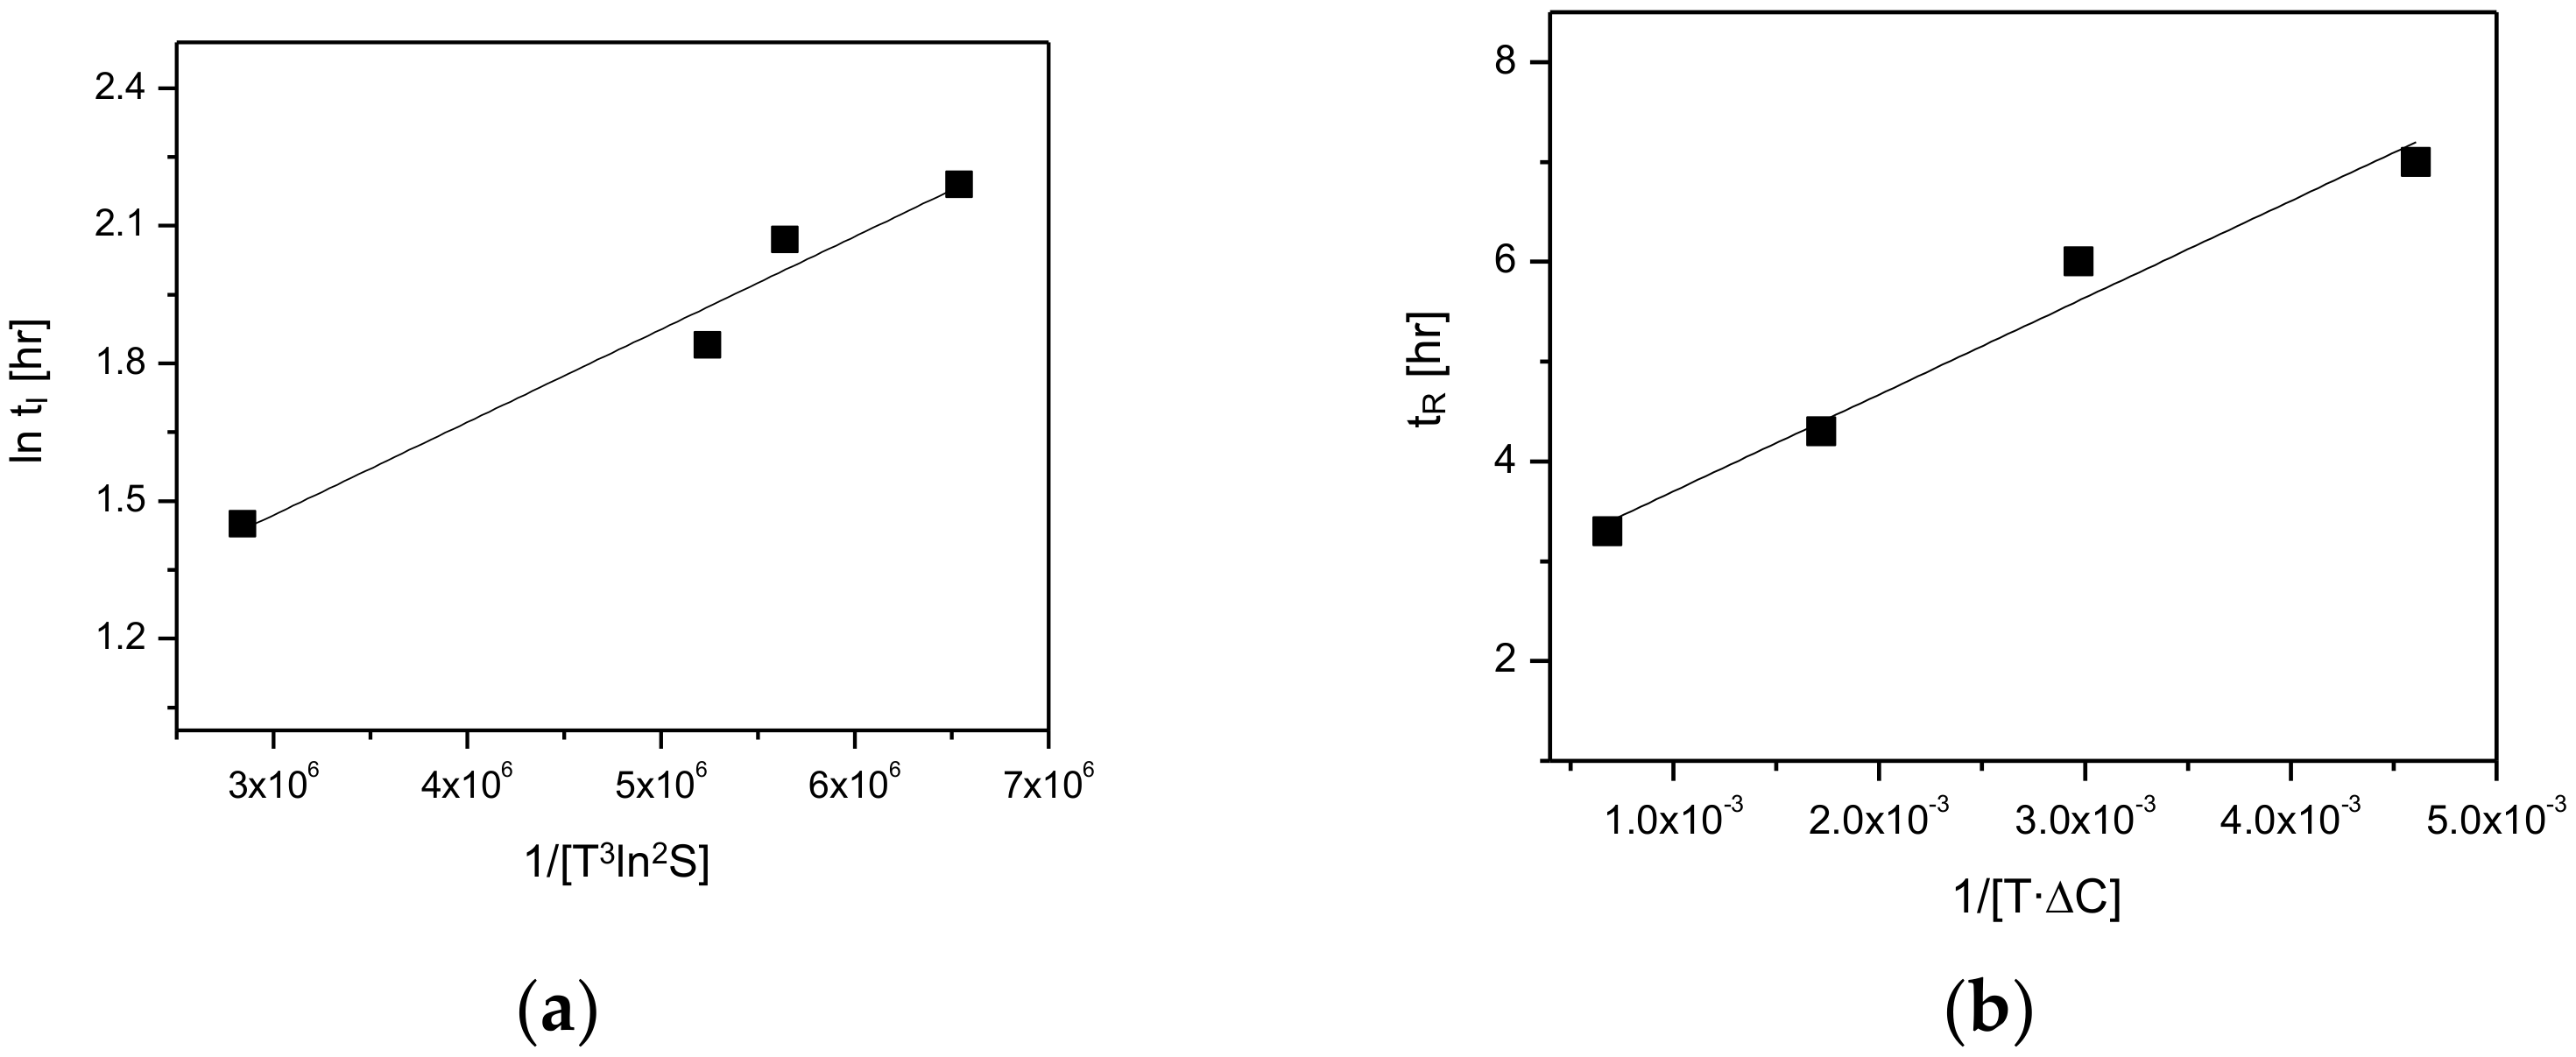
As depicted in
Figure 12, the kinetics of the polymorphic transformation, namely induction and reconstruction time, were plotted as a function of
and/ or
.
Figure 12a demonstrates the plotting results for the induction time (
tI) and 1/[
] data (
Table 1). Here, the result shows a linear dependence of induction time (
tI) and 1/[
]. Furthermore,
Figure 12b describes the plotting results for the reconstruction time (
tR) and 1/[
data depicted in
Table 2. Based on this result, it was confirmed that the reconstruction time is linearly dependent on 1/[
. Accordingly, it was ascertained that the kinetics of the polymorphic transformation was significantly influenced by the rate of nucleation and rate of mass transfer.
The findings of this work are assumed to be essential information to be employed for the selection and production of a desired CO polymorph in term of satisfactory formulation, manufacturing, and storage of CO drug products.

 ,
, 

