

A Genetic Study of Spillovers in the Bean Common Mosaic Subgroup of Potyviruses


Abstract
1. Introduction
2. Materials and Methods
3. Results
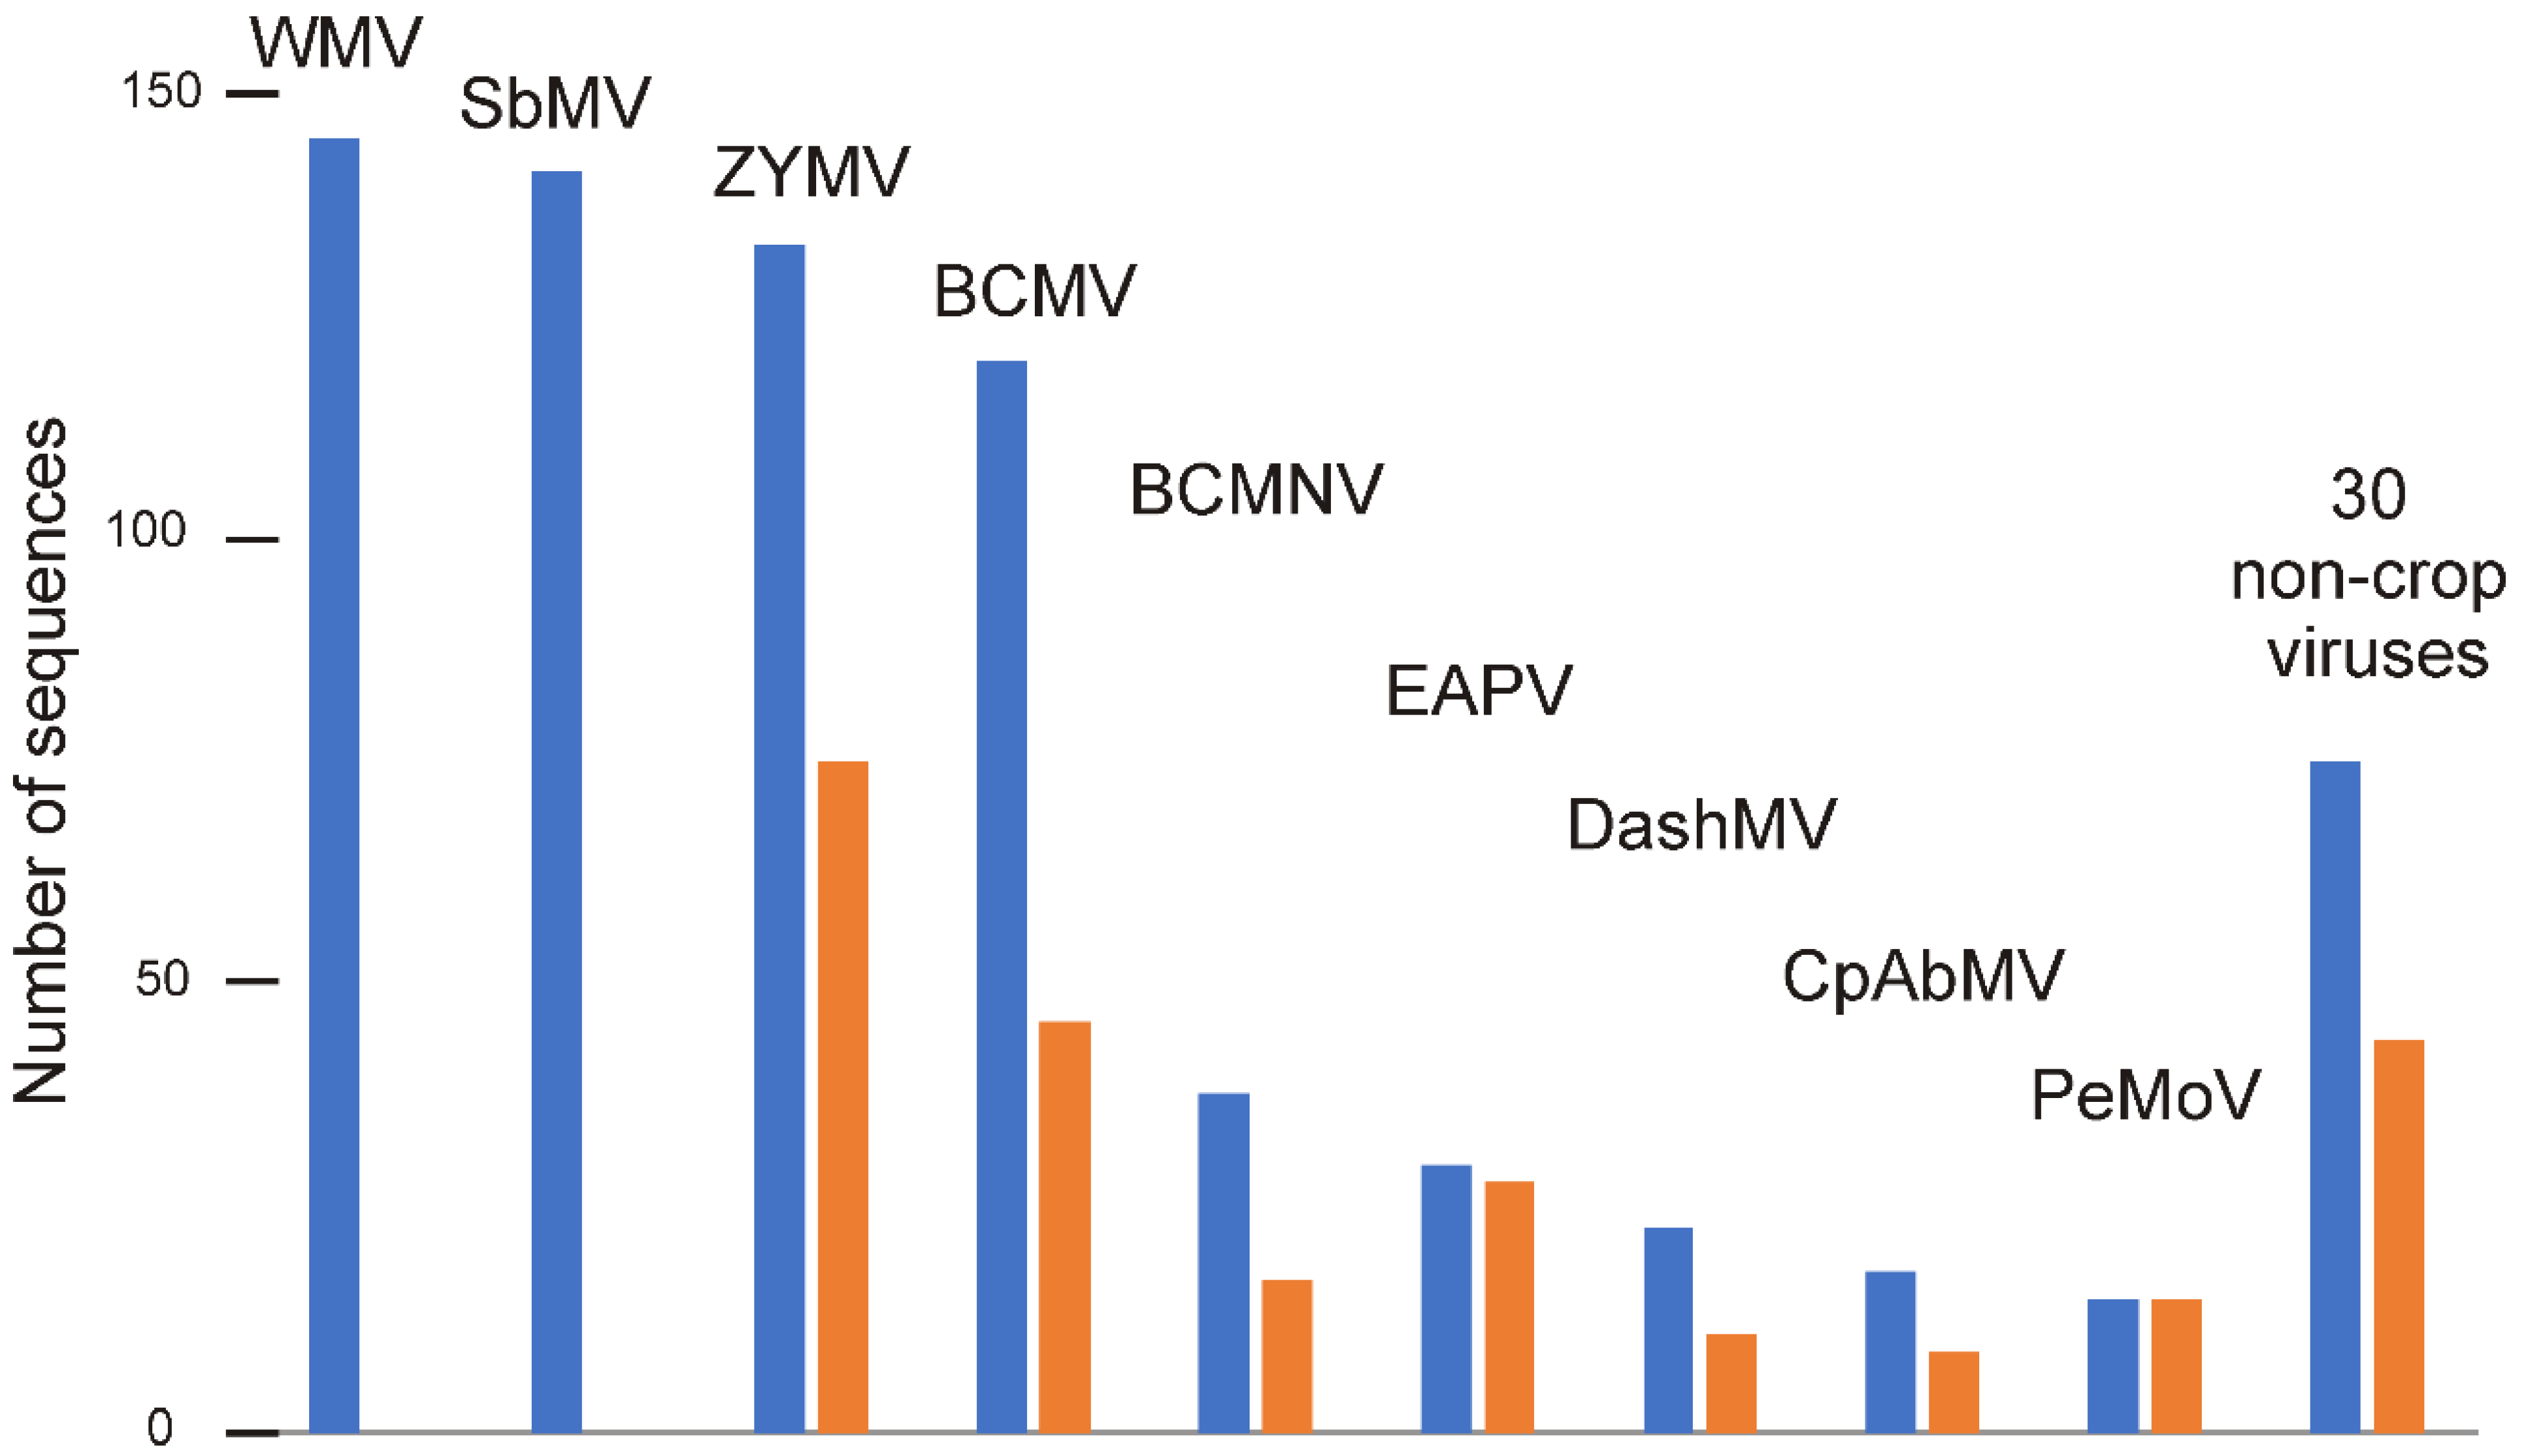
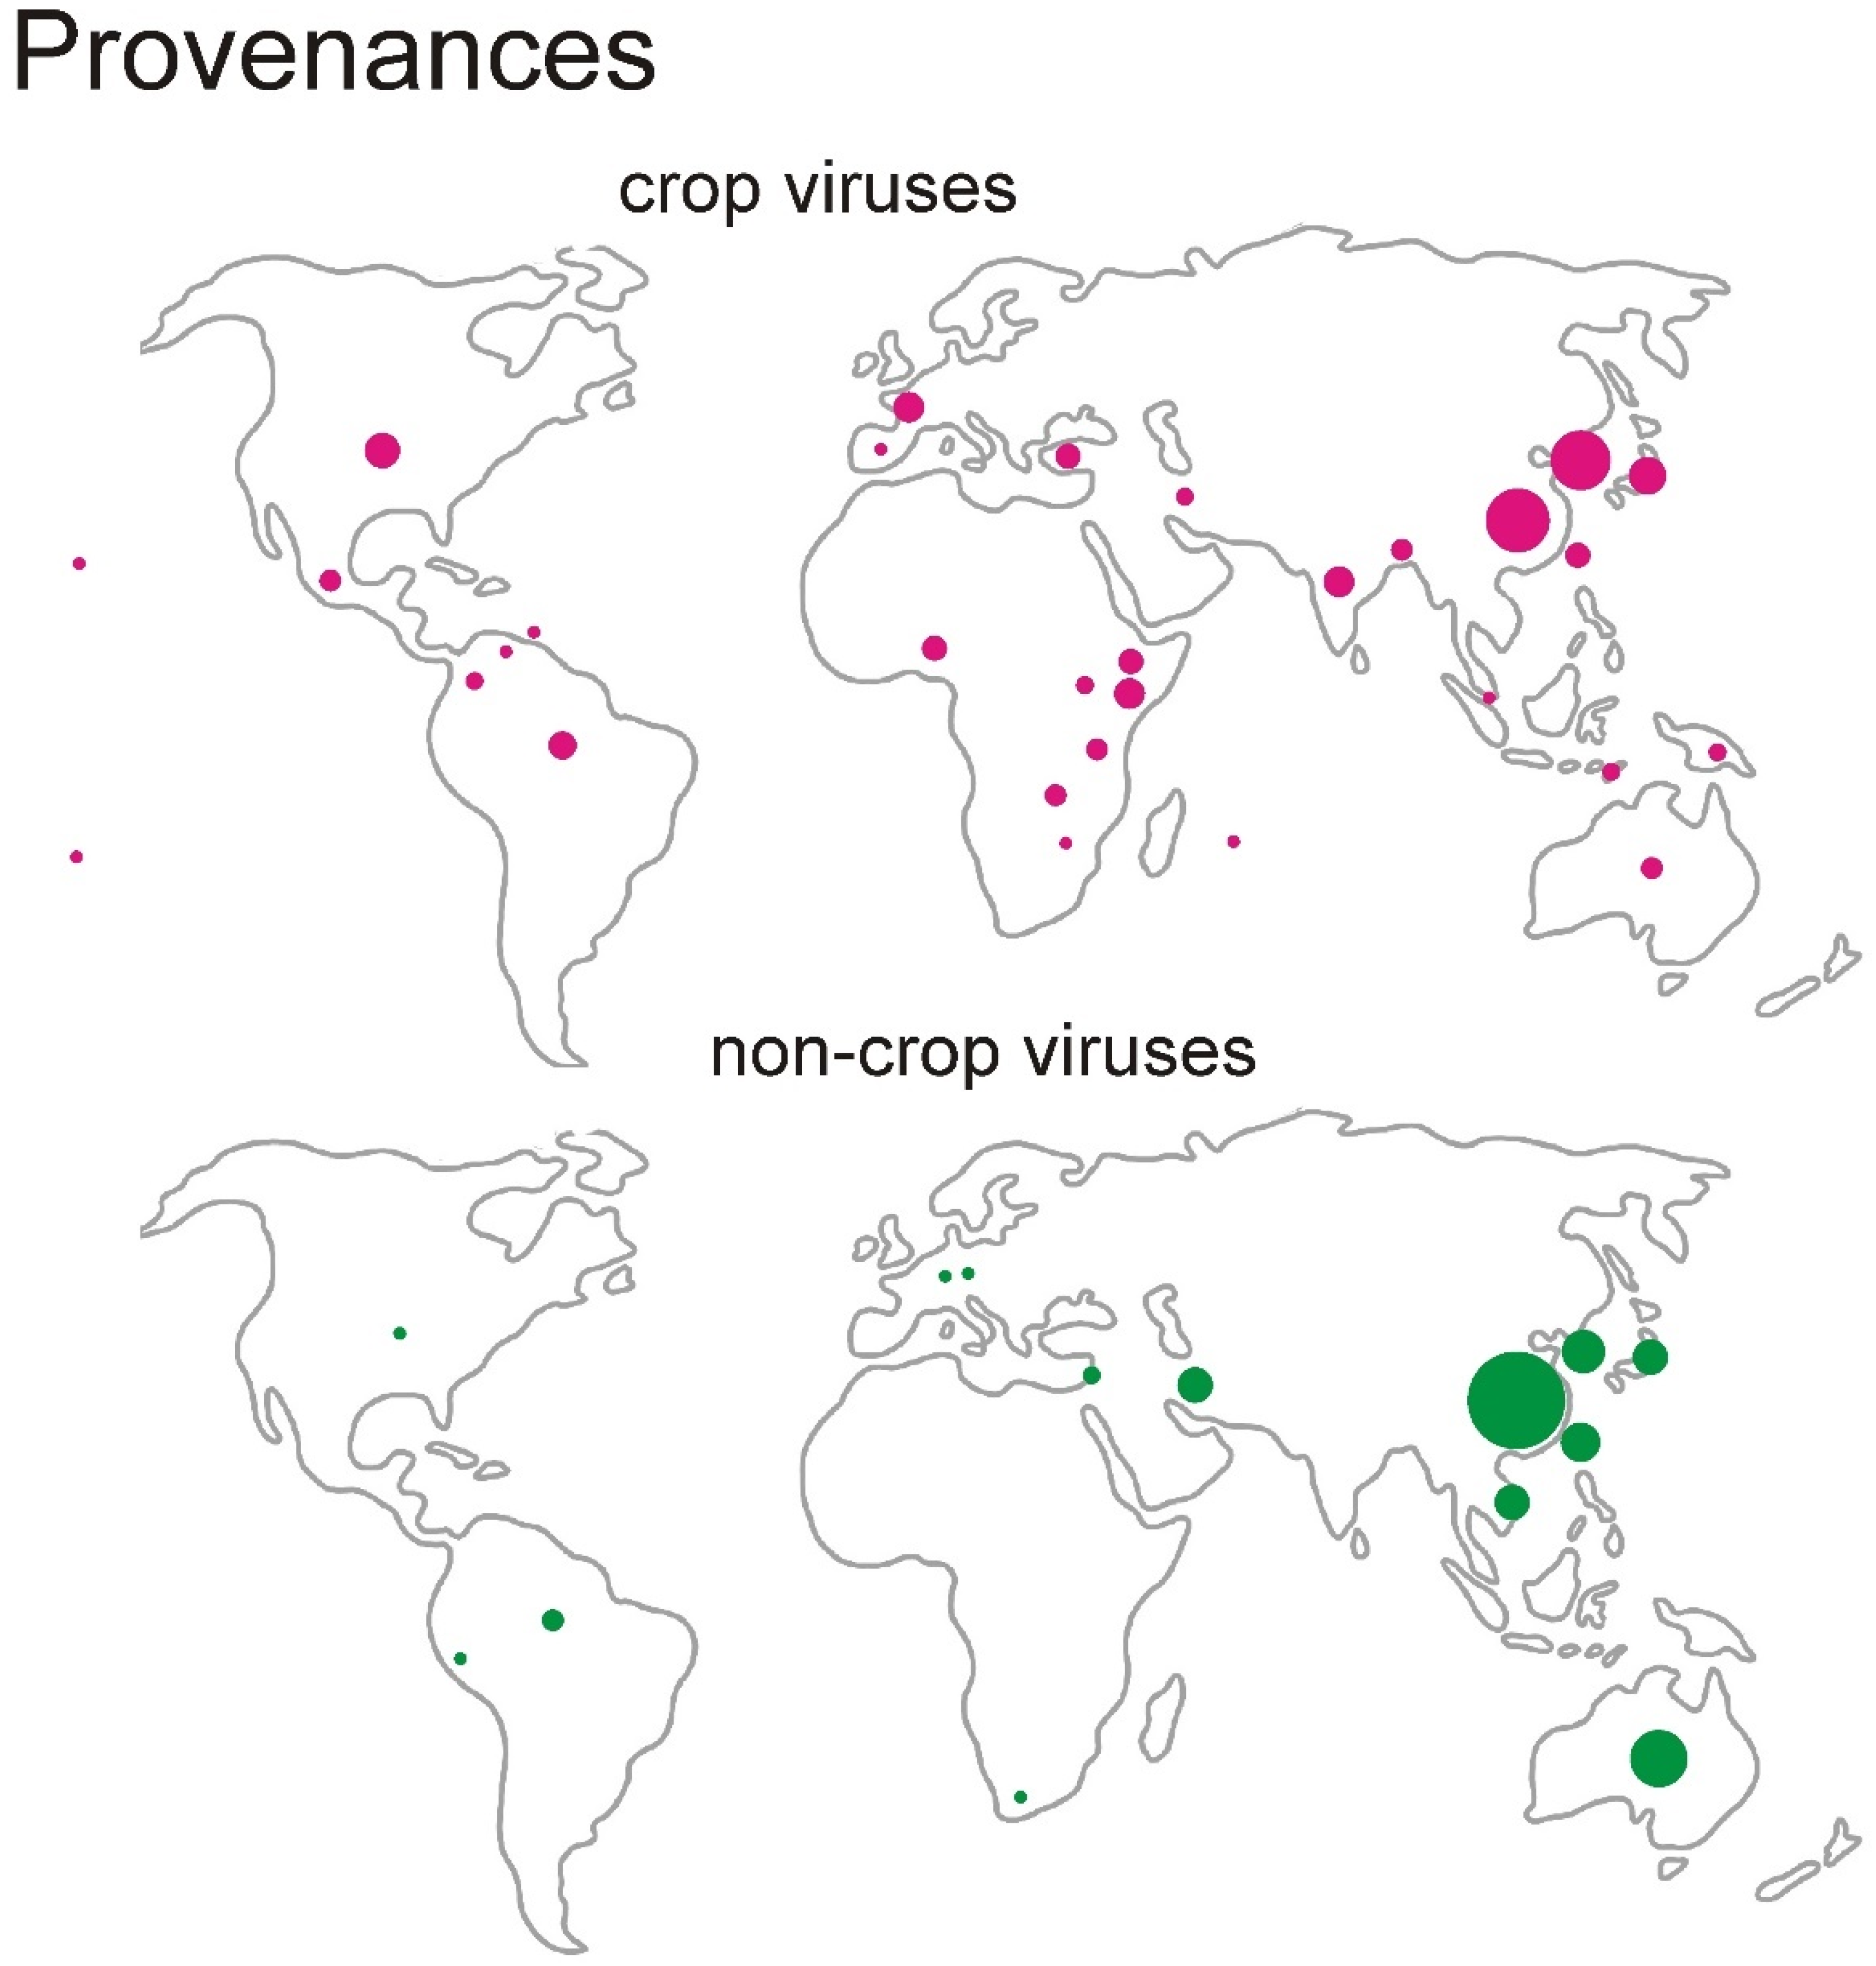
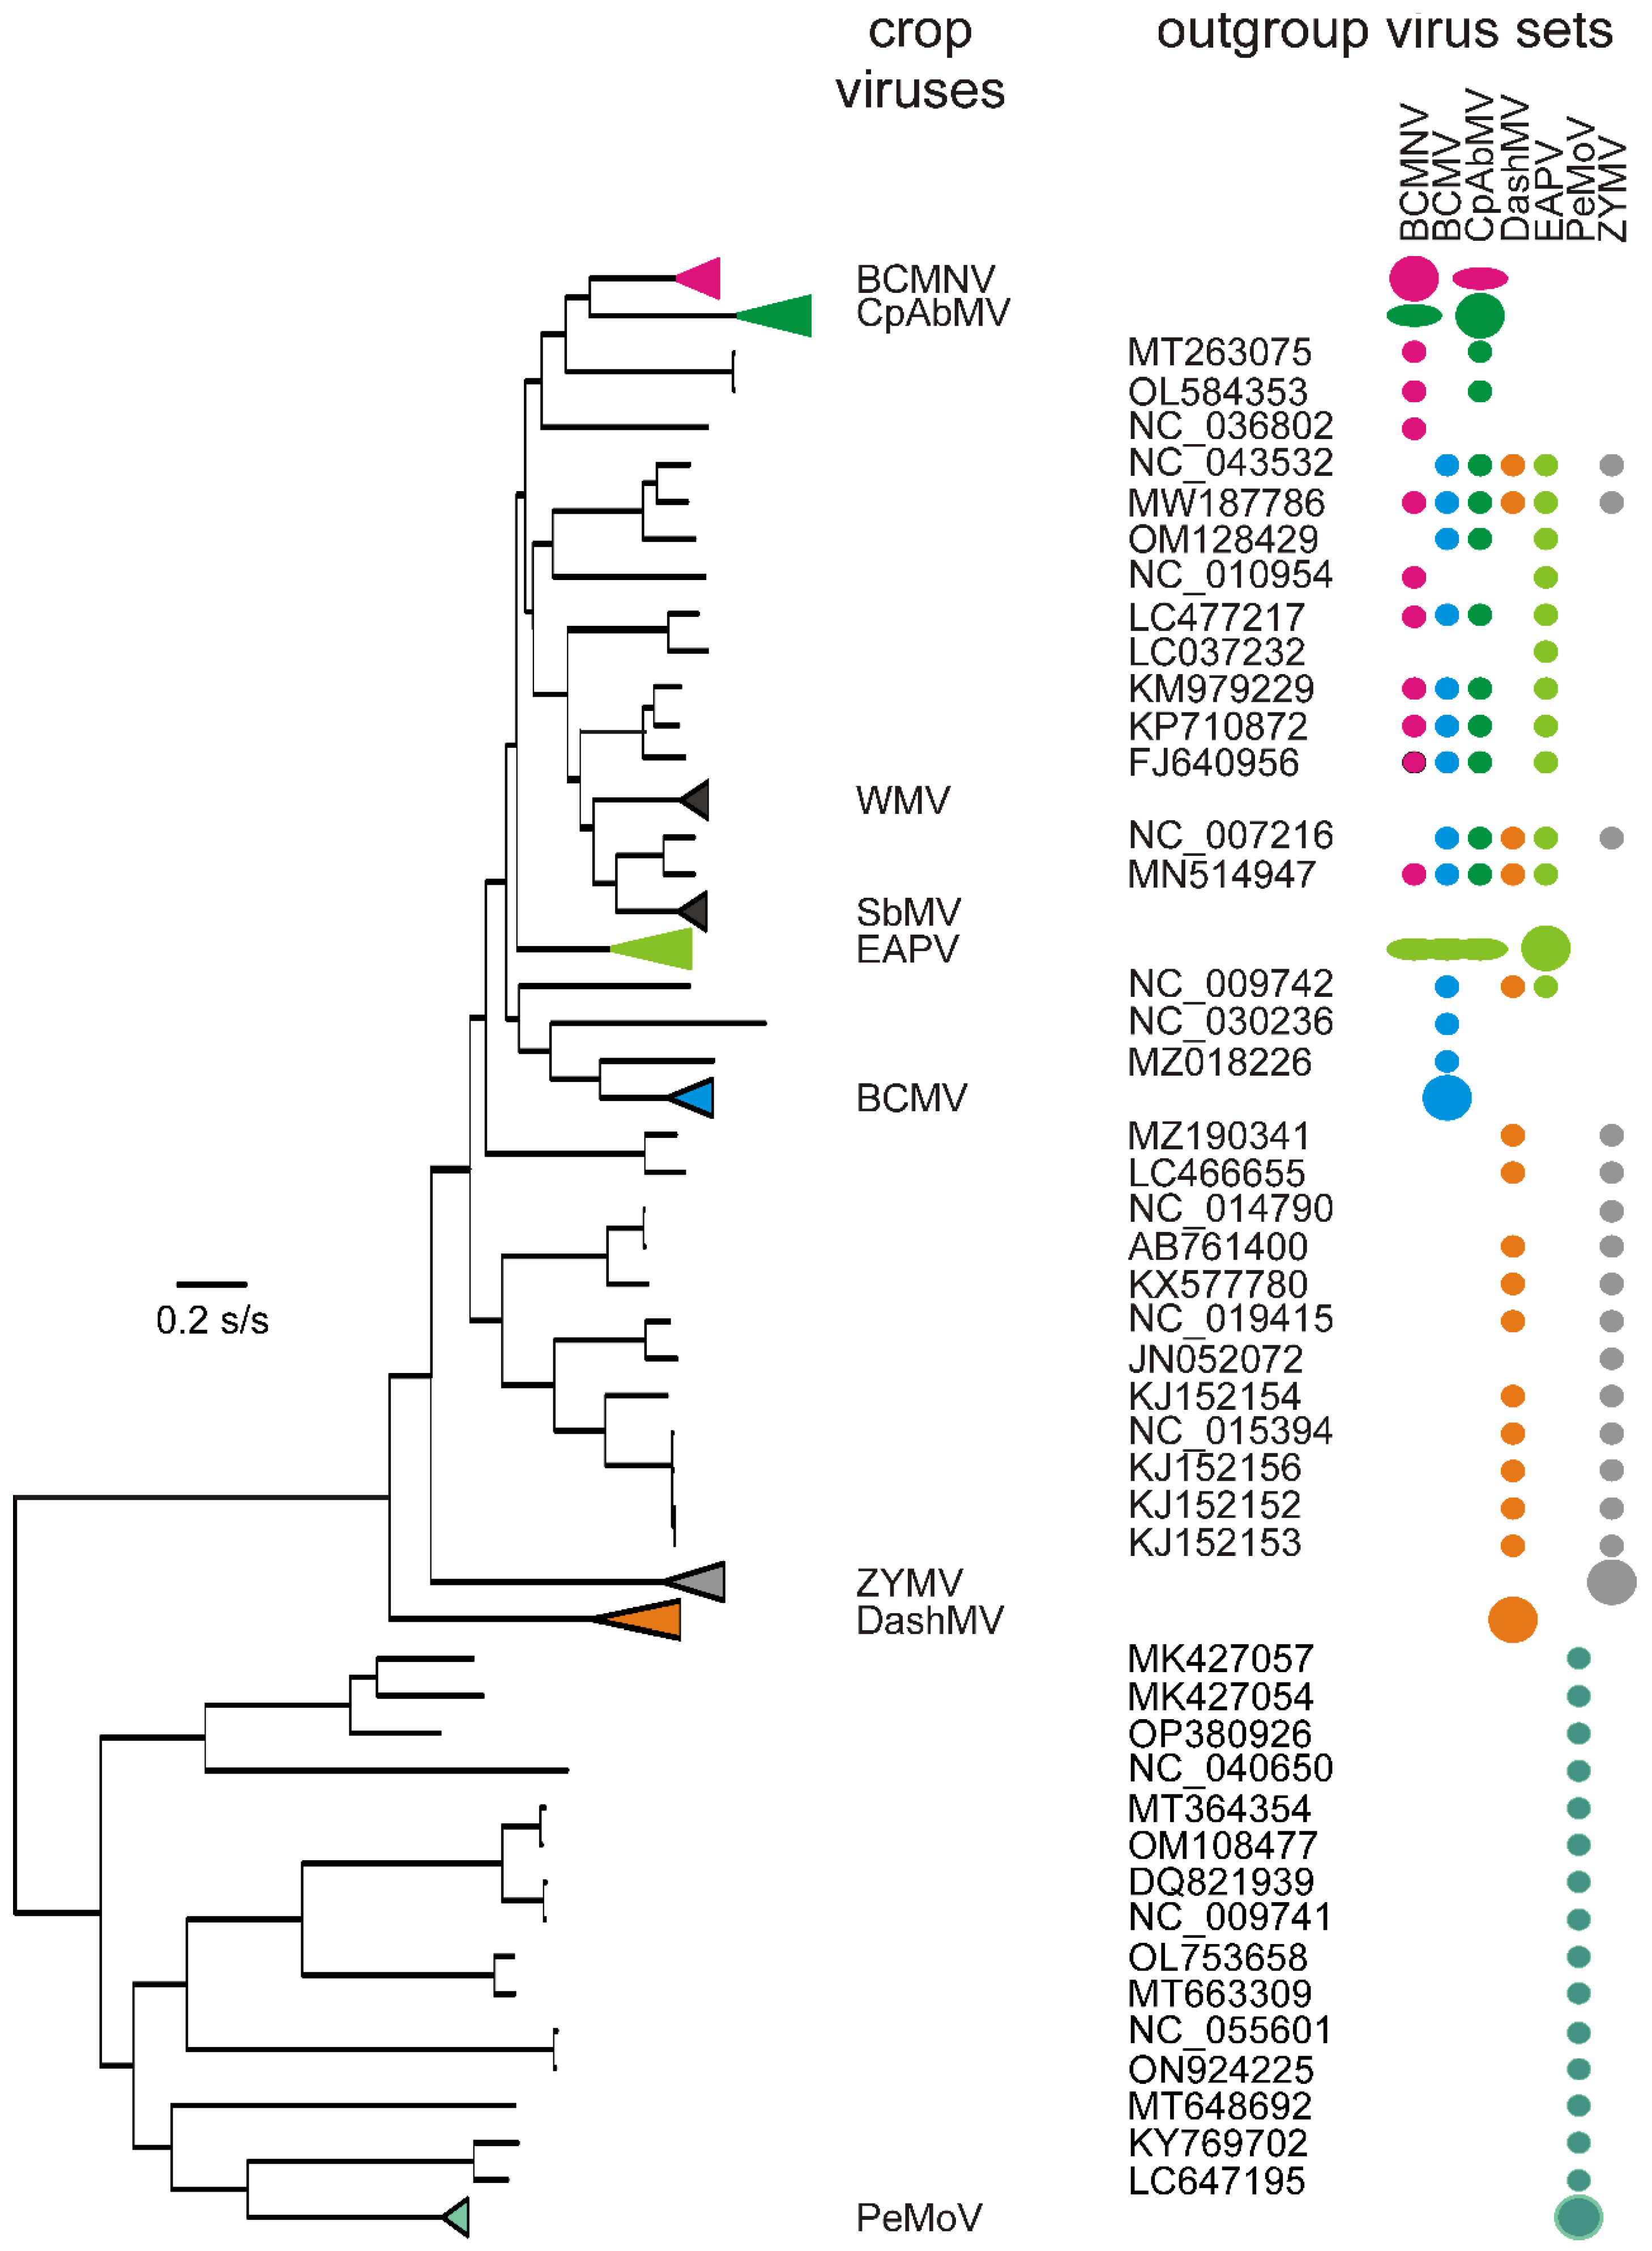
3.1. The Data
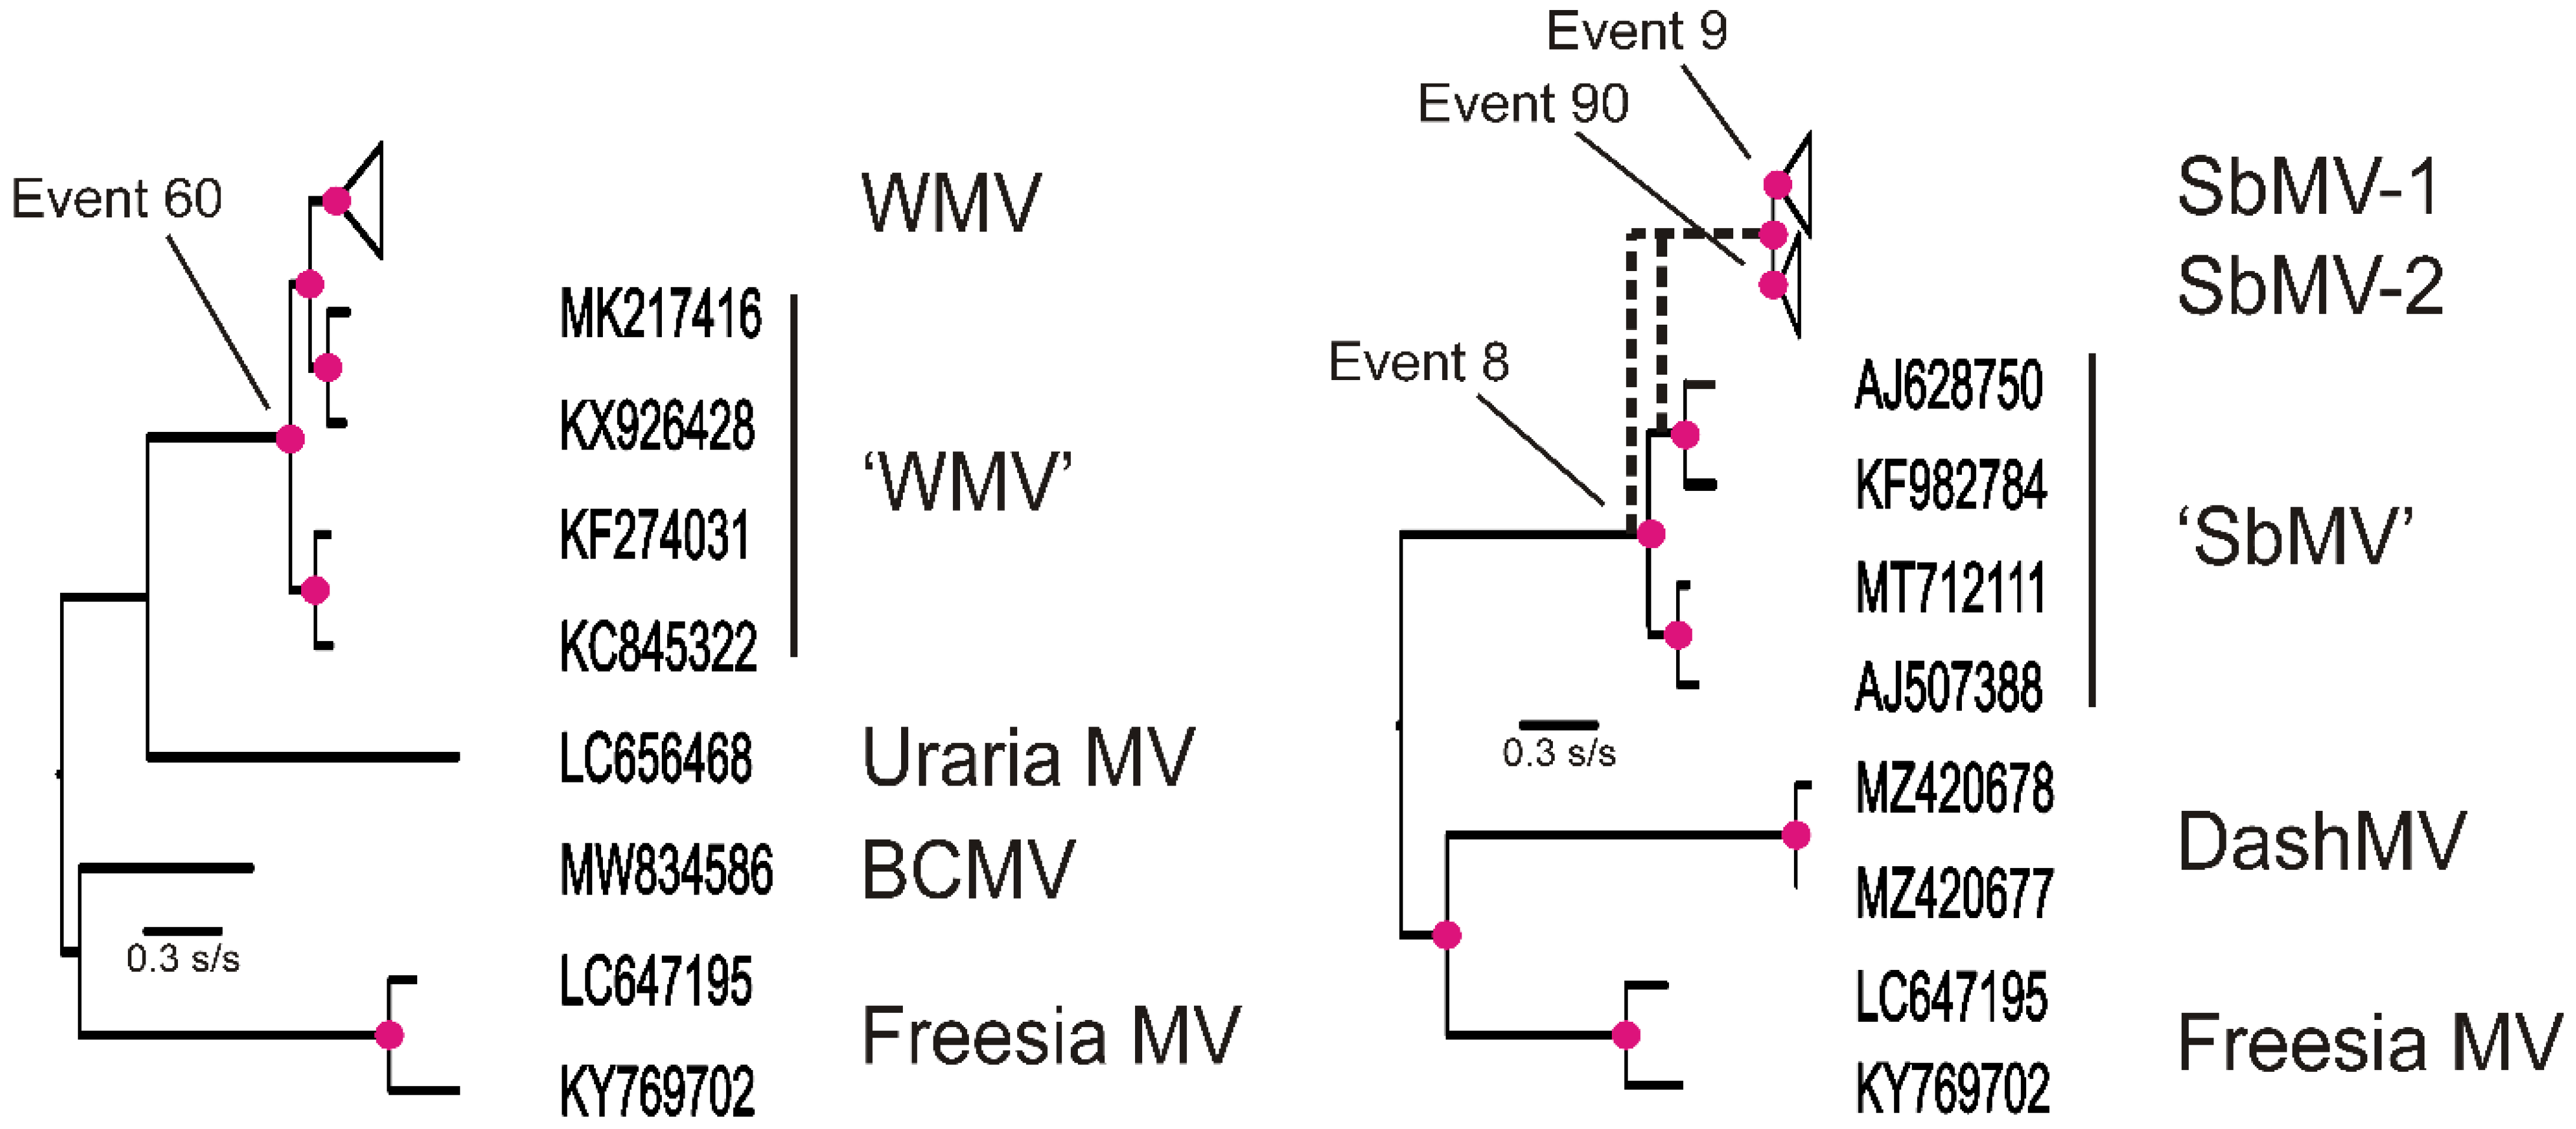
3.2. Recombinants
3.3. Dating
3.4. Population Genetics
4. Discussion
Supplementary Materials
Author Contributions
Funding
Institutional Review Board Statement
Informed Consent Statement
Data Availability Statement
Conflicts of Interest
References
- Jones, R.A.C. Global Plant Virus Disease Pandemics and Epidemics. Plants 2021, 10, 233. [Google Scholar] [CrossRef]
- Nguyen, H.D.; Tomitaka, Y.; Ho, S.Y.W.; Duchêne, S.; Vetten, H.J.; Lesemann, D.; Walsh, J.A.; Gibbs, A.J.; Ohshima, K. Turnip Mosaic Potyvirus Probably First Spread to Eurasian Brassica Crops from Wild Orchids about 1000 Years Ago. PLoS ONE 2013, 8, e55336. [Google Scholar] [CrossRef] [PubMed]
- Smith, K. A Textbook of Plant Virus Diseases, 2nd ed.; J&A Churchill: London, UK, 1957. [Google Scholar]
- Stewart, V.B.; Reddick, D. Bean Mosaic. Phytopathology 1917, 7, 61. [Google Scholar]
- Pierce, W.H. Viruses of the Bean. Phytopathology 1934, 24, 87–115. [Google Scholar]
- Pierce, W.H.; Hungerford, C.W. Symptomatology, Transmission, Infection and Control of Bean Mosaic in Idaho; Research Bulletin 7; Agricultural Experiment Station of the University of Idaho: Moscow, ID, USA, 1929. [Google Scholar]
- Zaumeyer, W.J.; Kearns, C.W. The Relation of Aphids to the Transmission of Bean Mosaic. Phytopathology 1936, 26, 614–629. [Google Scholar]
- Beemster, A.B.R.; van der Want, J.P.H. Serological Investigations of the Phaseolus Viruses 1 and 2. Antonie Leeuwenhoek J. Microbiol. Serol. 1951, 17, 285–296. [Google Scholar] [CrossRef]
- Brandes, J.; Wetter, C. Classification of Elongated Plant Viruses on the Basis of Particle Morphology. Virology 1959, 8, 99–115. [Google Scholar] [CrossRef] [PubMed]
- Brandes, J.; Quantz, L. Elektronenmikroskopische Untersuchungen Des Weißkleevirus Und Des Steinkleevirus. Arch. Mikrobiol. 1957, 26, 369–372. [Google Scholar] [CrossRef]
- Harrison, B.D.; Finch, J.T.; Gibbs, A.J.; Hollings, M.; Shepherd, R.J.; Valenta, V.; Wetter, C. Sixteen Groups of Plant Viruses. Virology 1971, 45, 356–363. [Google Scholar] [CrossRef]
- McKern, N.M.; Ward, C.W.; Shukla, D.D. Strains of Bean Common Mosaic Virus Consist of at Least Two Distinct Potyviruses; Archives of Virology (ARCHIVES SUPPL.); Springer: Berlin/Heidelberg, Germany, 1992; Volume 5, pp. 407–414. [Google Scholar]
- McKern, N.M.; Mink, G.I.; Barnett, O.W.; Mishra, A.; Whittaker, L.A.; Silbernagel, M.J.; Ward, C.W.; Shukla, D.D. Isolates of Bean Common Mosaic Virus Comprising Two Distinct Potyviruses. Phytopathology 1992, 82, 923–929. [Google Scholar] [CrossRef]
- Vetten, H.J.; Lesemann, D.E.; Maiss, E. Serotype A and B Strains of Bean Common Mosaic Virus Are Two Distinct Potyviruses; Archives of Virology (ARCHIVES SUPPL.); Springer: Berlin/Heidelberg, Germany, 1992; Volume 5, pp. 415–431. [Google Scholar]
- Khan, J.A.; Lohuis, D.; Goldbach, R.; Dijkstra, J. Sequence Data to Settle the Taxonomic Position of Bean Common Mosaic Virus and Blackeye Cowpea Mosaic Virus Isolates. J. Gen. Virol. 1993, 74, 2243–2249. [Google Scholar] [CrossRef] [PubMed]
- Dijkstra, J.; Khan, J.A. A Proposal for a Bean Common Mosaic Subgroup of Potyviruses; Archives of Virology (ARCHIVES SUPPL.); Springer: Berlin/Heidelberg, Germany, 1992; Volume 5, pp. 389–395. [Google Scholar]
- Gibbs, A.J.; Trueman, J.W.H.; Gibbs, M.J. The Bean Common Mosaic Virus Lineage of Potyviruses: Where Did It Arise and When? Arch. Virol. 2008, 153, 2177–2187. [Google Scholar] [CrossRef]
- Inoue-Nagata, A.K.; Jordan, R.; Kreuze, J.; Li, F.; López-Moya, J.J.; Mäkinen, K.; Ohshima, K.; Wylie, S.J.; Siddell, S.G.; Lefkowitz, E.J.; et al. ICTV Virus Taxonomy Profile: Potyviridae 2022. J. Gen. Virol. 2022, 103, 001738. [Google Scholar] [CrossRef] [PubMed]
- Revers, F.; García, J.A. Chapter Three—Molecular Biology of Potyviruses. In Advances in Virus Research; Elsevier: Amsterdam, The Netherlands, 2015; Volume 92, pp. 101–199. [Google Scholar]
- Chung, B.Y.W.; Miller, W.A.; Atkins, J.F.; Firth, A.E. An Overlapping Essential Gene in the Potyviridae. Proc. Natl. Acad. Sci. USA 2008, 105, 5897–5902. [Google Scholar] [CrossRef] [PubMed]
- Clark, C.A.; Davis, J.A.; Abad, J.A.; Cuellar, W.J.; Fuentes, S.; Kreuze, J.F.; Gibson, R.W.; Mukasa, S.B.; Tugume, A.K.; Tairo, F.D.; et al. Sweetpotato Viruses: 15 Years of Progress on Understanding and Managing Complex Diseases. Plant Dis. 2012, 96, 168–185. [Google Scholar] [CrossRef]
- Li, F.; Xu, D.; Abad, J.; Li, R. Phylogenetic Relationships of Closely Related Potyviruses Infecting Sweet Potato Determined by Genomic Characterization of Sweet Potato Virus G and Sweet Potato Virus 2. Virus Genes 2012, 45, 118–125. [Google Scholar] [CrossRef]
- Chai, M.; Wu, X.; Liu, J.; Fang, Y.; Luan, Y.; Cui, X.; Zhou, X.; Wang, A.; Cheng, X. P3N-PIPO Interacts with P3 via the Shared N-Terminal Domain to Recruit Viral Replication Vesicles for Cell-to-Cell Movement. J. Virol. 2020, 94, 1110–1128. [Google Scholar] [CrossRef]
- Mingot, A.; Valli, A.; Rodamilans, B.; San León, D.; Baulcombe, D.; García, J.A.; López-Moya, J.J. The P1N-PISPO Trans-Frame Gene of Sweet Potato Feathery Mottle Potyvirus Is Produced during Virus Infection and Functions as an RNA Silencing Suppressor. J. Virol. 2016, 90, 3543–3557. [Google Scholar] [CrossRef]
- Untiveros, M.; Olspert, A.; Artola, K.; Firth, A.E.; Kreuze, J.F.; Valkonen, J.P.T. A Novel Sweet Potato Potyvirus Open Reading Frame (ORF) Is Expressed via Polymerase Slippage and Suppresses RNA Silencing. Mol. Plant Pathol. 2016, 17, 1111–1123. [Google Scholar] [CrossRef] [PubMed]
- Vijayapalani, P.; Maeshima, M.; Nagasaki-Takekuchi, N.; Miller, W.A. Interaction of the Trans-Frame Potyvirus Protein P3N-PIPO with Host Protein PCaP1 Facilitates Potyvirus Movement. PLoS Pathog. 2012, 8, e1002639. [Google Scholar] [CrossRef] [PubMed]
- Wen, R.H.; Hajimorad, M.R. Mutational Analysis of the Putative Pipo of Soybean Mosaic Virus Suggests Disruption of PIPO Protein Impedes Movement. Virology 2010, 400, 1–7. [Google Scholar] [CrossRef] [PubMed]
- Gibbs, A.J.; Hajizadeh, M.; Ohshima, K.; Jones, R.A.C. The Potyviruses: An Evolutionary Synthesis Is Emerging. Viruses 2020, 12, 132. [Google Scholar] [CrossRef]
- Hall, T.A. BioEdit: A User-Friendly Biological Sequence Alignment Editor and Analysis Program for Windows 95/98/NT. Nucleic Acids Symp. Ser. 1999, 41, 95–98. [Google Scholar]
- Katoh, K.; Rozewicki, J.; Yamada, K.D. MAFFT Online Service: Multiple Sequence Alignment, Interactive Sequence Choice and Visualization. Brief. Bioinform. 2018, 20, 1160–1166. [Google Scholar] [CrossRef] [PubMed]
- Suyama, M.; Torrents, D.; Bork, P. PAL2NAL: Robust Conversion of Protein Sequence Alignments into the Corresponding Codon Alignments. Nucleic Acids Res. 2006, 34, 609–612. [Google Scholar] [CrossRef] [PubMed]
- Martin, D.P.; Varsani, A.; Roumagnac, P.; Botha, G.; Maslamoney, S.; Schwab, T.; Kelz, Z.; Kumar, V.; Murrell, B. RDP5: A Computer Program for Analyzing Recombination in, and Removing Signals of Recombination from, Nucleotide Sequence Datasets. Virus Evol. 2020, 7, veaa087. [Google Scholar] [CrossRef]
- Ben Mansour, K.; Gibbs, A.J.; Komínková, M.; Komínek, P.; Brožová, J.; Kazda, J.; Zouhar, M.; Ryšánek, P. Watermelon Mosaic Virus in the Czech Republic, Its Recent and Historical Origins. Plant Pathol. 2023, 72, 1528–1538. [Google Scholar] [CrossRef]
- Shokri, S.; Shujaei, K.; Gibbs, A.J.; Hajizadeh, M. Evolution and Biogeography of Apple Stem Grooving Virus. Virol. J. 2023, 20, 105. [Google Scholar] [CrossRef]
- Jeanmougin, F.; Thompson, J.D.; Gouy, M.; Higgins, D.G.; Gibson, T.J. Multiple Sequence Alignment with Clustal, X. Trends Biochem. Sci. 1998, 23, 403–405. [Google Scholar] [CrossRef]
- Tamura, K.; Stecher, G.; Kumar, S. MEGA11: Molecular Evolutionary Genetics Analysis Version 11. Mol. Biol. Evol. 2021, 38, 3022–3027. [Google Scholar] [CrossRef]
- Minh, B.Q.; Schmidt, H.A.; Chernomor, O.; Schrempf, D.; Woodhams, M.D.; Von Haeseler, A.; Lanfear, R.; Teeling, E. IQ-TREE 2: New Models and Efficient Methods for Phylogenetic Inference in the Genomic Era. Mol. Biol. Evol. 2020, 37, 1530–1534. [Google Scholar] [CrossRef]
- Shimodaira, H.; Hasegawa, M. Multiple Comparisons of Log-Likelihoods with Applications to Phylogenetic Inference. Mol. Biol. Evol. 1999, 16, 1114–1116. [Google Scholar] [CrossRef]
- Fourment, M.; Gibbs, M.J. PATRISTIC: A Program for Calculating Patristic Distances and Graphically Comparing the Components of Genetic Change. BMC Evol. Biol. 2006, 6, 1. [Google Scholar] [CrossRef] [PubMed]
- Librado, P.; Rozas, J. DnaSP v5: A Software for Comprehensive Analysis of DNA Polymorphism Data. Bioinformatics 2009, 25, 1451–1452. [Google Scholar] [CrossRef]
- Murrell, B.; Moola, S.; Mabona, A.; Weighill, T.; Sheward, D.; Kosakovsky Pond, S.L.; Scheffler, K. FUBAR: A Fast, Unconstrained Bayesian AppRoximation for Inferring Selection. Mol. Biol. Evol. 2013, 30, 1196–1205. [Google Scholar] [CrossRef]
- Abramson, J.; Adler, J.; Dunger, J.; Evans, R.; Green, T.; Pritzel, A.; Ronneberger, O.; Willmore, L.; Ballard, A.J.; Bambrick, J.; et al. Accurate Structure Prediction of Biomolecular Interactions with AlphaFold 3. Nature 2024, 630, 493–500. [Google Scholar] [CrossRef] [PubMed]
- Gasteiger, E.; Hoogland, C.; Gattiker, A.; Duvaud, S.; Wilkins, M.R.; Appel, R.D.; Bairoch, A. The Proteomics Protocols Handbook; Springer Protocols Handbooks; Springer: Berlin/Heidelberg, Germany, 2005. [Google Scholar]
- Acosta-Leal, R.; Duffy, S.; Xiong, Z.; Hammond, R.W.; Elena, S.F. Advances in Plant Virus Evolution: Translating Evolutionary Insights into Better Disease Management. Phytopathology 2011, 101, 1136–1148. [Google Scholar] [CrossRef]
- Pérez-losada, M.; Arenas, M.; Galán, J.C.; Palero, F.; González-Candelas, F. Recombination in Viruses: Mechanisms, Methods of Study, and Evolutionary Consequences. Infect. Genet. Evol. 2015, 30, 296–307. [Google Scholar] [CrossRef]
- Jaya, F.R.; Brito, B.P.; Darling, A.E. Evaluation of Recombination Detection Methods for Viral Sequencing. Virus Evol. 2023, 9, vead066. [Google Scholar] [CrossRef]
- Mohammadi, M.; Gibbs, A.J.; Hosseini, A.; Hosseini, S. An Iranian Genomic Sequence of Beet Mosaic Virus Provides Insights into Diversity and Evolution of the World Population. Virus Genes 2018, 54, 272–279. [Google Scholar] [CrossRef]
- Hajizadeh, M.; Gibbs, A.J.; Amirnia, F.; Glasa, M. The Global Phylogeny of Plum Pox Virus Is Emerging. J. Gen. Virol. 2019, 100, 1457–1468. [Google Scholar] [CrossRef] [PubMed]
- Ohshima, K.; Tomitaka, Y.; Wood, J.T.; Minematsu, Y.; Kajiyama, H.; Tomimura, K.; Gibbs, A.J. Patterns of Recombination in Turnip Mosaic Virus Genomic Sequences Indicate Hotspots of Recombination. J. Gen. Virol. 2007, 88, 298–315. [Google Scholar] [CrossRef] [PubMed]
- Kawakubo, S.; Tomitaka, Y.; Tomimura, K.; Koga, R.; Matsuoka, H.; Uematsu, S.; Yamashita, K.; Ho, S.Y.W.; Ohshima, K. The Recombinogenic History of Turnip Mosaic Potyvirus Reveals Its Introduction to Japan in the 19th Century. Virus Evol. 2022, 8, veac060. [Google Scholar] [CrossRef] [PubMed]
- Gibbs, A.J.; Ohshima, K. Potyviruses and the Digital Revolution. Annu. Rev. Phytopathol. 2010, 48, 205–223. [Google Scholar] [CrossRef] [PubMed]
- Abadkhah, M.; Hajizadeh, M.; Koolivand, D. Global population genetic structure of Bean common mosaic virus. Arch. Phytopathol. Plant Prot. 2020, 53, 266–281. [Google Scholar] [CrossRef]
- Eckshtain-Levi, N.; Weisberg, A.J.; Vinatzer, B.A. The Population Genetic Test Tajima’s D Identifies Genes Encoding Pathogen-Associated Molecular Patterns and Other Virulence-Related Genes in Ralstonia Solanacearum. Mol. Plant Pathol. 2018, 19, 2187–2192. [Google Scholar] [CrossRef]
- Xue, M.; Arvy, N.; German-Retana, S. The Mystery Remains: How Do Potyviruses Move within and between Cells? Mol. Plant Pathol. 2023, 24, 1560–1574. [Google Scholar] [CrossRef]
- Cui, X.; Yaghmaiean, H.; Wu, G.; Wu, X.; Chen, X.; Thorn, G.; Wang, A. The C-Terminal Region of the Turnip Mosaic Virus P3 Protein Is Essential for Viral Infection via Targeting P3 to the Viral Replication Complex. Virology 2017, 510, 147–155. [Google Scholar] [CrossRef]
- Kärblane, K.; Firth, A.E.; Olspert, A. Turnip Mosaic Virus Transcriptional Slippage Dynamics and Distribution in RNA Subpopulations. Mol. Plant-Microbe Interact. 2022, 35, 835–844. [Google Scholar] [CrossRef]
- Xu, J.; Zhang, Y. How Significant Is a Protein Structure Similarity with TM-Score = 0.5? Bioinformatics 2010, 26, 889–895. [Google Scholar] [CrossRef]
- Herniter, I.A.; Muñoz-Amatriaín, M.; Close, T.J. Genetic, Textual, and Archeological Evidence of the Historical Global Spread of Cowpea (Vigna Unguiculata [L.] Walp.). Legume Sci. 2020, 2, e57. [Google Scholar] [CrossRef]
- Loy, H.; Spriggs, M.; Wickler, S. Direct Eveidence for Human Use of Plants 28,000 Years Ago: Starch Residues on Stone Artefacts from the Northern Solomon Islands. Antiquity 1992, 66, 898–912. [Google Scholar] [CrossRef]
- Chaïr, H.; Traore, R.E.; Duval, M.F.; Rivallan, R.; Mukherjee, A.; Aboagye, L.M.; Van Rensburg, W.J.; Andrianavalona, V.; De Pinheiro Carvalho, M.A.A.; Saborio, F.; et al. Genetic Diversification and Dispersal of Taro (Colocasia Esculenta (l.) Schott). PLoS ONE 2016, 11, e0157712. [Google Scholar] [CrossRef]
- Kreike, C.M.; Van Eck, H.J.; Lebot, V. Genetic Diversity of Taro, Colocasia Esculenta (L.) Schott, in Southeast Asia and the Pacific. Theor. Appl. Genet. 2004, 109, 761–768. [Google Scholar] [CrossRef]
- Piperno, D.R. The Origins of Plant Cultivation and Domestication in the New World Tropics Patterns, Process, and New Developments. Curr. Anthropol. 2011, 52, S453–S470. [Google Scholar] [CrossRef]
- Jones, R.A.C. Disease Pandemics and Major Epidemics Arising from New Encounters between Indigenous Viruses and Introduced Crops. Viruses 2020, 12, 1388. [Google Scholar] [CrossRef] [PubMed]
- Salvaggio, J.E. Fauna, Flora, Fowl, and Fruit: Effects of the Columbian Exchange on the Allergic Response of New and Old World Inhabitants. Allergy Proc. 1992, 13, 335–344. [Google Scholar] [CrossRef]
- Phaseolus Vulgaris. 2024. Available online: https://en.wikipedia.org/wiki/phaseolus_vulgaris (accessed on 30 June 2024).
- Ho, S.Y.; Lanfear, R.; Bromham, L.; Phillips, M.J.; Soubrier, J.; Rodrigo, A.G.; Cooper, A. Time-dependent rates of molecular evolution. Mol Ecol. 2011, 20, 3087–3101. [Google Scholar] [CrossRef]
- Maina, S.; Coutts, B.A.; Edwards, O.R.; de Almeida, L.; Kehoe, M.A.; Ximenes, A.; Jones, R.A.C. Zucchini Yellow Mosaic Virus Populations from East Timorese and Northern Australian Cucurbit Crops: Molecular Properties, Genetic Connectivity, and Biosecurity Implications. Plant Dis. 2017, 101, 1236–1245. [Google Scholar] [CrossRef]
- Maina, S.; Barbetti, M.J.; Edwards, O.R.; Minemba, D.; Areke, M.W.; Jones, R.A.C. Zucchini Yellow Mosaic Virus Genomic Sequences from Papua New Guinea: Lack of Genetic Connectivity with Northern Australian or East Timorese Genomes, and New Recombination Findings. Plant Dis. 2019, 103, 1326–1336. [Google Scholar] [CrossRef]
- Peters, D.; Matsumura, E.E.; van Vredendaal, P.; van der Vlugt, R.A.A. The plant virus transmissions database. J. Gen. Virol. 2024, 105, 001957. [Google Scholar] [CrossRef] [PubMed]
- Bujarski, J.J. Genetic Recombination in Plant-Infecting Messenger-Sense RNA Viruses: Overview and Research Perspectives. Front. Plant Sci. 2013, 4, 42516. [Google Scholar] [CrossRef]
- Simon-Loriere, E.; Holmes, E.C. Why Do RNA Viruses Recombine? Nat. Rev. Microbiol. 2011, 9, 617–626. [Google Scholar] [CrossRef] [PubMed]
- Wylie, S.J.; Jones, R.A.C. Role of Recombination in the Evolution of Host Specialization within Bean Yellow Mosaic Virus. Phytopathology 2009, 99, 512–518. [Google Scholar] [CrossRef]
- Gibbs, A.J.; Ohshima, K.; Yasaka, R.; Mohammadi, M.; Gibbs, M.J.; Jones, R.A.C. The Phylogenetics of the Global Population of Potato Virus y and Its Necrogenic Recombinants. Virus Evol. 2017, 3, vex002. [Google Scholar] [CrossRef] [PubMed]
- Moreno, I.M.; Malpica, J.M.; Díaz-Pendón, J.A.; Moriones, E.; Fraile, A.; García-Arenal, F. Variability and Genetic Structure of the Population of Watermelon Mosaic Virus Infecting Melon in Spain. Virology 2004, 318, 451–460. [Google Scholar] [CrossRef]
- Desbiez, C.; Lecoq, H. The Nucleotide Sequence of Watermelon Mosaic Virus (WMV, Potyvirus) Reveals Interspecific Recombination between Two Related Potyviruses in the 5′ Part of the Genome. Arch. Virol. 2004, 149, 1619–1632. [Google Scholar] [CrossRef]
- Zuntini, A.R.; Carruthers, T.; Maurin, O.; Bailey, P.C.; Leempoel, K.; Brewer, G.E.; Epitawalage, N.; Françoso, E.; Gallego-Paramo, B.; McGinnie, C.; et al. Phylogenomics and the Rise of the Angiosperms. Nature 2024, 629, 843–850. [Google Scholar] [CrossRef]
- Morozov, S.Y.; Solovyev, A.G. Small hydrophobic viral proteins involved in intercellular movement of diverse plant virus genomes. AIMS Microbiol. 2020, 6, 305–329. [Google Scholar] [CrossRef]
- Pasin, F.; Daròs, J.-A.; Tzanetakis, I.E. Proteome expansion in the Potyviridae evolutionary radiation. FEMS Microbiol. Rev. 2022, 46, fuac011. [Google Scholar] [CrossRef]
- Qin, L.; Liu, H.; Liu, P.; Jiang, L.; Cheng, X.; Li, F.; Shen, W.; Qiu, W.; Dai, Z.; Cui, H. Rubisco small subunit (RbCS) is coopted by potyvirids as the scaffold protein in assembling a complex for viral intercellular movement. PLoS Pathog. 2024, 20, e1012064. [Google Scholar] [CrossRef] [PubMed]


| Virus | Number of Sequences | Nucleotide Diversity | Number of Segregating Sites | Tajima’s D | dN/dS |
|---|---|---|---|---|---|
| BCMNV-all | 32 | 0.244 | 5529 | 2.297 * | 0.221 |
| BCMNV-crop | 17 | 0.069 | 1803 | 0.674 ns | 0.089 |
| BCMNV-outgroup | 15 | 0.299 | 5472 | 2.678 ** | 0.237 |
| BCMV-all | 60 | 0.194 | 5689 | 1.593 ns | 0.185 |
| BCMV-crop | 45 | 0.114 | 4499 | 0.104 ns | 0.106 |
| BCMV-outgroup | 15 | 0.287 | 5419 | 2.501 ** | 0.221 |
| CpAbMV-all | 23 | 0.294 | 5455 | 3.252 *** | 0.233 |
| CpAbMV-crop | 8 | 0.212 | 4311 | 1.092 ns | 0.137 |
| CpAbMV-outgroup | 15 | 0.290 | 5344 | 2.616 ** | 0.229 |
| DashMV-all | 26 | 0.311 | 5780 | 3.442 *** | 0.261 |
| DashMV-crop | 11 | 0.306 | 5386 | 2.516 ** | 0.264 |
| DashMV-outgroup | 15 | 0.311 | 5623 | 2.807 ** | 0.261 |
| EAPV-all | 43 | 0.195 | 5378 | 1.553 ns | 0.217 |
| EAPV-crop | 28 | 0.054 | 2880 | −1.155 ns | 0.163 |
| EAPV- outgroup | 15 | 0.269 | 5147 | 2.387 * | 0.199 |
| PeMoV-all | 30 | 0.304 | 6248 | 2.632 ** | 0.362 |
| PeMoV-crop | 15 | 0.020 | 1231 | −2.273 ** | 0.081 |
| PeMoV-outgroup | 15 | 0.379 | 6201 | 3.273 *** | 0.370 |
| ZYMV-all | 90 | 0.176 | 5727 | 1.371 ns | 0.189 |
| ZYMV-crop | 75 | 0.095 | 3564 | 0.669 ns | 0.072 |
| ZYMV-outgroup | 15 | 0.286 | 5315 | 2.624 ** | 0.238 |
Disclaimer/Publisher’s Note: The statements, opinions and data contained in all publications are solely those of the individual author(s) and contributor(s) and not of MDPI and/or the editor(s). MDPI and/or the editor(s) disclaim responsibility for any injury to people or property resulting from any ideas, methods, instructions or products referred to in the content. |
© 2024 by the authors. Licensee MDPI, Basel, Switzerland. This article is an open access article distributed under the terms and conditions of the Creative Commons Attribution (CC BY) license (https://creativecommons.org/licenses/by/4.0/).
Share and Cite
Hajizadeh, M.; Ben Mansour, K.; Gibbs, A.J. A Genetic Study of Spillovers in the Bean Common Mosaic Subgroup of Potyviruses. Viruses 2024, 16, 1351. https://doi.org/10.3390/v16091351
Hajizadeh M, Ben Mansour K, Gibbs AJ. A Genetic Study of Spillovers in the Bean Common Mosaic Subgroup of Potyviruses. Viruses. 2024; 16(9):1351. https://doi.org/10.3390/v16091351
Chicago/Turabian StyleHajizadeh, Mohammad, Karima Ben Mansour, and Adrian J. Gibbs. 2024. "A Genetic Study of Spillovers in the Bean Common Mosaic Subgroup of Potyviruses" Viruses 16, no. 9: 1351. https://doi.org/10.3390/v16091351
APA StyleHajizadeh, M., Ben Mansour, K., & Gibbs, A. J. (2024). A Genetic Study of Spillovers in the Bean Common Mosaic Subgroup of Potyviruses. Viruses, 16(9), 1351. https://doi.org/10.3390/v16091351