
SARS-CoV-2 N-Antigen Quantification in Respiratory Tract, Plasma and Urine: Kinetics and Association with RT-qPCR Results

 , and
, and
Abstract
1. Introduction
2. Materials and Methods
2.1. Patients and Samples
2.2. RT-PCR Assay
2.3. N-Antigen Detection
2.4. Statistics and Software
3. Results
4. Discussion
Supplementary Materials
Author Contributions
Funding
Institutional Review Board Statement
Informed Consent Statement
Data Availability Statement
Acknowledgments
Conflicts of Interest
References
- Li, Q.; Guan, X.; Wu, P.; Wang, X.; Zhou, L.; Tong, Y.; Ren, R.; Leung, K.S.; Lau, E.H.; Wong, J.Y.; et al. Early Transmission Dynamics in Wuhan, China, of Novel Coronavirus-Infected Pneumonia. N. Engl. J. Med. 2020, 382, 1199–1207. [Google Scholar] [CrossRef] [PubMed]
- Yu, C.Y.; Chan, K.G.; Yean, C.Y.; Ang, G.Y. Nucleic Acid-Based Diagnostic Tests for the Detection SARS-CoV-2: An Update. Diagnostics 2021, 11, 53. [Google Scholar] [CrossRef] [PubMed]
- Wang, W.; Xu, Y.; Gao, R.; Lu, R.; Han, K.; Wu, G.; Tan, W. Detection of SARS-CoV-2 in Different Types of Clinical Specimens. JAMA 2020, 323, 1843–1844. [Google Scholar] [CrossRef] [PubMed]
- Dinnes, J.; Deeks, J.J.; Adriano, A.; Berhane, S.; Davenport, C.; Dittrich, S.; Emperador, D.; Takwoingi, Y.; Cunningham, J.; Beese, S.; et al. Rapid, point-of-care antigen and molecular-based tests for diagnosis of SARS-CoV-2 infection. Cochrane Database Syst. Rev. 2020, 8, CD013705. [Google Scholar] [PubMed]
- Yamayoshi, S.; Sakai-Tagawa, Y.; Koga, M.; Akasaka, O.; Nakachi, I.; Koh, H.; Maeda, K.; Adachi, E.; Saito, M.; Nagai, H.; et al. Comparison of Rapid Antigen Tests for COVID-19. Viruses 2020, 12, 1420. [Google Scholar] [CrossRef] [PubMed]
- Sberna, G.; Basile, F.; Guarino, M.L.; Capobianchi, M.R.; Bordi, L.; Parisi, G. Comparison of AllplexTM SARS-CoV-2 Assay, Easy SARS-CoV-2 WE and Lumipulse quantitative SARS-CoV-2 antigen test performance using automated systems for the diagnosis of COVID-19. Int. J. Infect. Dis. 2021, 113, 113–115. [Google Scholar] [CrossRef] [PubMed]
- Coltella, L.; Ranno, S.; Piccioni, L.; Linardos, G.; Colagrossi, L.; Agosta, M.; Russo, C.; Concato, C.; Campana, A.; Muda, A.O.; et al. Quantitative SARS-CoV-2 antigen test as a tool able to predict the stage of the infection. J. Infect. 2022, 84, 418–467. [Google Scholar] [CrossRef] [PubMed]
- Veyrenche, N.; Pisoni, A.; Debiesse, S.; Bollore, K.; Bedin, A.S.; Makinson, A.; Niel, C.; Alcocer-Cordellat, C.; Mondain, A.M.; Le Moing, V.; et al. Severe Acute Respiratory Syndrome Coronavirus 2 Nucleocapsid Antigen in Urine of Hospitalized Patients with Coronavirus Disease 2019. J. Infect. Dis. 2022, 226, 812–821. [Google Scholar] [CrossRef] [PubMed]
- Wang, H.; Hogan, C.A.; Verghese, M.; Solis, D.; Sibai, M.; Huang, C.; Röltgen, K.; Stevens, B.A.; Yamamoto, F.; Sahoo, M.K.; et al. SARS-CoV-2 Nucleocapsid Plasma Antigen for Diagnosis and Monitoring of COVID-19. Clin. Chem. 2021, 68, 204–213. [Google Scholar] [CrossRef] [PubMed]
- Le Hingrat, Q.; Visseaux, B.; Laouenan, C.; Tubiana, S.; Bouadma, L.; Yazdanpanah, Y.; Duval, X.; Burdet, C.; Ichou, H.; Damond, F.; et al. Detection of SARS-CoV-2 N-antigen in blood during acute COVID-19 provides a sensitive new marker and new testing alternatives. Clin. Microbiol. Infect. 2020, 27, 789.e1–789.e5. [Google Scholar] [CrossRef] [PubMed]
- Etievant, S.; Bal, A.; Escuret, V.; Brengel-Pesce, K.; Bouscambert, M.; Cheynet, V.; Generenaz, L.; Oriol, G.; Destras, G.; Billaud, G.; et al. Performance Assessment of SARS-CoV-2 PCR Assays Developed by WHO Referral Laboratories. J. Clin. Med. 2020, 9, 1871. [Google Scholar] [CrossRef] [PubMed]
- ACTIV-3/TICO Study Group; Rogers, A.J.; Wentworth, D.; Phillips, A.; Shaw-Saliba, K.; Dewar, R.L.; Aggarwal, N.R.; Babiker, A.G.; Chang, W.; Dharan, N.J.; et al. The Association of Baseline Plasma SARS-CoV-2 Nucleocapsid Antigen Level and Outcomes in Patients Hospitalized with COVID-19. Ann. Intern. Med. 2022, 175, 1401–1410. [Google Scholar] [PubMed]
- Wick, K.D.; Leligdowicz, A.; Willmore, A.; Carrillo, S.A.; Ghale, R.; Jauregui, A.; Chak, S.S.; Nguyen, V.; Lee, D.; Jones, C.; et al. Plasma SARS-CoV-2 nucleocapsid antigen levels are associated with progression to severe disease in hospitalized COVID-19. Crit. Care 2022, 26, 278. [Google Scholar] [CrossRef] [PubMed]
- Bwire, G.M.; Majigo, M.V.; Njiro, B.J.; Mawazo, A. Detection profile of SARS-CoV-2 using RT-PCR in different types of clinical specimens: A systematic review and meta-analysis. J. Med. Virol. 2020, 93, 719–725. [Google Scholar] [CrossRef] [PubMed]
- Chuansumrit, A.; Chaiyaratana, W.; Tangnararatchakit, K.; Yoksan, S.; Flamand, M.; Sakuntabhai, A. Dengue nonstructural protein 1 antigen in the urine as a rapid and convenient diagnostic test during the febrile stage in patients with dengue infection. Diagn. Microbiol. Infect. Dis. 2011, 71, 467–469. [Google Scholar] [CrossRef] [PubMed]
- Humaidi, M.; Tien, W.P.; Yap, G.; Chua, C.R.; Ng, L.C. Non-Invasive Dengue Diagnostics—The Use of Saliva and Urine for Different Stages of the Illness. Diagnostics 2021, 11, 1345. [Google Scholar] [CrossRef] [PubMed]
- Andreo, F.; Domínguez, J.; Ruiz, J.; Blanco, S.; Arellano, E.; Prat, C.; Morera, J.; Ausina, V. Impact of rapid urine antigen tests to determine the etiology of community-acquired pneumonia in adults. Respir. Med. 2006, 100, 884–891. [Google Scholar] [CrossRef] [PubMed]


| Plasma samples | N | D1, N = 3 1 | D3, N = 15 1 | D9, N = 18 1 | D13, N = 15 1 | D21, N = 9 1 |
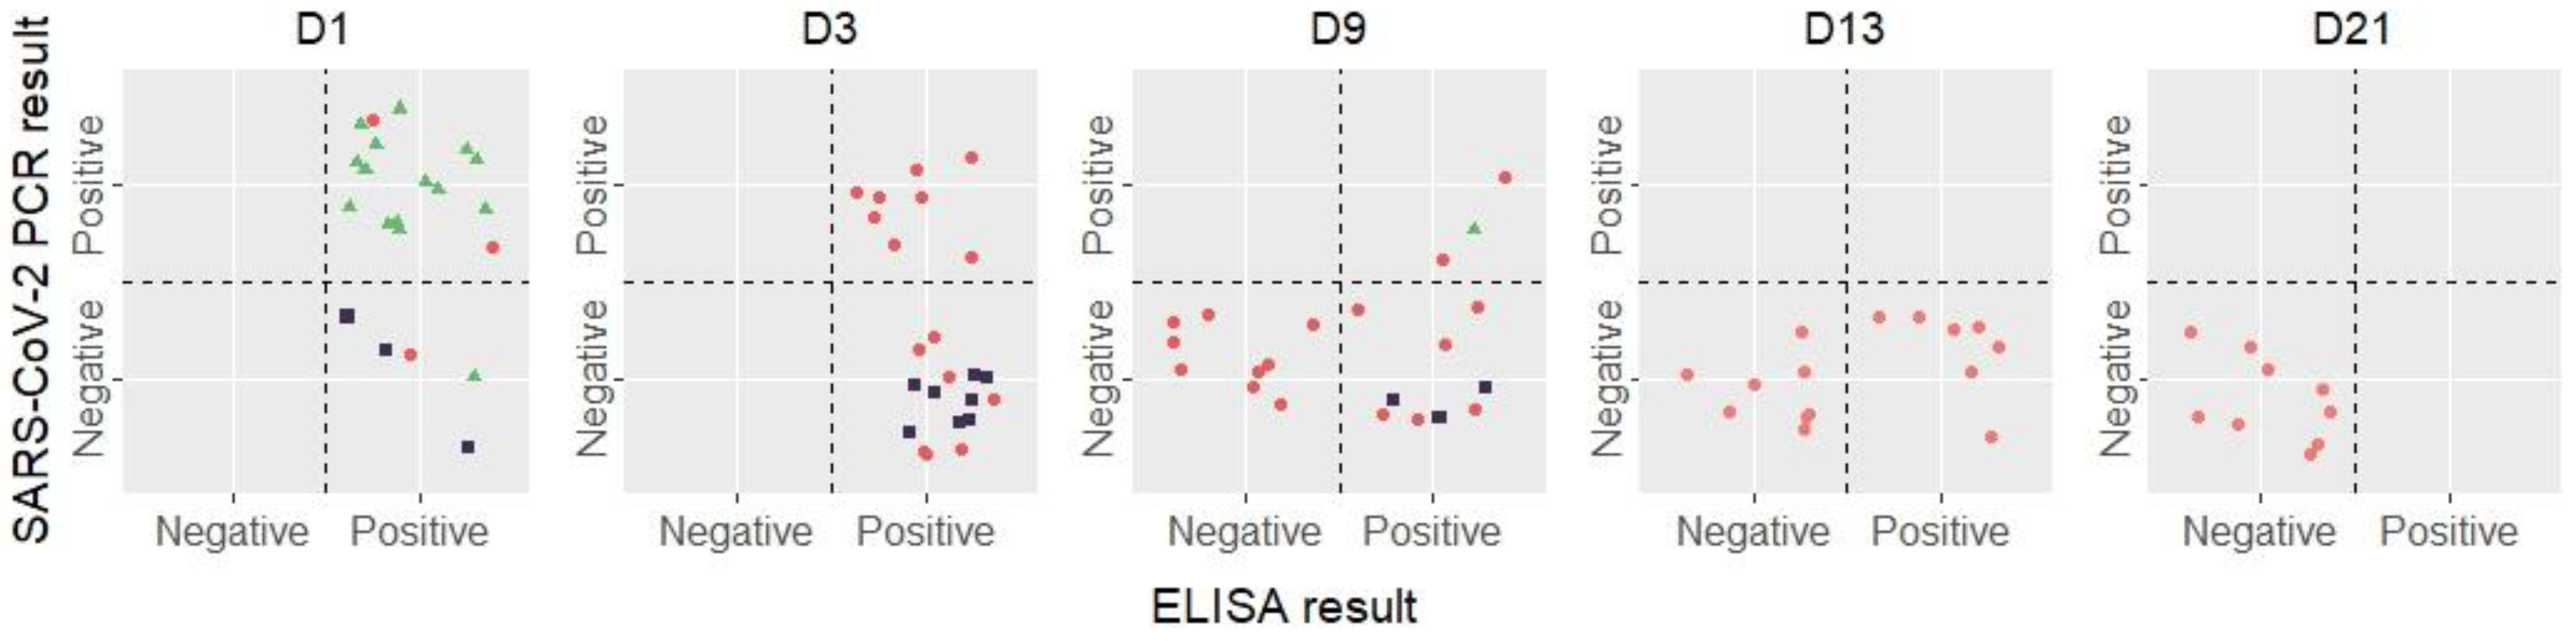
| Positive RT-PCR | 60 | 2 (67%) | 8 (53%) | 2 (11%) | 0 (0%) | 0 (0%) |
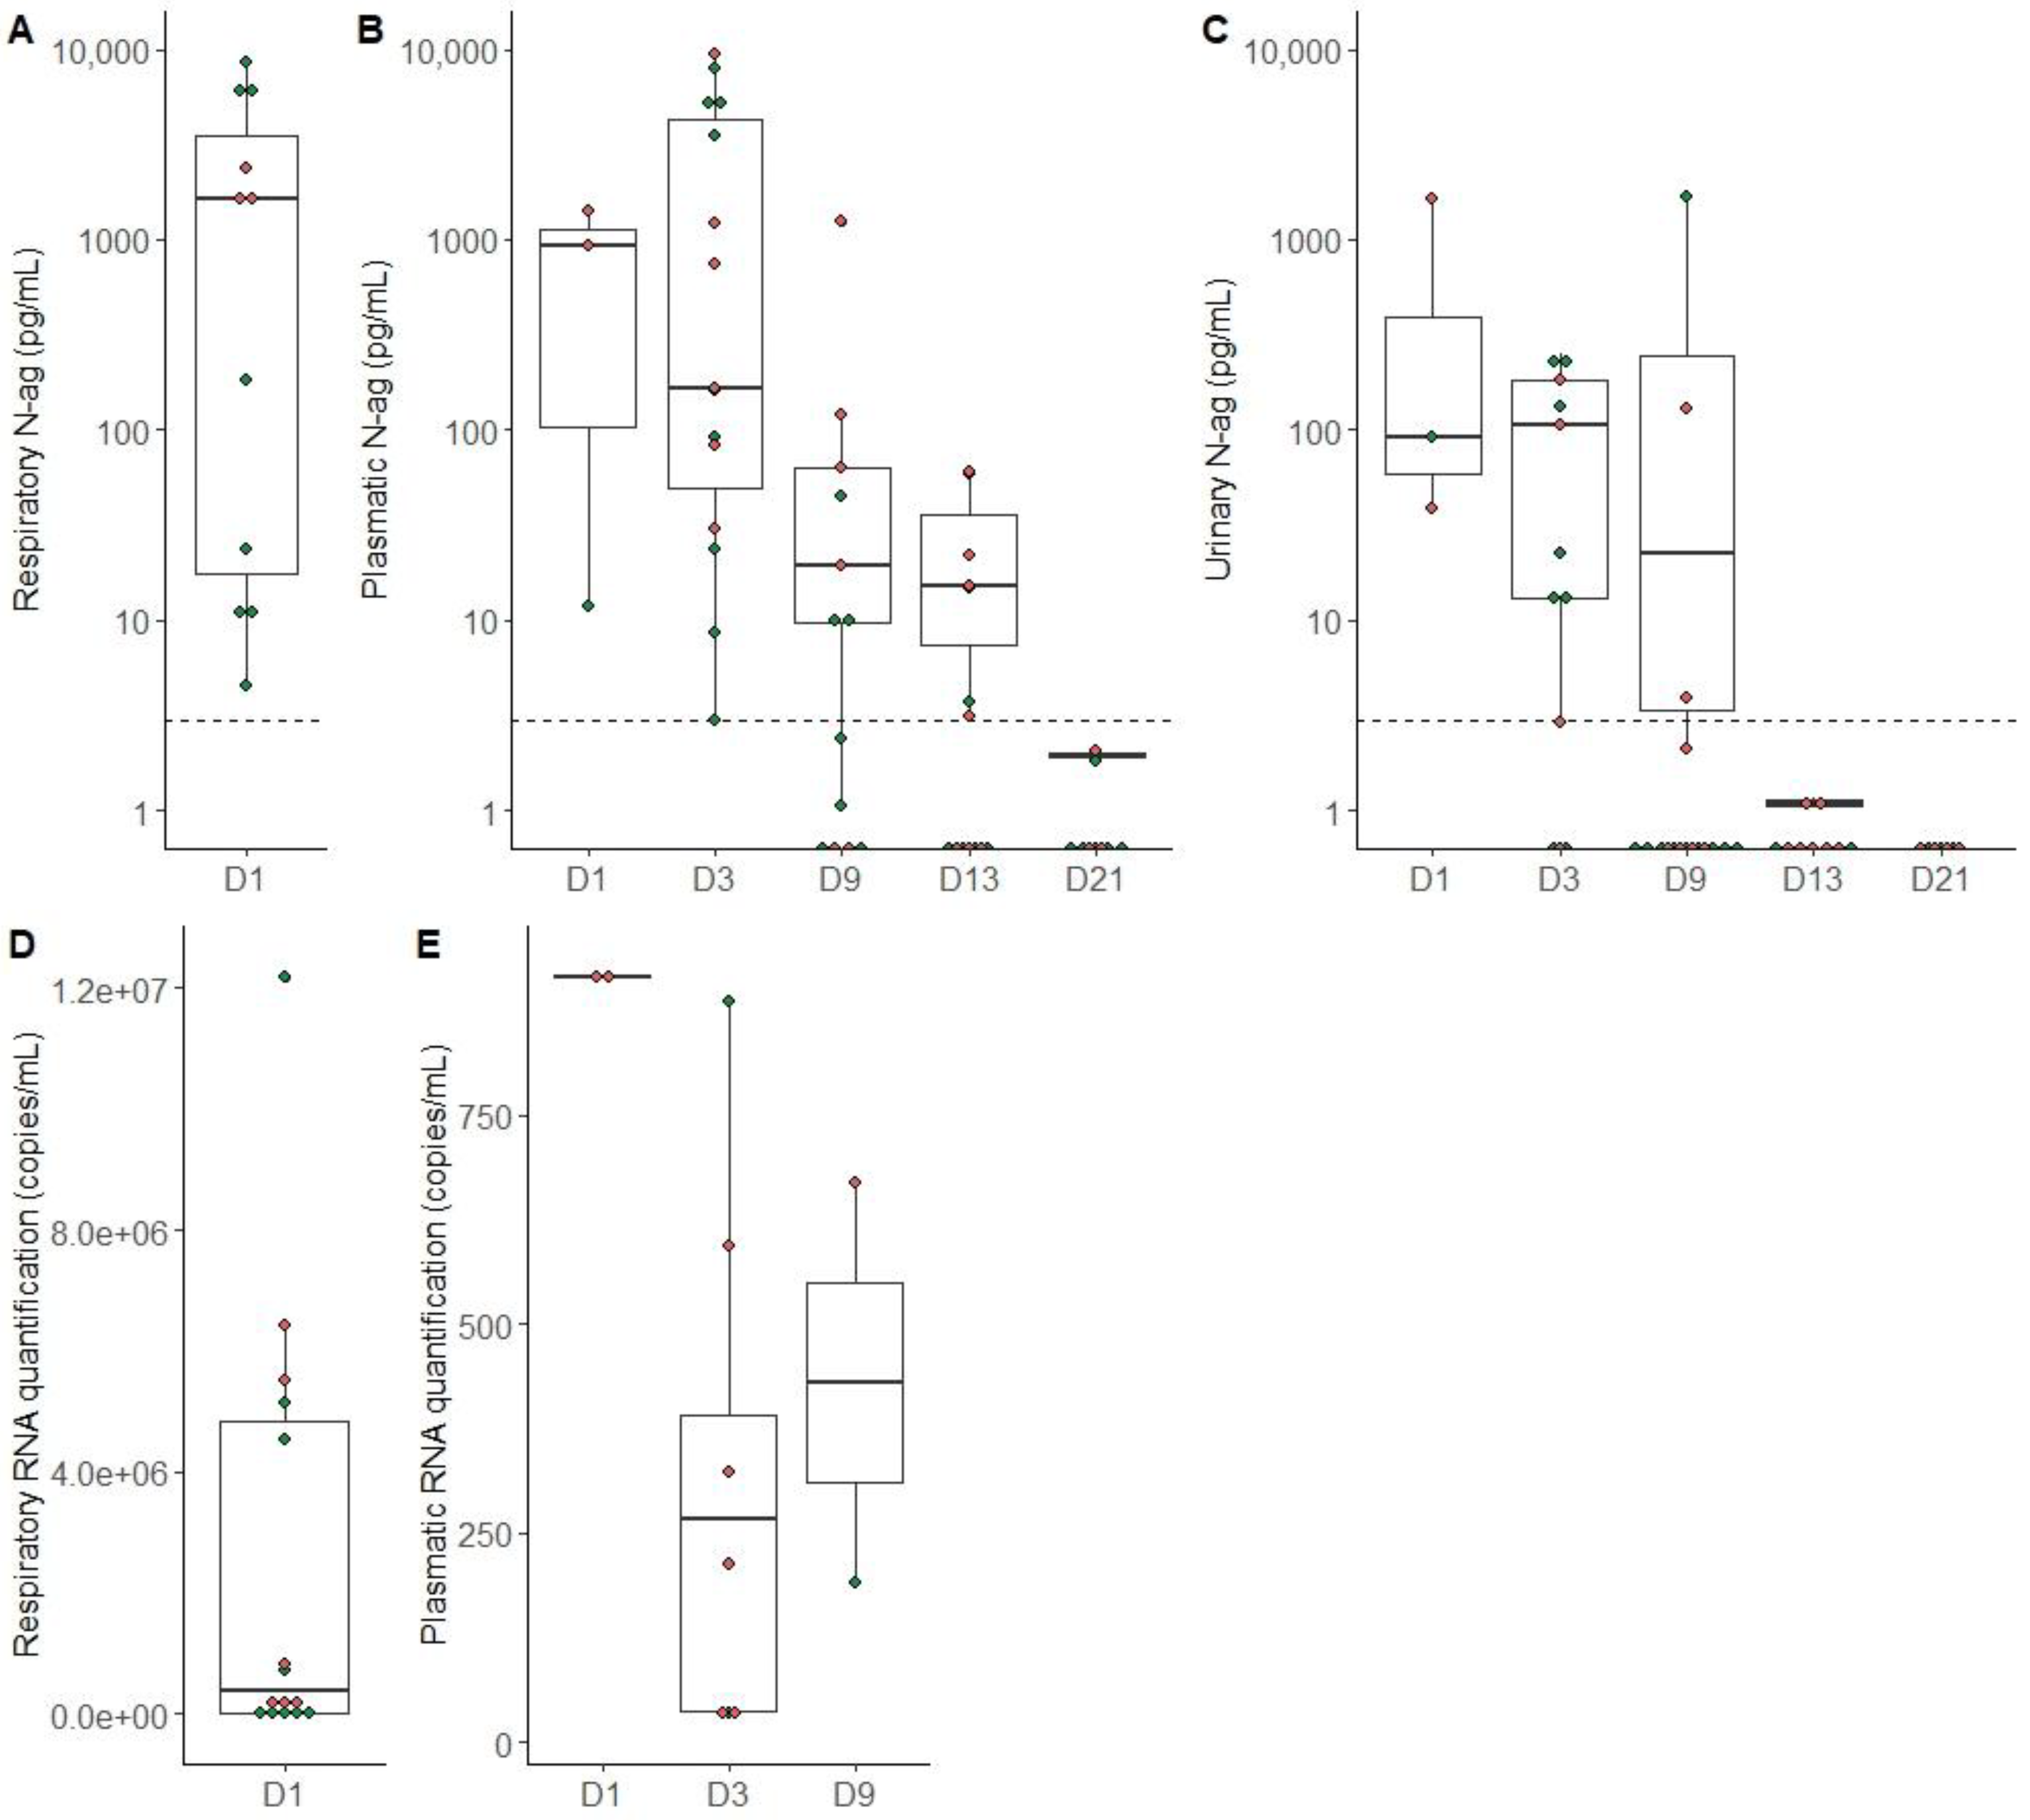
| RNA (copies/mL) | 12 | 916 [916; 917] | 267 [0; 886] | 95 [0; 190] | NA | NA |
| Positive ELISA | 59 | 3 (100%) | 15 (100%) | 8 (47%) | 7 (47%) | 0 (0%) |
| Antigen quantification (pg/mL) | 59 | 919 [12; 1412] | 165 [3; 9392] | 2 [0; 11,108] | 2 [0; 61] | 0 [0; 2] |
| Urine samples | N | D1, N = 3 1 | D3, N = 12 1 | D9, N = 18 1 | D13, N = 14 1 | D21, N = 7 1 |
| Positive RT-PCR | 14 | 0 (0%) | 0 (0%) | 0 (0%) | 0 (%) | 0 (%) |
| RNA (copies/mL) | 0 | NA | NA | NA | NA | NA |
| Positive ELISA | 54 | 3 (100%) | 8 (67%) | 3 (17%) | 0 (0%) | 0 (0%) |
| Antigen quantification (pg/mL) | 54 | 92 [38; 1651] | 18 [0; 254] | 0 [0; 1657] | 0 [0; 1] | 0 [0; 0] |
| Respiratory samples | N | D1, N = 16 1 | D9, N = 1 1 | |||
| Positive RT-PCR | 17 | 15 (94%) | 1 (100%) | |||
| RNA (copies/mL) | 16 | 382,836 [210; 12,193,450] | 335 | |||
| Positive ELISA | 17 | 15 (94%) | 1 | |||
| Antigen quantification (pg/mL) | 17 | 2005 [0; 17,500] | 3 |
Disclaimer/Publisher’s Note: The statements, opinions and data contained in all publications are solely those of the individual author(s) and contributor(s) and not of MDPI and/or the editor(s). MDPI and/or the editor(s) disclaim responsibility for any injury to people or property resulting from any ideas, methods, instructions or products referred to in the content. |
© 2023 by the authors. Licensee MDPI, Basel, Switzerland. This article is an open access article distributed under the terms and conditions of the Creative Commons Attribution (CC BY) license (https://creativecommons.org/licenses/by/4.0/).
Share and Cite
Parraud, D.; Maucotel, A.-L.; Bouscambert, M.; Morfin, F.; Bitker, L.; Chidiac, C.; De Castro, N.; Frobert, E.; Gaymard, A.; on behalf of the French COVID Cohort Study Group. SARS-CoV-2 N-Antigen Quantification in Respiratory Tract, Plasma and Urine: Kinetics and Association with RT-qPCR Results. Viruses 2023, 15, 1041. https://doi.org/10.3390/v15051041
Parraud D, Maucotel A-L, Bouscambert M, Morfin F, Bitker L, Chidiac C, De Castro N, Frobert E, Gaymard A, on behalf of the French COVID Cohort Study Group. SARS-CoV-2 N-Antigen Quantification in Respiratory Tract, Plasma and Urine: Kinetics and Association with RT-qPCR Results. Viruses. 2023; 15(5):1041. https://doi.org/10.3390/v15051041
Chicago/Turabian StyleParraud, Delphine, Anne-Lise Maucotel, Maude Bouscambert, Florence Morfin, Laurent Bitker, Christian Chidiac, Nathalie De Castro, Emilie Frobert, Alexandre Gaymard, and on behalf of the French COVID Cohort Study Group. 2023. "SARS-CoV-2 N-Antigen Quantification in Respiratory Tract, Plasma and Urine: Kinetics and Association with RT-qPCR Results" Viruses 15, no. 5: 1041. https://doi.org/10.3390/v15051041
APA StyleParraud, D., Maucotel, A.-L., Bouscambert, M., Morfin, F., Bitker, L., Chidiac, C., De Castro, N., Frobert, E., Gaymard, A., & on behalf of the French COVID Cohort Study Group. (2023). SARS-CoV-2 N-Antigen Quantification in Respiratory Tract, Plasma and Urine: Kinetics and Association with RT-qPCR Results. Viruses, 15(5), 1041. https://doi.org/10.3390/v15051041