Brief Report

Comparative Upper Respiratory Tract Transcriptomic Profiling Reveals a Potential Role of Early Activation of Interferon Pathway in Severe COVID-19

1
Department of Pathology and Laboratory Medicine, Cedars-Sinai Medical Center, Los Angeles, CA 90048, USA
2
The Center for Bioinformatics and Functional Genomics, Cedars-Sinai Medical Center, Los Angeles, CA 90048, USA
3
Department of Biomedical Sciences, Cedars-Sinai Medical Center, Los Angeles, CA 90048, USA
*
Author to whom correspondence should be addressed.
Viruses 2022, 14(10), 2182; https://doi.org/10.3390/v14102182
Submission received: 9 August 2022 / Revised: 24 September 2022 / Accepted: 28 September 2022 / Published: 1 October 2022
(This article belongs to the Section SARS-CoV-2 and COVID-19)

Abstract

:
Infection with SARS-CoV-2 results in Coronavirus disease 2019 (COVID-19) is known to cause mild to acute respiratory infection and sometimes progress towards respiratory failure and death. The mechanisms driving the progression of the disease and accumulation of high viral load in the lungs without initial symptoms remain elusive. In this study, we evaluated the upper respiratory tract host transcriptional response in COVID-19 patients with mild to severe symptoms and compared it with the control COVID-19 negative group using RNA-sequencing (RNA-Seq). Our results reveal an upregulated early type I interferon response in severe COVID-19 patients as compared to mild or negative COVID-19 patients. Moreover, severely symptomatic patients have pronounced induction of interferon stimulated genes (ISGs), particularly the oligoadenylate synthetase (OAS) family of genes. Our results are in concurrence with other studies depicting the early induction of IFN-I response in severe COVID-19 patients, providing novel insights about the ISGs involved.

1. Introduction

With an estimate of over 582 million infections and more than 6.4 million deaths due to severe acute respiratory syndrome coronavirus 2 (SARS-CoV-2) [1], Coronavirus disease 2019 (COVID-19) has upended the lives of 7.7 billion people. The symptoms, including fever, dry cough, and shortness of breath, are common during infection. The response of patients to COVID-19 disease is variable, ranging from complete absence to moderate symptoms [2,3]; however, a small fraction of patients develop severe disease and pneumonia, followed by development of acute respiratory distress syndrome (ARDS) and often times leading to respiratory failure and death [4]. SARS-CoV-2 can infect any person regardless of age or sex and can cause severe disease and death. Since the beginning of this pandemic, understanding the disease pathogenesis has been a focus of COVID-19 research in order to improve the clinical management of this disease. Although the actual cause of severe symptoms is still unclear, early reports suggest a close association between severity of symptoms and dysregulated inflammatory response to viral infection [5,6,7,8,9,10]. Given the extraordinary burden on global human health, understanding the underlying causes of severe disease progression in SARS-CoV-2 infection is crucial in fighting this disease and developing therapeutic strategies. The intense research efforts since the beginning of the pandemic have led to many novel approaches in understanding this disease, which in turn have led to the approval of some emergency pharmacological interventions such as antiviral drugs, anti-SARS-CoV-2 antibodies, convalescent plasma therapy, and other immunomodulatory drugs to prevent this disease [11,12,13]. Despite all these efforts, the cause of respiratory failure in SARS-CoV-2 infection is still unknown. Studies suggest the active involvement of proinflammatory hyperactive immune response is a major underlying cause of severe symptoms and acute lung damage [14].
Immune system activation may act as a double-edged sword, initiating an antiviral defense but also causing lung damage and respiratory failure when hyperactivated [15]. To better define the initial host immune response to SARS-CoV-2, we conducted RNA-Seq analysis on upper respiratory tract samples from patients with a range of clinical symptoms. In this study, we recruited three groups of patients: a negative control group (N-group; n = 6), asymptomatic or mildly symptomatic group (A-group; n = 6), and severely symptomatic group (S-group; n = 5). Nasopharyngeal swab samples were collected at the time of diagnostic confirmation using RT-PCR test. Upon comparing the molecular signatures of host transcriptional response to SARS-CoV-2 infection, certain immune-regulated pathway genes were enriched and activated in severe COVID-19 patients as compared to the other two groups. Our results also indicate a correlation between COVID-19 severity with the initial immune response which may have implications for immunotherapy treatment failure in severe COVID-19 patients.

2. Materials and Methods

Patients were tested for COVID-19 using RT-PCR at Cedars Sinai Medical Center and were recruited into this study after being categorized into mildly to moderately symptomatic (n = 6), severely symptomatic (n = 5) and negative patient groups (n = 6). The patient cohort included 9 females and 8 males. Total RNA was isolated from the nasopharyngeal swab samples collected from these patients using RNA extraction kit from Qiagen followed by DNase I treatment. RNA integrity was analyzed with the 2100 Bioanalyzer using the Agilent RNA 6000 Pico or Nano Kit (Agilent Technologies, Santa Clara, CA, USA) and RNA was quantified using the Qubit RNA HS Assay Kit (ThermoFisher Scientific, Waltham, MA, USA). Final libraries were prepared using QIAseq Stranded mRNA Select Kit and concentrations were measured using the Qubit 1X dsDNA HS Assay kit. Finally, libraries were sequenced on NovaSeq 6000 (Illumina, San Diego, CA, USA) at an average sequencing depth of ~10 M reads/sample and 1 × 75 bp sequencing. The demultiplexed raw reads were uploaded to GeneGlobe Data Analysis Center (Qiagen, Germantown, MD, USA) at https://www.qiagen.com/us/resources/geneglobe/, accessed on 1 July 2022 for quality control, alignment, and expression quantification. Briefly, 3′ adapter and low-quality bases were trimmed off from reads first using cutadapt (version 1.13) with default settings, and then reads with less than 16 bp insert sequences or with less than 10 bp UMI sequences were discarded.
After demultiplexing, the sequencing reads were aligned to GRCh38 transcriptome reference containing all the protein coding genes. Gene counts were normalized to FPKM (Fragments per kilo base of transcript per million mapped fragments) values (supplementary Table S1), which were then used for statistical analysis.

3. Quantification and Statistical Analysis

Statistical analysis and visualization of RNA-Seq data were performed using GraphPad Prism software v8. Mean, SD, Z-scores, p-values and adjusted p-values were calculated in Excel. Student’s T-test with Benjamini Hochberg adjusted p-values were used for comparison between two groups and significance was evaluated with a threshold of 0.05. The significantly differentially expressed genes were further analyzed after FDR correction with p < 0.01 for pathway enrichment analysis using ShinyGo 0.76 software.

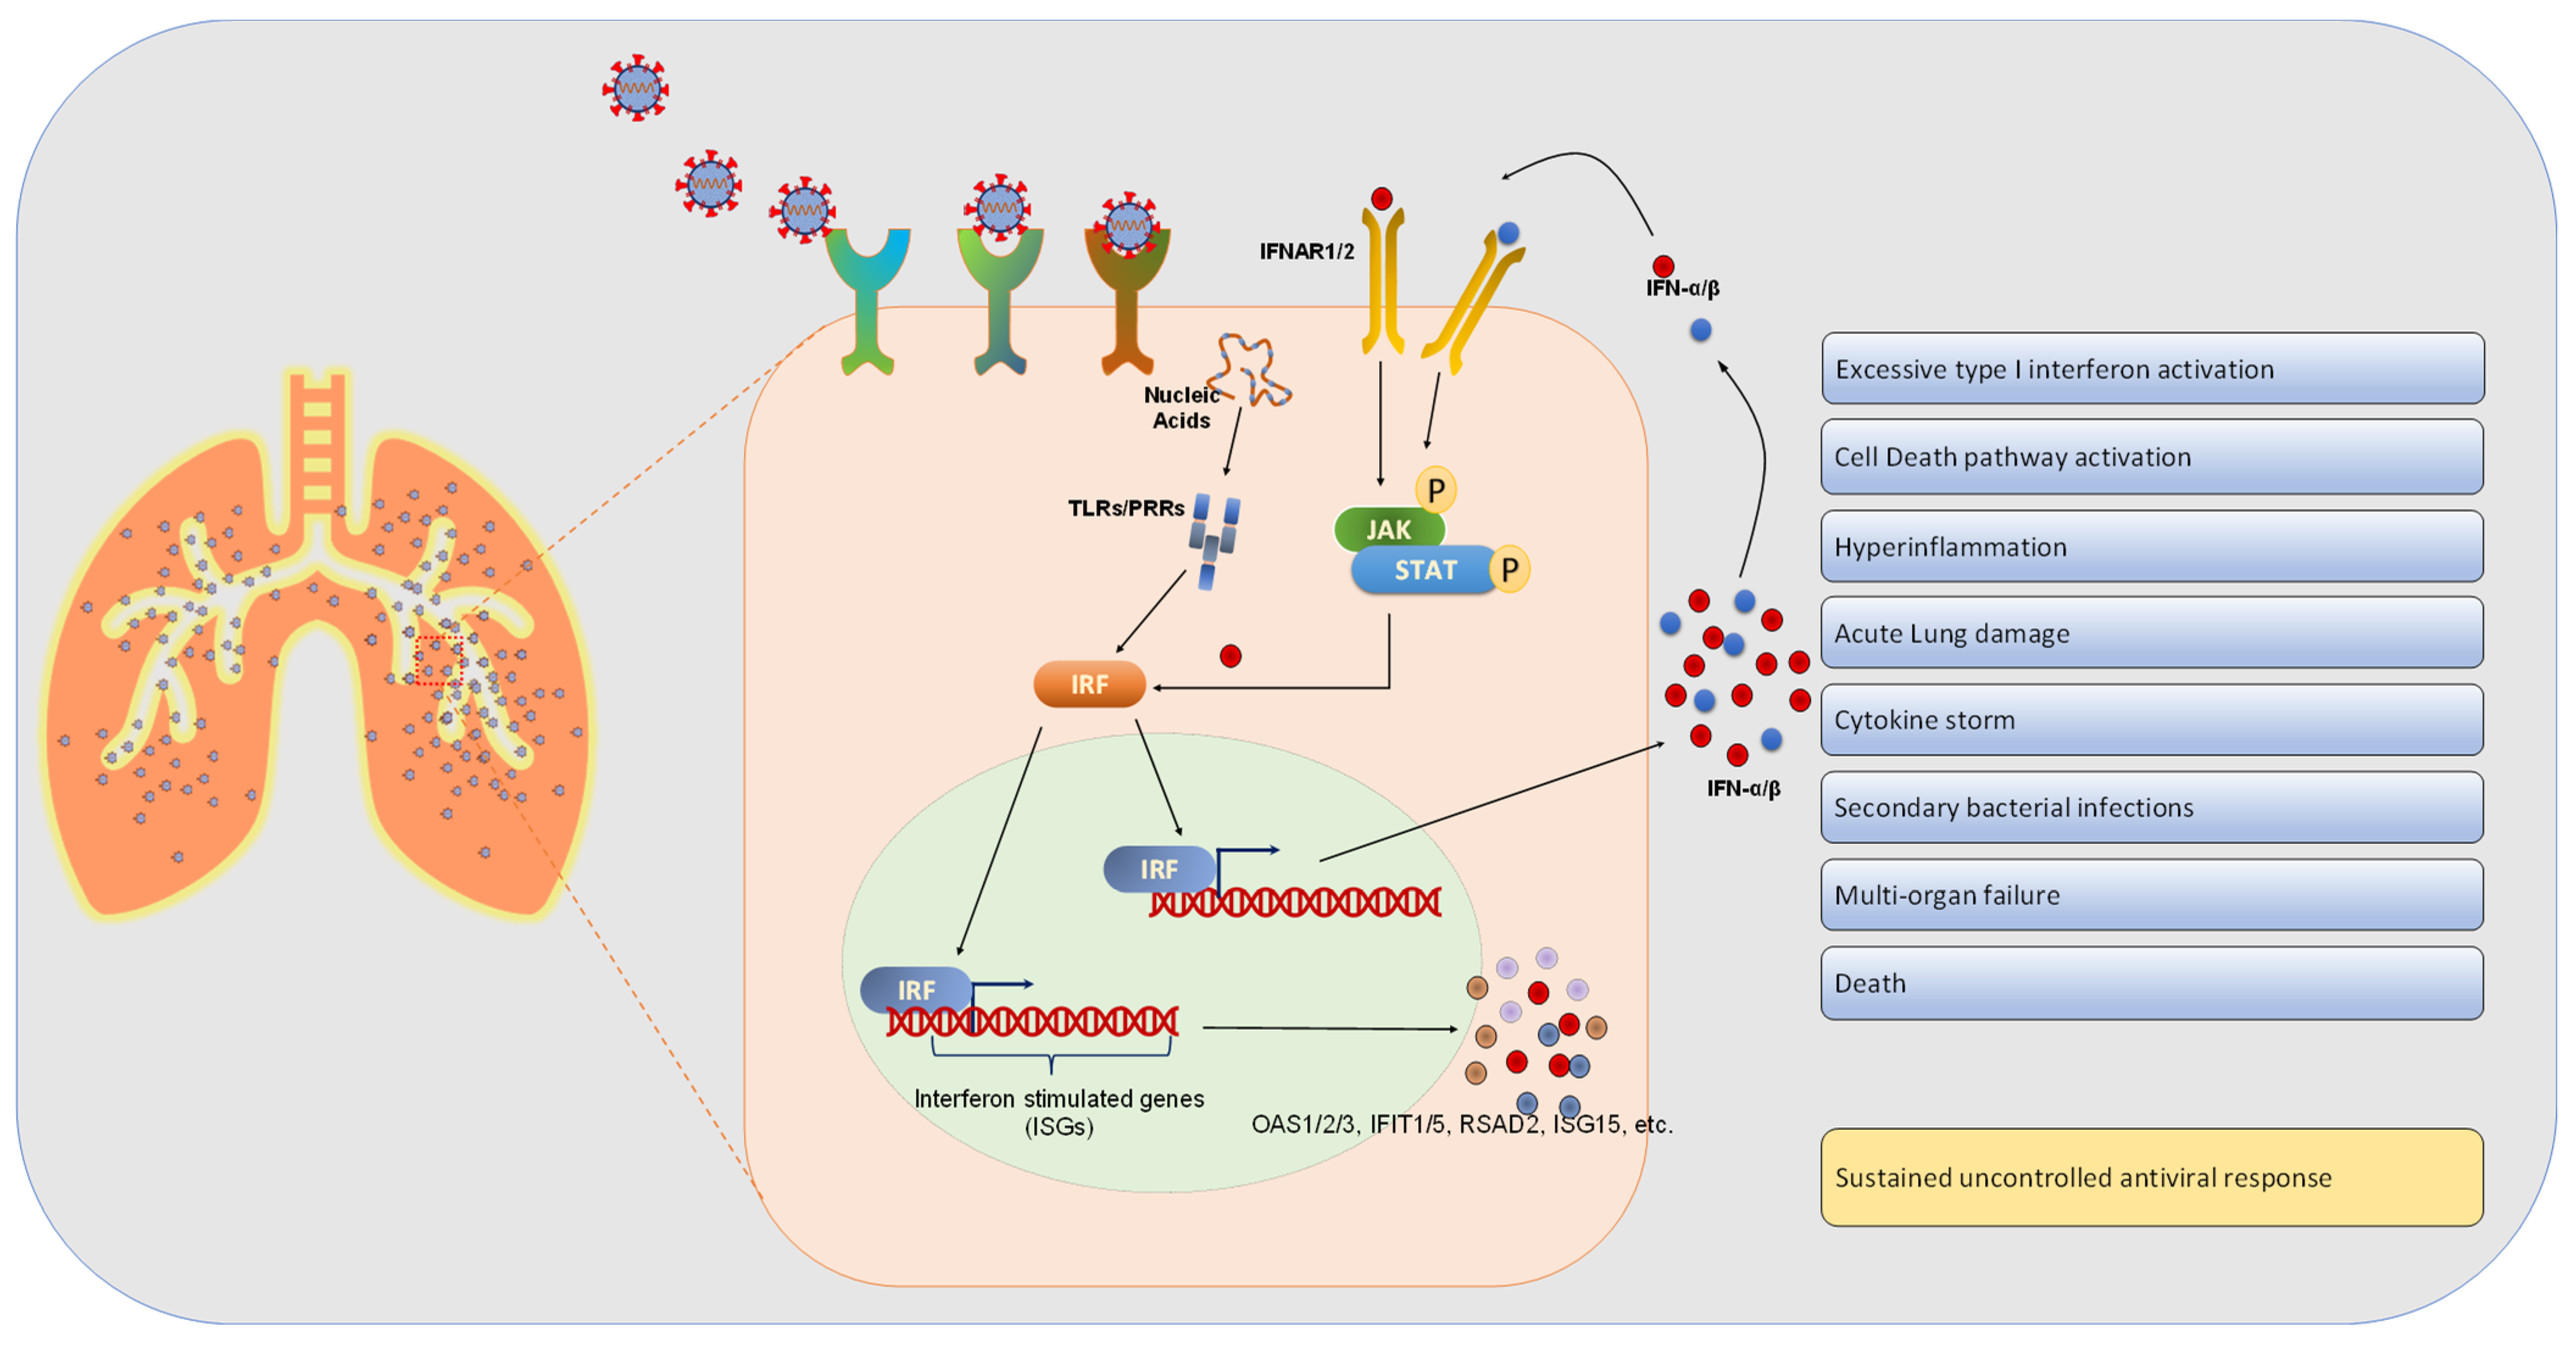
4. Results and Discussion

RNA-sequencing (RNA-Seq) is a powerful tool to investigate the dynamics of virus–host interactions, allowing for identification and integration of the host transcriptional signatures in predicting the prognosis of infection [5,7,9,16,17]. The variable clinical outcome of the disease ranges from asymptomatic to severe respiratory pneumonia requiring intensive care and ventilator support, suggesting a diverse host response to infection [18,19]. Host response biomarkers are an excellent predictor of disease prognosis and treatment response. Keeping the variability of antiviral host responses in mind, our goal was to understand the host transcriptional response at the early onset of infection. To delineate the mechanism of contrasting variabilities in the clinical outcome of COVID-19 patients, we applied RNA-seq to compare the differences in gene expression profile between asymptomatic, mildly symptomatic, and severely symptomatic patients at the early onset of infection. A total of 17 patients were recruited to be included in this study. The patients were divided into three groups: the SARS-CoV-2 negative group (N-group; n = 6), the SARS-CoV-2 positive with absent to mild symptoms group (A-group; n = 6), and the SARS-CoV-2 positive with severe symptoms group (S-group; n = 5). The demographic characteristics of these patients are mentioned in Table 1. The average age of S-group patients was higher than the other two groups. The patients belonging to A-group were not admitted to the hospital and all recovered from COVID-19. The patients in S-group were all admitted to the hospital and died due to acute respiratory distress syndrome (ARDS) and systemic inflammation.
To understand the differences in the host response to infection, we collected nasopharyngeal swab samples from these patients at the early onset of infection (just after their RT-PCR test came back positive or negative for SARS-CoV-2). We subjected the RNA samples to RNA-Seq analysis and compared the groups among each other. To visualize the differences in the gene expression profiles in this patient cohort, we evaluated significantly differentially expressed genes (p-value ≤ 0.01) and plotted them in a heat map representing the statistical Z scores. Heat map visualization plot of the top 500 genes ranked according to the p-values shows the contrasting signature in S-group patients’ transcriptome as compared to the A-group and N-group patients’ transcriptome (Figure 1 A). There was no striking difference in the unique transcriptional signature in A-group patients as compared to the N-group control (Figure 1B).
Next, to understand the biological genes/processes that were enriched in the severe COVID-19 data set, we performed gene enrichment analysis of 932 differentially expressed genes sorted according to their p-values. The differentially expressed genes with p-value ≤ 0.01 were included in our analysis using web based software ShinyGO 0.76 after FDR correction [20]. Out of 932 differentially expressed genes, 100+ genes belonging to type I interferon (INF-I) pathway, particularly interferon-alpha (IFN-α), interferon-beta (IFN-β), and antiviral response pathway, were highly represented in SARS-CoV-2 positive patients as compared to the SARS-CoV-2 negative patients (Figure 1C). Further analysis indicated that major genes upregulated in S-group were related to inflammation. For instance, the interferon stimulated genes (ISGs), including IFIT5, RSAD2, IFITM1, and ISG15 were significantly upregulated (Figure 1D,E, p < 0.01). In contrast, we found downregulation of metabolism associated genes such as ZMYND10, SNORD14A, MTND6, MT-CYB in the S-group as compared to the A- and N-group (Figure 1D,E). We also observed the oligoadenylate synthetase (OAS) family of ISGs to be upregulated in the S-group. OASs have been known for their key roles in antiviral defense [21]. OAS proteins sense cytosolic dsRNA, trigger the formation of 2′-5′-linked oligoadenylate (2′-5′A), and activate ribonuclease L (RNaseL) to degrade viral genomes [22]. There are three OAS family proteins (OAS1, OAS2, OAS3) present in humans. A recent report using a CRISPR activation screen identified OAS1 as a major antiviral factor in restricting SARS-CoV-2 infection [23]. Notably, in this CRISPRa screening study [23], OAS2 and OAS3 were not identified to have an antiviral role. However, in our study, we found that all three OAS genes—OAS1, OAS2 and OAS3—were induced in severe COVID-19 samples and may have implications on host response to COVID-19 (Figure 1D,E). More experimental evidence is needed to explore the role of OAS proteins in the development of severe COVID-19 disease.
Previous studies have demonstrated that IFN-I pathway and ISGs are the main pathways in general host response to respiratory viruses [24]. In contrast, unlike other SARS-CoV viruses where IFN-I response is dampened initially [25], our study indicates that the IFN-I response against SARS-CoV-2 starts at the initial encounter with the virus, and this response is significantly stronger in patients who are at a risk of developing severe disease. However, several clinical studies have highlighted that COVID-19 patients with severe disease exhibit suppressed IFN-I response [7,8,10,26]. This contradiction in results between the studies regarding association of IFN-I responses with disease severity in COVID-19 patients can be attributed to different sampling time points, sample types, disease severity, and type of tissue/cells analyzed. Our findings support the concept that early IFN-I response is inversely correlated to disease progression. We postulate that the IFN-I response is high in potentially severe patients at the early encounter with SARS-CoV-2 and leads to immune exhaustion as disease progresses and hence, the decrease in immune response observed in later stages of COVID-19 disease.
The induced inflammatory response in COVID-19 patients, such as induced interleukin-6 (IL-6), CXCL10, and TNF-α, can lead to hyperactivation of Th1/Th17 responses resulting in recruitment and activation of pro-inflammatory neutrophils and macrophages in lungs [27]. This has been proposed as the prime reason for failure to resolve inflammation in severely symptomatic patients [16,28]. Additionally, SARS-CoV-infected mice exhibited induced pro-inflammatory response and cytokine firing, resulting in pneumonia and lung damage through the recruitment of inflammatory monocyte-macrophages (IMMs). Perhaps, due to the higher levels of IFN-I at the initial phase of infection in potentially severe patients, this mechanism may explain progression to severe disease. Indeed, IFN-I receptor knockout in mice was protective against severe viral lung disease [29,30].
In conclusion, our study shows a significant difference in the gene expression profile between asymptomatic and severe COVID-19 patients. The severely symptomatic patients exhibited induced IFN-I response as compared to the negative group or asymptomatic positive patients. We hypothesize that the hyperinflammatory type-I response to SARS-CoV-2 infection could further lead to cytokine storm, lung damage, secondary infections, and ultimately multi organ failure (Figure 2). In this study, comorbidities such as hypertension and cardiovascular diseases were not a major issue due to their distribution among all patient cohorts. Future research using larger sample sizes should take caution against the effects of existing comorbidities in patients and treat them as covariables when analyzing correlation in gene expression in severe COVID-19 patients. Although further research must be done, the significant associations found between the early IFN-I response and potential disease severity could serve as biomarkers to predict clinical outcome.

Supplementary Materials

The following supporting information can be downloaded at: https://www.mdpi.com/article/10.3390/v14102182/s1.

Author Contributions

Z.K. designed the study with S.A.B. and E.V. S.A.B., T.S., M.L., J.P. and Z.K. collected the data and performed the experiments and together analyzed the data. Z.K., S.A.B. and T.S. wrote the first draft. E.V., M.L. and J.P. reviewed and edited the draft. Z.K. acquired the funding for this study. All authors have read and agreed to the published version of the manuscript.

Funding

This research was funded by AHA Grant 19CDA34760010 (Z.K.), Cedars-Sinai Pathology Minigrant 229154 (Z.K. and E.V.), and IC-Khan, Zakir 23304 (Z.K.).

Institutional Review Board Statement

The study was conducted in accordance with the Declaration of Helsinki, and approved by the Institutional Review Board of Cedars-Sinai Medical Center (STUDY00000629; approval date: 1 August, 2020).

Informed Consent Statement

Informed consent was obtained from all subjects involved in the study.

Data Availability Statement

Analyzed data is included in the main text and supplementary files. Raw data can be made available on request from the corresponding author ([email protected]).

Acknowledgments

We thank Applied Genomics, Computation, and Translational (AGCT) Core team at Cedars-Sinai for performing RNA-sequencing.

Conflicts of Interest

The authors declare no conflict of interest.

References

  1. Dong, E.; Du, H.; Gardner, L. An interactive web-based dashboard to track COVID-19 in real time. Lancet Infect. Dis. 2020, 20, 533–534. [Google Scholar] [CrossRef]
  2. Zhou, P.; Yang, X.L.; Wang, X.G.; Hu, B.; Zhang, L.; Zhang, W.; Si, H.R.; Zhu, Y.; Li, B.; Huang, C.L.; et al. A pneumonia outbreak associated with a new coronavirus of probable bat origin. Nature 2020, 579, 270–273. [Google Scholar] [CrossRef] [PubMed] [Green Version]
  3. Huang, C.; Wang, Y.; Li, X.; Ren, L.; Zhao, J.; Hu, Y.; Zhang, L.; Fan, G.; Xu, J.; Cheng, Z.; et al. Clinical features of patients infected with 2019 novel coronavirus in Wuhan, China. Lancet 2020, 395, 497–506. [Google Scholar] [CrossRef] [Green Version]
  4. Wang, D.; Hu, B.; Hu, C.; Zhu, F.; Liu, X.; Zhang, J.; Wang, B.; Xiang, H.; Cheng, Z.; Xiong, Y.; et al. Clinical Characteristics of 138 Hospitalized Patients With 2019 Novel Coronavirus-Infected Pneumonia in Wuhan, China. JAMA 2020, 323, 1061–1069. [Google Scholar] [CrossRef] [PubMed]
  5. Schulte-Schrepping, J.; Reusch, N.; Paclik, D.; Baßler, K.; Schlickeiser, S.; Zhang, B.; Krämer, B.; Krammer, T.; Brumhard, S.; Bonaguro, L.; et al. Severe COVID-19 Is Marked by a Dysregulated Myeloid Cell Compartment. Cell 2020, 182, 1419–1440.e23. [Google Scholar] [CrossRef] [PubMed]
  6. Wilk, A.J.; Rustagi, A.; Zhao, N.Q.; Roque, J.; Martínez-Colón, G.J.; McKechnie, J.L.; Ivison, G.T.; Ranganath, T.; Vergara, R.; Hollis, T.; et al. A single-cell atlas of the peripheral immune response in patients with severe COVID-19. Nat. Med. 2020, 26, 1070–1076. [Google Scholar] [CrossRef]
  7. Hadjadj, J.; Yatim, N.; Barnabei, L.; Corneau, A.; Boussier, J.; Smith, N.; Péré, H.; Charbit, B.; Bondet, V.; Chenevier-Gobeaux, C.; et al. Impaired type I interferon activity and inflammatory responses in severe COVID-19 patients. Science 2020, 369, 718–724. [Google Scholar] [CrossRef]
  8. Bastard, P.; Rosen, L.B.; Zhang, Q.; Michailidis, E.; Hoffmann, H.H.; Zhang, Y.; Dorgham, K.; Philippot, Q.; Rosain, J.; Béziat, V.; et al. Autoantibodies against type I IFNs in patients with life-threatening COVID-19. Science 2020, 370, 6515. [Google Scholar] [CrossRef]
  9. Wu, C.; Chen, X.; Cai, Y.; Xia, J.; Zhou, X.; Xu, S.; Huang, H.; Zhang, L.; Zhou, X.; Du, C.; et al. Risk Factors Associated with Acute Respiratory Distress Syndrome and Death in Patients with Coronavirus Disease 2019 Pneumonia in Wuhan, China. JAMA Intern. Med. 2020, 180, 934–943. [Google Scholar] [CrossRef] [Green Version]
  10. Mick, E.; Kamm, J.; Pisco, A.O.; Ratnasiri, K.; Babik, J.M.; Castañeda, G.; DeRisi, J.L.; Detweiler, A.M.; Hao, S.L.; Kangelaris, K.N.; et al. Upper airway gene expression reveals suppressed immune responses to SARS-CoV-2 compared with other respiratory viruses. Nat. Commun. 2020, 11, 5854. [Google Scholar] [CrossRef]
  11. Sanders, J.M.; Monogue, L.M.; Jodlowski, Z.T.; Cutrell, B.J. Pharmacologic Treatments for Coronavirus Disease 2019 (COVID-19): A Review. JAMA 2020, 323, 1824–1836. [Google Scholar] [CrossRef] [PubMed]
  12. Zou, H.; Yang, Y.; Dai, H.; Xiong, Y.; Wang, J.Q.; Lin, L.; Chen, Z.S. Recent Updates in Experimental Research and Clinical Evaluation on Drugs for COVID-19 Treatment. Front. Pharmacol. 2021, 12, 732403. [Google Scholar] [CrossRef] [PubMed]
  13. Barlow, A.; Landolf, K.M.; Barlow, B.; Yeung, S.; Heavner, J.J.; Claassen, C.W.; Heavner, M.S. Review of Emerging Pharmacotherapy for the Treatment of Coronavirus Disease 2019. Pharmacotherapy 2020, 40, 416–437. [Google Scholar] [CrossRef] [PubMed] [Green Version]
  14. Zhao, Y.; Kilian, C.; Turner, J.E.; Bosurgi, L.; Roedl, K.; Bartsch, P.; Gnirck, A.C.; Cortesi, F.; Schultheiß, C.; Hellmig, M.; et al. Clonal expansion and activation of tissue-resident memory-like Th17 cells expressing GM-CSF in the lungs of severe COVID-19 patients. Sci. Immunol. 2021, 6, eabf6692. [Google Scholar] [CrossRef]
  15. Trinchieri, G.; Type I interferon: Friend or foe?, J. Type I interferon: Friend or foe? J. Exp. Med. 2010, 207, 2053–2063. [Google Scholar] [CrossRef] [Green Version]
  16. McClain, M.T.; Constantine, F.J.; Henao, R.; Liu, Y.; Tsalik, E.L.; Burke, T.W.; Steinbrink, J.M.; Petzold, E.; Nicholson, B.P.; Rolfe, R.; et al. Dysregulated transcriptional responses to SARS-CoV-2 in the periphery. Nat. Commun. 2021, 12, 1079. [Google Scholar] [CrossRef]
  17. Tsalik, E.L.; Henao, R.; Nichols, M.; Burke, T.; Ko, E.R.; McClain, M.T.; Hudson, L.L.; Mazur, A.; Freeman, D.H.; Veldman, T.; et al. Host gene expression classifiers diagnose acute respiratory illness etiology. Sci. Transl. Med. 2016, 8. [Google Scholar] [CrossRef] [Green Version]
  18. Zhou, F.; Yu, T.; Du, R.; Fan, G.; Liu, Y.; Liu, Z.; Xiang, J.; Wang, Y.; Song, B.; Gu, X.; et al. Clinical course and risk factors for mortality of adult inpatients with COVID-19 in Wuhan, China: A retrospective cohort study. Lancet 2020, 395, 1054–1062. [Google Scholar] [CrossRef]
  19. Maggi, E.; Canonica, G.W.; Moretta, L. COVID-19: Unanswered questions on immune response and pathogenesis. J. Allergy Clin. Immunol. 2020, 146, 18–22. [Google Scholar] [CrossRef]
  20. Ge, S.X.; Jung, D.; Yao, R. ShinyGO: A graphical gene-set enrichment tool for animals and plants. Bioinformatics 2020, 36, 2628–2629. [Google Scholar] [CrossRef]
  21. Hornung, V.; Hartmann, R.; Ablasser, A.; Hopfner, K.-P. OAS proteins and cGAS: Unifying concepts in sensing and responding to cytosolic nucleic acids. Nat. Rev. Immunol. 2014, 14, 521–529. [Google Scholar] [CrossRef] [PubMed]
  22. Schwartz, S.L.; Conn, G.L. RNA regulation of the antiviral protein 2'-5'-oligoadenylate synthetase. Wiley Interdiscip. Rev. RNA 2019, 10, e1534. [Google Scholar] [CrossRef] [PubMed]
  23. Danziger, O.; Patel, R.S.; DeGrace, E.; Rosen, M.R.; Rosenberg, B.R. Inducible CRISPR activation screen for interferon-stimulated genes identifies OAS1 as a SARS-CoV-2 restriction factor. PLoS Pathog. 2022, 18, e1010464. [Google Scholar] [CrossRef] [PubMed]
  24. Zaas, A.K.; Chen, M.; Varkey, J.; Veldman, T.; Hero, A.O., 3rd; Lucas, J.; Huang, Y.; Turner, R.; Gilbert, A.; Lambkin-Williams, R.; et al. Gene expression signatures diagnose influenza and other symptomatic respiratory viral infections in humans. Cell Host Microbe 2009, 6, 207–217. [Google Scholar] [CrossRef] [Green Version]
  25. Spiegel, M.; Pichlmair, A.; Martínez-Sobrido, L.; Cros, J.; García-Sastre, A.; Haller, O.; Weber, F. Inhibition of Beta interferon induction by severe acute respiratory syndrome coronavirus suggests a two-step model for activation of interferon regulatory factor 3. J. Virol. 2005, 79, 2079–2165. [Google Scholar] [CrossRef] [Green Version]
  26. Zhang, Q.; Bastard, P.; Liu, Z.; Le Pen, J.; Moncada-Velez, M.; Chen, J.; Ogishi, M.; Sabli, I.; Hodeib, S.; Korol, C.; et al. Inborn errors of type I IFN immunity in patients with life-threatening COVID-19. Science 2020, 370, eabd4570. [Google Scholar] [CrossRef]
  27. De Biasi, S.; Meschiari, M.; Gibellini, L.; Bellinazzi, C.; Borella, R.; Fidanza, L.; Gozzi, L.; Iannone, A.; Lo Tartaro, D.; Mattioli, M.; et al. Marked T cell activation, senescence, exhaustion and skewing towards TH17 in patients with COVID-19 pneumonia. Nat. Commun. 2020, 11, 3434. [Google Scholar] [CrossRef]
  28. Xiong, Y.; Liu, Y.; Cao, L.; Wang, D.; Guo, M.; Jiang, A.; Guo, D.; Hu, W.; Yang, J.; Tang, Z.; et al. Transcriptomic characteristics of bronchoalveolar lavage fluid and peripheral blood mononuclear cells in COVID-19 patients. Emerg. Microbes Infect. 2020, 9, 761–770. [Google Scholar] [CrossRef]
  29. Channappanavar, R.; Fehr, A.R.; Vijay, R.; Mack, M.; Zhao, J.; Meyerholz, D.K.; Perlman, S. Dysregulated Type I Interferon and Inflammatory Monocyte-Macrophage Responses Cause Lethal Pneumonia in SARS-CoV-Infected Mice. Cell Host Microbe 2016, 19, 181–193. [Google Scholar] [CrossRef] [Green Version]
  30. Israelow, B.; Song, E.; Mao, T.; Lu, P.; Meir, A.; Liu, F.; Alfajaro, M.M.; Wei, J.; Dong, H.; Homer, R.J.; et al. Mouse model of SARS-CoV-2 reveals inflammatory role of type I interferon signaling. J. Exp. Med. 2020, 217, e20201241. [Google Scholar] [CrossRef]
Figure 1. Transcriptomic analysis showing the activation of type I interferon in severe COVID-19. (A) Heat map of the transcriptome of patients with severe COVID-19 (S-group) in comparison with mild/asymptomatic COVID-19 (A-group), (B) comparison between mild/asymptomatic COVID-19 (A-group) and negative (N-group). (C) Bar plot showing the enrichment analysis of genes significantly represented in severe COVID-19 (S-group) as compared to Negative (N-group) samples. (D) Volcano plot depicting the significantly (p-value < 0.01) differentially upregulated and downregulated genes in severe COVID-19 (S-group) as compared to negative (N-group) patients. (E) Bar plot showing the individual interferon stimulated genes upregulated in severe COVID-19 (S-group). * p < 0.01.
Viruses 14 02182 g001
Figure 2. Schematic illustrating the effects of upregulated IFN-I response in hyperinflammation and severe COVID-19 patients supported by transcriptomic analysis.
Viruses 14 02182 g002
Table 1. Demographic Characteristics of COVID-19 patient Cohort.
Patient ID Age Gender Smoking Outcome Comorbidity Race Clinical Symptoms at Presentation Lowest O2
Saturation in ED
Negative (N)-Group Patient
1
55 F Former Released SLE with nephritis, CKD, CVA, seizure disorder, wheelchair bound Non-Hispanic; Black Dry cough, malaise,
fatigue, chest pressure, mild dyspnea
NA
Patient
2
37 F Never Released Asthma Non-Hispanic; White Shortness of breath, coughing NA
Patient
3
71 F Never Deceased PBC cirrhosis s/p liver transplant Non-Hispanic; White Febrile neutropenia (concern for GVHD) NA
Patient
4
79 M Former Released Ischemic CMY, HTN, HLD, DM, CKD Non-Hispanic; White Cough, shortness of breath NA
Patient
5
78 F Former Released Dementia Non-Hispanic; White Fever, facial swelling NA
Patient
6
36 F Never Released Migraines, anxiety Hispanic; White Cough, chest tightness NA
Positive Not Admitted (A)-Group Patient
7
51 F Never Released None Non-Hispanic; White Chest pain, palpitations 99
Patient
8
43 F Never Released Pregnant, None Non-Hispanic; Black Shortness of breath, chills, malaise/fatigue, cough, wheezing 98
Patient
9
64 M Former Released HLD, HTN Non-Hispanic; White Fever, nasal congestion, sore throat 94
Patient
10
28 M Never Released GAD, Depression, Obesity Hispanic Chest pain, coughing, wheezing, heartburn 99
Patient
11
36 F Never Released None Non-Hispanic; Asian Fever, body aches, chills, loss of taste/smell, cough, shortness of breath, 97
Patient
12
32 M Never Released None Non-Hispanic Subjective fever and chills 100
Positive with Severe Symptoms (S)-Group Patient
13
69 M Never Deceased GAD Unknown Chills, fevers, cough, shortness of breath 86 on NRB 15L
Patient
14
73 F Never Deceased Quadriplegia, DM, large sacral wound present Non-Hispanic; White Fever, rhinorrhea, AMS 97
Patient
15
59 M Never Deceased HTN Non-Hispanic; Black Shortness of breath, cough, fevers,
abdominal pain
92 on 3L
nasal
cannula
Patient
16
47 M Never Deceased None Non-Hispanic; Black Fevers, myalgias,
fatigue, headache, sore throat, shortness of breath
95
Patient
17
87 M Never Deceased HTN, Dementia Non-Hispanic; Black Weakness, nausea,
vomiting
94
SLE: Systemic lupus erythematosus, CKD: Chronic kidney disease, HTN: Hypertension, HLD: Hypersensitivity lung disease, CVA: cerebrovascular accident, CMY: Cardiomyopathy, DM: Diabetes mellitus, GAD: Generalized anxiety disorder, GVHD: Graft-versus-host disease, AMS: altered mental status, NA: not applicable.
Publisher’s Note: MDPI stays neutral with regard to jurisdictional claims in published maps and institutional affiliations.

