Article

Effects of Narrow Linear Disturbances on Light and Wind Patterns in Fragmented Boreal Forests in Northeastern Alberta

Department of Renewable Resources, Faculty of Agriculture, Life, and Environmental Sciences, University of Alberta, Edmonton, AB T6G 2H1, Canada
*
Author to whom correspondence should be addressed.
Forests 2018, 9(8), 486; https://doi.org/10.3390/f9080486
Submission received: 13 July 2018 / Revised: 6 August 2018 / Accepted: 9 August 2018 / Published: 10 August 2018
(This article belongs to the Section Forest Ecology and Management)

Abstract

:
Forest fragmentation threatens forest biodiversity and ecosystem function. One of the concerns relates to increases in edge effects, which among other things affects the forest microclimate that influences the distribution and behavior of species. In Alberta, Canada, boreal anthropogenic disturbances from in situ oil exploration are increasing forest fragmentation, especially in the form of exploratory well pads and seismic lines (i.e., linear forest clearings created during the exploration phase of oil extraction). Dissection of these forests by seismic lines has the potential to change local patterns in wind and light, and thus may alter forest communities. Although alterations of these abiotic conditions are likely, the magnitude of these changes is unknown, particularly the effects of changes in the width and orientation of linear disturbances. Here we investigated changes in light and wind on seismic lines compared to that of adjacent undisturbed forests and nearby cleared openings. Specifically, we examined how seismic line characteristics (i.e., line direction, line width, and adjacent canopy height) altered local responses in these abiotic conditions. Generalized Linear Mixed Effect models predicted a 2-fold increase in average light intensity and maximum wind speeds, and a 4-fold increase in average wind speeds on seismic lines compared to adjacent forests. These changes did not approach the conditions in large openings, which compared to forests had a 3-fold increase in average light intensity, a 16-fold increase in average wind speeds, and a 4-fold increase in maximum wind speeds. Line width and orientation interacted with adjacent forest height altering the abiotic environment with wider lines having a 3-fold increase on maximum wind speed. We conclude that even localized, narrow (<10-m wide) forest disturbances associated with oil sands exploration alter forest microclimatic conditions. Recent changes in practices that reduce line width as well as promoting tree regeneration, will minimize the environmental effects of these anthropogenic disturbances.

1. Introduction

Forest fragmentation, the process through which previously intact forests are broken apart into smaller and more-isolated fragments [1] is considered a major conservation issue worldwide [2,3,4]. While the effects of forest fragmentation can positively or negatively affect different species [1], there is widespread agreement that fragmentation of forests negatively affects biodiversity and ecosystem services, mostly through habitat loss [1,5]. One important consequence of habitat fragmentation is the increase in the ratio of edge to core habitat, promoting “edge effects”, which include both behavioral responses to edges by species and the change in environmental characteristics due to the transition between different habitat types [1,6]. Such transition creates different abiotic conditions (e.g., increased light, wind, and temperature; reduced moisture) [3,5] that, together with changes in landscape connectivity and behavioral responses in wildlife, influence species composition [2,7].
Boreal forests are no exception to the worldwide trend of forest fragmentation, being subject to anthropogenic disturbances associated with resource extraction activities [8]. Although boreal forests are depauperate in biodiversity compared to other forest biomes [7], these forests represent one third of the worldwide forest cover and carbon stocks [9]. They also sustain a number of charismatic and/or threatened species, such as woodland caribou (Rangifer tarandus caribou) and grizzly bear (Ursus arctos), while providing natural resources of primary interest to human societies [9]. Natural resource extraction of Canada’s boreal forest includes forestry and energy extraction, with Alberta’s forests being one of the most developed in Canada [8]. One major source of local forest fragmentation is the extraction of bitumen from the oil sands. With the majority of bitumen being deeper than 70 m, its extraction in these areas is from the use of underground wells [
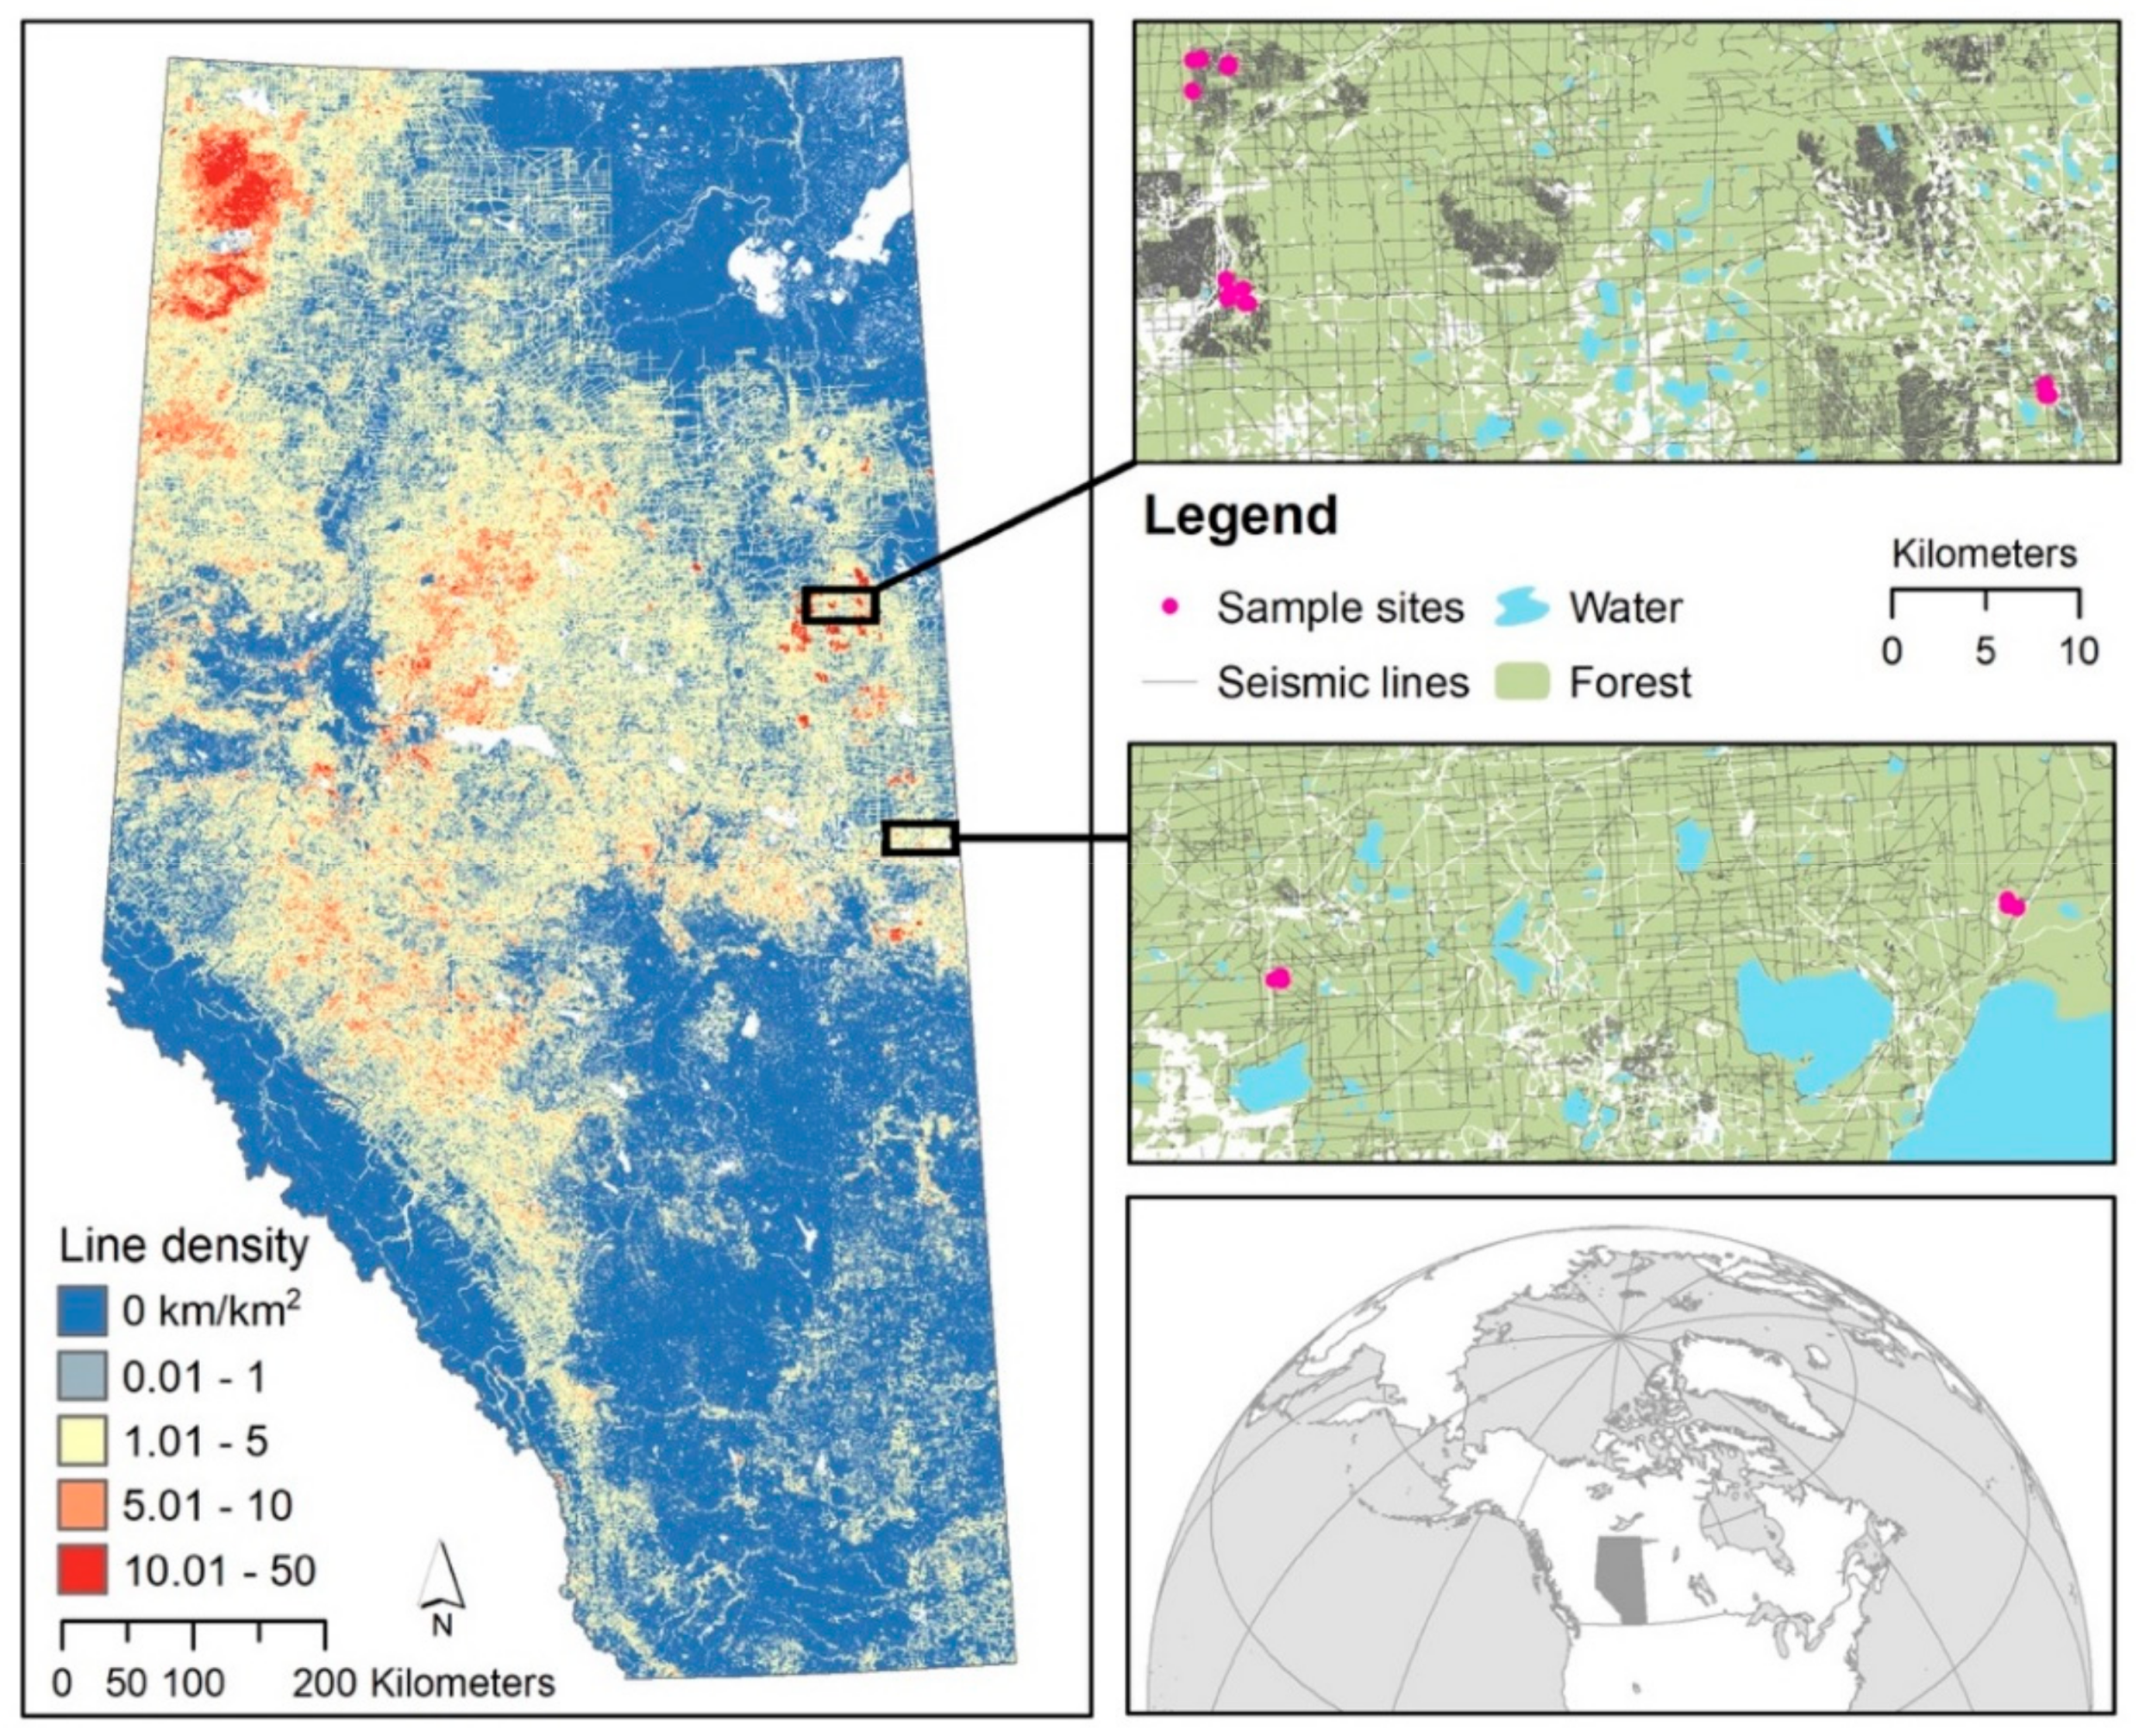
8]. Here most of the forests remain, but within that forest there are numerous smaller disturbances created by well pads, roads, pipelines, and exploratory seismic lines. Of these disturbances, seismic lines are the most pervasive in terms of extent and amount of forest edge. These narrow (<10-m wide) linear forest clearings are created to map the extent and depth of oil reserves via seismic assessments [8,10,11]. Generally, there are two kinds of seismic lines: traditional (2D) and “low-impact” (3D). Traditional lines are typically 5–10 m in width, many kilometers long, and widely spaced (200–500 m), while low-impact lines (<5-m wide, typically 1.5–3 m wide) introduced since the 2000s to minimize footprint are used to more precisely determine the depth of the oil sands reserve in areas of greater interest [12]. Although these lines are narrow, they occur at densities reaching as high as 40 km/km2 and thus contribute most to the creation of forest edges (Figure 1).
A key conservation issue is the need to regenerate these disturbances to forest conditions in order to minimize the effects of this footprint [10]. For instance, for wind dispersed plant species this form of linear fragmentation increases seed dispersal [2,13], which is closely associated with higher wind speeds [14,15,16]. As well as altering wind, these lines also alter light conditions that may affect tree regeneration and the movement of invasive species [10,17]. High levels of fragmentation may therefore result in a propagation of invasive species into forests. Although the relationship between corridors and fragmentation and the spread of invasive species is currently unclear [18,19,20], recent experiments showed that seed dispersal is positively affected by seismic line corridors [16], raising concern about the effects of these linear features in spreading invasive species [21]. While propagules may make it to the site, light is a limiting factor for many plant species and thus a contributing factor to the recovery process. Seismic line disturbances change the forest structure and increase the amount of early seral forest conditions, thus altering assemblage composition and movement of vertebrate and invertebrate species [22,23,24,25,26]. For instance, seismic lines can facilitate predator movements [27,28], such as increases in gray wolf (Canis lupus) movements which increase encounter rates and potential predation of woodland caribou [28].
Therefore, it is important to understand conditions that promote tree regeneration on seismic lines. Natural tree regeneration on many of these lines is slow, with many of the oldest lines showing little regrowth of woody vegetation decades later [10,12]. This lack of natural recovery can occur due to conversion of some lines to temporary roads and Off-Highway Vehicle (OHV) trails [10,12], but there is also evidence that width and orientation of seismic lines influences regeneration by affecting abiotic factors (e.g., narrower lines and lines oriented east-to-west have improved regrowth of trees [10]). Light and wind may play important roles in moderating responses to forest “dissection” (sensu Jaeger [6]), as light availability can affect plant species assemblages [8], while wind dynamics can alter plant community composition [7,26]. Estimating recovery trajectories will ultimately necessitate a better understanding of changes in the abiotic environment.
This study aims to determine the extent of abiotic environment changes within fragmented boreal forests from in situ oil sands developments in Alberta, Canada. Specifically, we evaluate whether and how sunlight intensity and wind speed differ on seismic lines compared with undisturbed forest controls, and in large reference openings (exploratory well pads). We further investigated how (i) line orientation, (ii) line width, and (iii) adjacent stand characteristics (approximated by canopy height) affect local variation in light and wind. We expected an increase in light intensity and wind speed when comparing seismic lines with reference undisturbed forests (controls). When assessing fragmented forest and seismic line characteristics, we hypothesized that (i) light intensity and wind speed will increase with magnitude (width) of disturbance; (ii) average and maximum wind speeds would be faster on east-west lines because the prevailing winds in the area are westerly; sunlight intensity will on average be higher on east-west orientated lines because they are more orientated with the movement of the sun during summer; (iii) taller forests will buffer changes in light intensity and wind speed in comparison to shorter forests; and (iv) increases in line width will increase light intensity and wind speed. Although these trends are expected, the magnitude of these differences by disturbance type (gap width of line) and their interaction are largely unknown, including whether low impact seismic lines reduce differences in abiotic conditions to that of forests compared to conventional seismic lines and that of forests.

2. Materials and Methods

2.1. Study Location and Layout

Sample sites were located in five sites within the two study areas: (1) Fort McMurray (3 sub-areas); and (2) Cold Lake (2 sub-areas) (Figure 1). Seismic lines in both areas were about 15–20 years in age, all with minimal regrowth of trees, and were left to natural regeneration after being cleared (i.e., no treatment to enhance regeneration). Specifically, the seismic lines here investigated showed similar regeneration patterns, i.e., mostly with regenerating vegetation being shorter than 1 m and sapling density being lower than 10,000 saplings/ha. All sites had perpendicular north-to-south and east-to-west orientations of seismic lines and were sampled in June and July of 2017.
Study sites were primarily treed peatlands (7 sites), where open seismic lines are common due to poor regeneration [10]. Forest canopy heights ranged from 6 m to 18 m. Tree species were dominated by black spruce (Picea mariana) and tamarack (Larix laricina) with an understory of sphagnum (Sphagnum spp.), sedge (Carex spp.), and Ericaeae shrubs. Forested upland sites, dominated by trembling aspen (Populus tremuloides) or jack pine (Pinus banksiana), were also included.
Each study area had one reference forest opening that used a nearby exploratory well pad. Each seismic line site consisted of three stations: one located along a north-to-south oriented seismic line, one located an equal distance along the intersecting east-to-west oriented line, and one in the adjacent interior forest between the other two stations at perpendicular angles. In comparison to the reference forest opening (exploratory well pads), the interior forest site represented a second reference condition absent of recent forest disturbances. Most commonly, stations were either 25 m or 50 m from line intersections depending on line spacing and a similar distance into the interior forest. Forest edge distance effects in the region are shorter than most other forested ecosystems being only as far as 15 m for larger gap sizes [8].
We assessed both traditional (2D) and low impact (3D) seismic lines in the study. Gap width of 3D lines varied from 2–3.5 m (narrow lines), while gap width of 2D lines (wide lines) varied between 5–10 m. We also assessed changes in light and wind patterns in exploratory well pads to compare the conditions observed in seismic lines with those of open clearings absent of woody regrowth. The well pads chosen had no infrastructure on them, and varied in size from 65 × 65 m to 280 × 325 m. To test if the variation in well pad size affected our results we included well pad area in initial models, but we found no effect (Results, Section 3.1.). Well pad openings were always located near to seismic line sites, with the greatest distance being 1.6 km.

2.2. Study Design

We collected data over a period of 14 days in June and July of 2017, with wind and sunlight measured at each station over a 1.5 to 2-day interval. We measured wind speed (m/s) using Rainwise Inc. Windlogs (Trenton, ME, USA), while light was measured in units of lux using Onset HOBO Pendant Temperature/Light 64K Data Loggers (Bourne, MA, USA). Sunlight data loggers were elevated to 1 m height, while wind data loggers were elevated to a 1.5 m height above the ground. All data loggers recorded synchronously on a 5-min systematic sampling interval. Canopy height information of the forest stand adjacent to the seismic line was obtained from recent (2006–2011) LiDAR data [29,30], using the 95th percentile of canopy height, while gap width of the seismic line was measured in field using a tape measure. For consistency, we used only observations from an entire sampled day in all analyses.

2.3. Analysis

Official sunrise and sunset times were used to limit daytime observations for light, while all wind data were used (wind is present at all times of the day). Data were summarized for each of the 49 site and treatment combinations over a full 24-h day of recording, although the final analysis included 45 observations for wind and 46 observations for light due to data logger failure or wildlife disturbances to equipment.
For analysis, we summarized average light intensity, average wind speed, and maximum wind speed for each station and day combination for analysis. Because our sample size was not sufficient to disentangle the effect of stochastic variation in daily temperature from the effects of the investigated treatments, we chose to not present temperature data. We used R for all analyses [31] (script provided as Supplementary Material). We used a Generalized Linear Mixed Model (GLMM) with a gamma distribution and a log link to recognize that minimum values of light and wind could not be negative in predictions. We used site and day as random effects in models to account for pairing of sensors at a site and natural day-to-day variation. To examine differences among disturbances, we first used simple categorical contrasts between treatments of forests, linear disturbances (seismic lines), and large openings (exploratory well pads) using box plots to visualize and post hoc Tukey tests to assess significant differences between the three categorical groups. Then, we focused on modeling responses specific to seismic line characteristics using GLMMs to determine how canopy height, gap width, and line orientation (all fixed factors) altered light and wind conditions. Finally, we compared different sets of models (combinations of covariates) using Akaike Information Criterion (AIC) to better understand which factors were more important in explaining patterns in abiotic variation between seismic lines of different sizes/orientations/forest environments (canopy heights).

3. Results

3.1. Evaluating the Effect of Gap Size in Well Pads (Reference Openings)

While the size of exploratory well pads varied widely (minimum = 0.36 ha; maximum = 8.13 ha), all well pads were classified and analyzed as one group. Quantitative models examining the relationship between gap size and abiotic conditions found that within the “opening” group (i.e., well pads), size of the gap did not affect patterns in average light intensity (β = −0.0003, p = 0.790), average wind speed (β = −0.00004, p = 0.872), or maximum wind speed (β = 0.0001, p = 0.924).

3.2. General Treatment Effects

Linear gaps (seismic lines) and openings differed in amount of average light compared with undisturbed forests (Table 1; Figure 2) with post hoc Tukey tests significant between the three groups for all response variables (p always < 0.01). When examining specific differences, linear gaps had 2.1 times more light intensity than adjacent undisturbed forests (p < 0.001). Not surprisingly, large openings had even higher light intensity than the linear gap or forested reference sites. Specifically, openings had 3.4 times more light intensity than forests and 1.6 times more light than seismic lines (p < 0.001). Variation due to the random effect of day and site was low (~0.097) overall.
Wind speed (average and maximum) followed analogous, expected patterns of response (Table 2, Figure 3) with post hoc Tukey tests significant between the three groups for all response variables (p always < 0.01). Specifically, linear gaps (seismic lines) had higher average wind speeds when compared to adjacent forests, averaging 4.0 times higher speeds (p < 0.001). Openings (exploratory well pads) also increased average wind speeds, being 16.2 times higher than undisturbed forests and 4 times higher than seismic lines (p < 0.001). Variation in average wind speeds was high, and model fit was low with 54% of the variation explained by day, illustrating the highly stochastic nature of wind between days. Similar to average wind speeds, forests had the lowest predicted maximum wind speeds. Specifically, linear gaps had 2.1 times higher maximum wind speeds compared to forests (p < 0.001), while openings had 4.3 times higher maximum wind speeds than forests and 2.1 times higher speeds than seismic lines (p < 0.001) (Table 2). Variation due to the random effect was low for maximum wind speed (~0.068).

3.3. Comparing Light and Wind within Linear Gaps (Seismic Lines)

The most supported model explaining light intensity on seismic lines included line orientation and the interaction between canopy height and gap width (AIC = 550.4, wi = 0.26) (Table A1 (in Appendix A) and Table 3, Figure 4). Canopy height was inversely related to light intensity (β = −0.212, p < 0.001), while the interaction between canopy height and gap width was positively related to light intensity (β = 0.304, p = 0.035), but not gap width alone. Although north-to-south orientation of the line was included in the most supported AIC model, it had a minor negative effect (marginal significance) on light intensity (β = −0.202, p = 0.084). Overall, the model predicted that east-to-west oriented lines had 1.22 times higher average light intensity than north-to-south orientated lines (p ≤ 0.001) (Figure 4).
We found that average wind conditions along seismic lines were best explained as a function of gap width and line orientation (Table A2). Gap width in the GLMM was positively related to average wind speed, although being marginally significant (β = 0.191, p = 0.064) (Table 4). North-to-south orientation of a line appeared to have higher average wind speeds (Figure 5), but again the relationship was weak (β = 0.374, p = 0.110). Regardless, the model predicted that north-to-south oriented lines had 1.5 times higher average wind speed than east-to-west lines (p = 0.110). In contrast to average wind speeds, maximum wind speeds on seismic lines was best explained as a function of gap width alone (Table A3). Overall, gap width was positively related to maximum wind speeds (β = 0.124, p = 0.014) with a similar but slightly weaker relationship to that of average wind speed (Table 4). The model predicted that the widest lines (10 m) had 2.7 times higher maximum wind speeds than the narrowest lines (2 m) (p = 0.014) (Figure 5).

4. Discussion

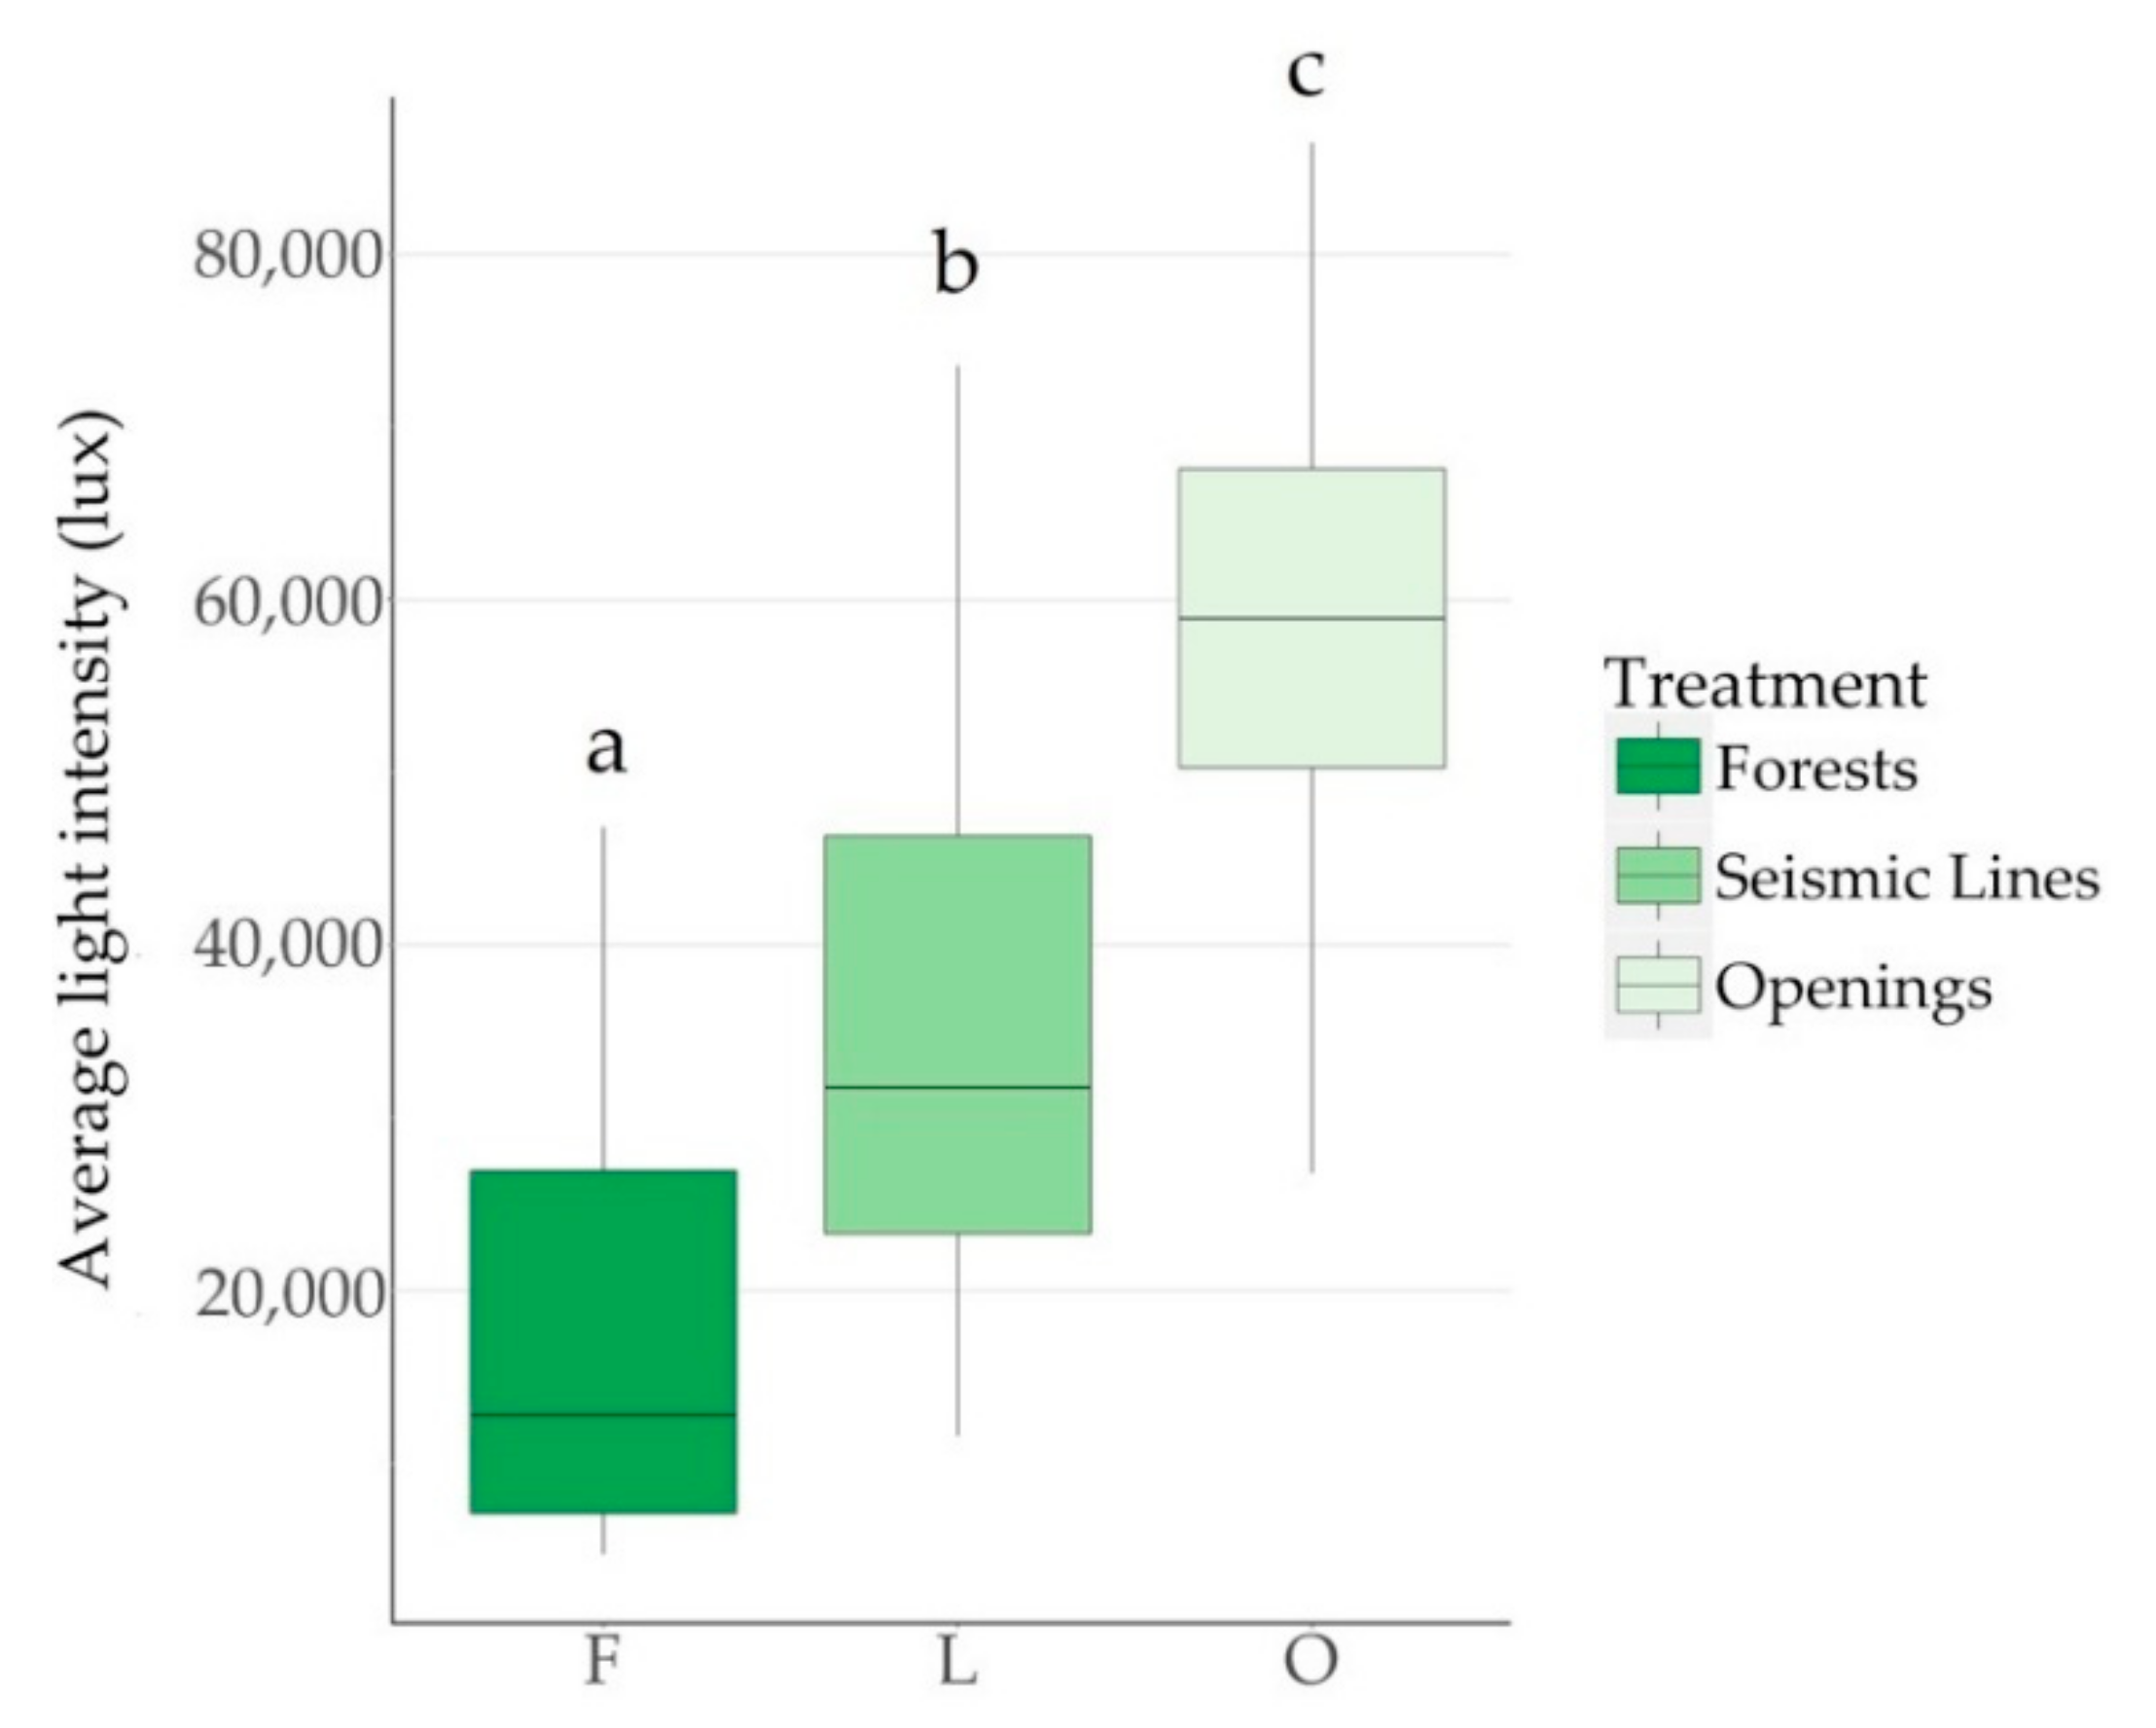
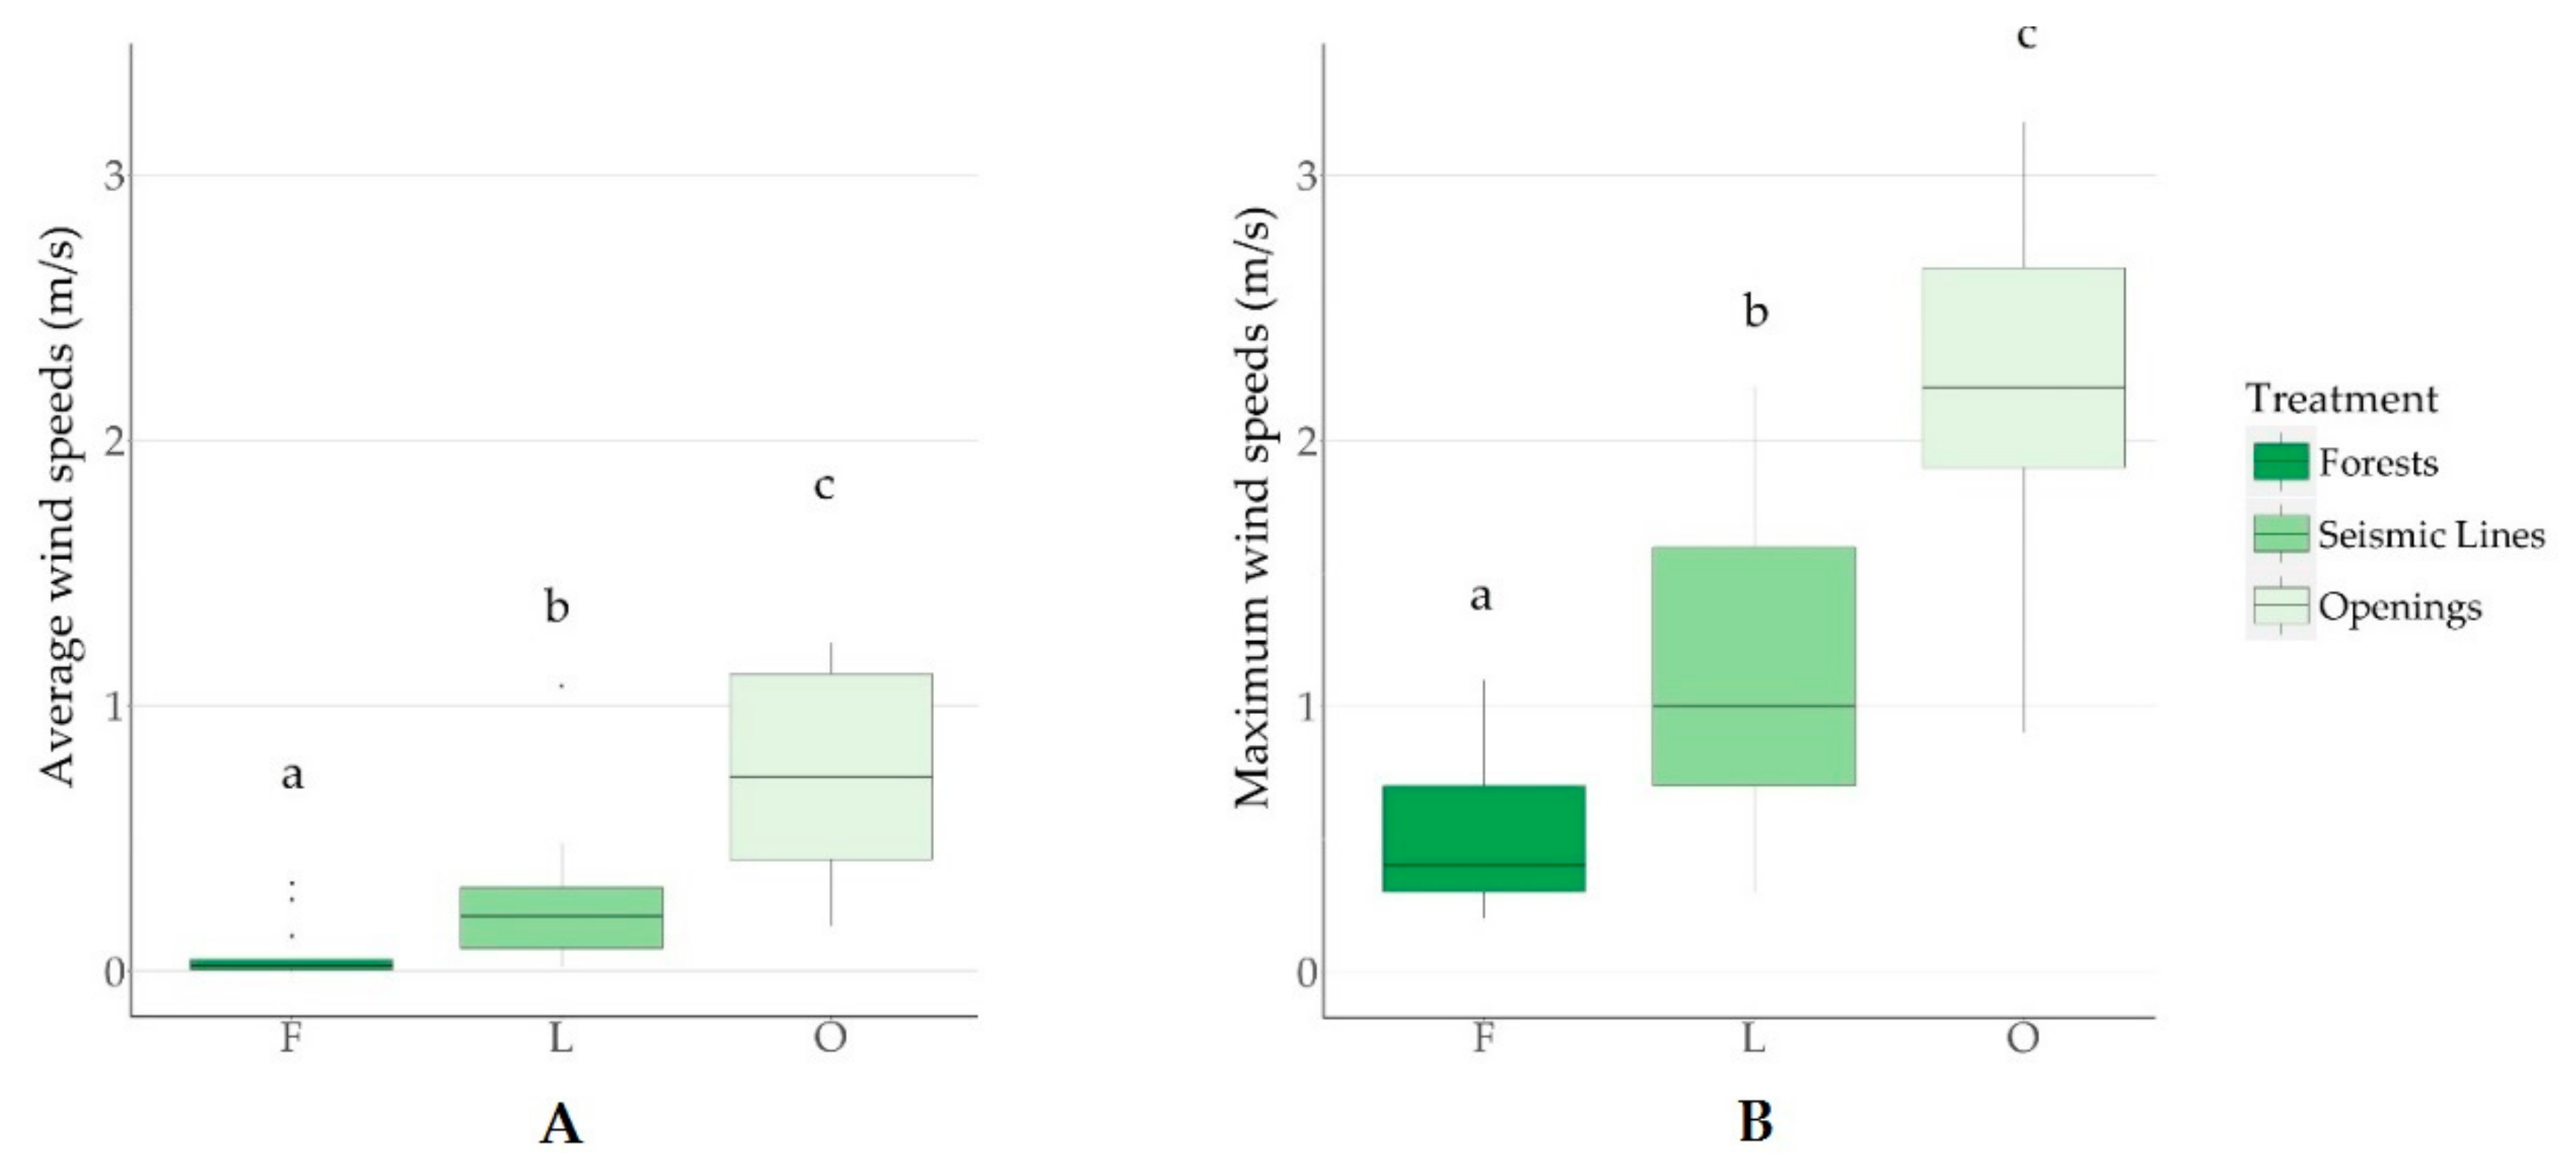
Forest disturbances associated with in situ oil sands exploration altered local environmental patterns of wind and light. Both seismic lines and well pads had a strong positive effect on light intensity, average wind speed, and maximum wind speed. On average the forest “dissection” [6] (fragmentation) associated with these seismic line corridors doubled light intensity and maximum wind speed, while average wind speed was three times higher. Concurrently, exploratory well pads had approximately three times more light, 16 times higher average wind speed, and four times faster maximum wind than forests. The size of the well pad openings did not affect wind and light patterns, suggesting that a 60 × 60 m gap (smallest reference opening used in the study) is larger than a hypothetical “gap threshold”, after which the increase in light intensity and wind speed plateaus. Therefore, our results suggest that forest fragmentation associated with in situ oil sands exploration affects abiotic conditions (i.e., light intensity and wind speed) across a wide area of boreal forests, with even narrow seismic lines altering light and wind patterns. When focusing on the different characteristics of seismic line corridors, we found that light conditions within lines was best explained by a model including the interaction of gap width, canopy height, and line orientation. Lines oriented along an east-to-west axis had 22% greater average light intensity than lines oriented along a north-to-south axis. This concurs with our expectation as east-west lines are parallel to the path of the sun, such that the sun is less obstructed by canopy than in north-south lines. While gap width alone did not have a significant effect on light intensity, when interacting with canopy height the effect was significant. Thus, when canopy heights are tall and highly obstructive to sunlight, the width of the linear feature becomes a more important factor in explaining sunlight conditions along lines.
The result that seismic lines in the east-west direction are exposed to more light may contribute to explaining why van Rensen et al. (2015) [10] identified increases in tree regeneration on east-west lines. The implications of these patterns in light intensity may be important not only for plants, but also for ectotherm organisms (e.g., insects). For instance, butterfly assemblages and behaviors have been shown to respond to these differences in anthropogenic disturbances [22,23] with similar responses also expected for other insects (e.g., Schultz 1998 [32]). While the main response of these taxa to seismic lines is likely due to changes in habitat structure and composition, investigating the thermal ecology of species may reveal changes in species behavior and fitness, as well as more broadly in ecosystem processes and services (e.g., pollination [33]).
To understand the complex nature of wind dynamics, we separated wind into maximum and average values over 24-h periods. Specific wind characteristics influence various processes: average wind speed could gradually reduce soil moisture [34], while maximum wind speed may affect dispersal of plant and animal species, as well as animal behavior and species interactions [19,35]. Notably, extreme maximum wind speeds can reduce canopy cover and increase tree mortality [36], particularly in fragmented forests with more edges [
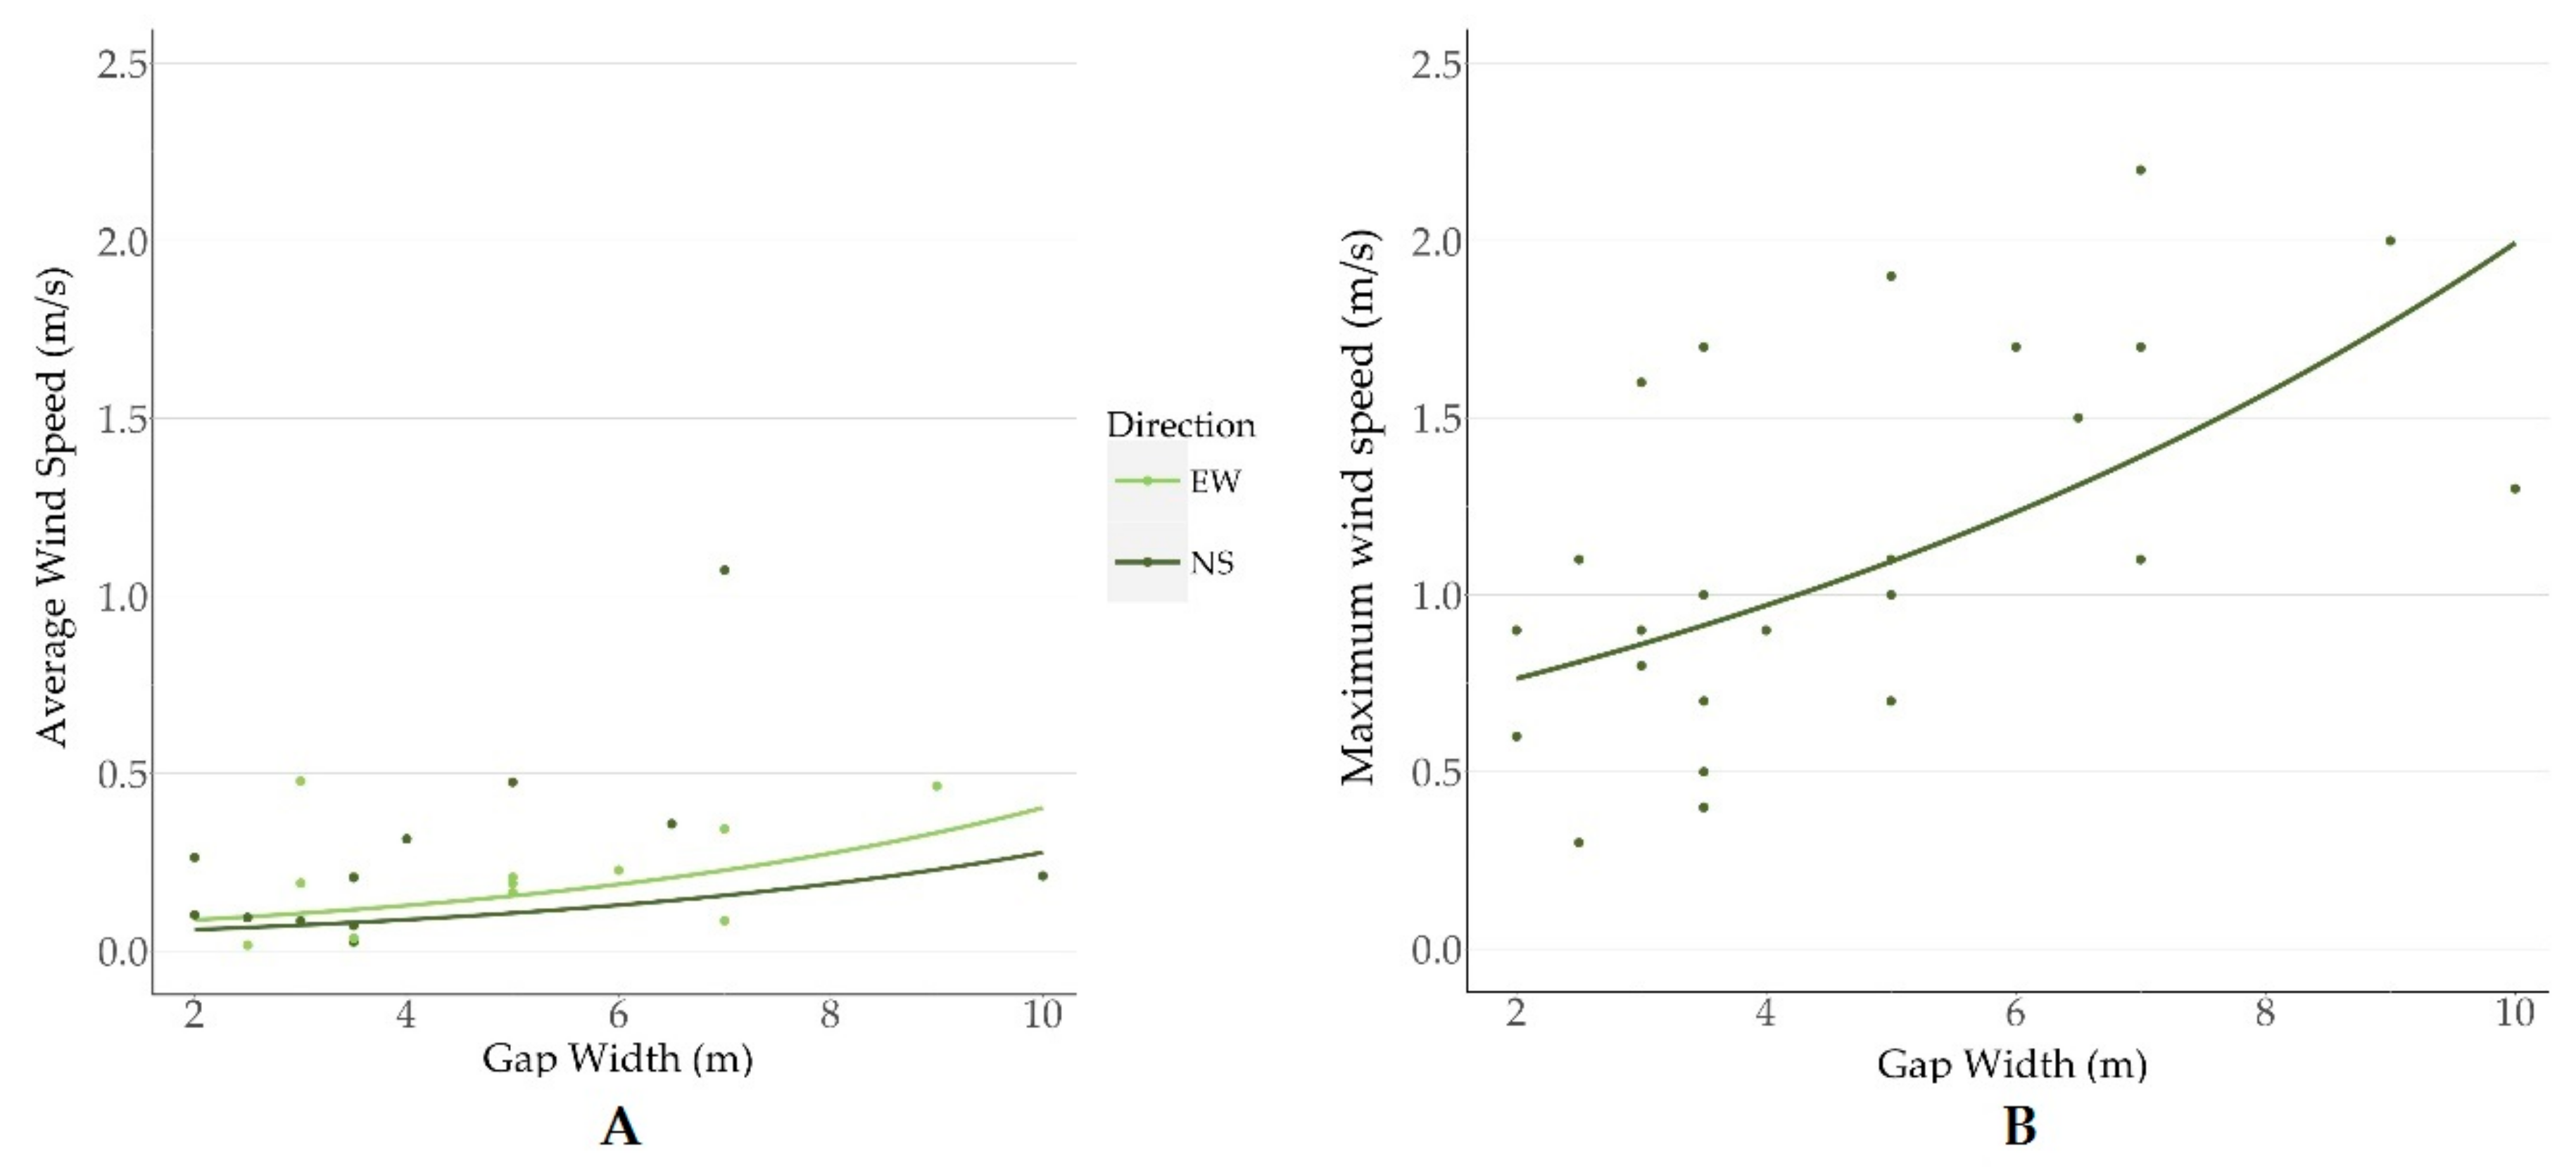
37]. Gap width was important in explaining wind conditions regardless of forest structure (i.e., canopy height). This suggests that, despite a minor structural difference, even seismic lines cleared across short forests elicit changes in wind dynamics analogous to those produced by seismic lines in taller forests. Specifically, the most supported model explaining average wind speed included line orientation and gap width as explanatory variables. We found that lines oriented along a north-to-south axis had 1.5 greater average wind speeds than those oriented east-to-west. This result was unexpected given the prevailing westerly winds in the region. Given the narrow time frame under which data were collected and the stochastic nature of wind dynamics, which vary between days and during the season, this result can be attributed to short-term wind patterns at the time of sampling. Consistently, gap width also had a positive effect on the maximum wind speed in these dissected forests. Maximum wind speeds were best explained by gap width alone, also suggesting that wind direction varied during our sampling sessions. The most supported model predicted that wide gaps (10 m) had 2.7 times faster maximum wind speeds than narrow gaps (2 m). Overall, these results corroborate those of Roberts et al. (2018) who found that wind speeds were 7 times higher on seismic lines than in forests, which led to seed dispersal that was 4 times farther in these linear features than in forests [16].
Our finding that average wind speed was affected by direction of the linear disturbance was also consistent with Damschen [19], who found that wind direction interacts with the orientation of structures originated by forest fragmentation. Therefore, seismic lines are acting as landscape features not only by directing animals that can respond to a change in forest structure with changes in behavioral (movement) patterns [22,27,28], but also for species (animals and plants) that are dispersed by wind [16]. As average wind speed was higher in seismic lines, these features may also be affecting other abiotic conditions including the moisture regime of these forests [35]. This interaction of behavioral and environmental changes may trigger unexpected and complex patterns of responses in boreal species assemblages, with potential interactive effects of changes in behavior [25] (including movement [27]), habitat suitability [22,38], and species interactions across plant, invertebrates and vertebrates [26].
Limitations restricted the scope of the study. The stochastic nature of weather in the region added to variation in the data, since the time frame over which the data were collected was relatively short and during a period of naturally fluctuating weather (i.e., summer). In particular, the random effect of day-to-day variations accounted for significant variation in average wind speeds. Future confirmation studies should focus on collecting data over a longer time frame and for more sites. A wider selection of gap types could also increase the understanding of these covariations.

5. Conclusions

Our study demonstrated changes in sunlight and wind patterns for disturbances associated with in situ oil sands developments that fragment boreal forests. Although well pads showed the largest change in wind and light compared to reference forests, even narrow seismic line corridors created significant changes in the abiotic environment. Gap width, canopy height, and direction of linear features were all factors that ultimately affected patterns in light intensity and wind speeds. In particular, gap width of seismic lines was the single most important factor for both light and wind conditions. Overall, we demonstrated that not all seismic lines have the same abiotic environment after disturbance, and the persistence of line width as a relevant factor in all our models indicates that reducing gap width is an important mitigation strategy that needs to be continually emphasized. Seismic lines should be created with the intention of minimizing their width and the correlated changes in the light and wind environment, to reduce the magnitude of potential edge effects. Reductions in seismic line width are the current best management practice used to mitigate oil sands exploration [26]. This work supports the use of that practice in minimizing the effects of those disturbances.

Supplementary Materials

The following are available online at https://www.mdpi.com/1999-4907/9/8/486/s1.

Author Contributions

E.R.S. and S.E.N. conceived and designed the experiments; E.R.S. performed the experiments; E.R.S. and F.R. analyzed the data; S.E.N. contributed reagents/materials/analysis tools; E.R.S. wrote the paper with assistance from S.E.N. and F.R.

Funding

Funding was supported by COSIA (CRDPJ 498955), Alberta Innovates – Energy and Environmental Solutions (ABIEES 2070), Alberta Agriculture and Forestry (15GRFFM12), and the Natural Sciences and Engineering Research Council of Canada (NSERC) Collaborative Research and Development (CRD) grant (498955-16), as well as an Undergraduate Student Research Award from NSERC to E.R.S.

Acknowledgments

We would like to thank Ashley Hillman of the Applied Conservation Ecology Lab in the Department of Renewable Resources at University of Alberta for supervising and coordinating the fieldwork for the study, Shaugn Coggins of the Department of Renewable Resources at the University of Alberta for assisting with the fieldwork, and Richard Stern of the Department of Earth and Atmospheric Sciences at the University of Alberta for manuscript edits and providing and constructing experimental materials.

Conflicts of Interest

The authors declare no conflict of interest.

Appendix A

Table A1, Table A2 and Table A3 contain supporting information on model selection of variables used to explain light intensity (A1) or wind speed (A2–A3) relationships on seismic lines using Akaike Information Criteria (AIC).
Table A1. Generalized Linear Mixed Models for average light intensity along seismic lines. Models reflect combinations of canopy height, gap width, and line orientation. Results are in ascending order of AIC weight. Number of parameters (k), delta AIC, and likelihood of the model as Akaike weighs (wi) are reported.
Average Light Intensity (Lux)
ModelkAIC∆AICwi
Canopy Height × Gap Width + Direction7550.400.264
Canopy Height × Gap Width6551.10.70.186
Canopy Height + Direction5551.30.90.168
Canopy Height + Gap Width + Direction6552.62.20.088
Canopy Height4553.32.90.062
Canopy Height × Direction6553.32.90.062
Canopy Height + Gap Width5554.23.80.040
Canopy Height × Direction + Gap Width7554.54.10.034
Gap Width × Direction + Canopy Height7554.54.10.034
Direction4555.95.50.017
Gap Width + Direction5556.15.70.015
Null3556.56.10.013
Gap Width4556.76.30.011
Gap Width × Direction65587.60.006
Table A2. Generalized Linear Mixed Models for average wind speed along seismic lines. Models with combinations of canopy height, gap width, and line orientation that are more supported than the null model are shown here. Model results are in ascending order of AIC weight. Number of parameters (k), delta AIC, and likelihood of the model based on Akaike weights (wi) are reported.
Average Wind Speed (m/s)
ModelkAIC∆AICwi
Gap Width + Direction5−28.900.136
Gap Width4−28.50.40.111
Canopy Height4−28.30.60.101
Null3−280.90.087
Canopy Height + Direction5−280.90.087
Canopy Height + Gap Width + Direction6−280.90.087
Canopy Height + Gap Width5−27.81.10.078
Direction4−27.61.30.071
Gap Width × Direction6−26.920.050
Canopy Height × Gap Width + Direction7−26.920.050
Canopy Height × Gap Width6−26.42.50.039
Canopy Height × Direction6−26.32.60.037
Canopy Height × Direction + Gap Width7−26.22.70.035
Gap width × Direction + Canopy Height7−262.90.032
Table A3. Generalized Linear Mixed Models for maximum wind speed along seismic lines. All possible combinations of canopy height, gap width, and direction were modeled, with models more supported than the null model shown. Results are showing in ascending order of AIC weight. Number of parameters (k), delta AIC, and likelihood of the model based on Akaike weights (wi) are reported.
Maximum Wind Speed (m/s)
ModelkAIC∆AICwi
Gap Width435.300.260
Canopy Height + Gap Width536.61.30.136
Gap Width + Direction5371.70.111
Canopy Height × Gap Width637.11.80.106
Null337.82.50.075
Canopy Height + Gap Width + Direction638.43.10.055
Canopy Height × Gap Width + Direction738.73.40.048
Canopy Height438.83.50.045
Gap Width × Direction638.83.50.045
Gap Width × Direction + Canopy Height738.83.50.045
Direction439.74.40.029
Canopy Height × Direction + Gap Width740.45.10.020
Canopy Height + Direction540.75.40.018
Canopy Height × Direction642.77.40.006

References

  1. Fahrig, L. Ecological responses to habitat fragmentation per se. Annu. Rev. Ecol. Evol. Syst. 2017, 48, 1–23. [Google Scholar] [CrossRef]
  2. Haddad, N.M.; Hudgens, B.; Damschen, E.I.; Levey, D.J.; Orrock, J.L.; Tewksbury, J.J.; Weldon, A.J. Assessing positive and negative ecological effects of corridors. In Sources, Sinks, and Sustainability; Liu, J., Hull, V., Morzillo, A.T., Wiens, J.A., Eds.; Cambridge University Press: Cambridge, UK, 2011; pp. 475–503. [Google Scholar]
  3. Murcia, C. Edge effects in fragmented forests: implications for conservation. Trends Evol. Ecol. 1994, 10, 58–62. [Google Scholar] [CrossRef]
  4. Riiters, K.; Wickham, J.; O’Niell, R.; Jones, B.; Smith, E. Global scale patterns of forest fragmentation. Ecol. Soc. 2000, 4, 1–29. [Google Scholar] [CrossRef]
  5. Saunders, D.A.; Hobbs, R.J.; Margules, C.M. Biological consequences of ecosystem fragmentation: a review. Conserv. Biol. 1991, 5, 18–32. [Google Scholar] [CrossRef]
  6. Jaeger, J.A.G. Landscape division, splitting index, and effective mesh size: New measures of landscape fragmentation. Landsc. Ecol. 2000, 15, 115–130. [Google Scholar] [CrossRef]
  7. Harper, K.A.; Macdonald, S.E.; Burton, R.J.; Chen, J.; Brosofske, K.D.; Saunders, S.C.; Euskirchen, E.S.; Roberts, D.; Jaiteh, M.S.; Esseen, P.A. Edge influence on forest structure and composition in fragmented landscapes. Conserv. Biol. 2005, 19, 768–782. [Google Scholar] [CrossRef]
  8. Dabros, A.; Hammond, H.E.J.; Pinzon, J.; Pinno, B.; Langor, D. Edge influence of low impact seismic lines for oil exploration on upland forest vegetation in northern Alberta (Canada). For. Ecol. Manag. 2017, 400, 278–288. [Google Scholar] [CrossRef]
  9. Brandt, J.P. The extent of the North American boreal zone. Environ. Rev. 2009, 17, 101–161. [Google Scholar] [CrossRef]
  10. Van Rensen, C.K.; Nielsen, S.E.; White, B.; Vinge, T.; Lieffers, V.J. Natural regeneration of forest vegetation on legacy seismic lines in boreal habitats in Alberta’s oil sands region. Biol. Conserv. 2015, 184, 127–135. [Google Scholar] [CrossRef]
  11. Sherrif, R.E.; Geldart, L.P. Introduction. In Exploration Seismology: History, Theory, and Data Acquisition; Sheriff, R.E., Geldart, L.P., Eds.; Cambridge University Press: Cambridge, UK, 1995; pp. 1–11. [Google Scholar]
  12. Lee, P.; Boutin, S. Persistence and developmental transition of wide seismic lines in the western Boreal Plains of Canada. J. Environ. Manag. 2005, 78, 240–250. [Google Scholar] [CrossRef] [PubMed]
  13. Farwig, N.; Bohning-Gase, K.; Bleher, B. Enhanced seed dispersal of Prunus africana in fragmented and disturbed forests? Plant Anim. Interact. 2006, 147, 238–252. [Google Scholar] [CrossRef] [PubMed]
  14. Bacles, C.F.E.; Lowe, A.J.; Ennos, R.A. Effective seed dispersal across a fragmented landscape. Science 2006, 311, 628. [Google Scholar] [CrossRef] [PubMed]
  15. Van Dorp, D.; van den Hoek, W.P.M.; Daleboudt, C. Seed dispersal capacity of six perennial grassland species measured in a wind tunnel at varying wind speed and height. Can. J. Bot. 1996, 74, 1956–1963. [Google Scholar] [CrossRef]
  16. Roberts, D.; Ciuti, S.; Barber, Q.E.; Willier, C.; Nielsen, S.E. Accelerated seed dispersal along linear disturbances in the Canadian oil sands region. Sci. Rep. 2018, 8, 4828. [Google Scholar] [CrossRef] [PubMed]
  17. Hobbs, R.J. The nature and effects of disturbance relative to invasions, Chapter 19. In Biological Invasions: A Global Perspective; Castri, F., Croves, R.H., Kruger, F.J., Rejmnek, M., Williamson, M., Drake, J.A., Mooney, H.A., Eds.; Wiley: New York, NY, USA, 1989; pp. 389–400. [Google Scholar]
  18. Haddad, N.M.; Brudvig, L.A.; Damschen, E.I.; Evans, D.M.; Johnson, B.L.; Levey, D.J.; Orrock, J.L.; Resasco, J.; Sullivan, L.L.; Tewksbury, J.J.; et al. Potential negative ecological effects of corridors. Conserv. Biol. 2014, 28, 1178–1187. [Google Scholar] [CrossRef] [PubMed]
  19. Damschen, E.I.; Baker, D.V.; Bohrer, G.; Nathan, R.; Orrock, J.L.; Turner, J.R.; Brudvig, L.A.; Haddad, N.M.; Levey, D.J.; Tewksury, J.T. How fragmentation and corridors affect wind dynamics and seed dispersal in open habitats. Proc. Natl. Acad. Sci. USA 2014, 111, 3484–4389. [Google Scholar] [CrossRef] [PubMed]
  20. Sanderson, L.A.; McLaughlin, J.A.; Antunes, P.M. The last great forest: A review of the status of invasive species in the North American boreal forest. Forestry 2012, 85, 329–340. [Google Scholar] [CrossRef]
  21. Resasco, J.; Haddad, N.M.; Orrock, J.L.; Shoemaker, D.; Brudvig, L.A.; Damschen, E.I.; Tewksbury, J.J.; Levey, D.J. Landscape corridors can increase invasion by an exotic species and reduce diversity of native species. Ecology 2014, 95, 2033–2039. [Google Scholar] [CrossRef] [PubMed] [Green Version]
  22. Riva, F.; Acorn, J.H.; Nielsen, S.E. Narrow anthropogenic corridors direct the movement of a generalist butterfly. Biol. Lett. 2018, 14, 20170770. [Google Scholar] [CrossRef] [PubMed]
  23. Riva, F.; Acorn, J.H.; Nielsen, S.E. Localized disturbances from oil sands developments increase butterfly diversity and abundance in Alberta’s boreal forest. Biol. Conserv. 2018, 217, 173–180. [Google Scholar] [CrossRef]
  24. Bayne, E.M.; Boutin, S.; Tracz, B.; Charest, K. Functional and numerical responses of ovenbirds (Seiurus aurocapilla) to changing seismic exploration practices in Alberta’s boreal forest. Ecoscience 2005, 12, 216–222. [Google Scholar] [CrossRef]
  25. Machtans, C.S. Songbird response to seismic lines in the western boreal forest: A manipulative experiment. Can. J. Zool. 2006, 84, 1421–1430. [Google Scholar] [CrossRef]
  26. Dabros, A.; Pyper, M.; Castilla, G. Seismic lines in the boreal and arctic ecosystems of North America: Environmental impacts, challenges, and opportunities. Environ. Rev. 2018, 26, 214–229. [Google Scholar] [CrossRef]
  27. Tigner, J.; Bayne, E.M.; Boutin, S. Black bear use of seismic lines in northern Canada. J. Wildl. Manag. 2014, 78, 282–292. [Google Scholar] [CrossRef]
  28. Dickie, M.; Serrouya, R.; McNay, R.S.; Boutin, S. Faster and farther: Wolf movement on linear features and implications for hunting behaviour. J. Appl. Ecol. 2016, 54, 253–263. [Google Scholar] [CrossRef] [Green Version]
  29. Coops, N.C.; Tompaski, P.; Nijland, W.; Rickbeil, G.J.M.; Nielsen, S.E.; Bater, C.W.; Stadt, J.J. A forest structure habitat index based on an airborne laser scanning data. Ecol. Indic. 2016, 67, 346–357. [Google Scholar] [CrossRef]
  30. Guo, X.; Coops, N.C.; Tomplaski, P.; Nielsen, S.E.; Bater, C.W.; Stadt, J.J. Regional mapping of vegetation structure for biodiversity monitoring using airborne lidar data. Ecol. Indic. 2017, 38, 50–61. [Google Scholar] [CrossRef]
  31. R Development Core Team. R: A Language and Environment for Statistical Computing; R Foundation for Statistical Computing: Vienna, Austria, 2008; ISBN 3-900051-07-0. [Google Scholar]
  32. Schultz, T.D. The utilization of patchy thermal microhabitats by the ectothermic insect predator, Cicindela sexguttata. Ecol. Entomol. 1998, 23, 444–450. [Google Scholar] [CrossRef]
  33. Cao, G.X.; Wu, B.X.; Xu, X.J.; Wang, X.; Yang, C.P. The effects of local variation in light availability on pollinator visitation, pollen and resource limitation of female reproduction in Hosta ventricosa. Bot. Stud. 2017, 58, 24. [Google Scholar] [CrossRef] [PubMed]
  34. Legates, D.R.; Mahmood, R.; Levia, D.F.; DeLiberty, T.L.; Quiring, S.M.; Houser, C.; Nelson, F.E. Soil moisture: A central and unifying theme in physical geography. Prog. Phys. Geogr. 2010, 35, 65–86. [Google Scholar] [CrossRef]
  35. Barton, B.T. Reduced wind strengthens top-down control of an insect herbivore. Ecology 2014, 95, 2375–2381. [Google Scholar] [CrossRef] [Green Version]
  36. Laurence, W.F.; Curran, T.J. Impacts of wind disturbance on fragmented tropical forests: A review and synthesis. Austral Ecol. 2008, 33, 399–408. [Google Scholar] [CrossRef] [Green Version]
  37. Schwartz, N.B.; Uriarte, M.; DeFried, R.; Bedka, K.M.; Fernandes, K.; Gutiérrez-Vélez, V.; Pinedo-Vasquez, P. Fragmentation increases wind disturbance impacts on forest structure and carbon stocks in a western Amazonian landscape. Ecol. Appl. 2017, 27, 1901–1915. [Google Scholar] [CrossRef] [PubMed]
  38. Tigner, J.; Bayne, E.; Boutin, S. American marten respond to seismic lines in northern Canada at two spatial scales. PLoS ONE 2015, 10, e0118720. [Google Scholar] [CrossRef] [PubMed]
Figure 1. Map of the study area in northern Alberta, Canada. Seismic line density (per km2) in the left map, location of Alberta in bottom right, and locations of sample sites in two regions of northeast Alberta in the upper right (Fort McMurray area at top, Cold Lake area in middle).
Forests 09 00486 g001
Figure 2. Box plot of average light intensity (lux) for forests (F), seismic lines (L), and openings (exploratory well pad sites) (O) for 46 sites in northeast Alberta, Canada. Post hoc Tukey tests were used to assess differences between groups with different letters signifying significant differences (p < 0.05).
Forests 09 00486 g002
Figure 3. Boxplots of (A) average wind speed and (B) maximum wind speed in m/s for forests (F), seismic lines (L), and well pad openings (O) across 45 sites in northeast Alberta, Canada. Post hoc Tukey tests were used to assess differences between groups with different letters signifying significant differences (p < 0.05).
Forests 09 00486 g003
Figure 4. Predicted light intensity (Gamma log link) for the most supported model by gap width along either east-to-west (EW) or north-to-south (NS) orientated seismic lines under two canopy heights (10 m and 15 m).
Forests 09 00486 g004
Figure 5. Scatterplots and GLMM model predictions of (A) average windspeed (m/s) by gap (line) width for either east-to-west (EW) or north-to-south (NS) orientated seismic lines; and (B) maximum windspeed by gap width.
Forests 09 00486 g005
Table 1. Mixed effect regression predicting average light intensity (lux) as a function of treatment type using a Gamma model transformation across 46 sites in northeast Alberta, Canada, with model coefficients (β), Standard Error of the coefficients (SE), z-score (z), and significance (p) reported.
TreatmentLight Intensity (Lux)
βSEzp
Intercept (forest)9.7260.16857.840<0.001
Linear gaps (seismic lines)0.7300.1494.910<0.001
Openings (well pads)1.2190.2045.970<0.001
Table 2. Mixed effect regression predicting average and maximum wind speed (m/s) as a function of treatment using a Gamma model transformation for 45 sites in northeast Alberta, Canada. Model coefficients (β), Standard Error of the coefficients (SE), z-score (z), and significance (p) reported.
TreatmentWind Speed (m/s)
βSEzp
Average wind speed (m/s)
  Intercept (forest)−3.1150.379−8.210<0.001
  Linear gaps (seismic lines)1.3930.3064.559<0.001
  Openings (well pads)2.7830.4286.499<0.001
Maximum wind speed (m/s)
  Intercept (forest)−0.6840.156−4.374<0.001
  Linear gaps (seismic lines)0.7350.1484.958<0.001
  Openings (well pads)1.4650.2047.190<0.001
Table 3. Mixed effect regression (Gamma) model explaining light intensity (lux) on seismic lines as a function of canopy height, gap width, line orientation, and canopy height-to-gap width interaction. Model coefficients (β), Standard Error of the coefficients (SE), z-score (z), and significance (p) reported.
TreatmentAverage Light Intensity (lux)
Coef.SEzp
(Intercept)12.1880.67318.112<0.001
Canopy Height−0.2120.074−2.882<0.001
Gap width−0.1990.123−1.6210.105
N-S direction (vs. E-W)−0.2020.117−1.7260.084
Canopy Height × Gap Width0.0300.0142.1060.035
Table 4. Mixed effect regression predicting average and maximum wind speed (m/s) on seismic lines as a function of gap width and direction using a Gamma model transformation. Model coefficients (β), Standard Error of the coefficients (SE), z-score (z), and significance (p) are reported.
TreatmentAverage Wind Speed (m/s)Maximum Wind Speed (m/s)
βSEzpβSEzp
Intercept−2.8180.569−4.950<0.001−0.5160.251−2.0610.039
Gap width0.1910.1031.8540.0640.1240.0502.4600.014
NS direction0.3740.2331.6010.110

