Pedunculate and Sessile Mixed Oak Forest Regeneration Process in Lithuania

Abstract
:1. Introduction
2. Materials and Methods
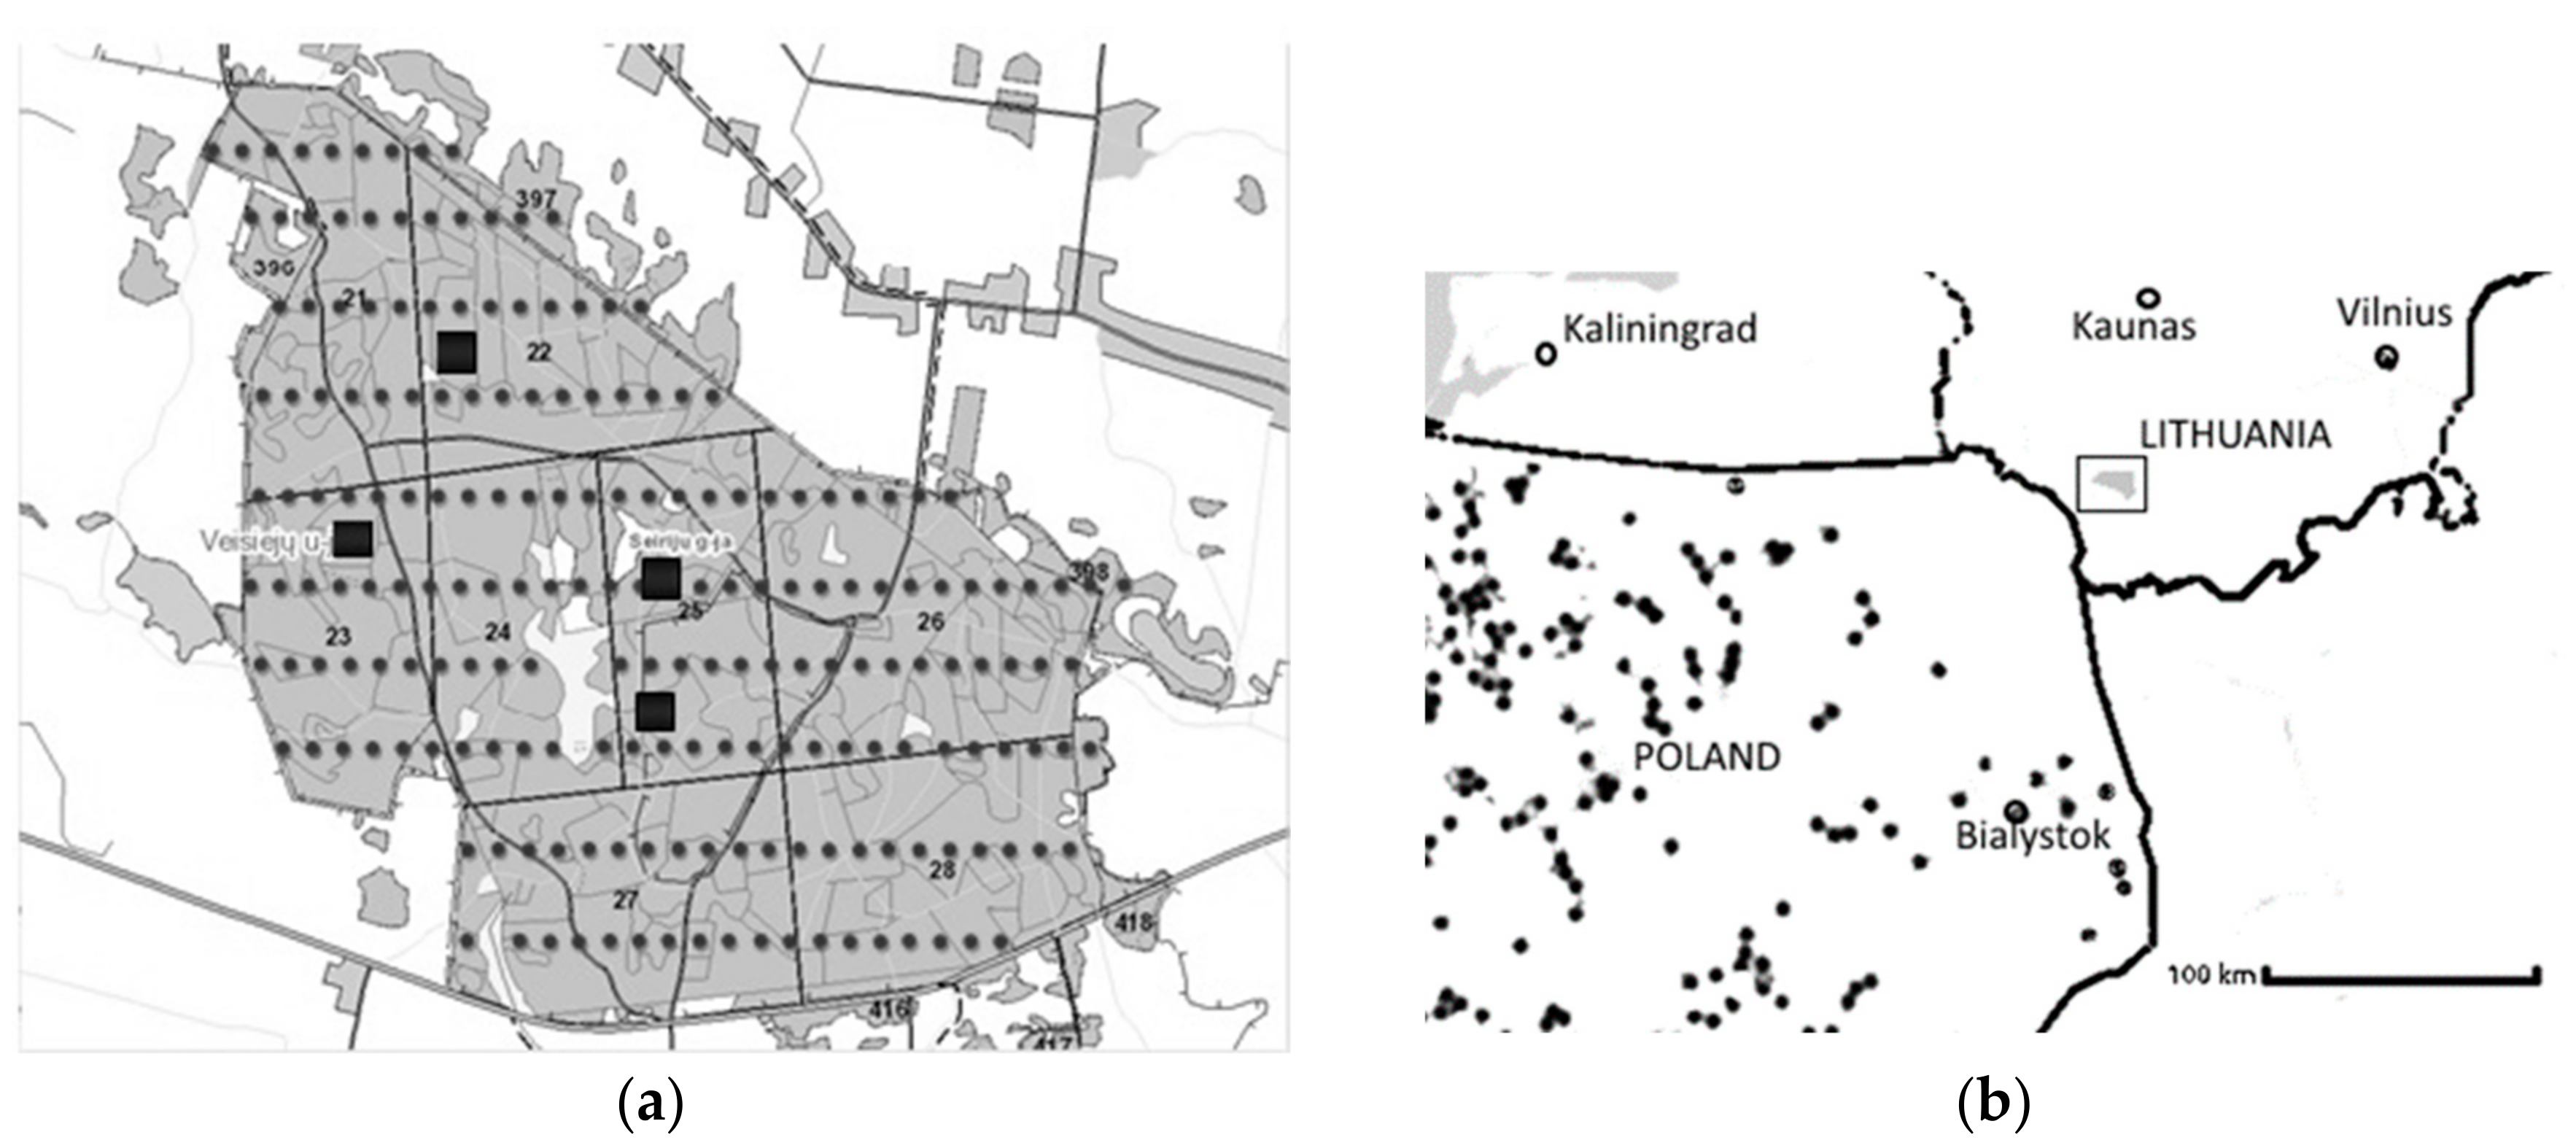
2.1. Stand Description
2.2. Data Analysis
3. Results and Discussion
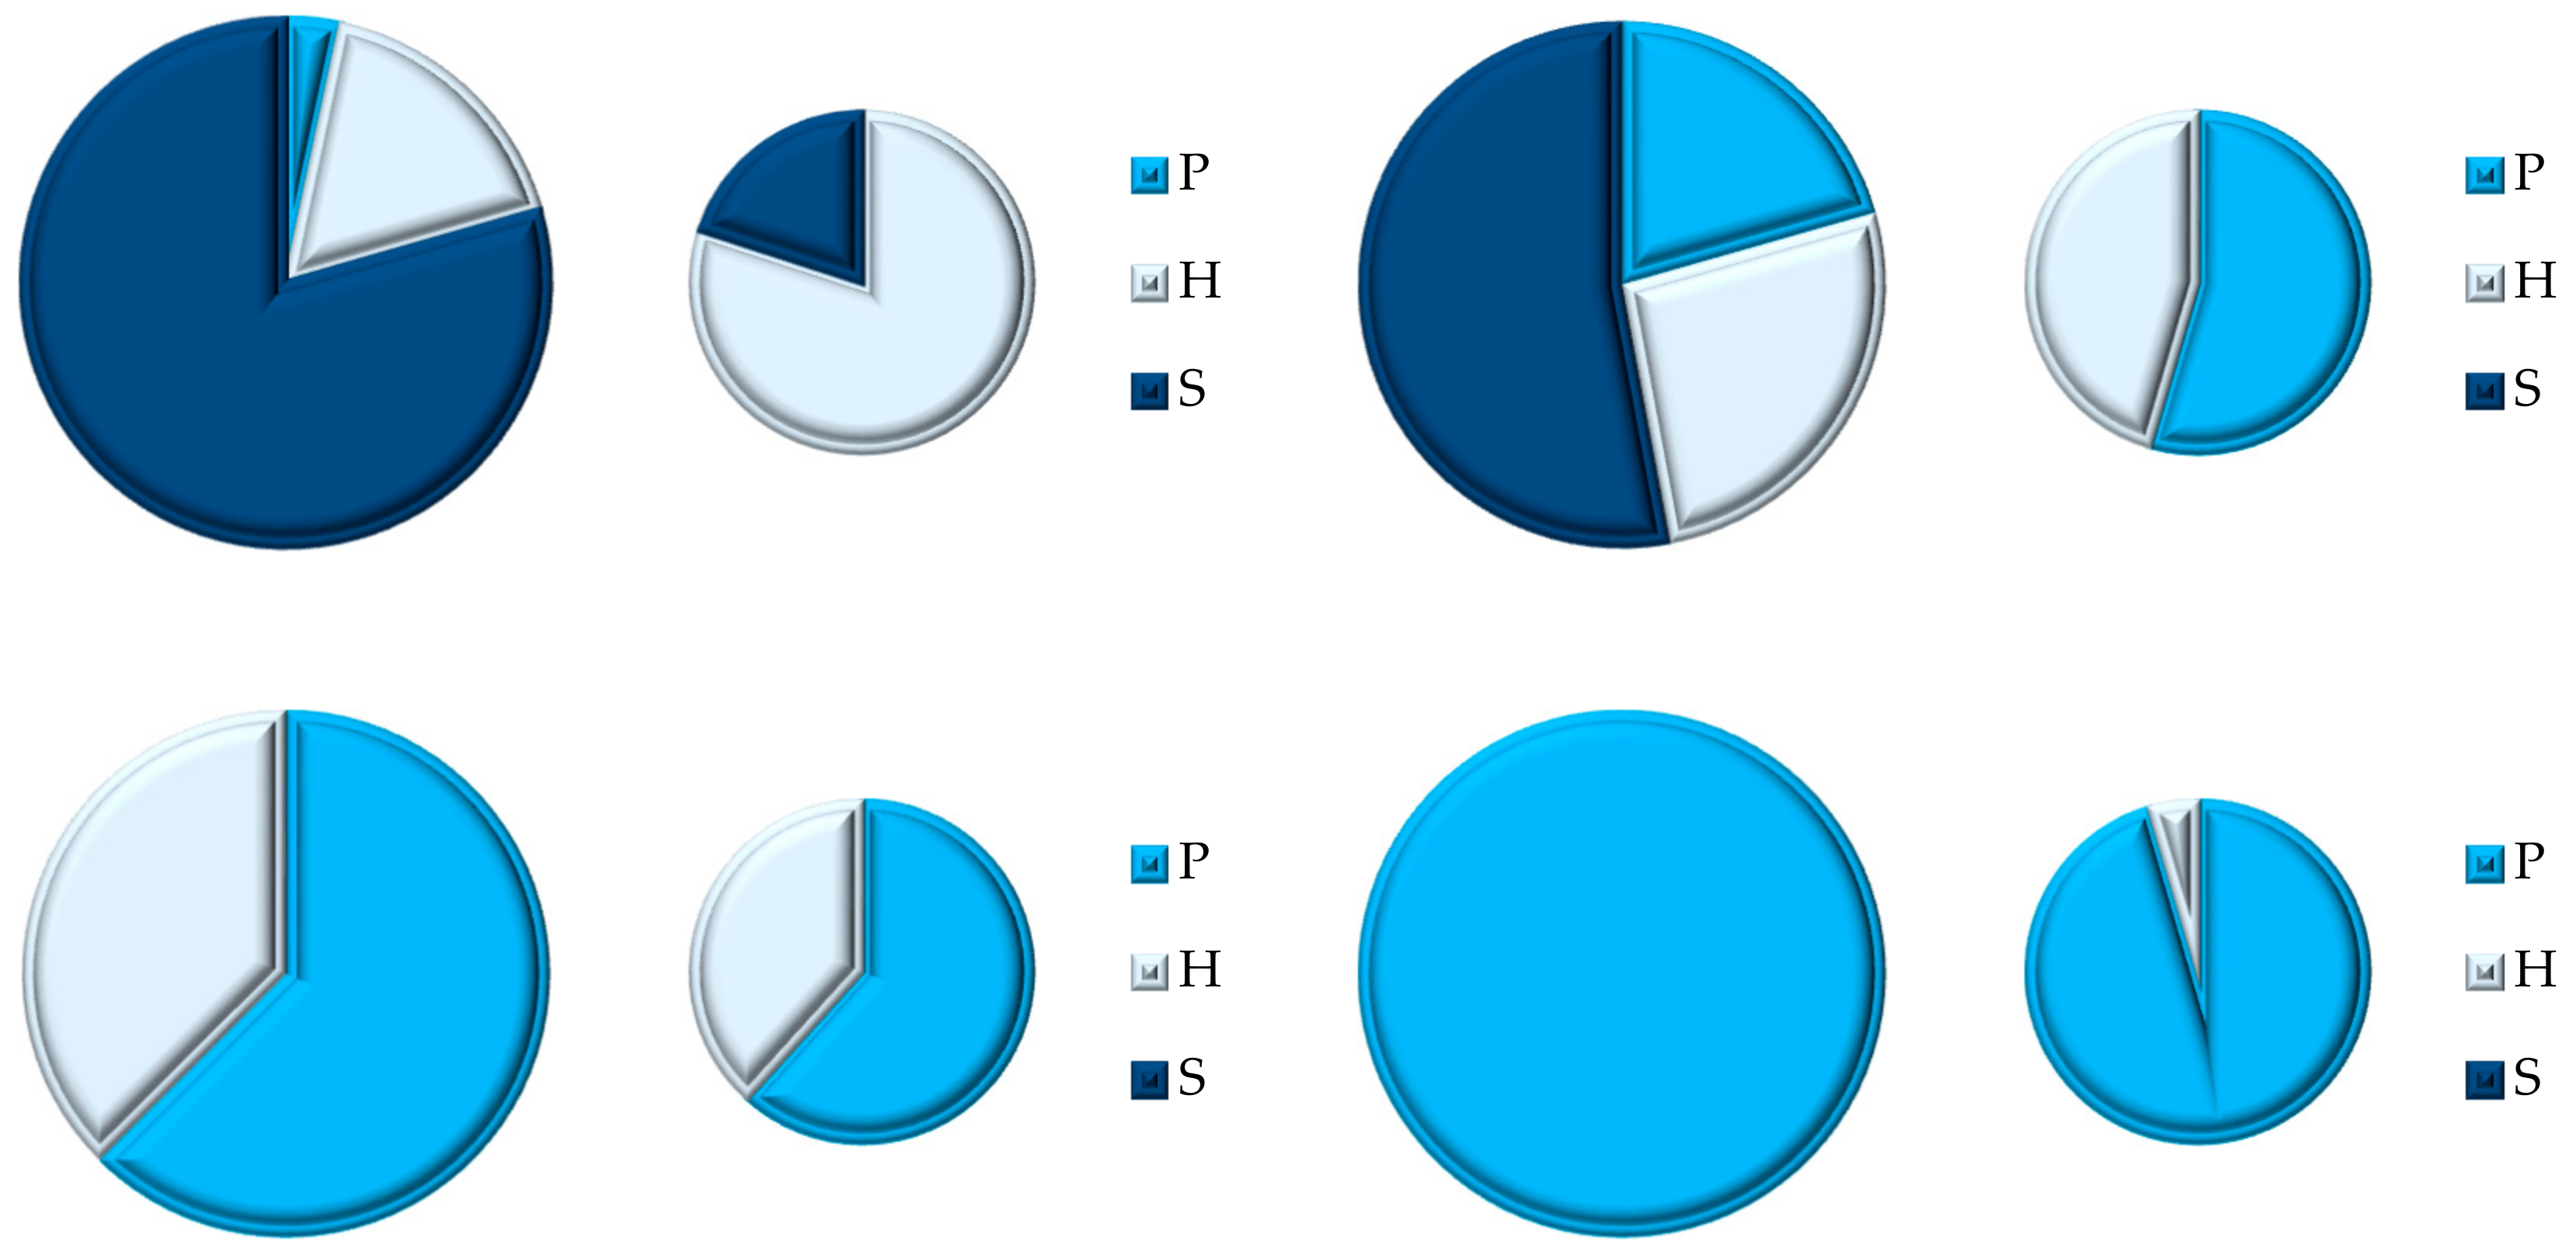
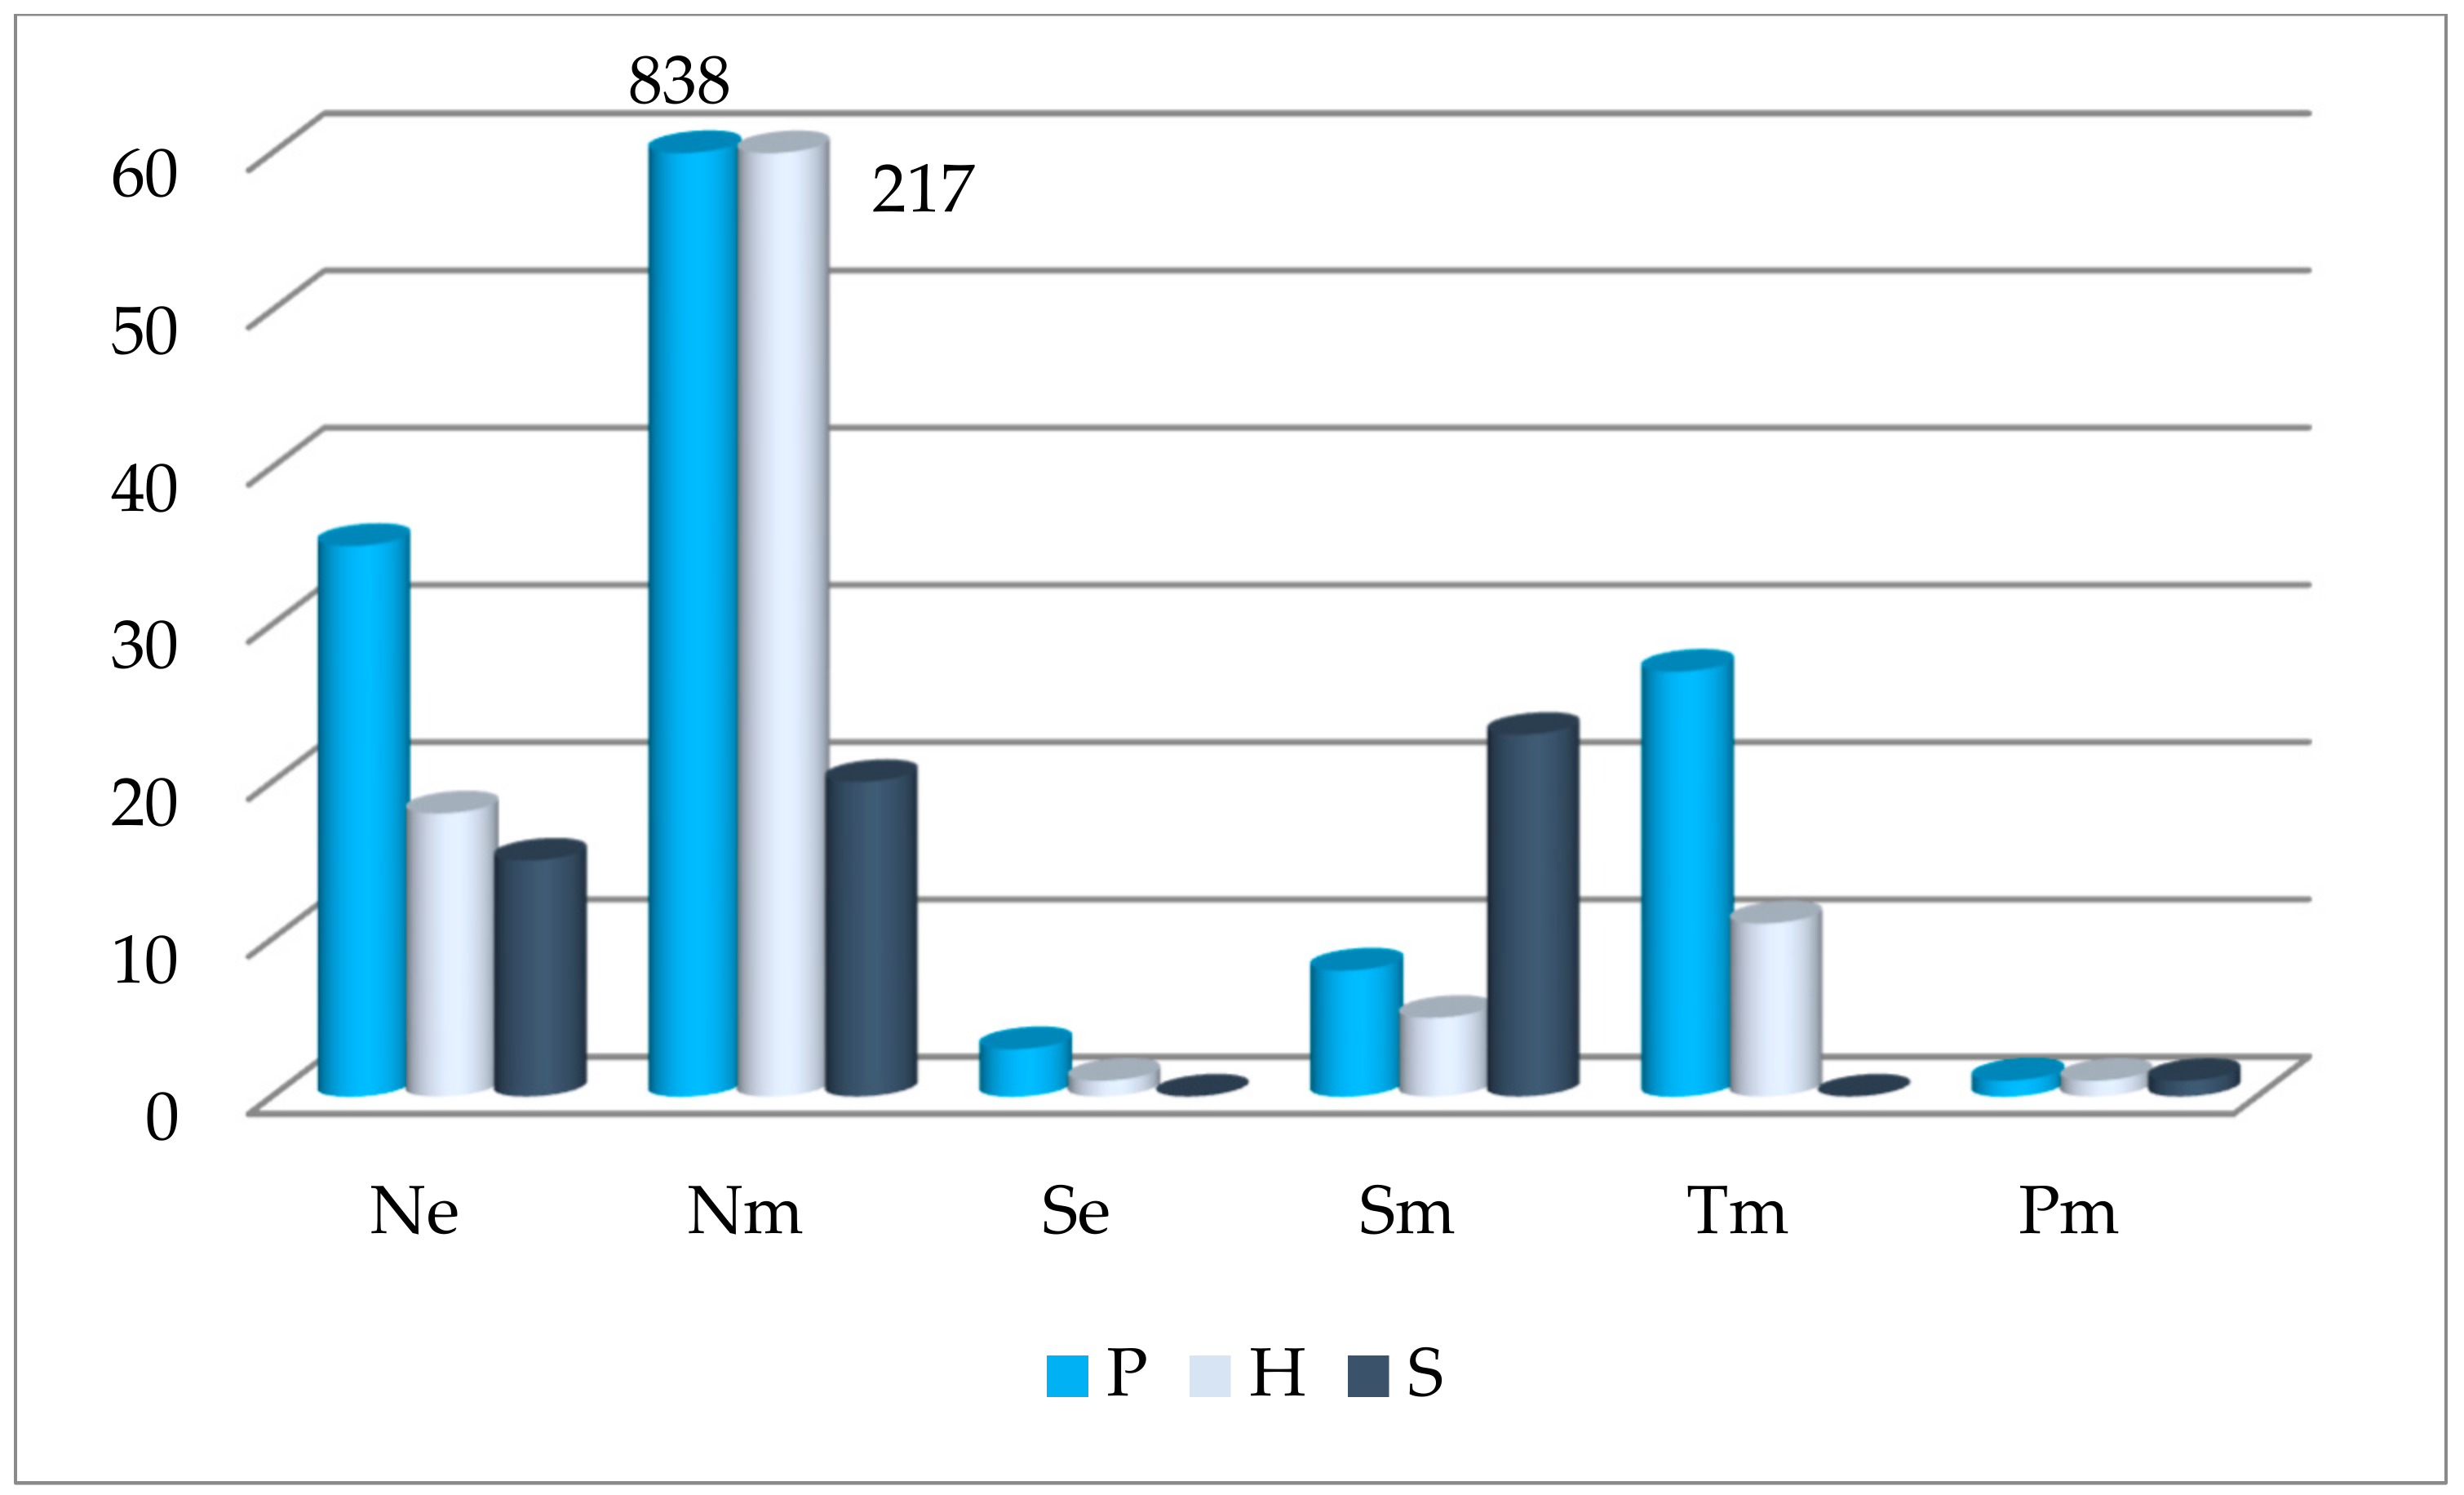
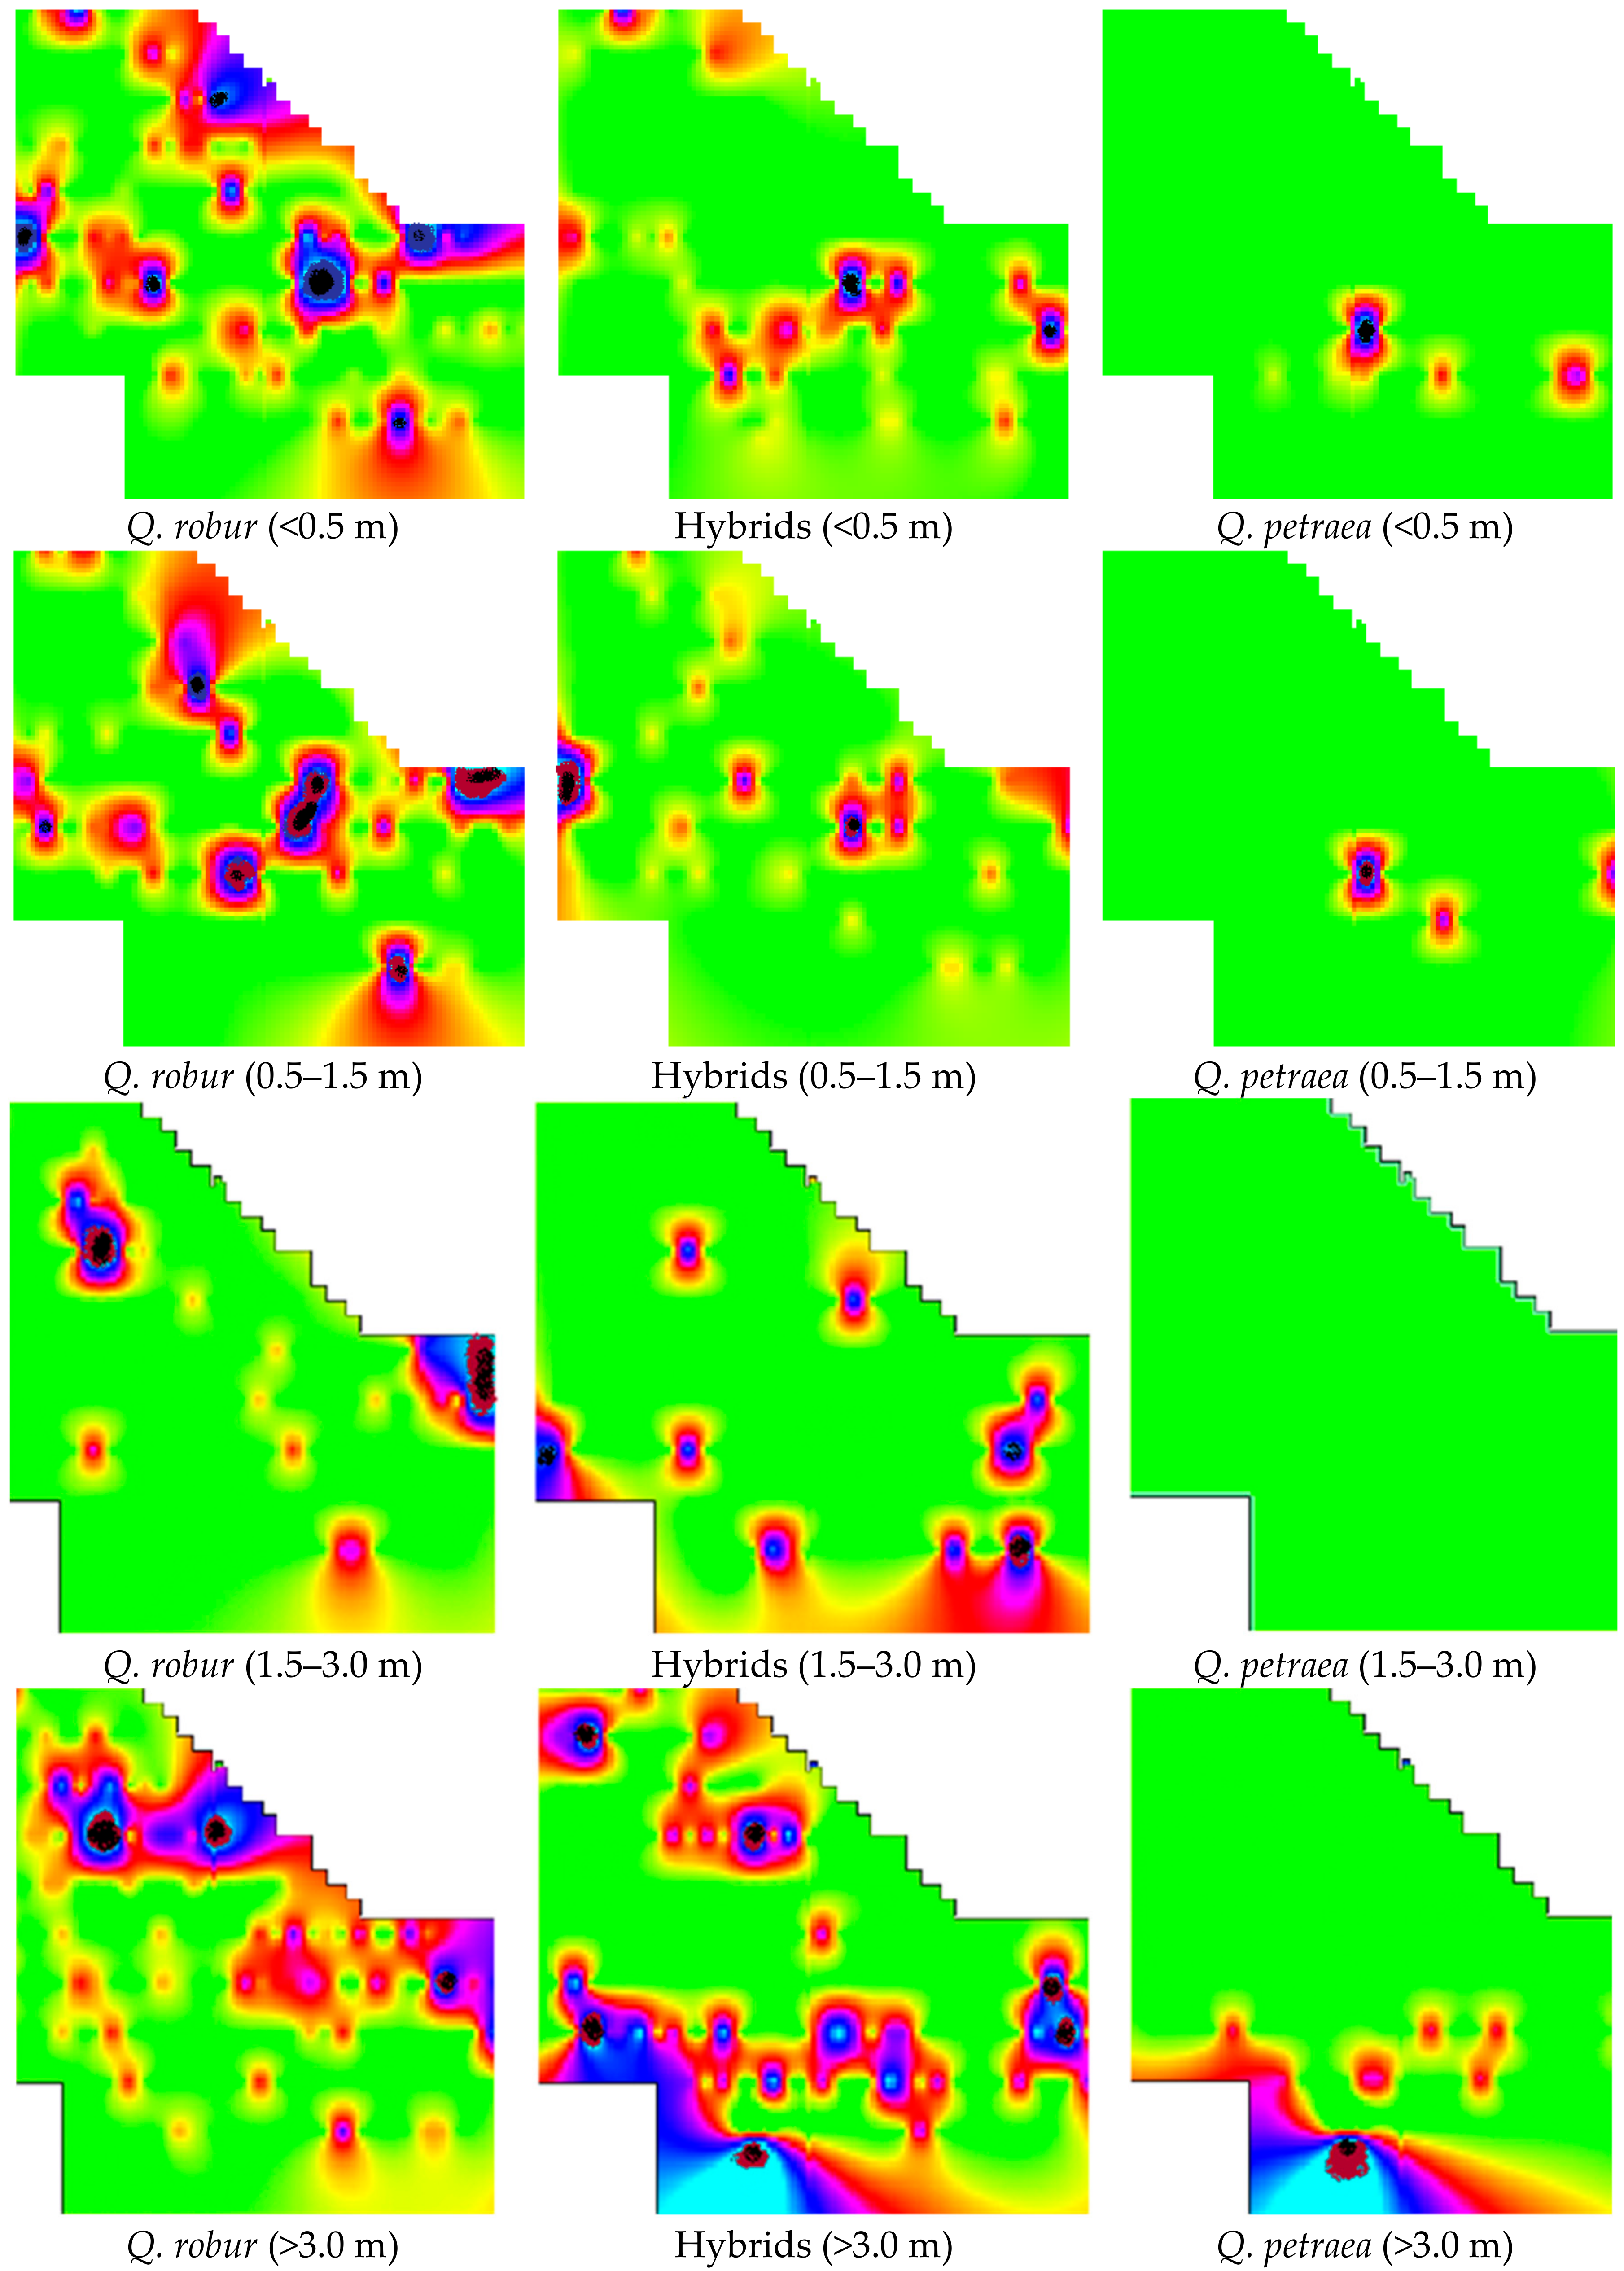
3.1. Spreading of Oak Undergrowth
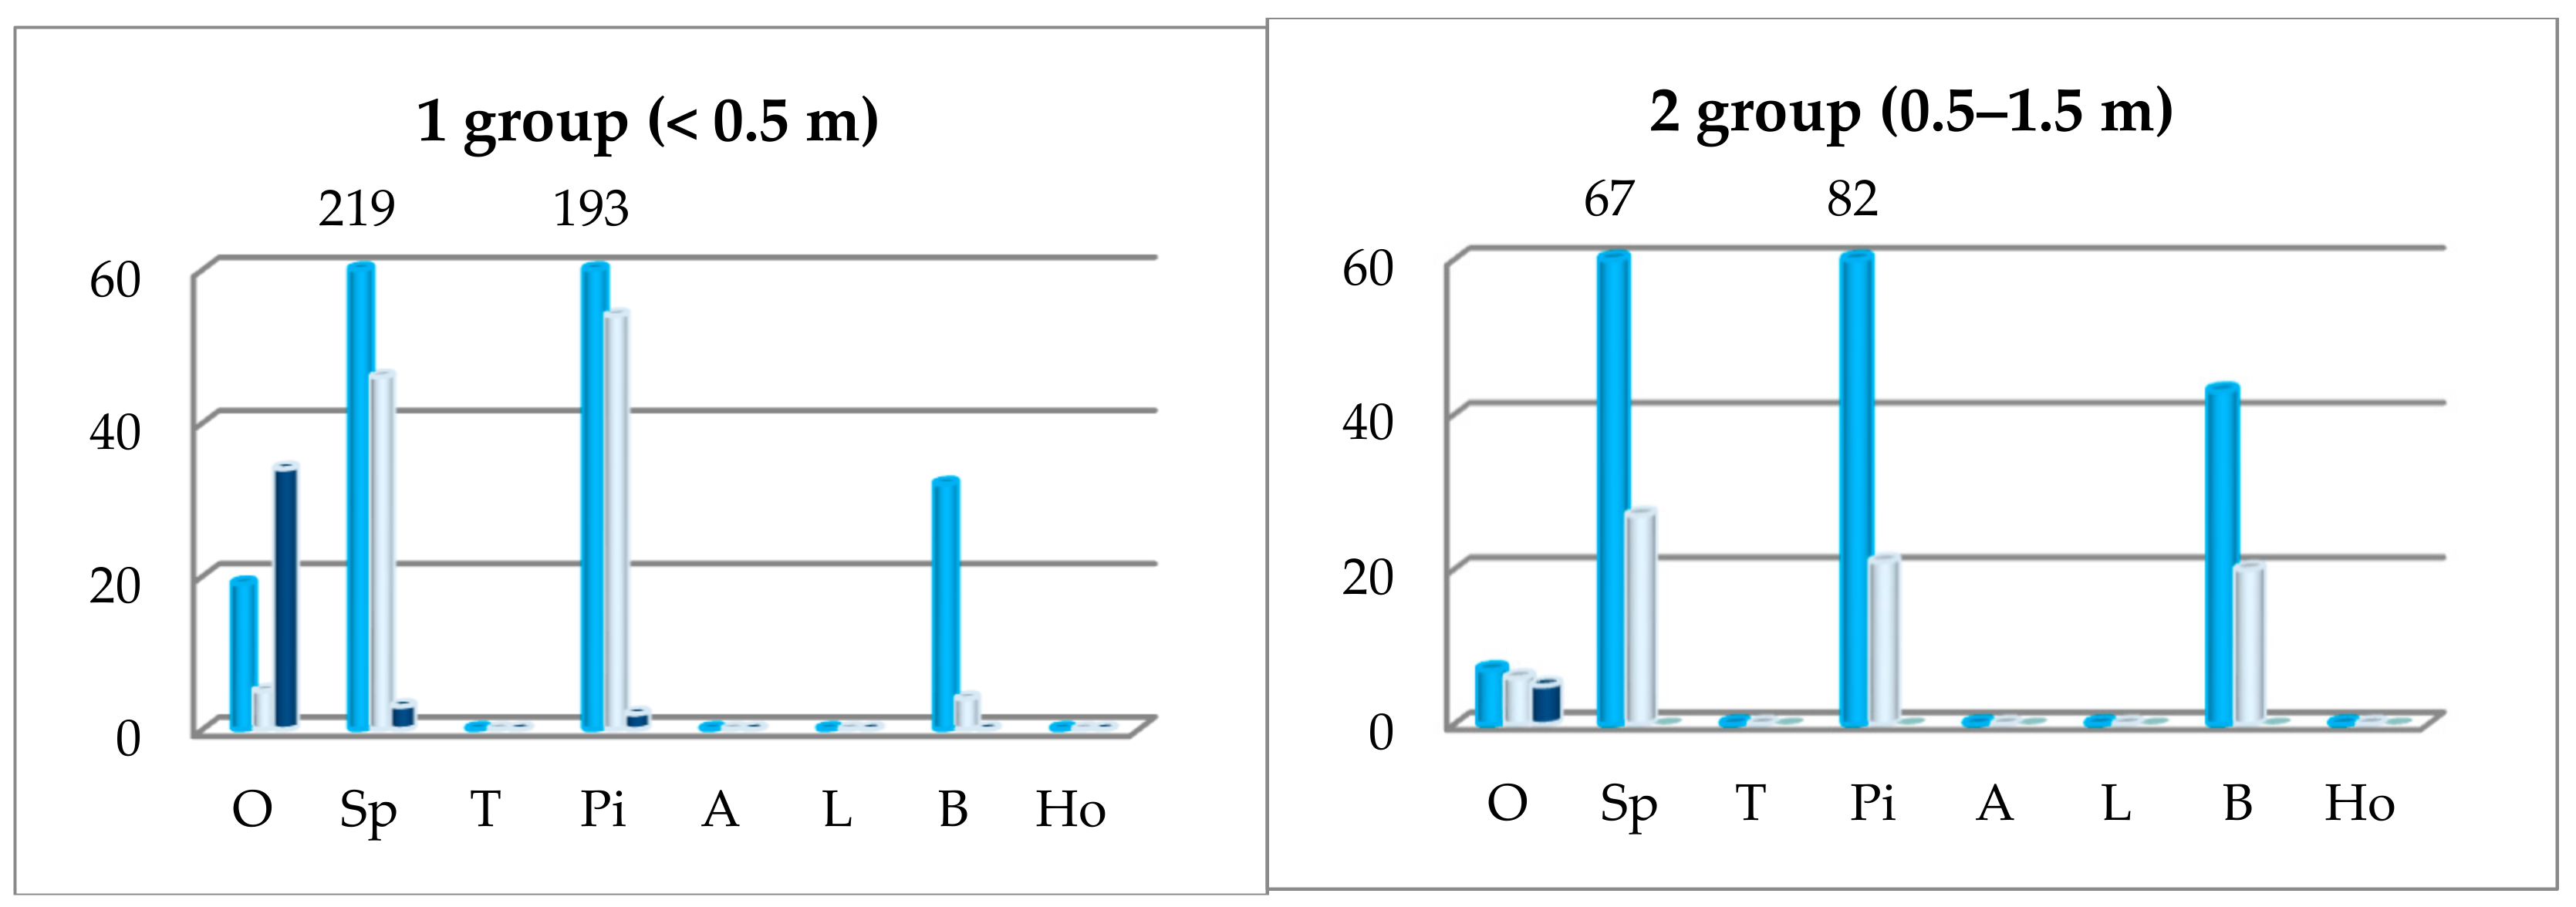
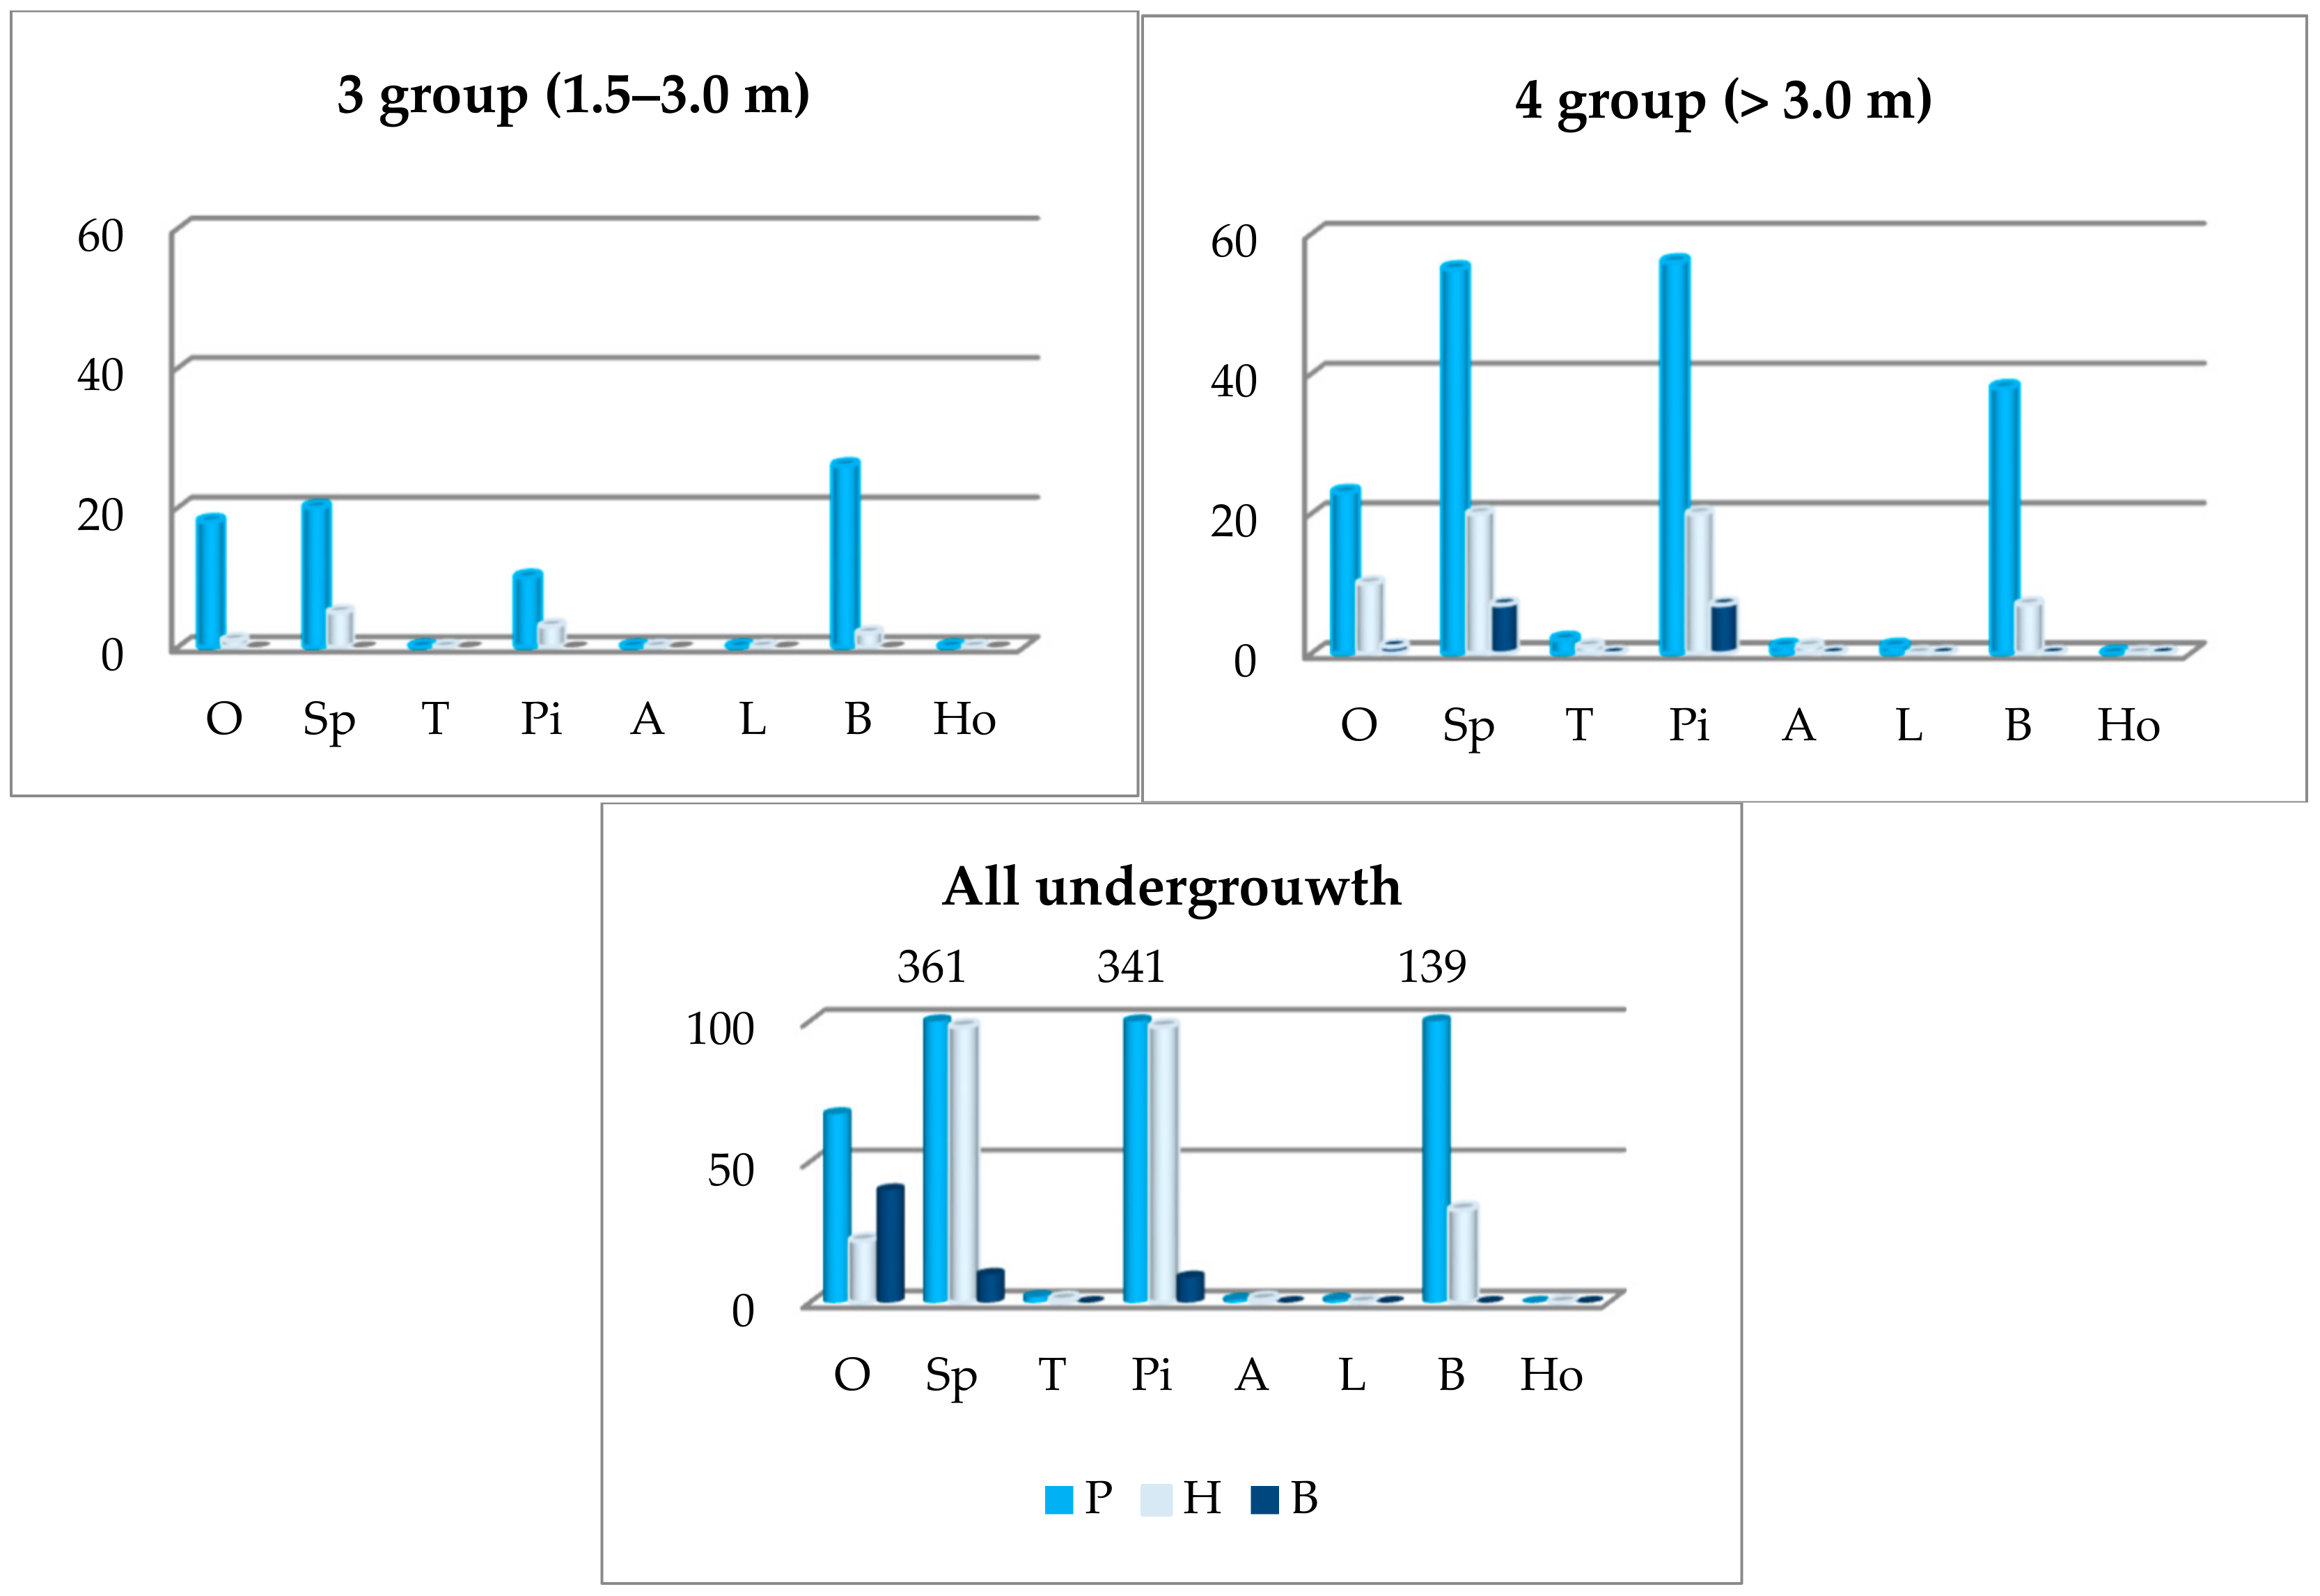
3.2. External Factors Influencing the Growth of Undergrowth
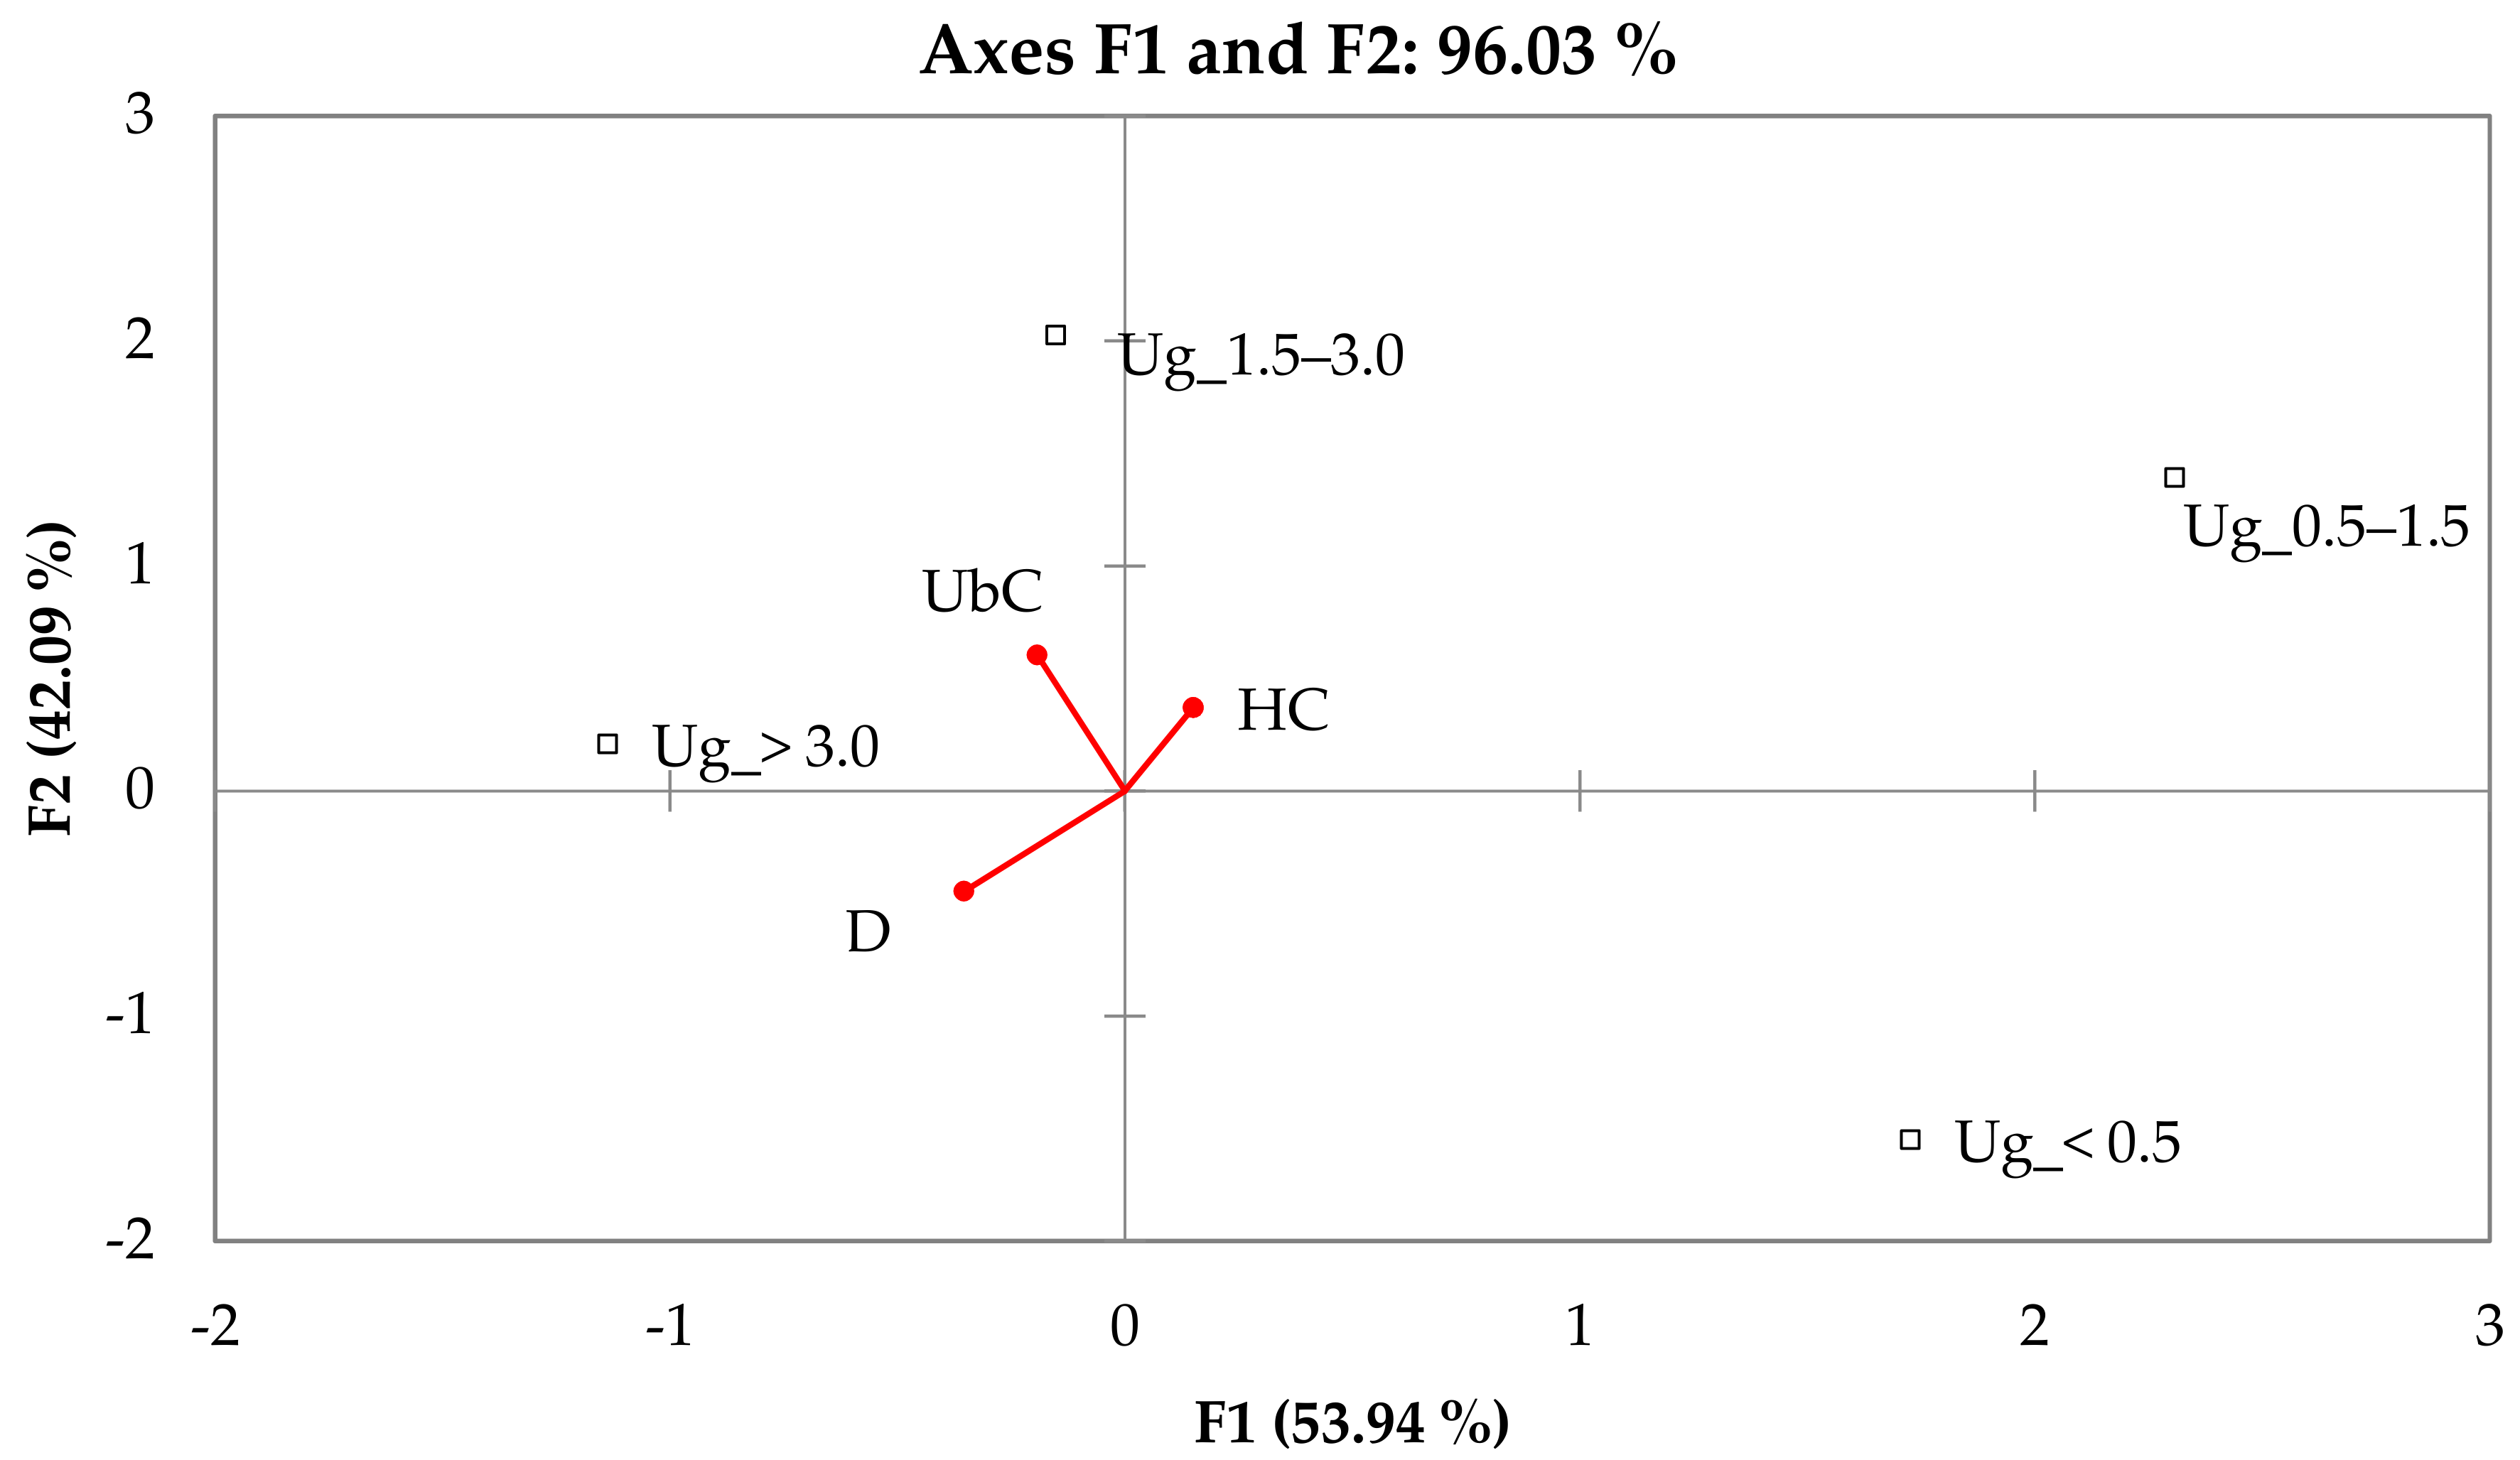
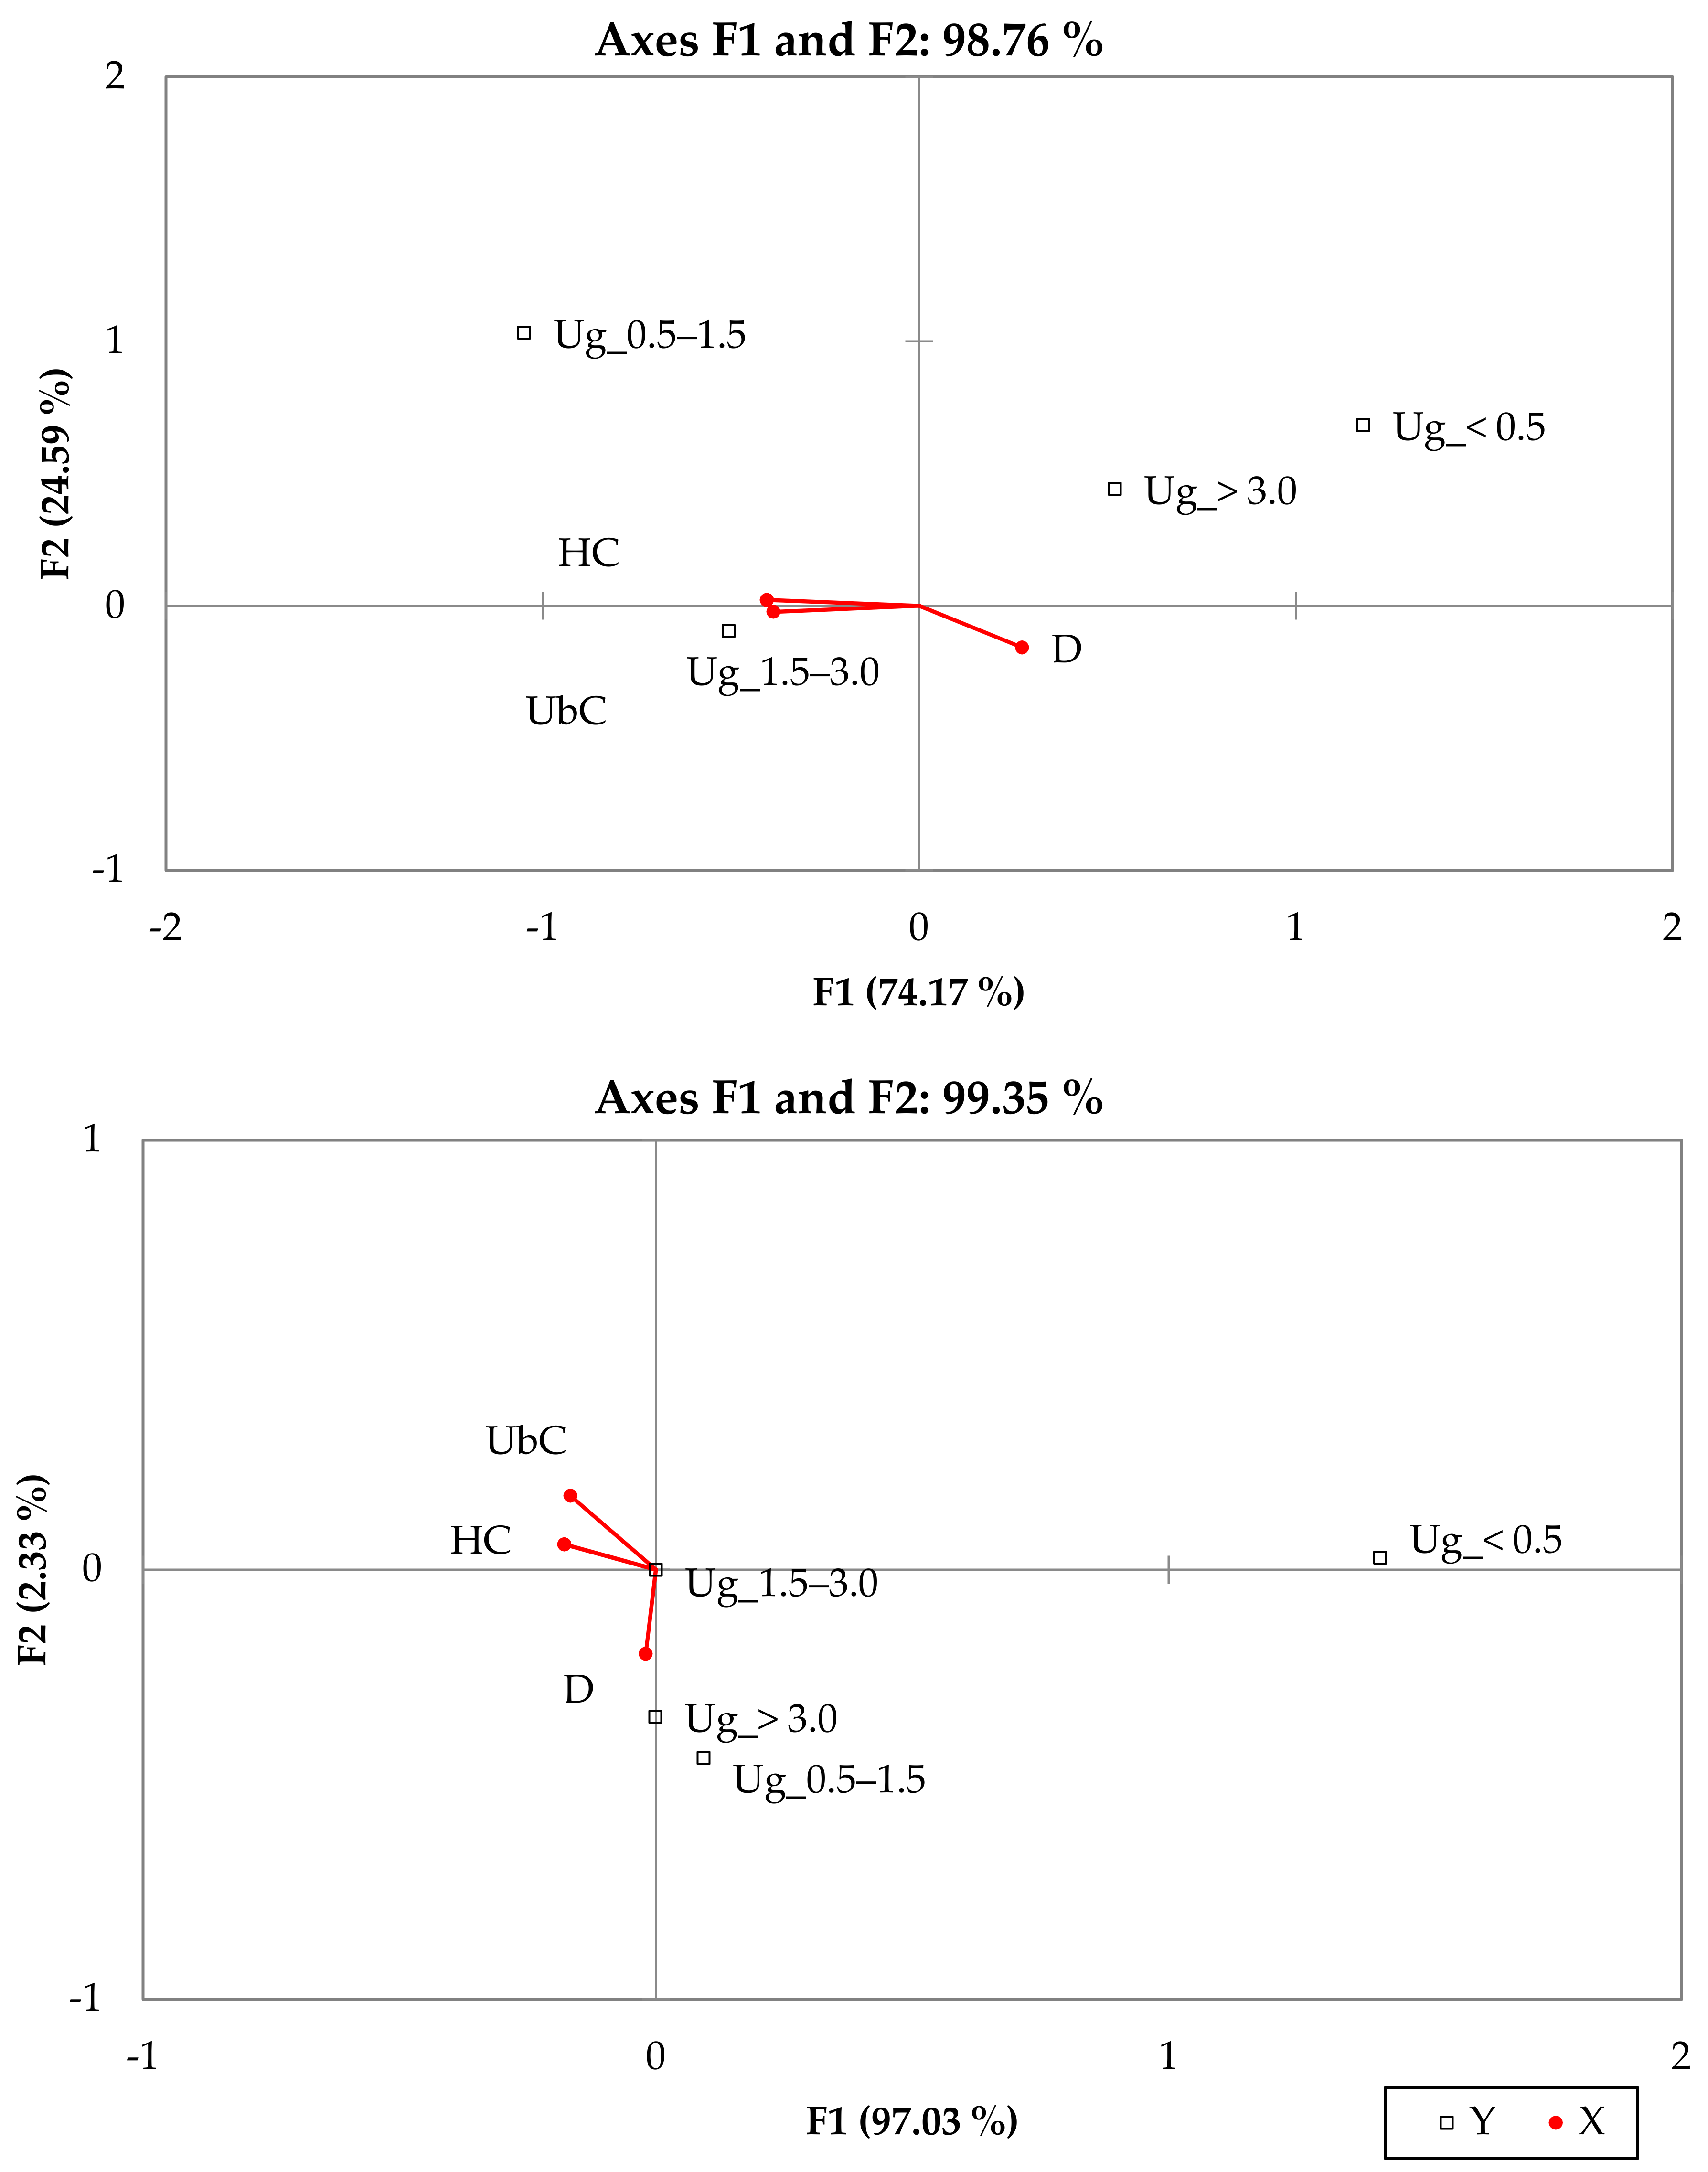
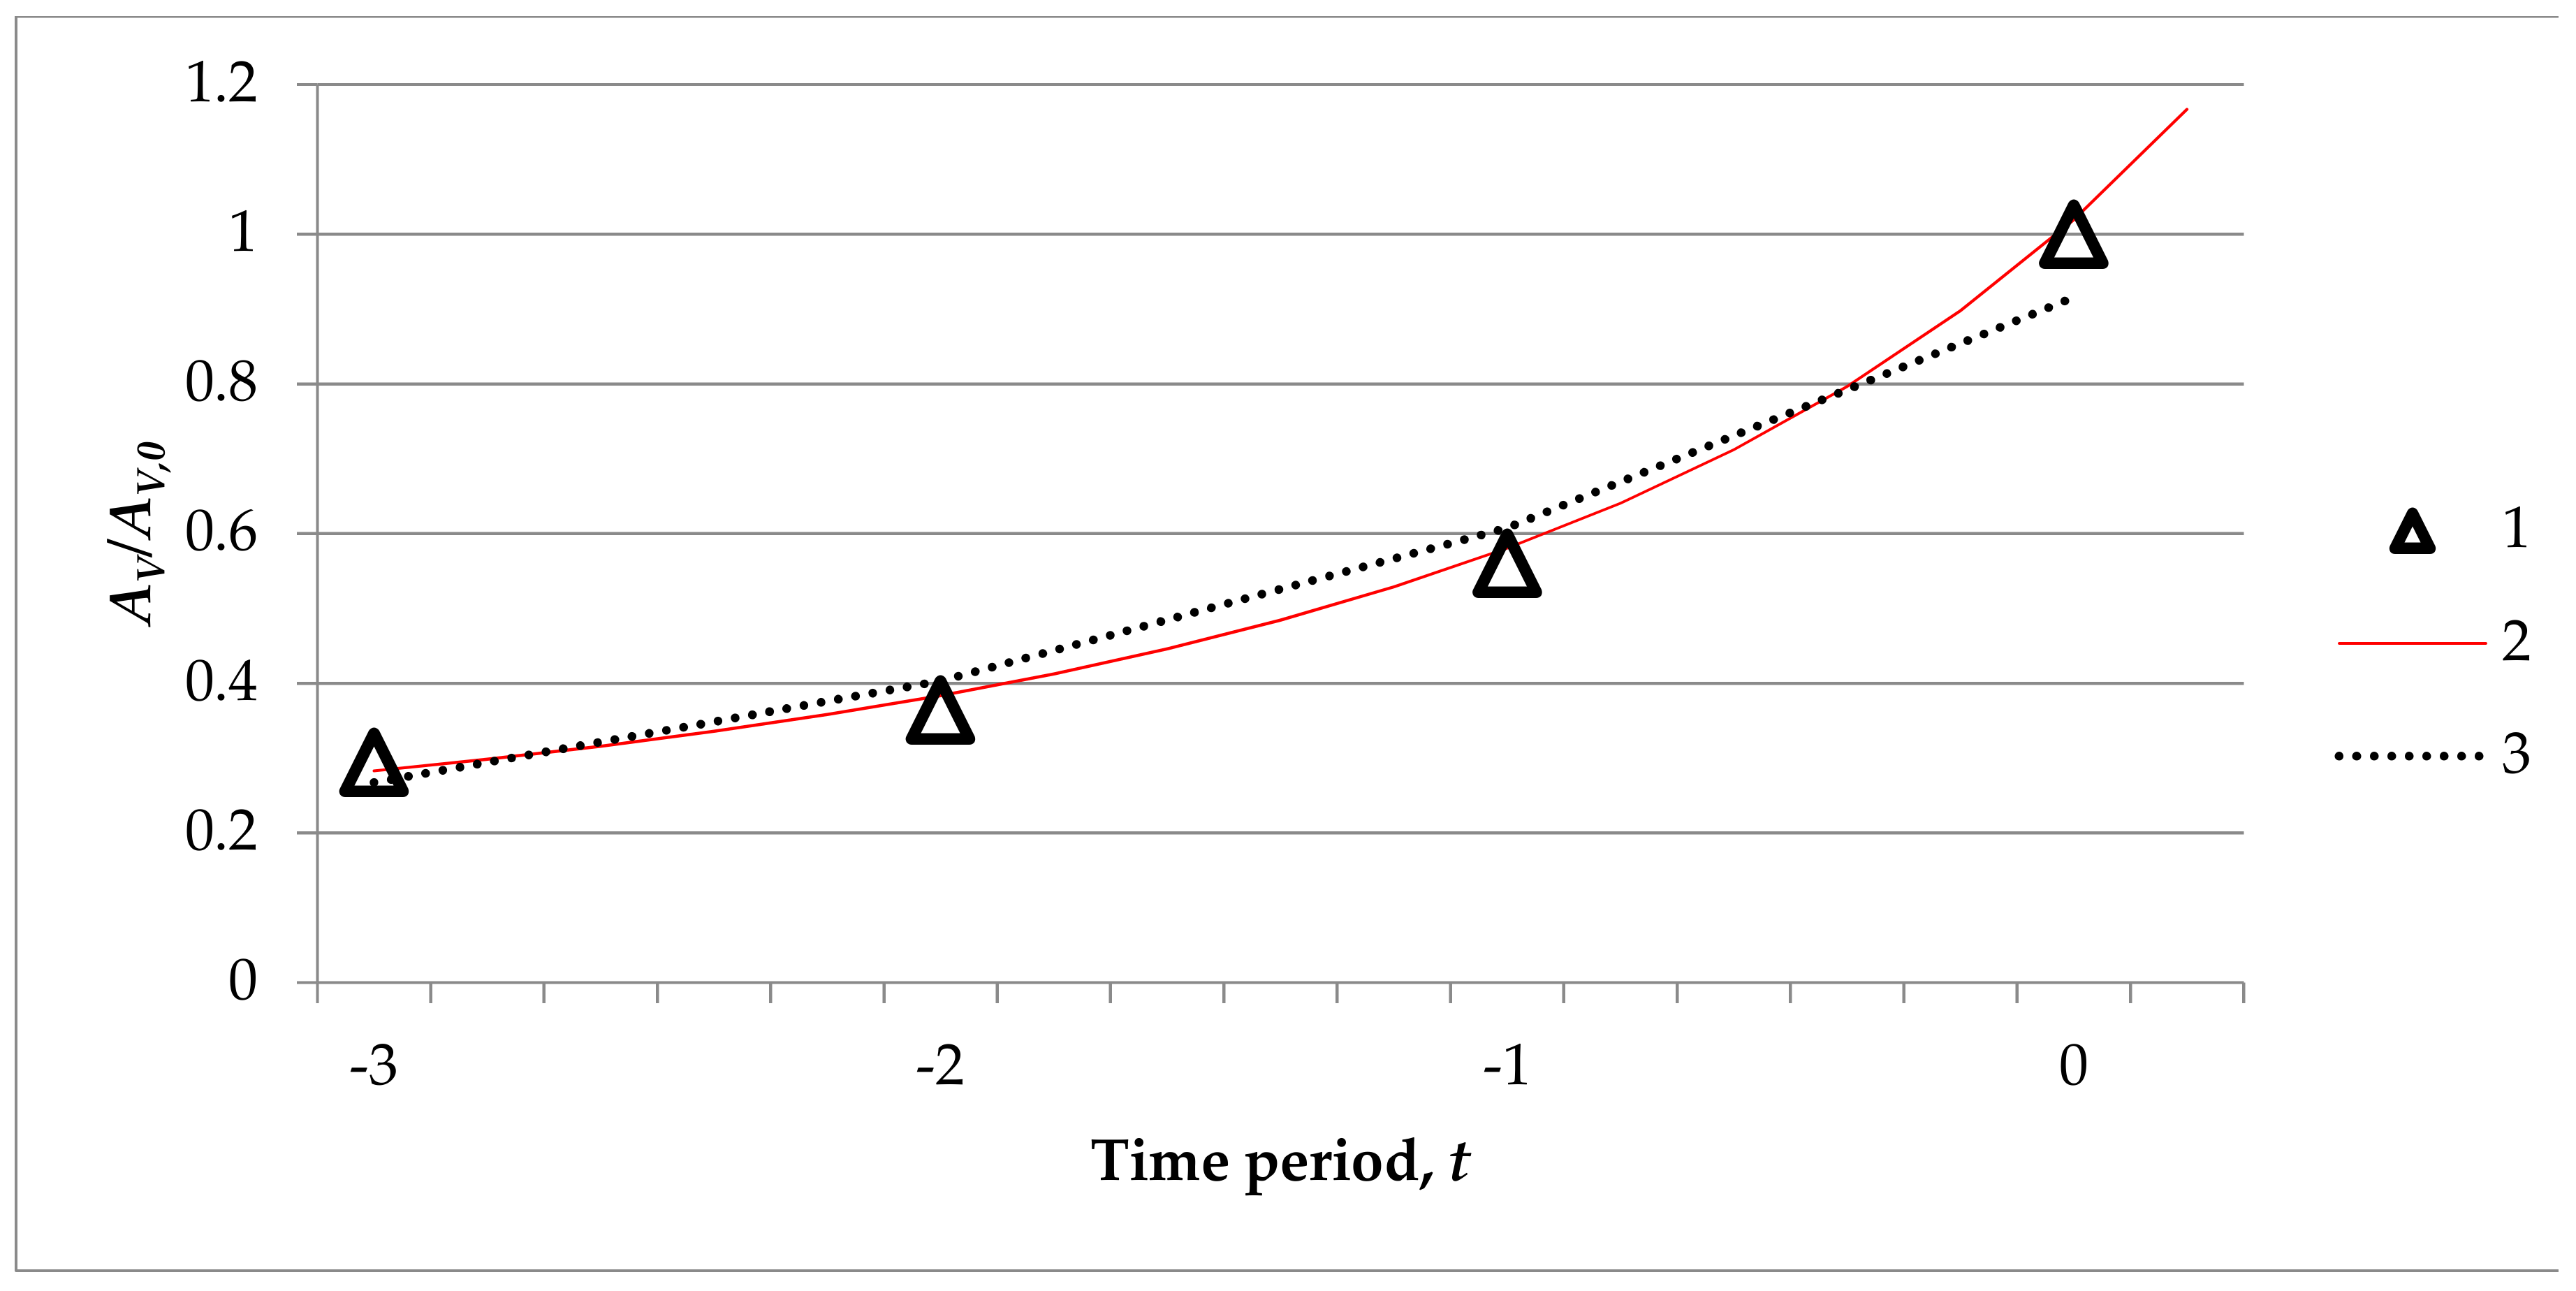
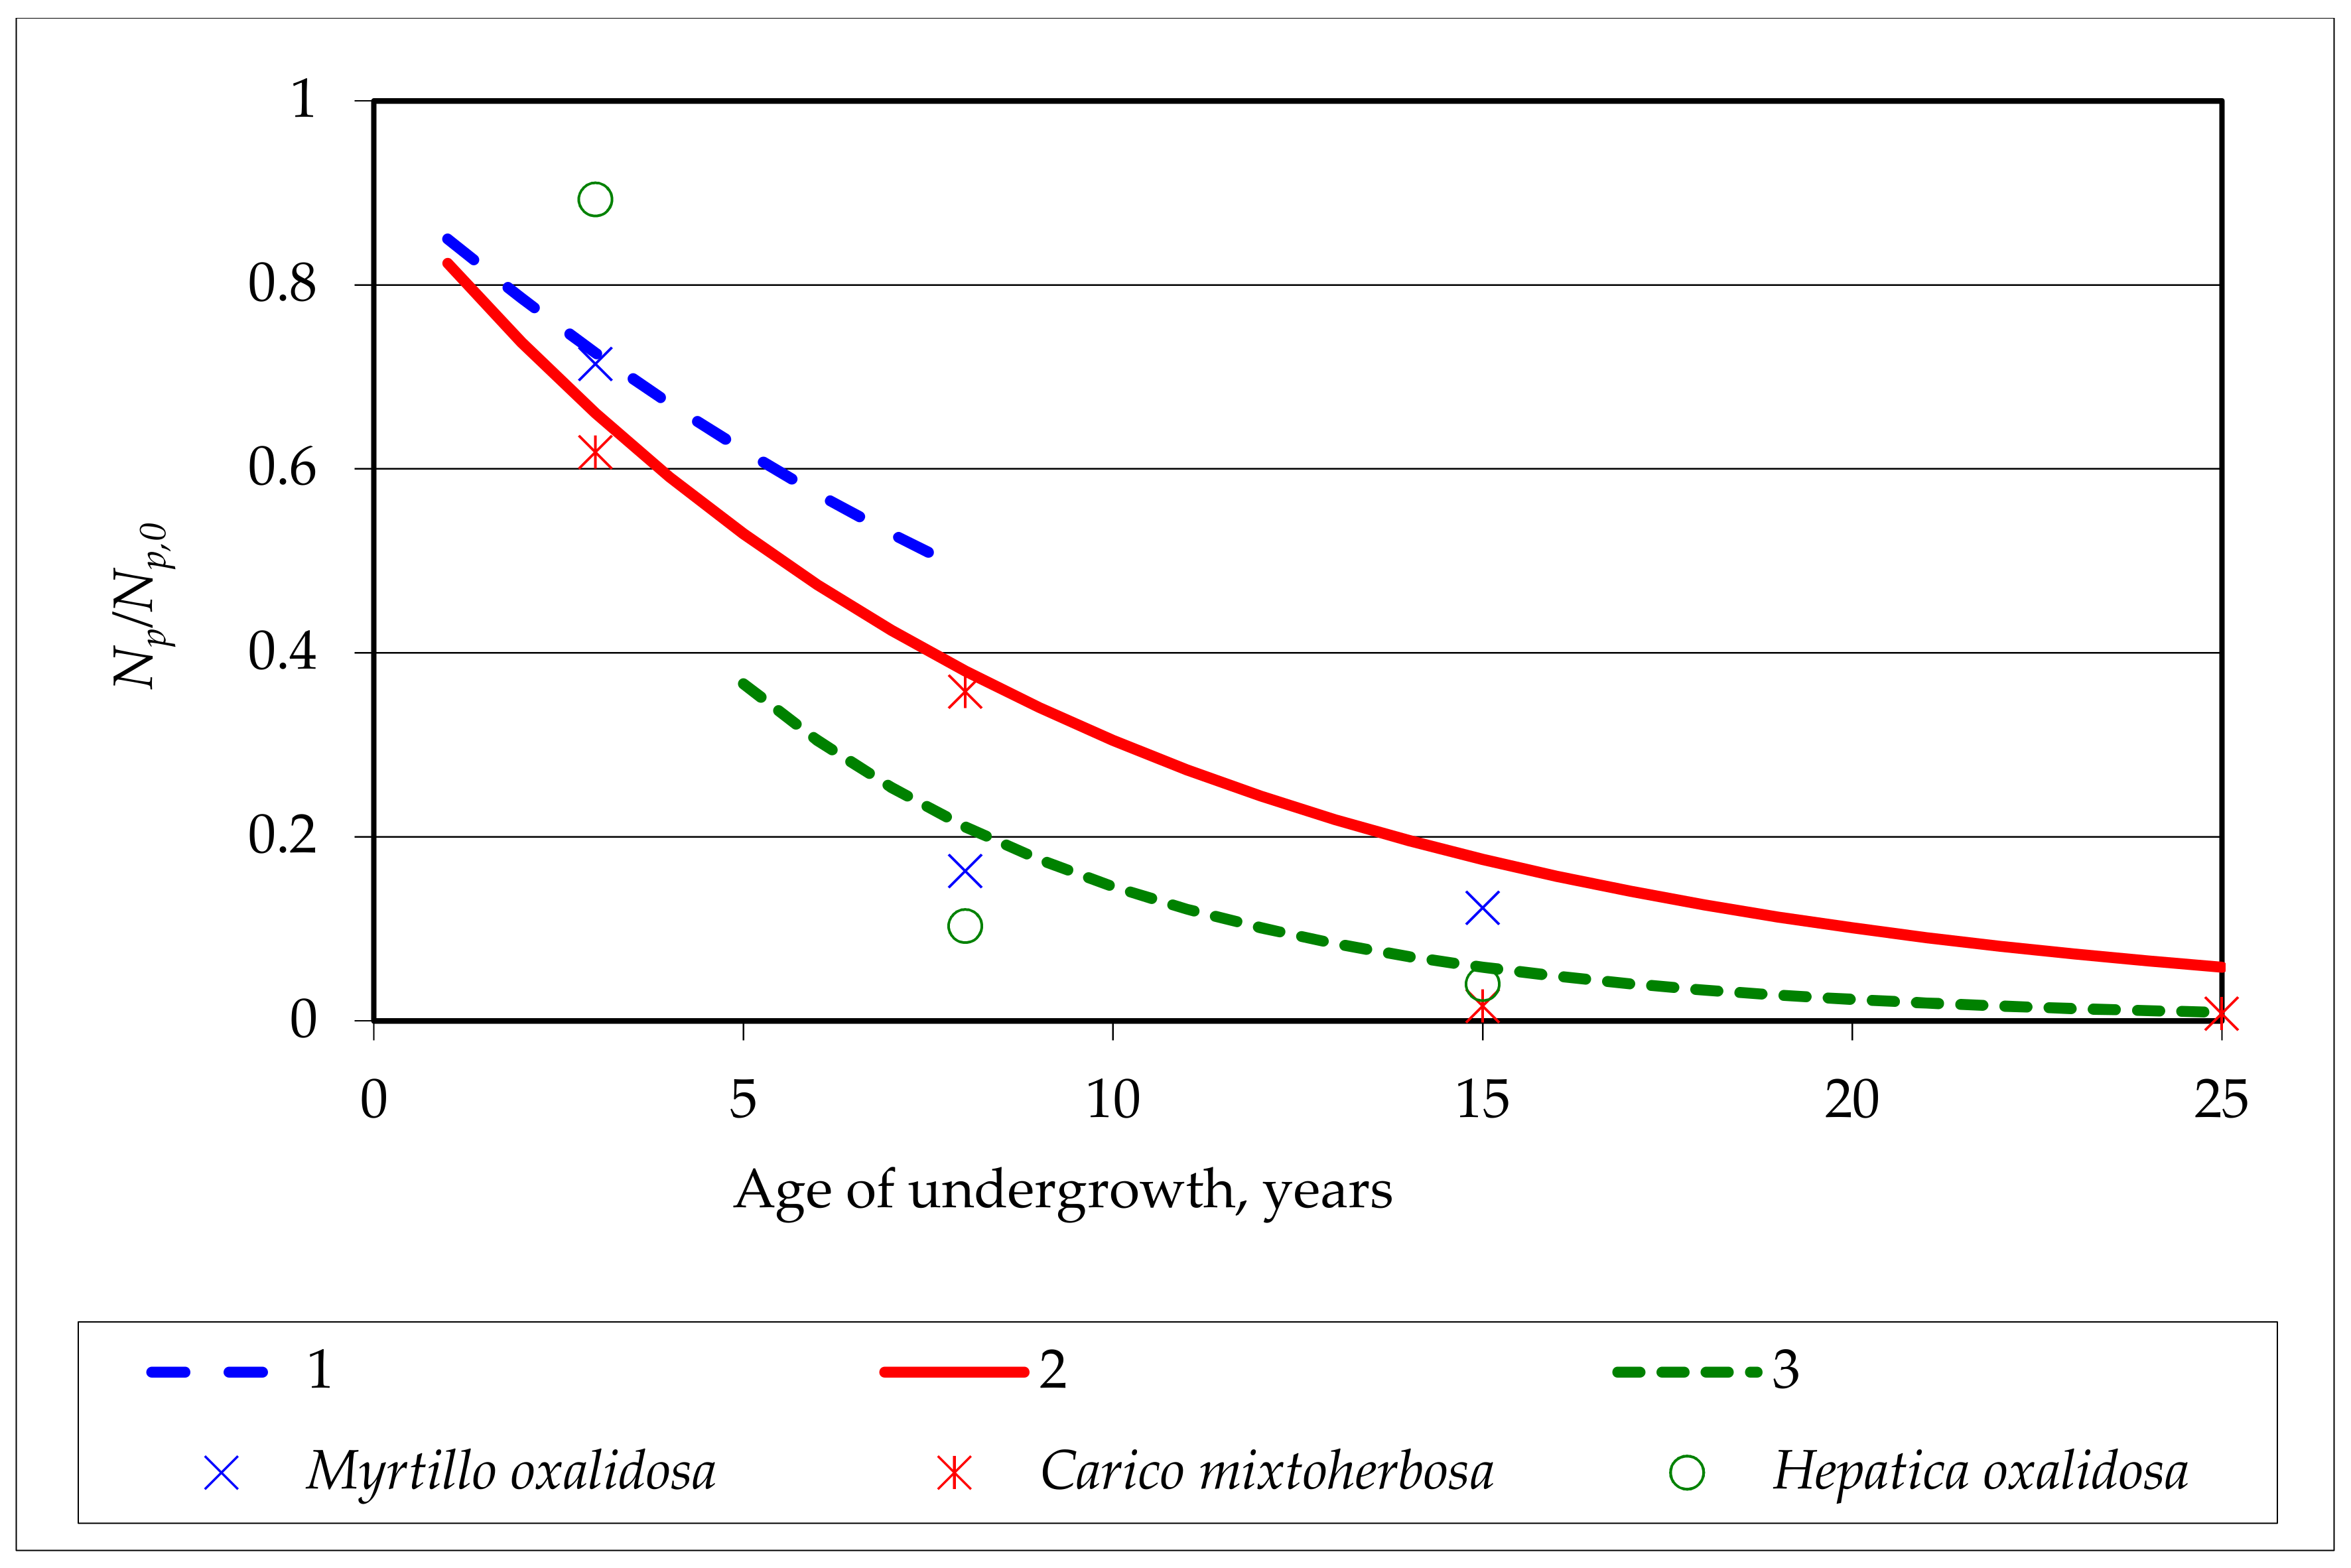
3.3. Mathematical Modelling of Oak Undergrowth
4. Conclusions
Author Contributions
Acknowledgments
Conflicts of Interest
References
- Götmark, F.; Kiffer, C. Regeneration of oaks (Quercus robur/Q. petraea) and three other tree species during long-term succession after catastrophic disturbance (windthrow). Plant Ecol. 2014, 215, 1067–1080. [Google Scholar] [CrossRef]
- Navarro, L.M.; Pereira, H.M. Rewilding abandoned landscapes in Europe. In Rewilding European Landscapes; Pereira, H., Navarro, L., Eds.; Springer: New York, NY, USA, 2015; pp. 3–23. [Google Scholar]
- Arroyo-Rodríguezm, V.; Melo, F.P.; Martínez-Ramos, M.; Bongers, F.; Chazdon, R.L.; Meave, J.A.; Tabarelli, M. Multiple successional pathways in human-modified tropical landscapes: New insights from forest succession, forest fragmentation and landscape ecology research. Biol. Rev. 2017, 92, 326–340. [Google Scholar] [CrossRef] [PubMed]
- Vizoso-Arribe, O.; Díaz-Maroto, I.; Vila-Lameiro, P.; Díaz-Maroto, M. Influence of the canopy in the natural regeneration of Quercus robur in NW Spain. Biologia 2014, 69, 1678–1684. [Google Scholar] [CrossRef]
- Goebel, P.C.; Hix, D.M. Development of mixed-oak forests in southeastern Ohio: A comparison of second-growth and old-growth forests. For. Ecol. Manag. 1996, 84, 1–21. [Google Scholar] [CrossRef]
- Karazija, S.; Jurelionis, J.; Vaičiūnas, V. Lietuvos ąžuolynai: Išsaugojimo ir atkūrimo problemos [Lithuanian oak forests: Problems of preservation and restoration]. In Savaiminis ąžuolynų atžėlimas [Self-Contained Regeneration of Oak Trees]; Karazija, S., Ed.; Lututė: Kaunas, Lithuania, 1997; pp. 135–141, (Lithuanian with English summary). [Google Scholar]
- Kullberg, Y.; Bergström, R. Winter browsing by large herbivores on planted deciduous seedlings in southern Sweden. Sweden Scand. J. For. Res. 2001, 16, 371–378. [Google Scholar] [CrossRef]
- Helay, W. Influence of deer on the structure and composition of oak forests in central Massachusetts. In The Science of Overabundance; Mc Shea, W.J., Underwood, H.B., Rappole, J.H., Eds.; Smithsonian Institution Press: Washington, DC, USA, 1997; pp. 249–265. [Google Scholar]
- Lorimer, C.G.; Chapman, J.W.; Lambert, W.D. Tall understory vegetation as a factor in the poor development of oak seedlings beneath mature stands. J. Ecol. 1994, 82, 227–237. [Google Scholar] [CrossRef]
- Brudvig, L.A.; Asbjornsen, H. Dynamics and determinants of Quercus alba seedling success following savanna encroachment and restoration. For. Ecol. Manag. 2009, 257, 876–884. [Google Scholar] [CrossRef]
- Götmark, F. Careful partial harvesting in conservation stands and retention of large oaks favour oak regeneration. Biol. Conserv. 2007, 140, 349–358. [Google Scholar] [CrossRef]
- Kleinschmit, J. Intraspecific variation of growth and adaptive traits in European oak species. Ann. Sci. For. Suppl. 1993, 50, 166–185. [Google Scholar] [CrossRef]
- Bacilieri, R.; Ducousso, A.; Kremer, A. Genetic, morphological and phenological differentiation between Quercus petraea (Matt.) Liebl. and Quercus robur L. in a mixed stand of northwest of France. Silvae Gen. 1995, 44, 1–10. [Google Scholar]
- Jensen, J.S. Provenance variation in phenotypic traits in Quercus robur and Quercus petraea in Danish provenance trials. Scand. J. For. Res. 2008, 23, 179–188. [Google Scholar] [CrossRef]
- Curtu, A.L.; Gailing, O.; Leinemann, L.; Finkeldey, R. Genetic variation and differentiation within a natural community of five oak species (Quercus ssp.). Plant Biol. 2007, 9, 116–126. [Google Scholar] [CrossRef] [PubMed]
- Jensen, J.S.; Hansen, J.K. Geographical variation in phenology of Quercus petraea (Matt.) Liebl. and Quercus robur L. oak grown in a greenhouse. Scand. J. For. Res. 2008, 23, 179–188. [Google Scholar] [CrossRef]
- Abadie, P.; Roussel, G.; Dencusse, B.; Bonnet, C.; Bertocchi, E.; Louvet, J.M.; Kremer, A.; Garnier-Géré, P. Strength, diversity and plasticity of postmating reproductive barriers between two hybridizing oak species (Quercus robur L. and Quercus petraea (Matt) Liebl.). J. Evol. Biol. 2012, 25, 157–173. [Google Scholar] [CrossRef] [PubMed]
- Eriksson, G. Quercus petraea and Quercus robur: Recent Genetic Research; The Silva Slovenica Publishing Centre, Slovenian Forestry Institute: Ljubljana, Slovenia, 2015; p. 104. ISBN 978-961-6993-01-2. [Google Scholar]
- Rupšys, S. Matematinis modeliavimas (miškotvarkoje ir ekologijoje) [Mathematical Modeling (in Forest Management and Ecology)]; LŽŪU LC: Akademija, Lithuania, 2007. [Google Scholar]
- Tuminauskas, S. Bekotis ąžuolas pietų Lietuvoje [Sessile oak in Lithuania]. Mūsų Girios 1957, 5, 11–13. (In Lithuanian) [Google Scholar]
- Patalauskaitė, D. On the quercetalia robori-petraeae in Lithuania. Botanica Lithuanica 2008, 14, 113–119. [Google Scholar]
- Vaičys, M. Miško augaviečių tipai [Types of Forest Sites]; Vaičys, M., Ed.; Lututė: Kaunas, Lithuania, 2006; ISBN 9955-692-41-3. [Google Scholar]
- [WRB] World Reference Base for Soil Resources 2014. International Soil Classification System for Naming Soils and Creating Legends for Soil Maps; World Soil Resources Reports, FAO: Rome, Italy, 2014. [Google Scholar]
- Patalauskaitė, D. Communities of Quercus petraea in Lithuania. Acta Biol. Univ. Daugavp. 2007, 7, 159–164. [Google Scholar]
- Navasaitis, M.; Ozolinčius, R.; Smaliukas, D.; Balevičienė, J. Lietuvos dendroflora [Dendroflora in Lithuania]; Lututė: Kaunas, Lithuania, 2003. (In Lithuanian) [Google Scholar]
- Baliuckas, V. Paprastojo (Quercus robur) ir bekočio ąžuolo (Q. petraea) rūšių introgresija Trako miške (Introgression of pedunculate (Quercus robur) and sessile (Q. petraea) oak species in Trakas Forest). Bot. Lith. 2000, 6, 375–387. [Google Scholar]
- Carlise, A.; Brown, A.F. The assessment of the taxonomic status of mixed oaks (Quercus ssp.) populations. Watsonia 1965, 6, 120–127. [Google Scholar]
- Kremer, A.; Dupouey, J.L.; Deans, J.D.; Cotrell, J.; Csaikl, U.; Finkeldey, R.; Espinel, S.; Jensen, J.; Kleinschmit, J.; Van Dam, B.; et al. Leaf morphological differentiation between Quercus robur and Quercus petraea is stable across western European mixed oak stands. Ann. For. Sci. 2002, 59, 777–787. [Google Scholar] [CrossRef]
- Borazan, A.; Babaç, M.T. Morphometric leaf variation in oaks (Quercus) of Bolu Turkey. Ann. Bot. Fenn. 2003, 40, 233–242. [Google Scholar]
- Čekanavičius, V.; Murauskas, G. Statistika ir jos taikymai [Statistics and Its Applications]; TEV: Vilnius, Lithuania, 2001. (In Lithuanian) [Google Scholar]
- [LR AM] LR AM Miškų departamentas. Miško atkūrimas ir veisimas (Teisės aktų rinkinys) [Reforestation and Breeding (Legislative Package)]; UAB Lodvila: Vilnius, Lithuania, 2011. (In Lithuanian) [Google Scholar]


| Oaks (p) | Undergrowth Height Group (g) | Average Density (Ap) | The Maximum Density ( | |||
|---|---|---|---|---|---|---|
| 1 | 2 | 3 | 4 | |||
| Sessile oak | 621 | 212 | 0 | 191 | 418 | 2930 |
| Hybrid 1 oak | 479 | 363 | 140 | 193 | 436 | 3822 |
| Pedunculate oak | 867 | 539 | 449 | 335 | 1047 | 4586 |
| Total species | 895 | 621 | 401 | 328 | 1106 | 8408 |
| Oaks (p) | Period of Undergrowth Formation | Relative Amount of Undergrowth | ||||
|---|---|---|---|---|---|---|
| t = −3 | t = −2 | t = −1 | t = 0 | Np,0/Np,−3 | % | |
| Sessile oak | 15 | 15 | 20 | 59 | 3.9 | 0.048 |
| Hybrid oak | 59 | 70 | 144 | 253 | 4.3 | 0.21 |
| Pedunculate oak | 176 | 250 | 449 | 912 | 52 | 0.74 |
| Total undergrowth | 250 | 335 | 613 | 1224 | 4.9 | 100 |
| Oaks (p) | Period of Undergrowth Formation (t) | Relative Amount of Plot Numbers Bp,0/Bp,−3 | |||
|---|---|---|---|---|---|
| t = −3 | t = −2 | t = −1 | t = 0 | ||
| Sessile oak | 10 | 10 | 13 | 18 | 1.8 |
| Hybrid oak | 39 | 49 | 67 | 74 | 1.9 |
| Pedunculate oak | 67 | 73 | 92 | 111 | 1.7 |
| Total | 97 | 106 | 125 | 141 | 1.5 |
| Oaks (p) | Period of Undergrowth Formation (t) in Years | |||
|---|---|---|---|---|
| t = −3 | t = −2 | t = −1 | t = 0 | |
| Sessile oak | 191 | 191 | 196 | 418 |
| Hybrid oak | 193 | 182 | 274 | 436 |
| Pedunculate oak | 335 | 436 | 622 | 1047 |
| Total | 328 | 403 | 625 | 1106 |
| No. | Function of Undergrowth Status | Critical Value of Criterion F | Indexes | ||||
|---|---|---|---|---|---|---|---|
| Criterion F | Determination Coefficient (R2) | Constant (C) | Coefficient | Coefficient m1 | |||
| Quercus robur | |||||||
| 1 | AP/AP,0= f (t) | 18.5 | 84.7 | 0.977 | 0.934 | 0.377 | |
| 2 | AP/AP,0= f (t, AH/AH,0) | 200 | 487 | 0.999 | 0.525 | 0.636 | 0.258 |
| 3 | AP/AP,0= f (t, AS/AS,0) | 200 | 290 | 0.998 | 0.49 | 0.432 | 0.306 |
| Quercus petraea | |||||||
| 5 | AS/AS,0= f (t) | 18.5 | 3.4 | 0.626 | 0.799 | 0.238 | |
| 6 | AS/AS,0= f (t, AH/AH,0) | 200 | 5.8 | 0.920 | 0.153 | 1.828 | −0.107 |
| 7 | AS/AS,0= f (t, AP/AP,0) | 200 | 38.9 | 0.988 | 0.077 | 2.549 | −0.328 |
| Hybrid oak | |||||||
| 8 | AH/AH,0= f (t) | 18.5 | 10.6 | 0.841 | 0.896 | 0.285 | |
| 9 | AH/AH,0= f (t, AP/AP,0) | 200 | 11 | 0.957 | 0.228 | 1.500 | −0.046 |
| 10 | AH/AH,0= f (t, AS/AS,0) | 200 | 6.4 | 0.927 | 0.494 | 0.708 | 0.169 |
| Total | |||||||
| 11 | AV/AV,0= f (t) | 18.5 | 49.3 | 0.961 | 0.917 | 0.409 | |
| 12 | AV/AV,0= f (t, AP/AP,0) | 200 | 120 | 0.996 | 0.336 | 1.098 | 0.165 |
| 13 | AV/AV,0= f (t, AH/AH,0) | 200 | 8891 | 0.999 | 0.398 | 0.922 | 0.235 |
| 14 | AV/AV,0= f (t, AS/AS,0) | 200 | 50.3 | 0.990 | 0.577 | 2.549 | −0.328 |
| Function of Undergrowth Condition | Critical Value of Criterion F | Indexes | |||
|---|---|---|---|---|---|
| Oaks | Criterion F | Determination Coefficient (R2) | Constant (C) | Coefficient (m1) | |
| Sessile oak | 18.5 | 94 | 0.979 | 0.920 | 0.552 |
| Hybrid oak | 18.5 | 41 | 0.953 | 0.939 | 0.509 |
| Pedunculate oak | 18.5 | 6 | 0.760 | 0.744 | 0.440 |
| Total | 18.5 | 68 | 0.972 | 0.915 | 0.537 |
© 2018 by the authors. Licensee MDPI, Basel, Switzerland. This article is an open access article distributed under the terms and conditions of the Creative Commons Attribution (CC BY) license (http://creativecommons.org/licenses/by/4.0/).
Share and Cite
Jurkšienė, G.; Baliuckas, V. Pedunculate and Sessile Mixed Oak Forest Regeneration Process in Lithuania. Forests 2018, 9, 459. https://doi.org/10.3390/f9080459
Jurkšienė G, Baliuckas V. Pedunculate and Sessile Mixed Oak Forest Regeneration Process in Lithuania. Forests. 2018; 9(8):459. https://doi.org/10.3390/f9080459
Chicago/Turabian StyleJurkšienė, Girmantė, and Virgilijus Baliuckas. 2018. "Pedunculate and Sessile Mixed Oak Forest Regeneration Process in Lithuania" Forests 9, no. 8: 459. https://doi.org/10.3390/f9080459
APA StyleJurkšienė, G., & Baliuckas, V. (2018). Pedunculate and Sessile Mixed Oak Forest Regeneration Process in Lithuania. Forests, 9(8), 459. https://doi.org/10.3390/f9080459