Article

Hydraulic Constraints to Whole-Tree Water Use and Respiration in Young Cryptomeria Trees under Competition

1
Aragon Agency for research and development (ARAID), E-50018 Zaragoza, Spain
2
Forest Resources Unit, Agrifood Research and Technology Centre of Aragón (CITA), Avenida Montañana 930, E-50059 Zaragoza, Spain
3
Faculty of Agriculture, Yamagata University, Wakaba-machi 1-23, Tsuruoka-shi, Yamagata 997-8555, Japan
*
Author to whom correspondence should be addressed.
Forests 2018, 9(8), 449; https://doi.org/10.3390/f9080449
Submission received: 30 May 2018 / Revised: 19 July 2018 / Accepted: 23 July 2018 / Published: 25 July 2018
(This article belongs to the Special Issue Water and Gas Exchanges in Forests)

Abstract

:
Although extensive studies have focused on carbon and water balance from aboveground measurements, the link between the belowground and aboveground processes deserves greater attention. In this context, the aim of this work was to assess the bi-directional feedback between whole-plant respiration and transpiration. The study was performed on 25 saplings of Sugi (Japanese cedar, Cryptomeria japonica D. Don), including dominant and suppressed individuals (total fresh weight ranging between 0.2 and 8.0 kg). During one week, the integrated water use (WU) was determined using the Deuterium dilution method. After this, the trees were uprooted and the root, stem, and leaf respiration were measured using incubation chambers and CO2 infrared sensors. The stem and root respiration followed a power response to mass (power exponent b < 1), implying a decline in mass-specific respiration with size. Conversely, the leaf respiration followed a near-linear increase with size (power exponent b ≈ 1), but was negatively affected by the stem density, indicating the hydraulic limitations of the leaf metabolism. The water use followed a power response with the tree size (b < 1), showing a decline in the transpiration per leaf mass with the tree size, but was also negatively correlated with the stem density. Our results indicate that dominant trees are more efficient in the use of water, and highlight the role of hydraulic limitations to leaf metabolism in suppressed trees.

Graphical Abstract

1. Introduction

One of the main challenges in ecology is to predict the response of forests to global change, and in particular, the interaction between CO2 fertilization, increased temperatures, and drought [1,2,3,4,5,6,7,8]. Although extensive studies have been devoted to carbon and water balance from aboveground measurements at different scales, the interaction between the belowground and aboveground processes demand greater attention [9,10], in particular, the trade-offs and synergies between water use (WU) and whole-tree carbon metabolism and redistribution [11,12,13,14,15]. For example, the root and soil respiration depends on the export of assimilates from the leaves to the roots [11,12,15], but is also modulated by the local soil water content [13,14]. Furthermore, when water is limited, plants tend to increase the carbon allocation to the roots [16,17], but the overall carbon fixation may be limited because of the reduced leaf area and drought-induced photosynthesis limitations [11,12,18,19]. Optimality theory postulates that plants should allocate more biomass to the shoot when carbon fixation (i.e., energy) is the limiting factor, as well as to the roots under water- or nutrient-limited conditions [20,21,22,23]. The trade-off between the belowground demand for photosyntates and the aboveground growth is particularly critical in young competing trees, where water and light limitations often impose opposing constraints to tree development [24,25,26,27,28]. In this context, characterizing the dominance-dependent association between the carbon allocation patterns and whole-tree water uptake capacity would improve our mechanistic understanding of forest regeneration dynamics in response to global change [25,29].
So far, the changes in carbon allocation have been mainly assessed on a dry-mass basis, and only recently has the relevance of metabolic partitioning among different plant organs been highlighted [30,31]. The metabolic rate (i.e., respiration rate, R) of individual organisms’ scales with body size (M), can be described as the simple power function of body mass, as follows:
R = a M b ,
where a is the normalization constant (antilog of the intercept in a log–log plot), and b is the scaling exponent (slope in a log–log plot) [30,32,33,34,35]. The scaling exponent is often less than unity, thus indicating that the mass-specific metabolic rates decrease with size, and the theoretical models have predicted a universal scaling exponent of 3/4 [32,33,34]. However, empirical evidence in plants suggest that the allometric scaling of the metabolic rates may differ among plant organs, because of their particular functional requirements, as well as among individuals with different resource limitations [9,30,36].
In this context, the aim of this study is to explore the size scaling of respiration in different plant organs, as well as the whole-tree water use for young, competing individuals of Sugi (Japanese cedar, Cryptomeria japonica D. Don). Sugi is a long-living, fast-growing species adapted to temperate, maritime climates, but suffering seasonally high water demanding conditions [27,37,38]. As a tall tree (>50 m), Sugi has developed a large stem and leaf storage capacity in order to overcome the hydraulic limitations to tree growth, maintaining high transpiration rates along the canopy [39,40,41,42]. Considering the trade-off between light interception and water securing as a major constrain for the distribution of resources to the aboveground and belowground tissues, we hypothesize a progressive increase in the root carbon allocation from small, slow-growing, suppressed individuals (i.e., more light-limited) to large, fast-growing, dominant trees (i.e., more water-demanding). Bearing in mind the aforementioned adaptations to maintain hydraulic function in tall trees, we also postulate that the decreasing shoot/root metabolic ratio with tree size should translate into a near-linear (b ≈ 1) scaling of the whole-tree water use. Our first hypothesis will be assessed not only with regard to the biomass ratios, but also in terms of metabolic (respiration) rates, as a better proxy for the energy partition among tissues. To test our second hypothesis, we will assess the mass- and metabolic-dependent scaling of whole-tree water use, as estimated for the same individuals, using a Deuterium dilution technique.

2. Materials and Methods

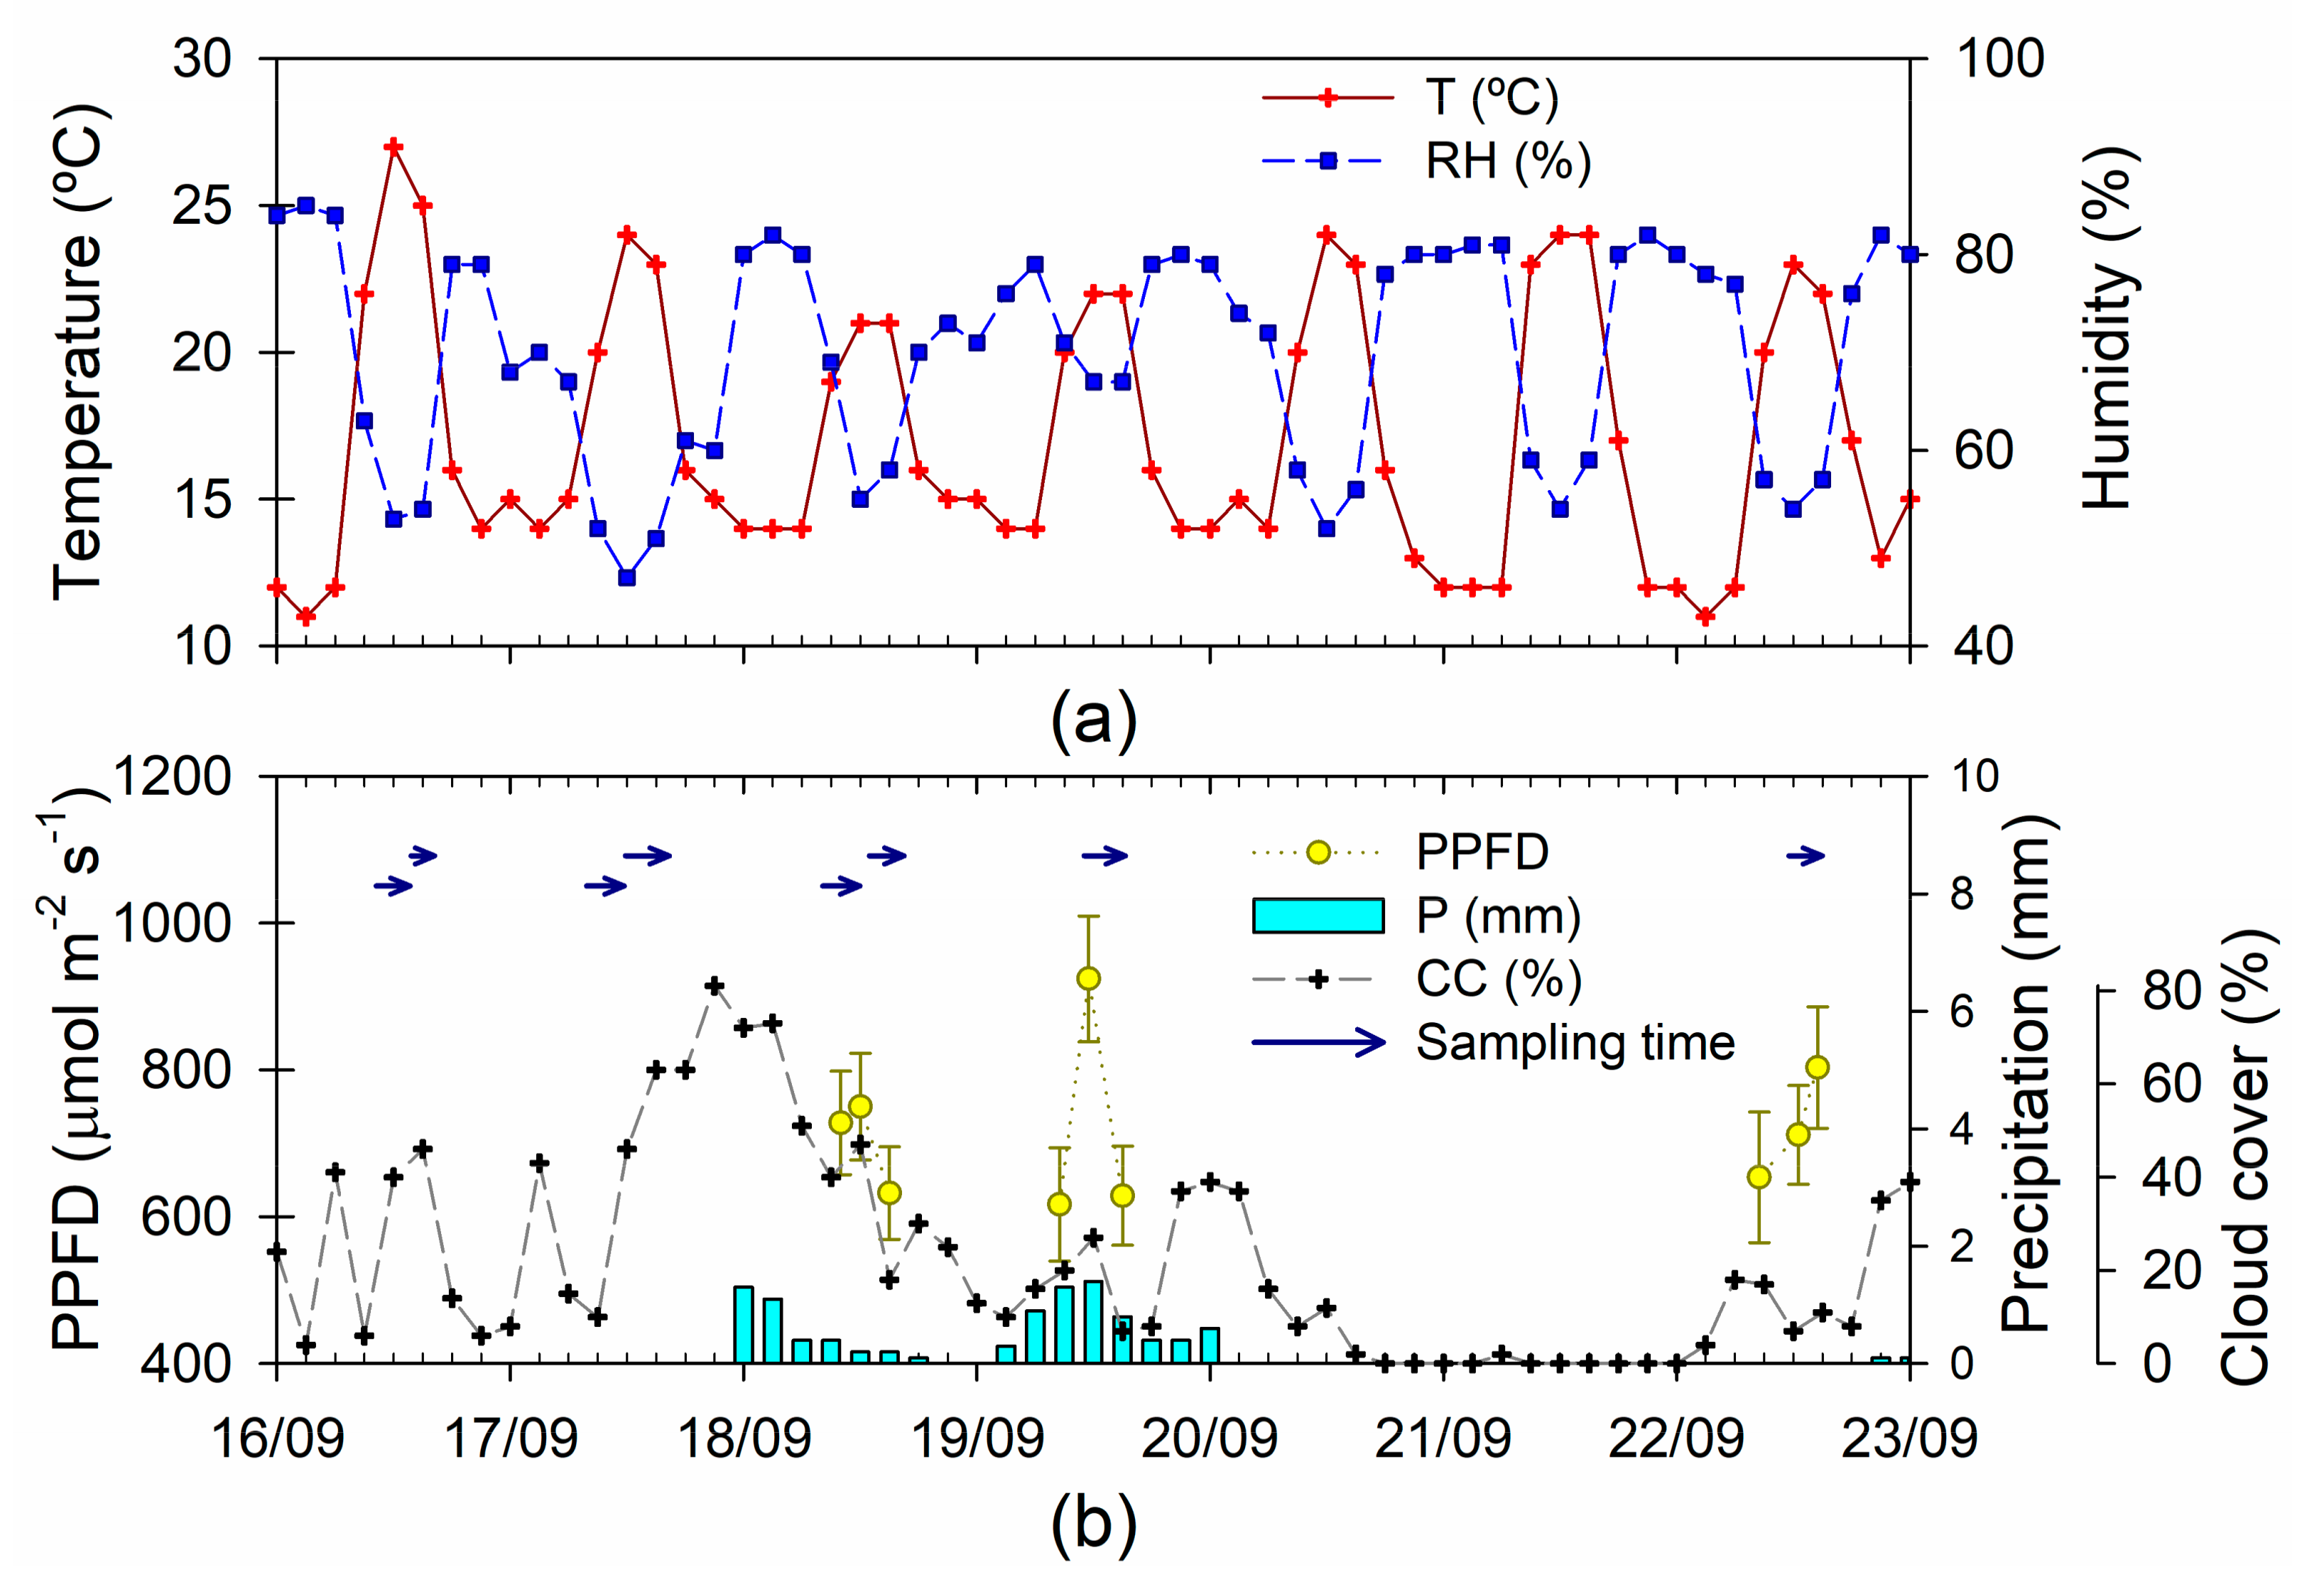
2.1. Plant Material and Study Site

The study was performed in the nursery field of the Faculty of Agriculture, Yamagata University (Tsuruoka campus, 38°43.98′ N, 139°49.39′ E, 17 m.a.s.l.). The monthly mean temperature in Tsuruoka ranges from 0.3 °C in January to 25.2 °C in August (Annual mean: 12.3 °C), and annual precipitation amounts to 1948 mm. For the experiment, we used 7 to 10 year old saplings of Cryptomeria japonica D. Don, growing in a 2 × 8 m rectangular plot under high competition (ca. 60,000 trees ha−1), selecting 25 individuals representative of the range of tree size and dominance status observed in the plot (tree height ranging from 0.75 to 2.81 m). Selecting 25 individuals representative of the range of tree size and dominance status observed in the plot (tree height ranging from 0.75 to 2.81 m; full dataset is available as Supplementary Materials, Table S1).

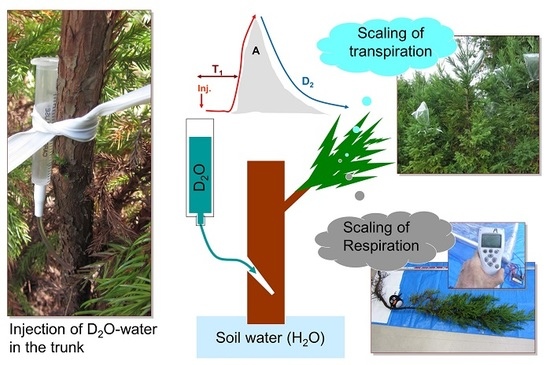
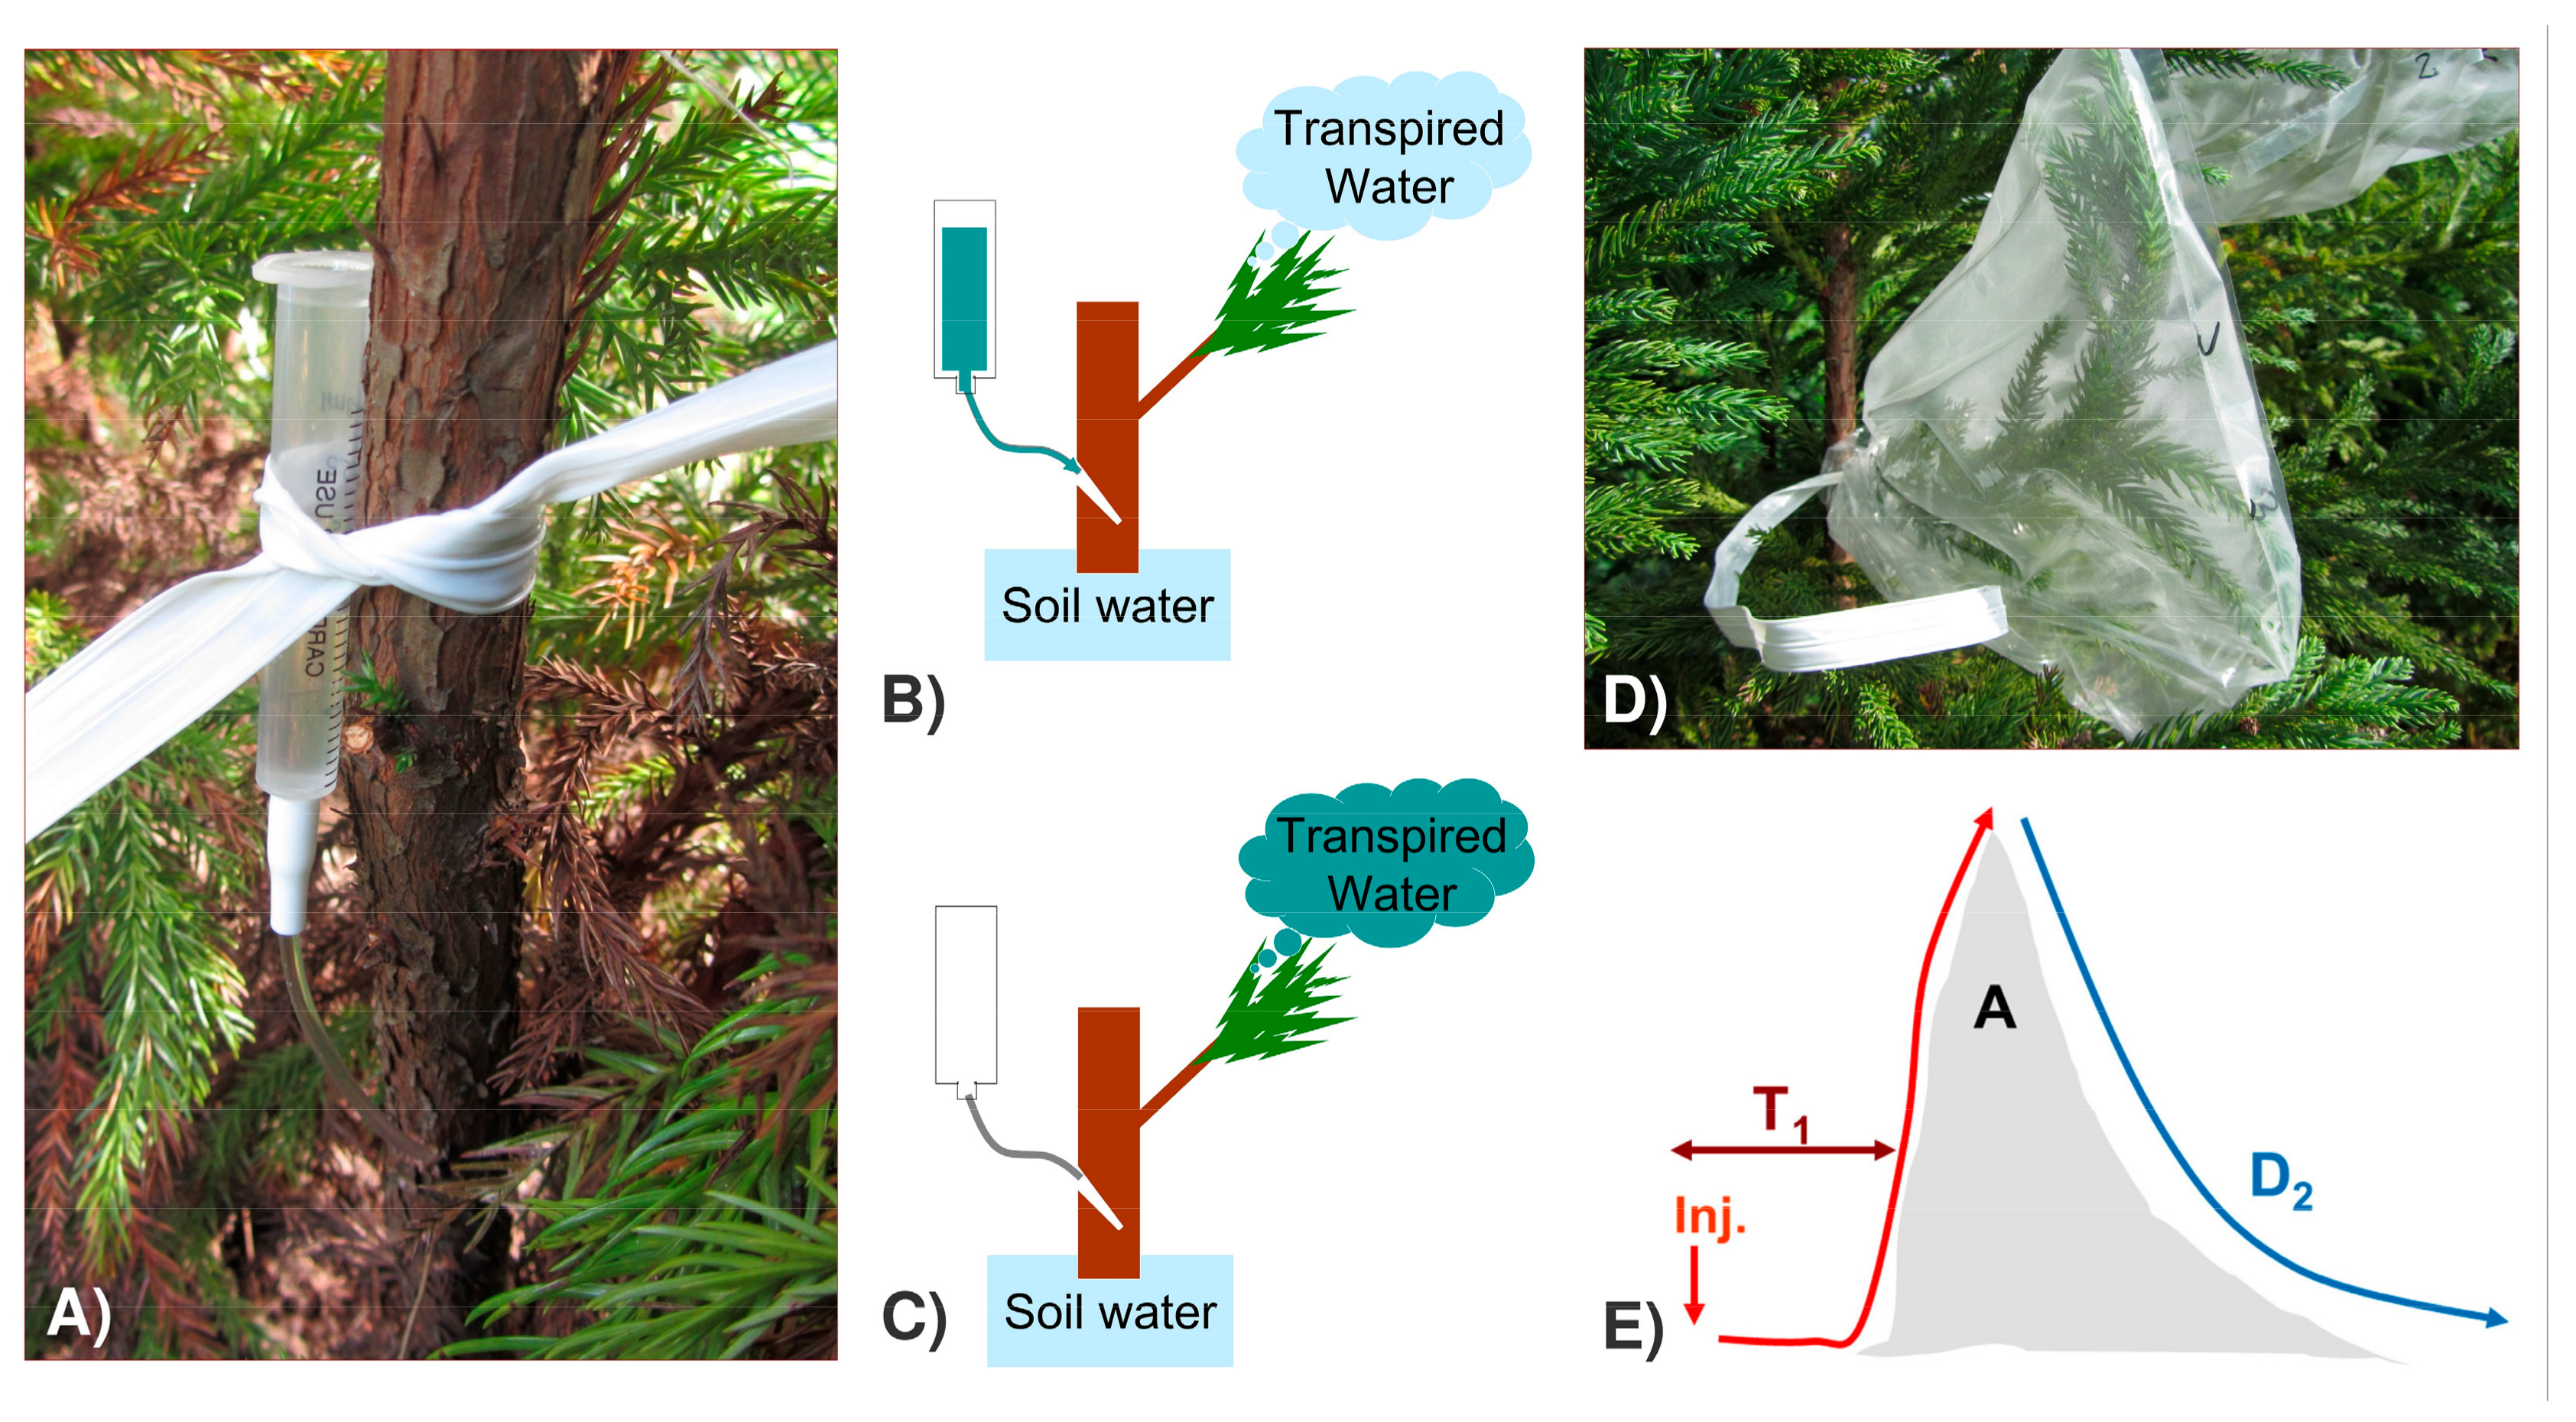
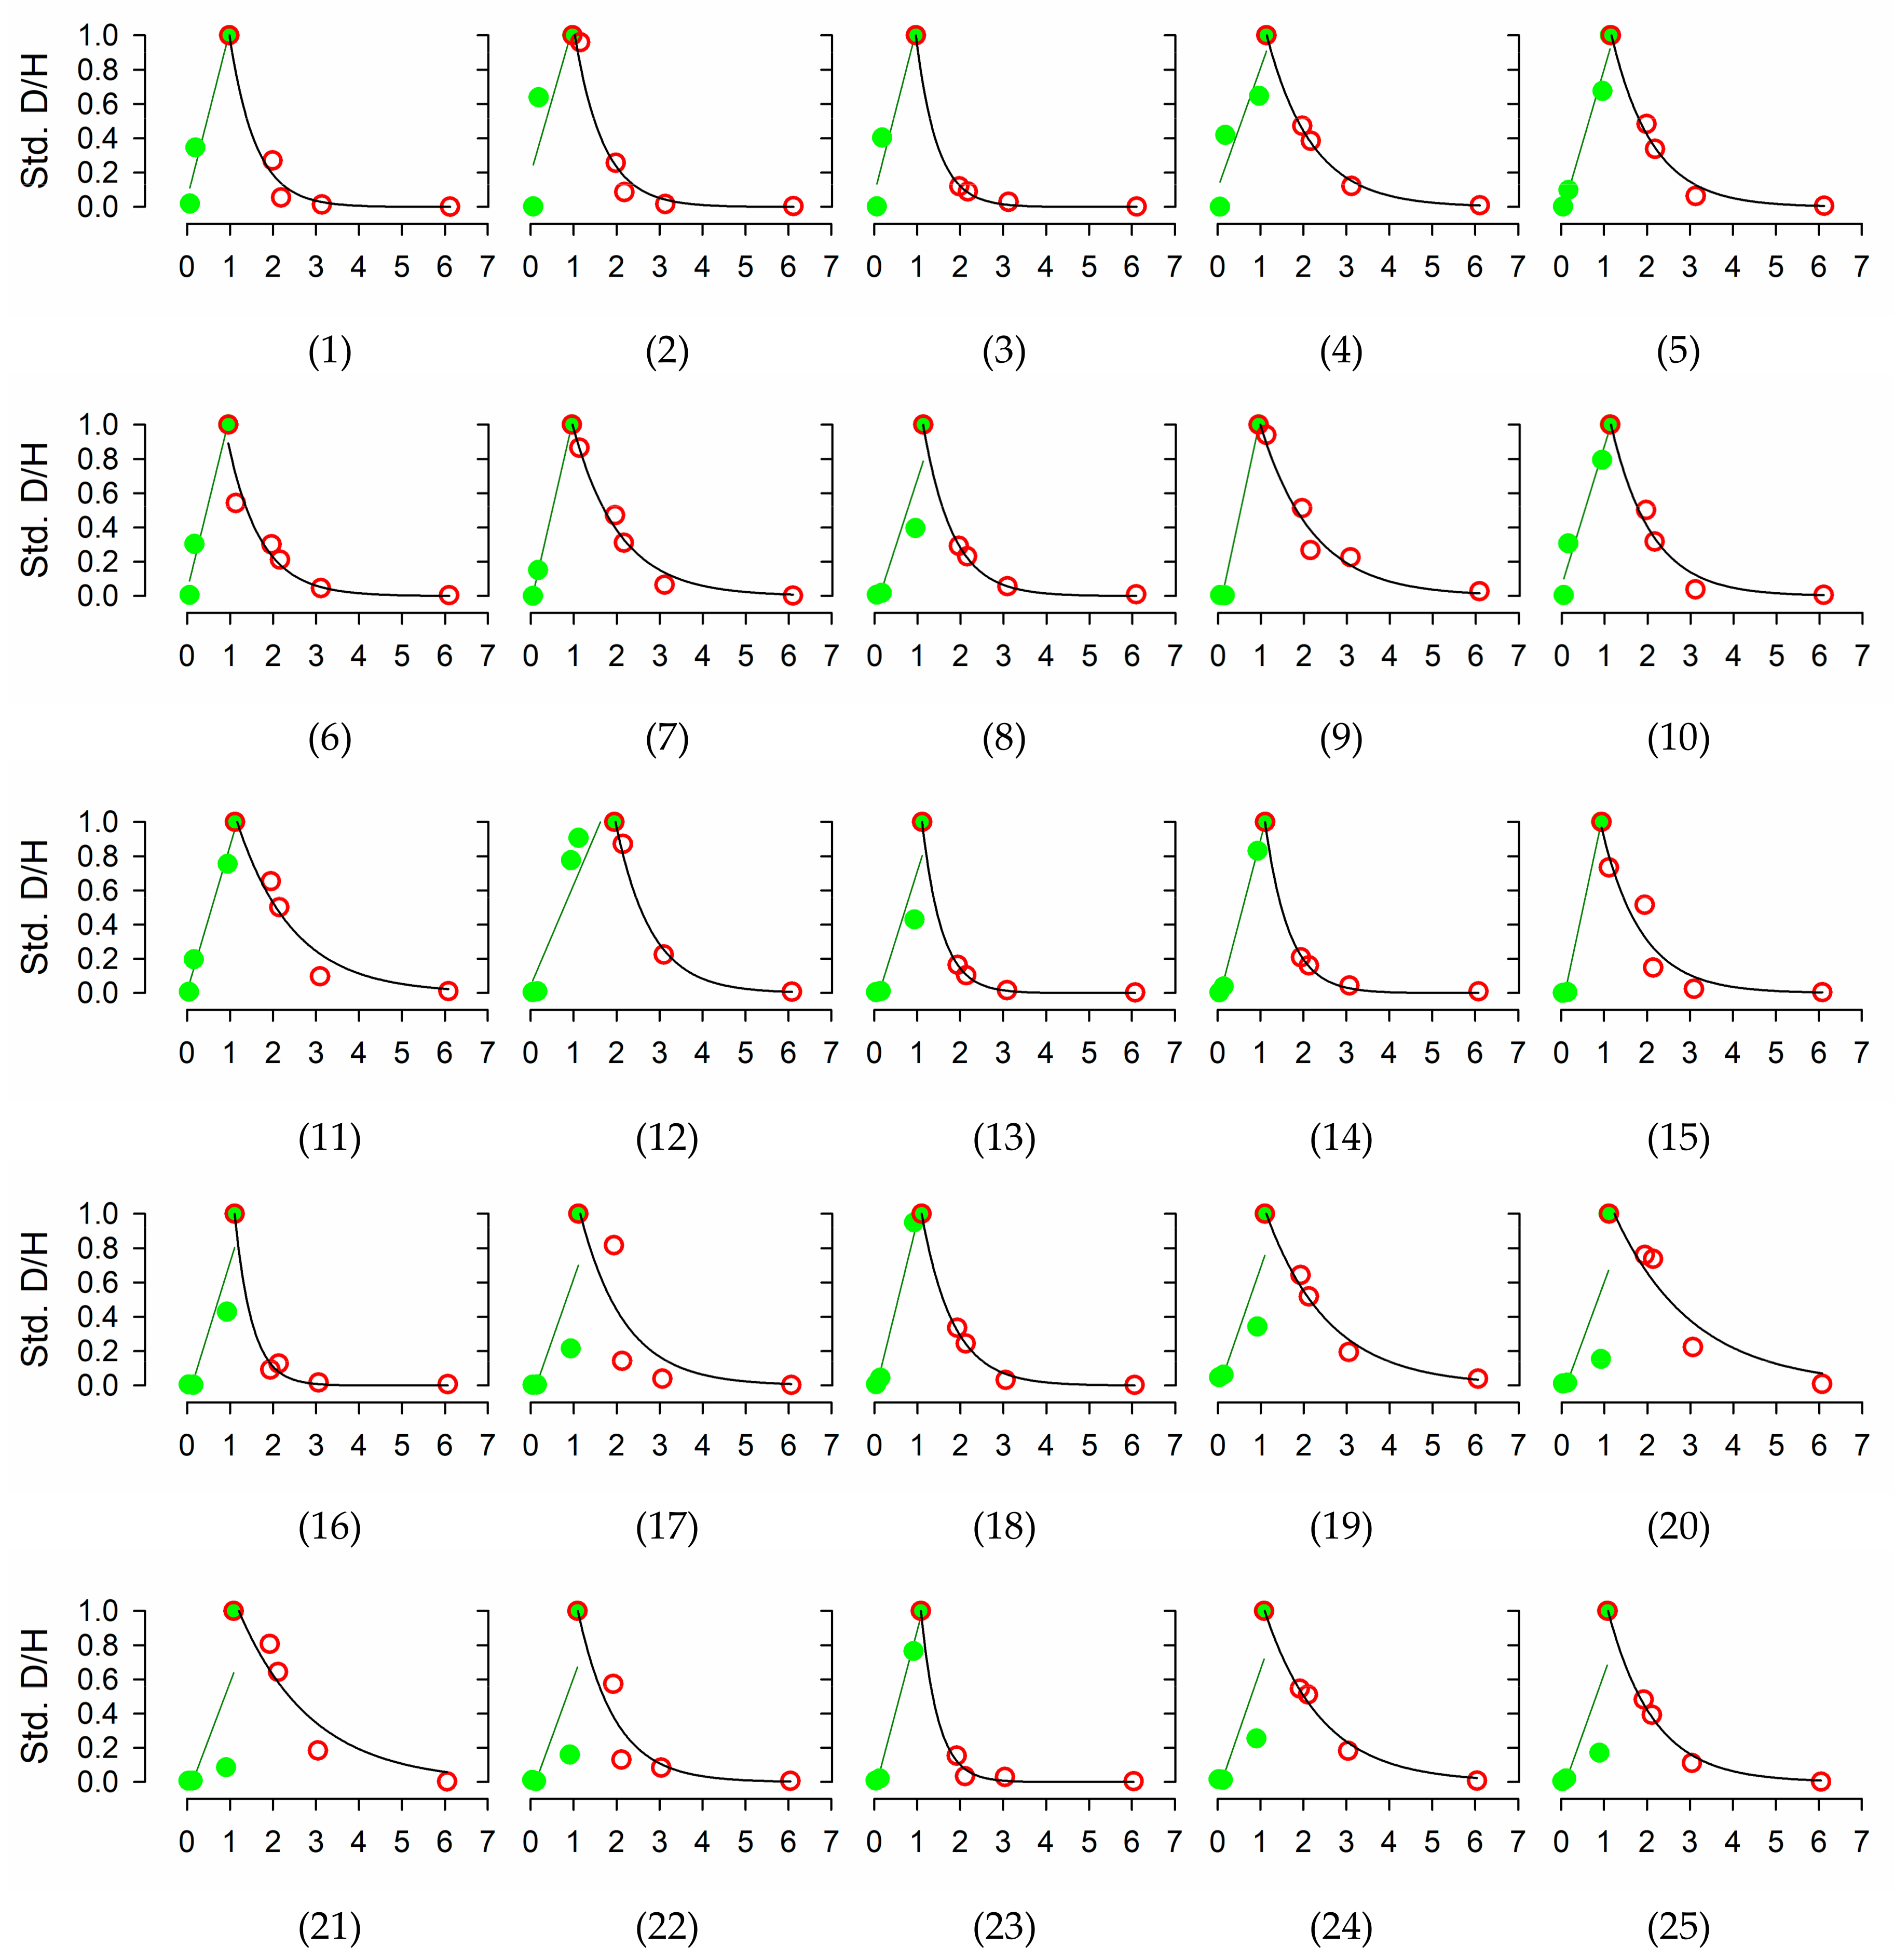
2.2. Quantification of Water Transport and Storage through Deuterium-Dilution Method

A deuterium labelling experiment was carried out between the 16 and 22 September 2014, as described in the literature [43]. Briefly, a known amount of Deuterium oxide (D2O 99.9 atom% D; Sigma-Aldrich, Saint Louis, MO, USA) was injected into the base of the tree trunk, followed by the collection of transpired water (condensed inside plastic bags, located at 2/3 of tree height) during the subsequent days.
The weather was sunny to moderately cloudy, with scattered light rains from 18 to 19 September (the environmental conditions and sampling schedule are summarized in Figure 1). The tracer was injected on 16 September, between 10:12 (tree 1) and 12:20 (tree 25), starting immediately with the first water collection. Following the literature [44], the amount injected was proportional to the basal area of the tree (112–1605 mm2), ranging between 0.89 and 9.99 g D2O. During the first three days, the water was collected twice (morning and afternoon), plus two additional afternoon water collections on 19 and 22 September. Each water collection lasted between two and four hours, registering the start and end of the sampling period individually for each tree. The light environment in the canopy of each individual tree was characterized through the measurements of the Photosynthetic photon flux density (PPFD, µmol m−2 s−1) at 2/3 of the tree height (LI-190 quantum sensor, LI-COR Inc., Lincoln, NB, USA).
The underlying principle of the Deuterium-labelling method is that the highly transpiring trees will show a faster labeling of the transpired water, but with less amplitude and for a shorter period of time, due to the dilution of the D2O injected over a greater pool of the transpired water (Figure 2). The integration over time of the amplitude of the D2O label, relative to the tracer amount, was used to estimate time-integrated tree water use (WU, g H2O day−1) [45,46], as follows:
W U = M 1 T C i Δ t i ,
where M is the mass of the tracer injected (in g), Ci is the D2O concentration at time i (g D2O g−1 H2O), and ∆ti is the duration of the time interval i (days) between water collection times, as previously recorded for each tree. The time response over time of the D2O tracer was used to determine three water transport and storage attributes, velocity, half-life, and residence time [47]. The tracer velocity (Vel), a surrogate for the linear sap velocity, was calculated by dividing the distance between the injection and collection point (2/3 of tree height), by the time required to reach 10% of the maximum tracer concentration, determined from a linear regression between the time and standardized values during the upward section of the curve. The tracer half-life (t½) and tracer residence time (RT) were estimated from an exponential decay function fitted to the downward section of the curve, as follows:
C = C 0 e λ t ,
where C0 and C stand for tracer concentrations at time zero (i.e., peak maximum) and time t, respectively, and λ is the decay constant. From this equation, t½ and RT were solved as the time needed to reach half of the maximum and pre-injection background values (D/H atom% = 0.015), respectively.

2.3. Isotope Analyses

The isotopic composition of the water samples was analyzed using the H2/H2O equilibration method in a Gas Bench (Thermo Fisher Scientific, Waltham, MA, USA) attached to a Delta V isotope ratio mass spectrometer (Thermo Fisher Scientific, Schwerte, Germany), at the Faculty of Environmental and Earth Science, Hokkaido University. The isotopic composition was expressed relative to an international standard (VSMOW, Vienna Standard Mean Ocean Water) in per mil notation (‰), as follows:
δ D = ( R sample / R vsmow 1 ) × 1000 ,
where Rsample and Rvsmow are the isotope ratio of water (D/H) for the sample and for the Vienna Standard Mean Ocean Water (VSMOW), respectively. Analytical error, determined as the standard deviation of the internal standards, was less than 2‰. To avoid a peak saturation because of the high D/H ratios in labelled water, the isotope ratios were determined on 1:10 dilutions of the original samples, using water with a known isotopic composition.

2.4. Measurement of Respiration Rates and Biometric Variables

At the end of the labelling experiment, the trees were uprooted and the respiration rates were determined separately for the stem, roots, and leaves, following the literature [30]. The measurements were taken during three consecutive days (24–26 September), and within 20 min of the tree uprooting, keeping the plant material wrapped in wet paper to prevent transpiration. The different tissues were enclosed in custom-made incubation chambers, including forced air circulation with an electric fan, with a volume adapted to the size of each tree part (2.6 to 120 L). The increment rate of the CO2 concentrations within the chamber was then measured every five seconds using an infrared CO2 analyzer (GMP343, Vaisala, Helsinki, Finland), and subsequently normalized to 20 °C, assuming Q10 = 2 [30]. For each individual, the fresh weight of each part, tree height, and length of the photosynthetic section of the stem were measured. The stem basal area (BA, mm2) and basal area increments (BAI, mm2 year−1) were calculated as the area of an ellipse, with the maximum and minimum diameters within each tree ring as the two axis. As a result of the small size of the trees, we determined the BA and BAI at 10% of tree height, instead of the standard breast height. A subsample of leaves, coarse roots, and a section of the base and the apex of the stem were weighted fresh, and then dried for 48 h at 60 °C to determine water concentration (WC, % fresh weight). For the two stem sections, the stem density (kg m−3) was estimated as the quotient between the dry weight and the volume of a truncated cone (including bark). The total dry weight for the root, stem, and leaves was estimated from the fresh weight measurements and WC. Finally, we calculated the mass-specific respiration and mass-specific water use on a fresh-weight and dry-weight basis.

2.5. Data Analysis

Following the literature [30], we assessed the mass-scaling relationships for respiration and water use using a simple-power function on the log–log coordinates of the log-transformed version of Equation (1) (N = 25). We used an analysis of variance (ANOVA) to assess the effect of the tree ages on the size-related variables, and the principal component analysis (PCA) and linear regression to assess the association between the variables. The means are shown together with standard errors of the mean. The normality of variables was tested with the Shapiro–Wilks test. The size-related variables, respiration rates, WU, and Vel were log-transformed to satisfy the normality assumptions in the statistical analyses. The rest of variables were used without transformation.

3. Results

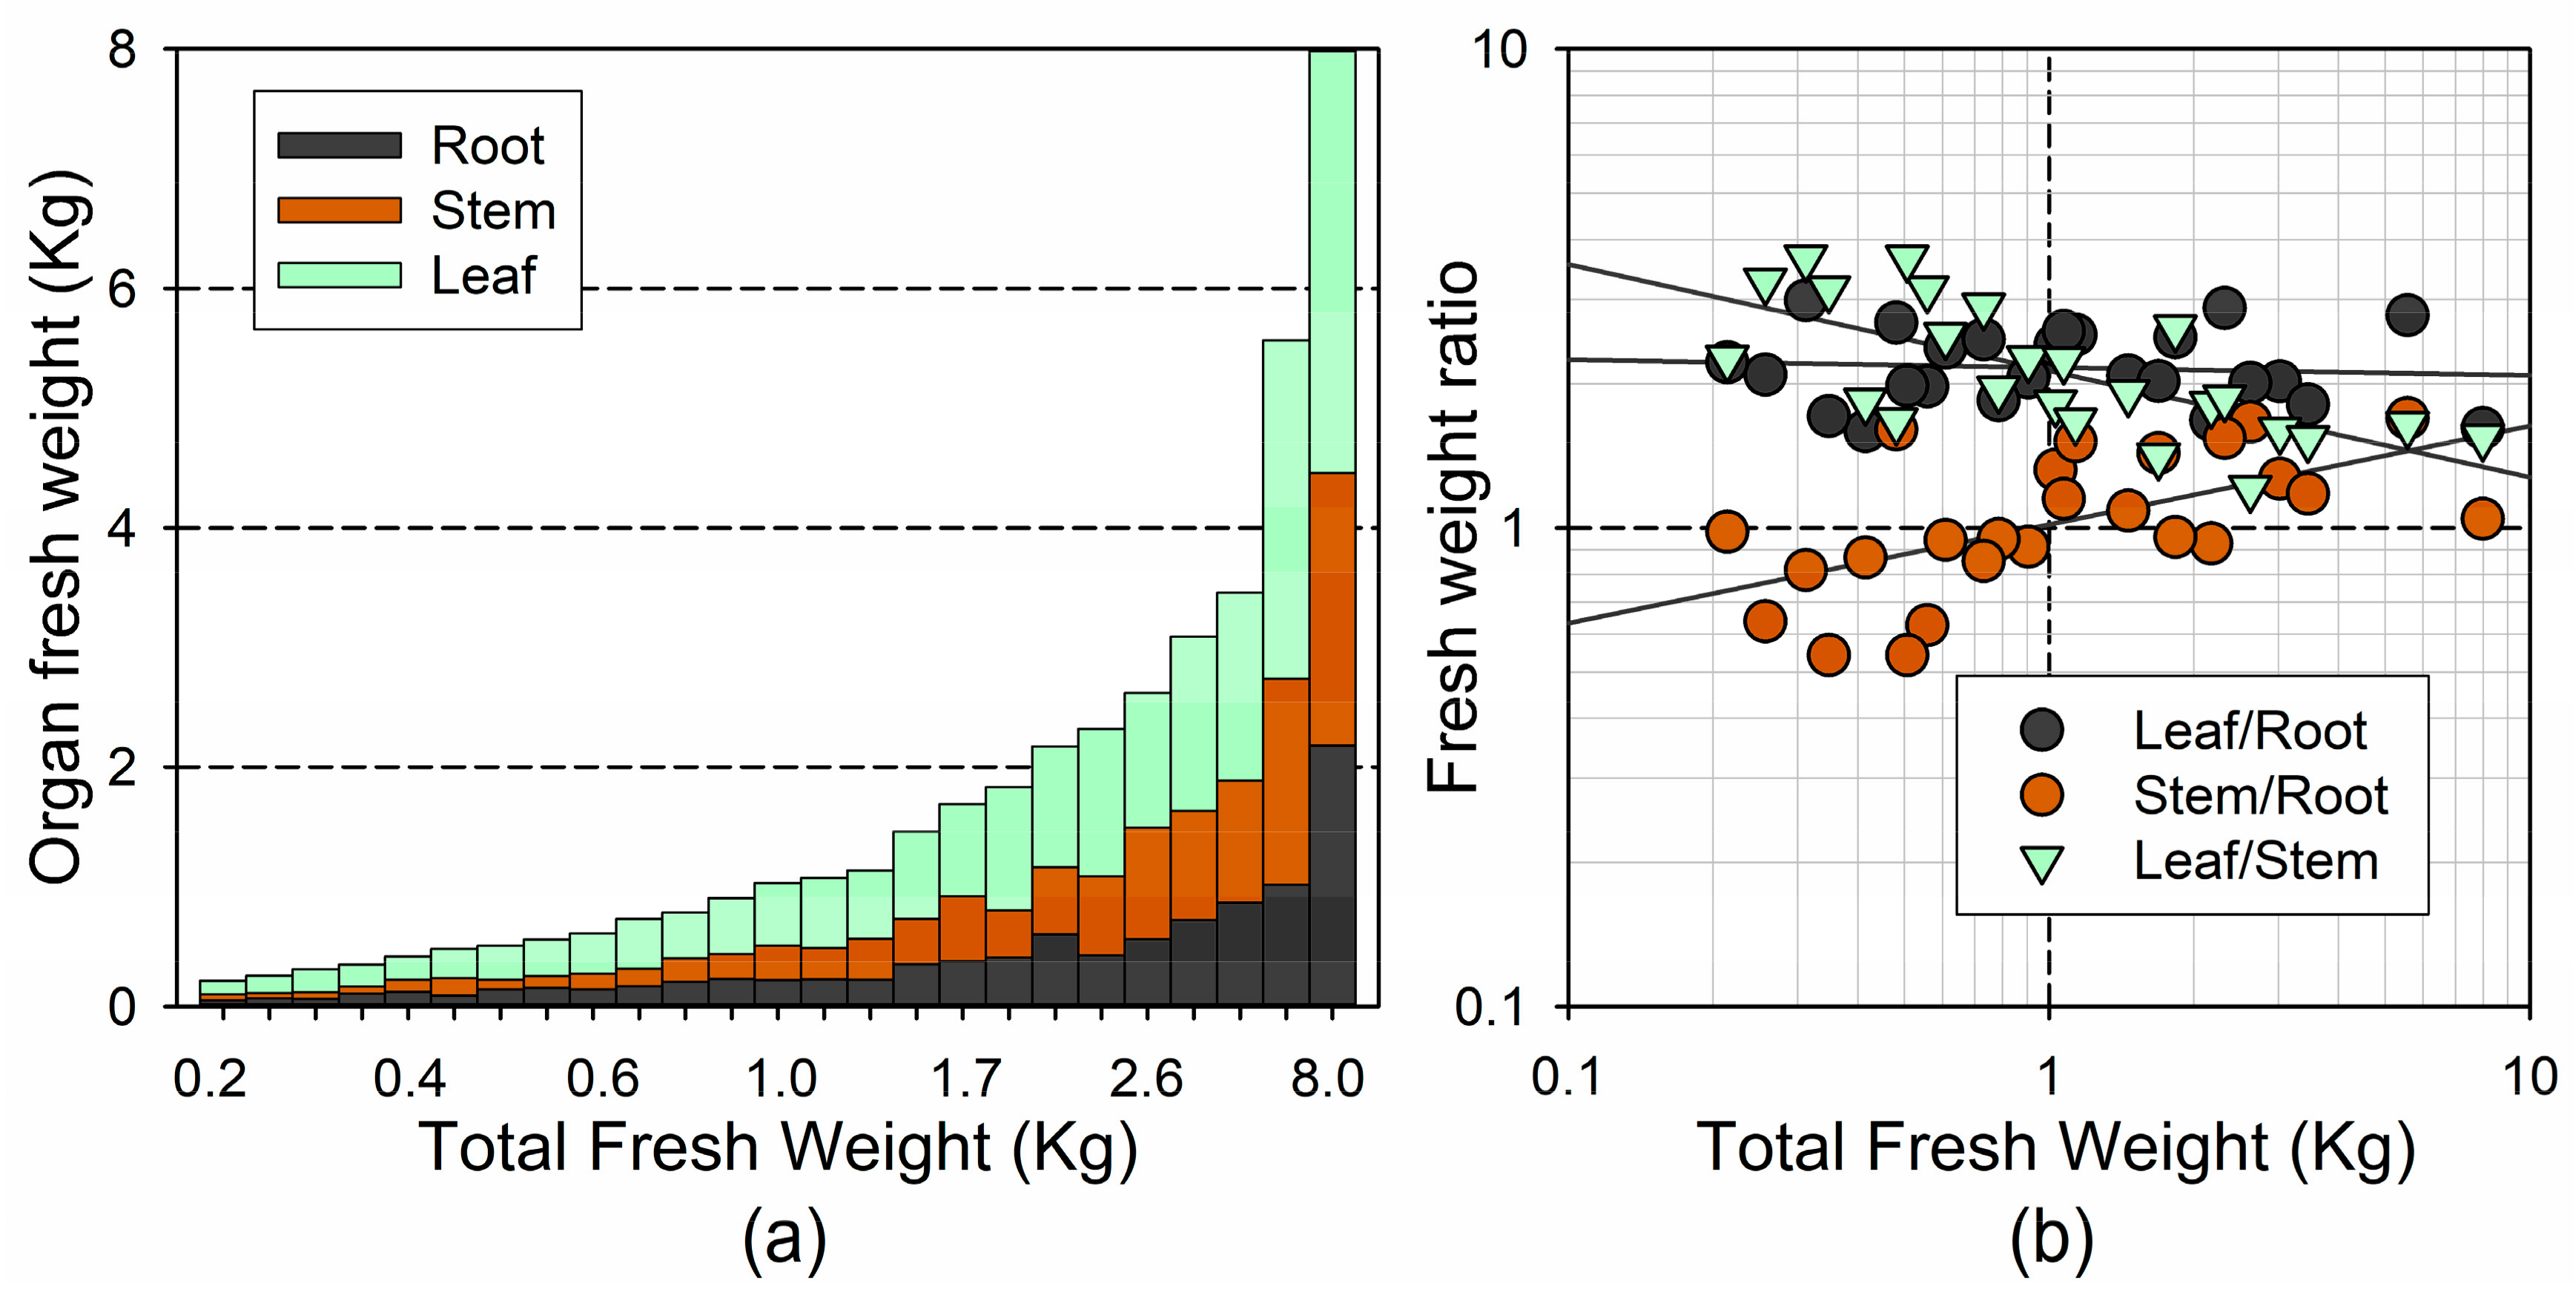
3.1. Tree Morphometric Variables

The summary statistics of the main morphometric variables are shown in Table 1. The sampled trees showed a 3.7-fold range in tree height (0.75–2.81 m), and a 37-fold range in the whole-plant fresh weight (0.21–7.98 kg). The stem size showed the largest relative differences (52- and 58-fold, in weight and volume, respectively), compared with the root and leaf weight (43- and 36-fold variation, respectively). Comparatively, the range of variation in the recent BAI was much larger than the range of variation in the total BA (34- and 16-fold, respectively, see Table 1). The proportion of BA formed during the last three years ranged from 30 to 75% of the total BA, and explained 45% of the variability in the total shoot biomass ( y = 3.78 x 2.47 ,   R 2 = 0.45 ,   p < 0.001 ). Conversely, we did not find significant differences among the age classes in any of the size-related variables studied (p = 0.214–0.588), indicating that the size differences were largely determined by the growth rates.
The distribution of the fresh weight among the different plant organs varied with the tree size (Figure 3a). The changes in the mass allocation with the tree size did not follow a linear trend; we found the largest differences among the smaller trees (ca. <2 kg), and was best depicted on the log–log coordinates (Figure 3b). We found a significant increase with the total fresh weight in the stem/root ratio ( y = 1.016 x 0.206 ,   R 2 = 0.35 ,   p = 0.001 ), and a significant decrease in the leaf/stem ratio ( y = 2.129 x 0.222 ,   R 2 = 0.47 ,   p < 0.001 ), but no significant changes in the leaf/root ratio ( p = 0.499 ). Conversely, the shoot/root ratio did not change significantly with the tree size (3.27 ± 0.126; p = 0.204 ). These results indicate that the leaf mass was adjusted to the root size, coupling the water demand with the water uptake, whereas the conducting tissue (stem) increased with the size, at the expense of the water uptake capacity (root size).

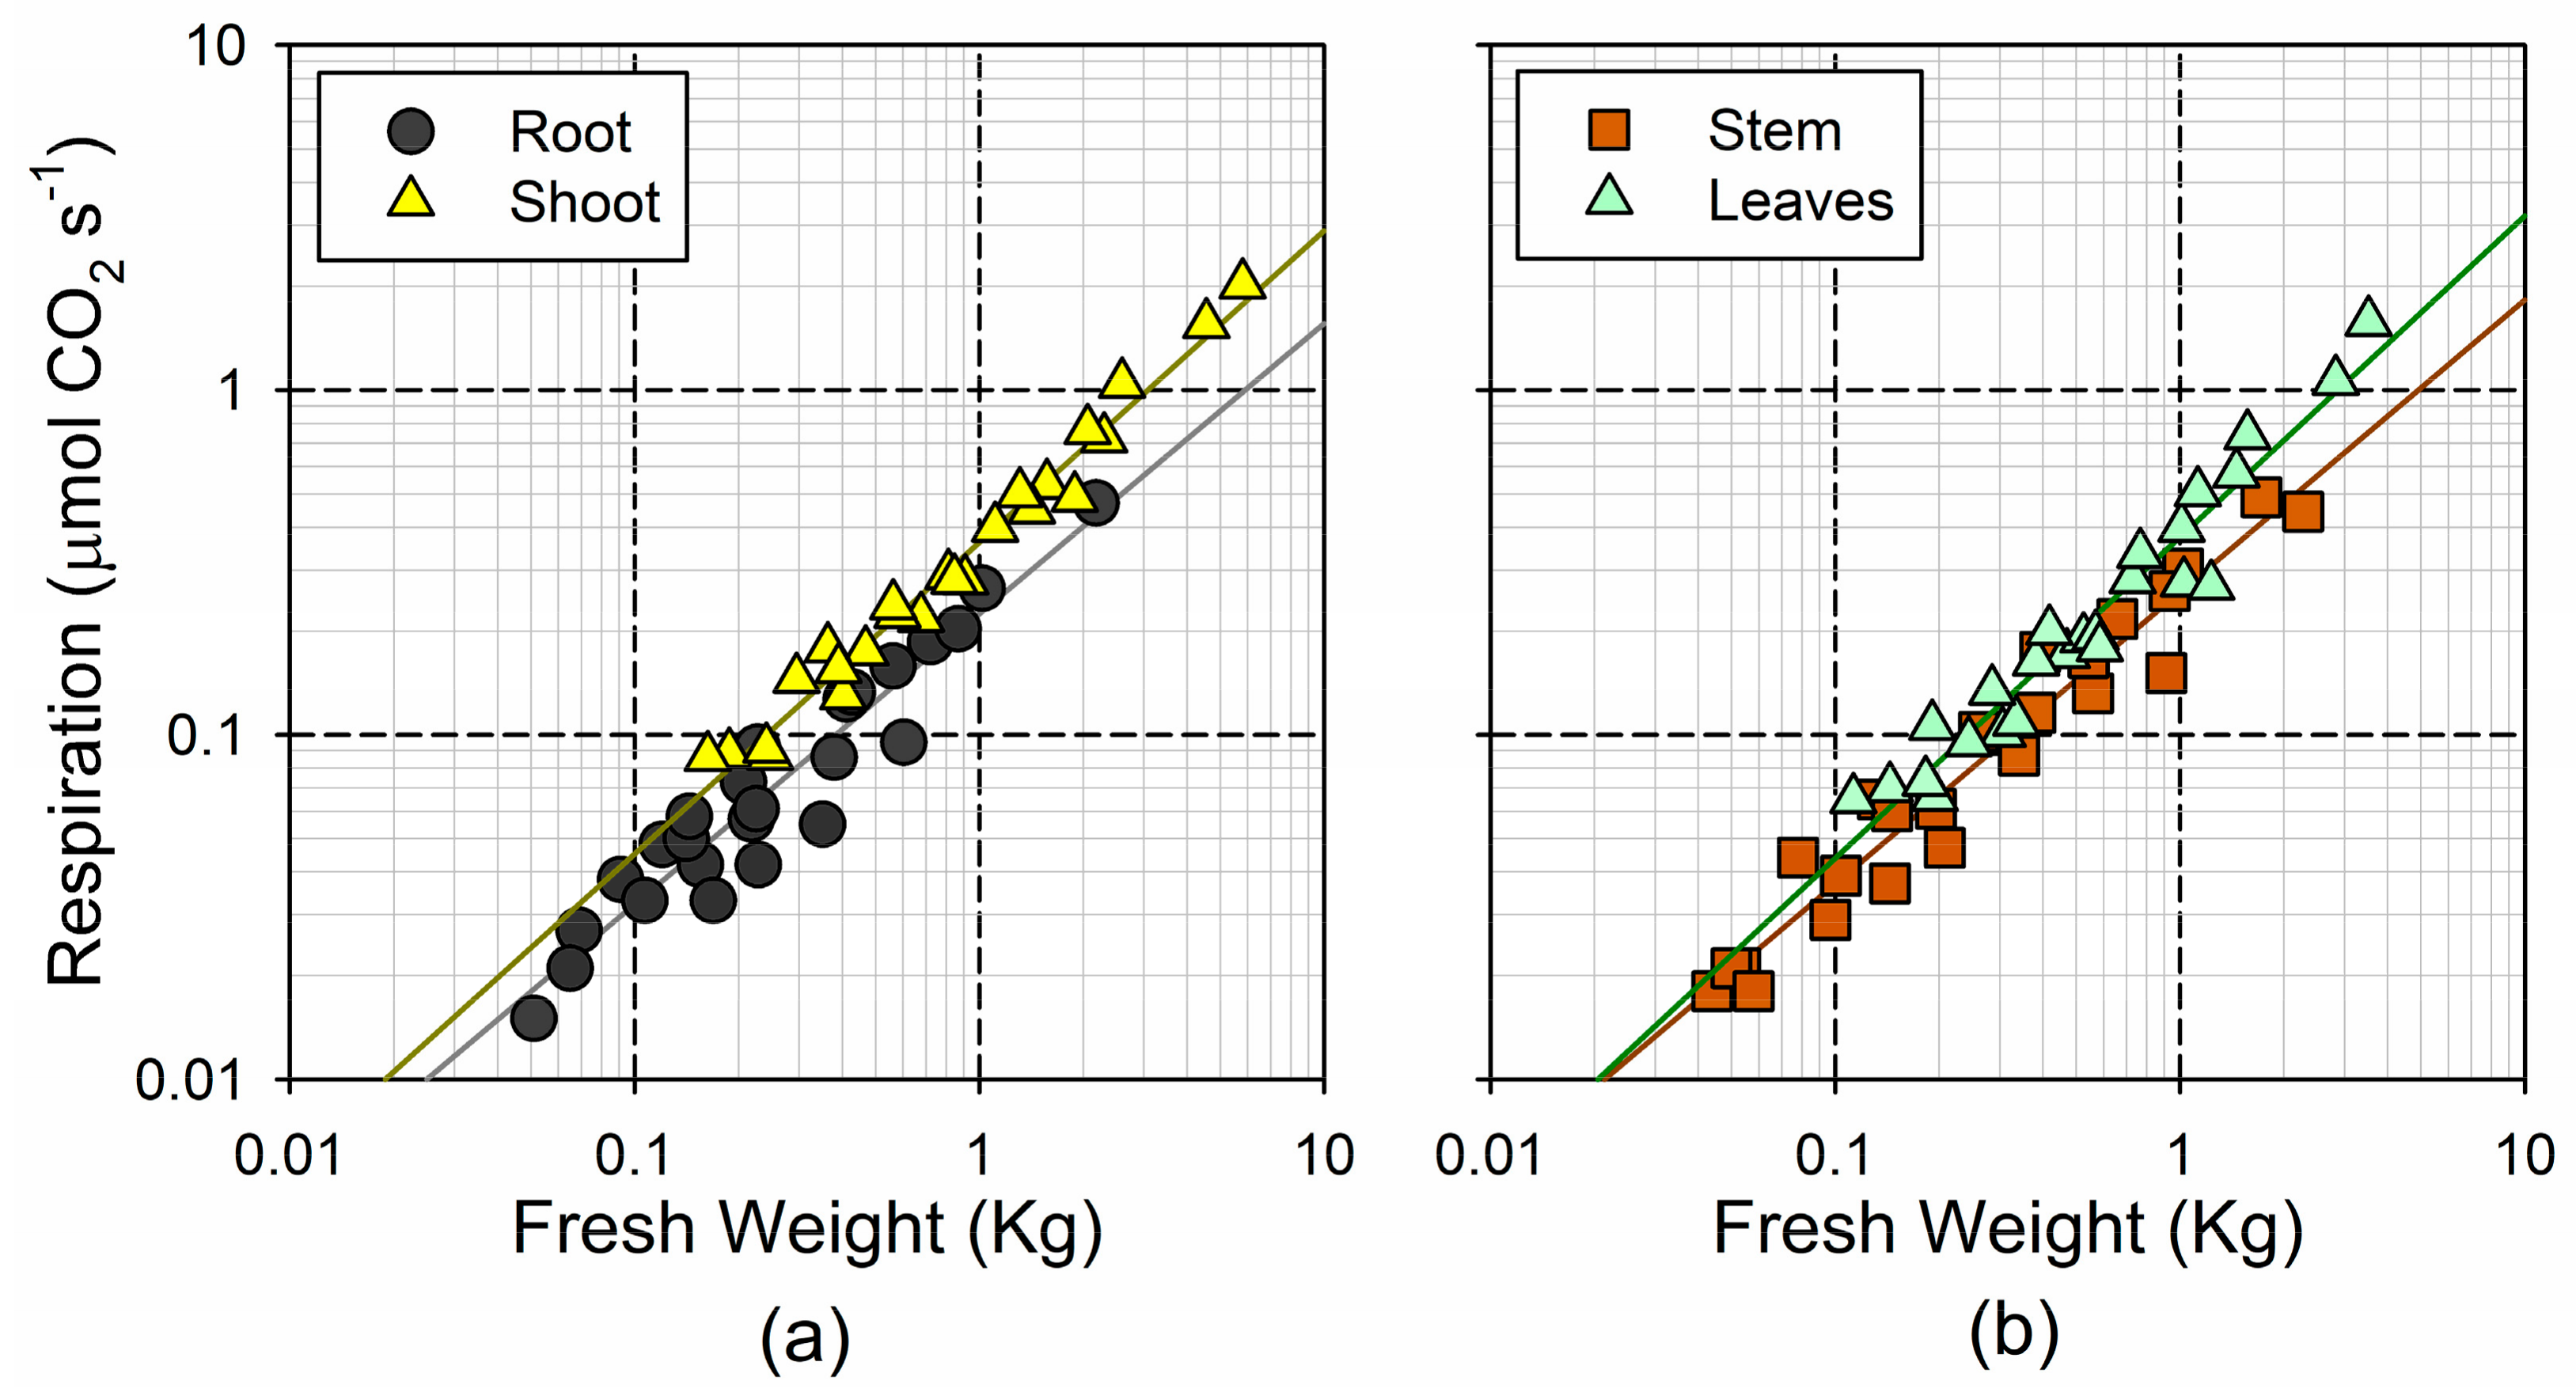
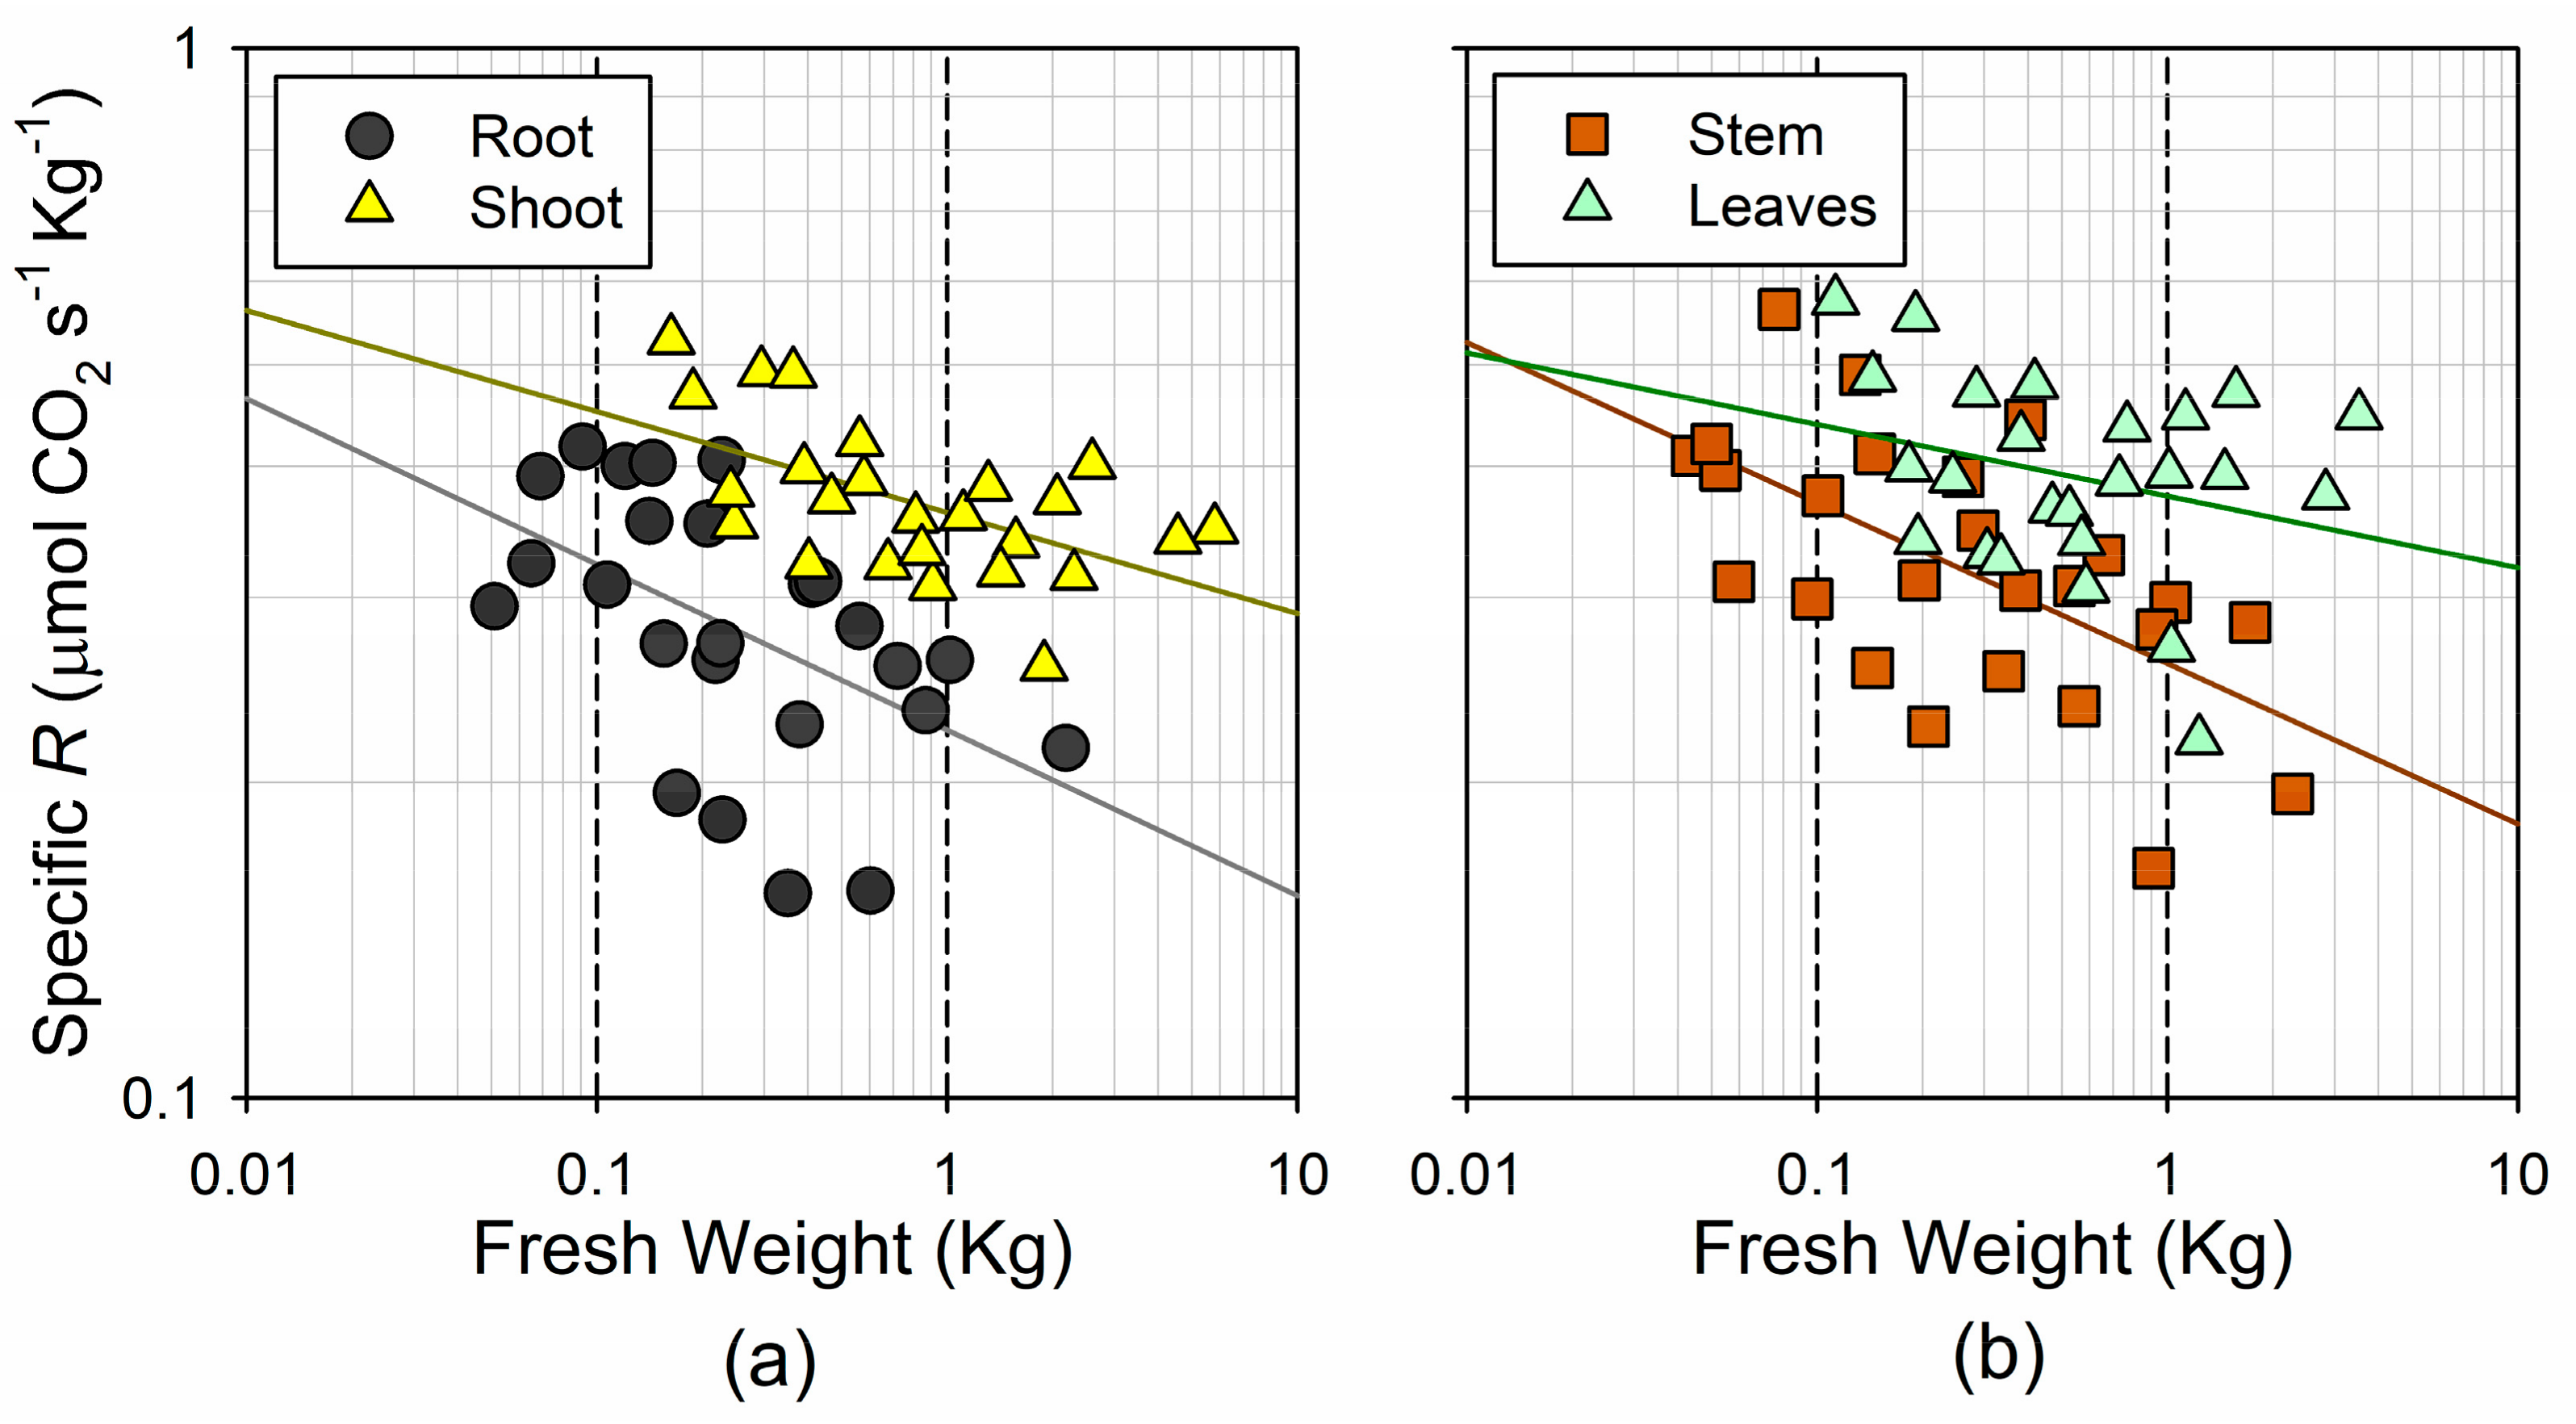
3.2. Respiration Rates and Their Association with Tree Size

Overall, the respiration rates showed a smaller relative range of variation, as compared to the range in the fresh weight. The sampled trees showed a 25-fold increase in the total respiration, ranging between 0.10 and 2.49 µmol CO2 s−1. The lack of a linear increase in the respiration was in accordance with the theoretical size-scaling of the respiration rates, which could be described with a power function of the fresh weight (Figure 4). The shoots showed a steeper and more linear (i.e., b coefficient, closer to 1) increase in the respiration with weight ( y = 0.361 x 0.904 ,   R 2 = 0.98 ,   p < 0.001 ), as compared to the roots ( y = 0.224 x 0.842 ,   R 2 = 0.91 ,   p < 0.001 ) (Figure 4a). However, this was mainly determined by the steep response of the leaf respiration ( y = 0.375 x 0.932 ,   R 2 = 0.94 ,   p < 0.001 ), whereas the response of the stem was similar to the root ( y = 0.260 x 0.847 ,   R 2 = 0.95 ,   p < 0.001 ) (Figure 4b). Indeed, the 95% confidence interval for b in the two woody tissues was significantly lower than the unity (0.73–0.96 in the root; 0.76–0.93 in the stem), whereas this was not the case for the leaves (0.83–1.03). This indicates that the mass-specific metabolic rates in the woody tissues decline significantly with organ size, but remain nearly constant in the photosynthetic tissues.
The existence of a near-linear increase with the mass in the total leaf respiration, but not in the total wood respiration, was further evidenced when comparing the mass-specific respiration rates with the organ size (Figure 5). On the log–log scale, both the shoot and root specific respiration decreased significantly with the fresh weight ( y = 0.361 x 0.096 ,   R 2 = 0.32 ,   p = 0.025 in the shoot; y = 0.224 x 0.158 ,   R 2 = 0.27 ,   p = 0.064 in the root) (Figure 5a). However, this trend was significant for the stem ( y = 0.260 x 0.153 ,   R 2 = 0.37 ,   p < 0.001 ), but not for the leaves ( p = 0.125 ) (Figure 5b). Due to the differential response of respiration to the mass in the green and woody tissues, the respiratory partitioning among the plant organs followed less consistent trends than those observed for the fresh weight. We only found a weak association between the total fresh weight and the stem/root respiration ratio ( y = 1.165 x 0.172 ,   R 2 = 0.20 ,   p = 0.020 ). Neither the leaf/stem respiration ratio nor the leaf/root respiration ratio changed significantly with the total fresh weight ( p = 0.162 and p = 0.196 , respectively). Considering the association between the dry weight and respiration, as well as the dry weight allocation among the organs, we observed nearly the same trends as for the fresh weight, although slightly weaker (data not shown).

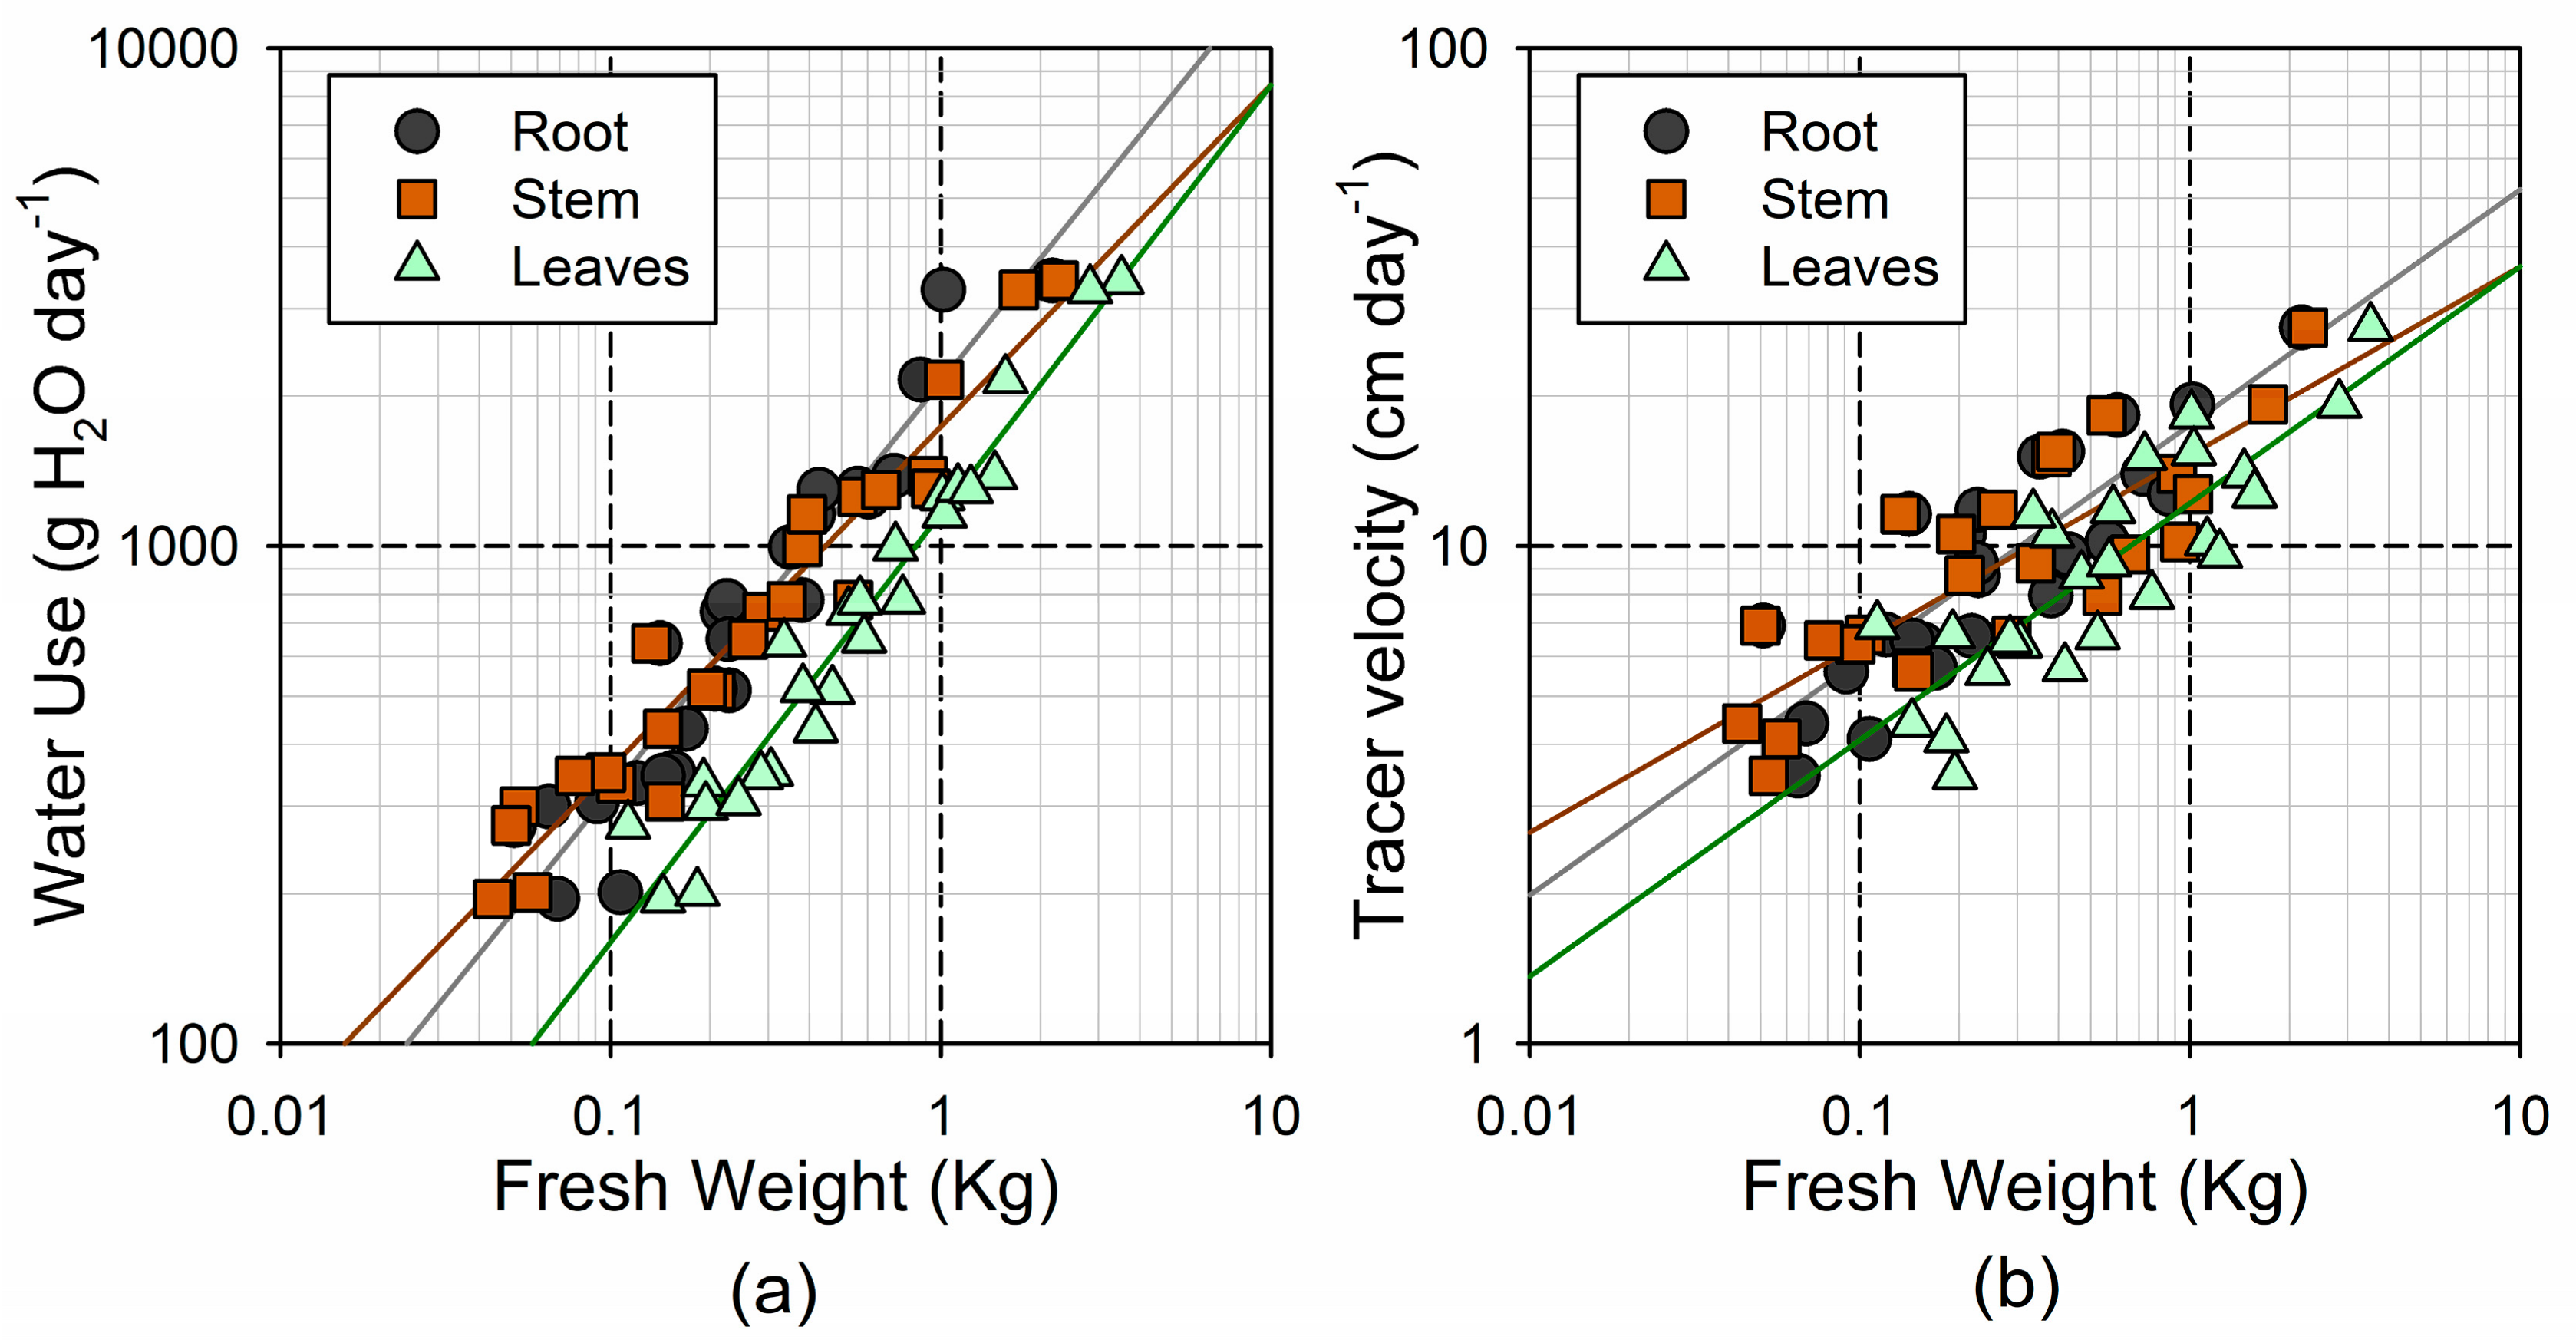
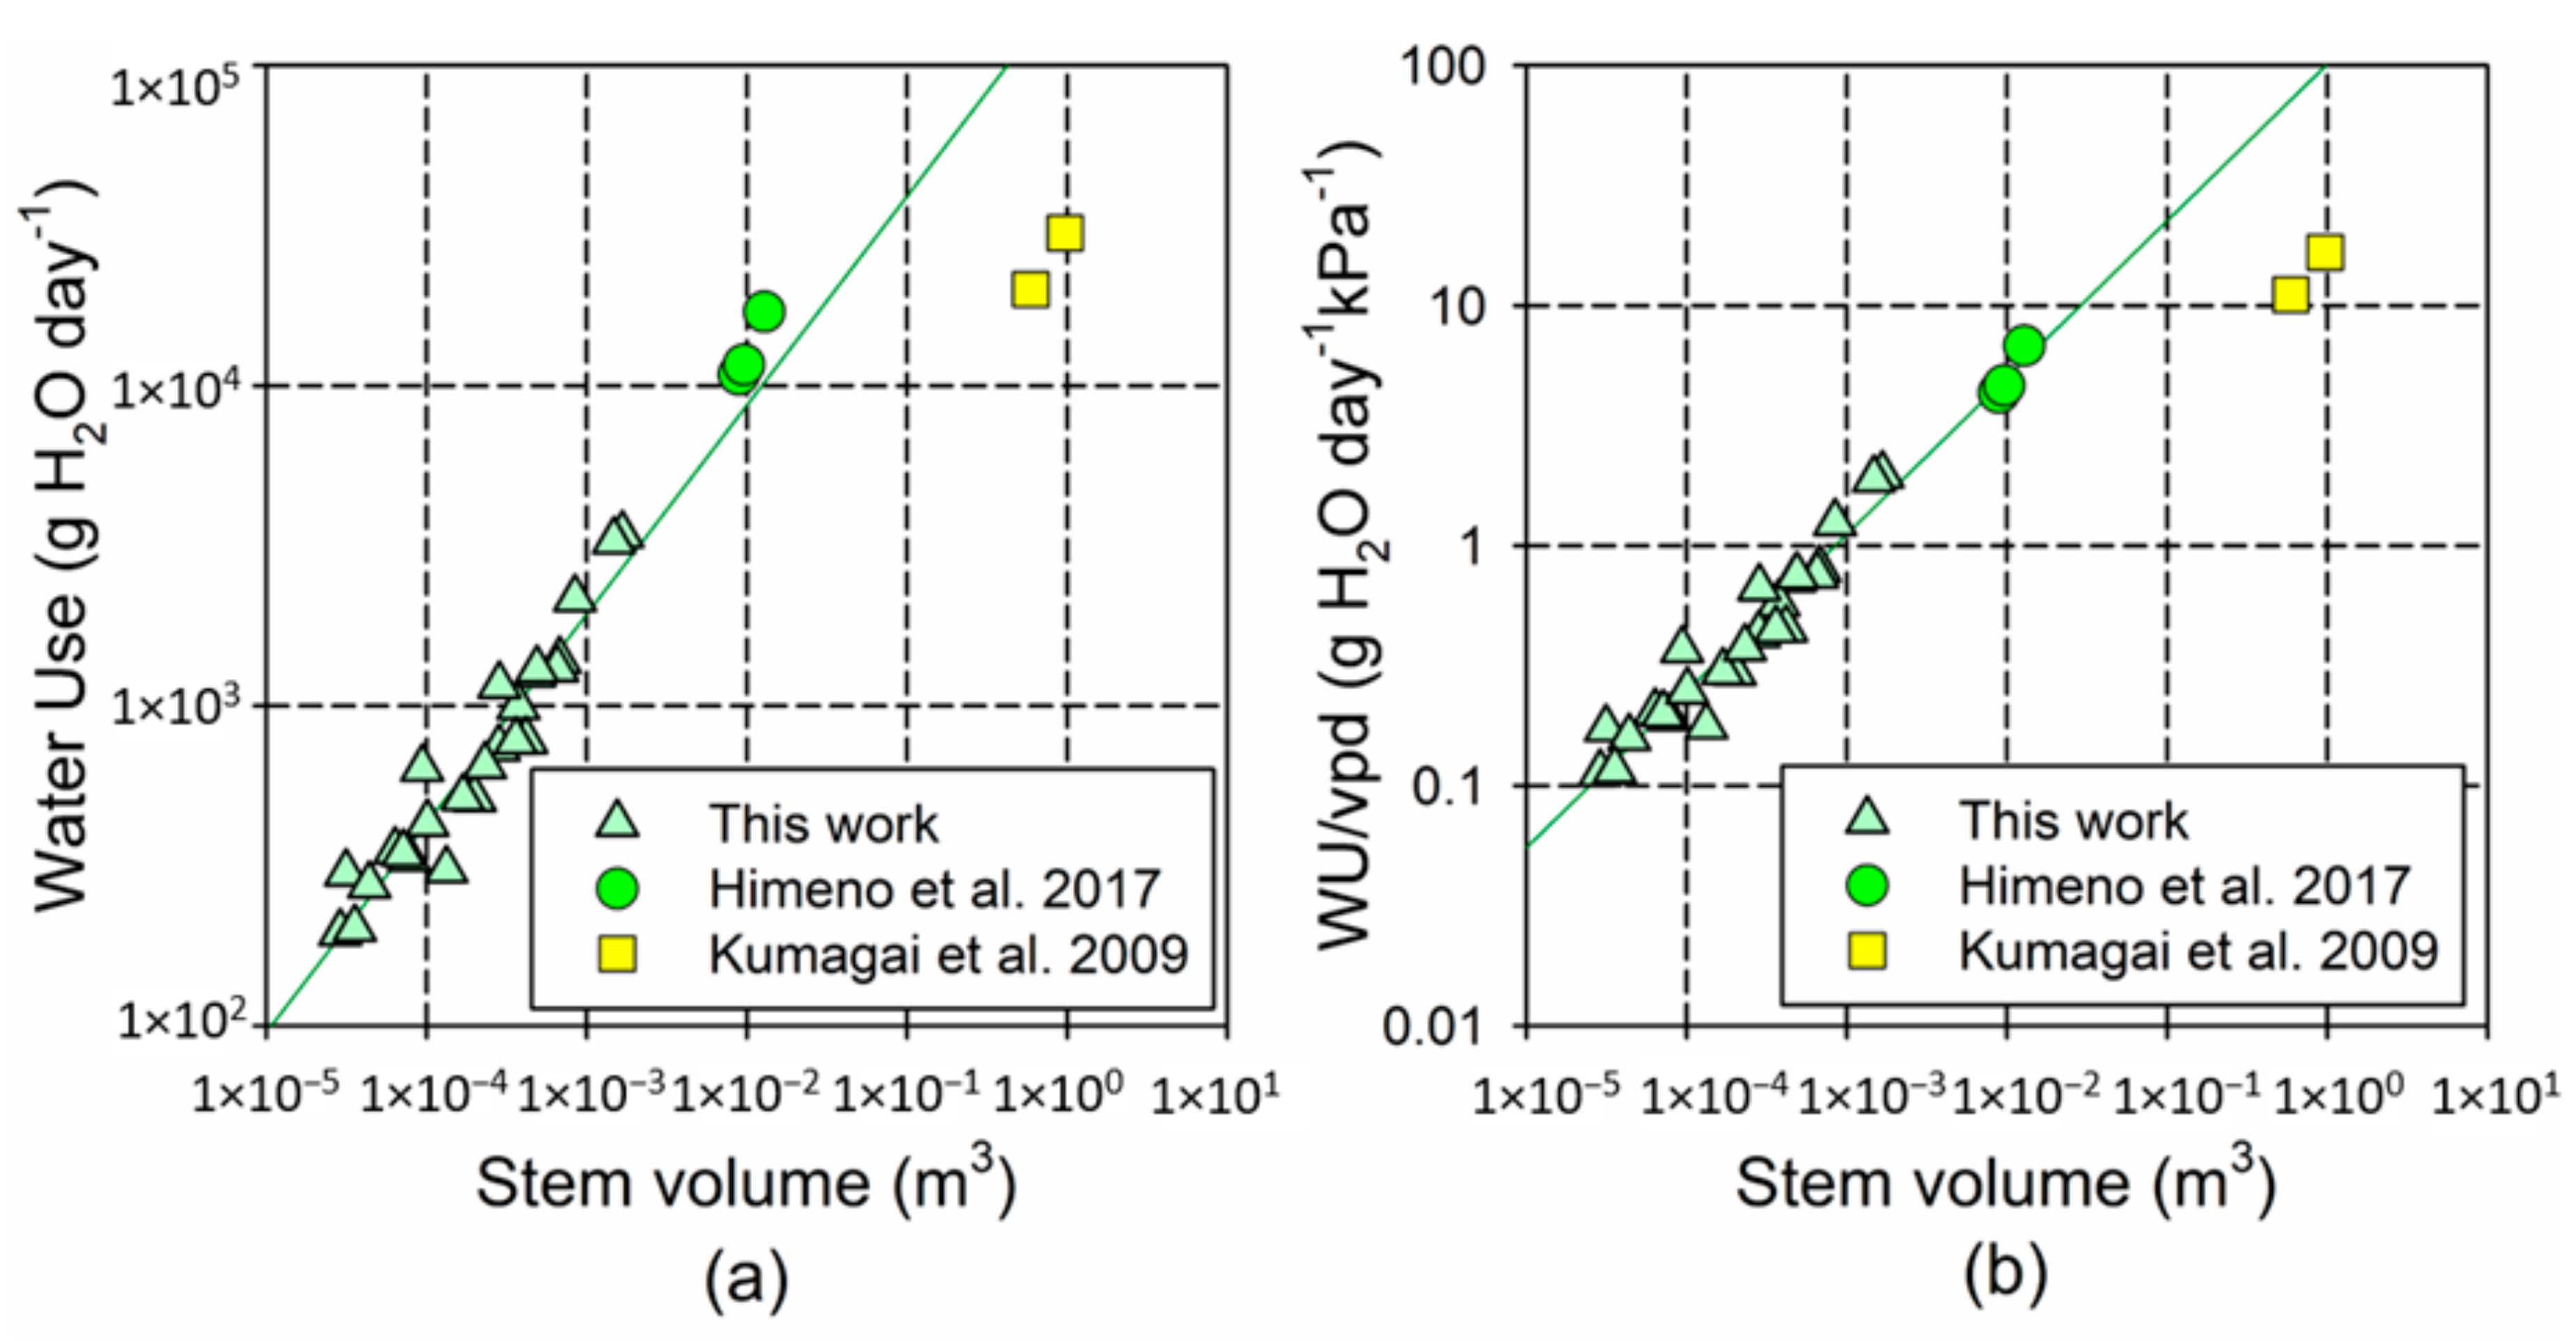
3.3. Water Use and Water Storage

On average, the label peaked within one day after injection (Table 2; for peak plot see Figure A1 in Appendix A). The maximum D/H in the transpired water was 3- to 41-fold larger than the background (D/H atom % = 0.015), approaching pre-injection values in the last sampling time, about six days after injection (Table 2).
As it occurred with the respiration, the Vel and WU showed a smaller relative range of variation than the tree size (32- and 18-fold increase, respectively; see Table 2). The Vel and WU are surrogates for the linear sap velocity and sap flow, respectively, and were consistently associated through a power function ( W U = 214.9 v e l 0.656 ,   R 2 = 0.46 ,   p < 0.001 ). The leaf-specific WU (i.e., transpiration rate per unit of leaf mass) showed a much smaller range of variation (2.6-fold). The two variables associated with the water storage dynamics, and RT, also showed a relatively small range of variation (6- and 4-fold, respectively).
Both the WU and Vel followed a power response to the tree size (Figure 6). For WU, the strongest association was found with the leaf fresh weight ( y = 1162 x 0.861 ,   R 2 = 0.95 ,   p < 0.001 ), followed by the stem and root fresh weight ( y = 1737 x 0.687 ,   R 2 = 0.94 ,   p < 0.001 and y = 2136 x 0.822 ,   R 2 = 0.91 ,   p < 0.001 , respectively; see Figure 5a). Similar responses were found considering either the shoot or total fresh weight ( y = 815 x 0.807 ,   R 2 = 0.96 ,   p < 0.001 and y = 653 x 0.816 ,   R 2 = 0.95 ,   p < 0.001 , respectively). Although the b coefficient was significantly larger in the leaves and roots than in the stem, in all cases, the 95% confidence interval for b was significantly lower than the unity (0.78–0.95 in leaves; 0.61–0.76 in stem; 0.71–0.93 in roots). In other words, the increase in the transpiration with size was not linear, being less pronounced in the larger individuals. Accordingly, the leaf-specific WU showed a negative association with the leaf fresh weight ( y = 1162 x 0.139 ,   R 2 = 0.33 ,   p = 0.003 ) (i.e., transpiration rates per unit of leaf mass were smaller in the largest tree). The Vel showed the strongest association with the root fresh weight ( y = 13.67 x 0.616 ,   R 2 = 0.48 ,   p < 0.001 ), followed by the leaf and stem fresh weight ( y = 8.32 x 0.580 ,   R 2 = 0.40 ,   p < 0.001 and y = 10.76 x 0.452 ,   R 2 = 0.38 ,   p < 0.001 , respectively; Figure 5b).
The WC and stem density showed relatively small variability across individuals, with a 1.2- and 1.7-fold range, respectively (Figure 7). However, we observed significant differences in the WC among the plant tissues ( p < 0.001 ; leaf > root > stem apex > stem base), as well as a significant decrease in the stem density from the base to the apex ( p = 0.014 ). The WC in the roots and stem tissues increased with tree fresh weight ( y = 0.577 + 0.04698 × log ( x ) ,   R 2 = 0.38 ,   p = 0.001 , in the root, y = 0.505 + 0.05009 × log ( x ) ,   R 2 = 0.51 ,   p < 0.001 in the stem base, and y = 0.555 + 0.06326 × log ( x ) ,   R 2 = 0.72 ,   p < 0.001 ,   in the stem apex; see Figure 7a). Conversely, the leaf WC did not change significantly with the tree size ( p = 0.995 ). The stem base density decreased significantly with the tree fresh weight ( y = 642 102.4 × log ( x ) ,   R 2 = 0.34 ,   p = 0.002 ; see Figure 7b), but this trend was not significant for the stem top density ( p = 0.242 ).
Due to the differential response of the tissue the WC, changes in the relative contribution to the water storage per tissue (i.e., total water per plant organ) were slightly stronger than in the fresh and dry weight allocation. We found a significant increase in the stem/root water storage ratio with total fresh weight ( y = 0.933 x 0.217 ,   R 2 = 0.37 ,   p = 0.001 ), and a significant decrease in the leaf/stem ratio ( y = 2.627 x 0.270 ,   R 2 = 0.53 ,   p < 0.001 ), but no significant changes in the leaf/root ratio ( p = 0.158 ).
Unlike WU and Vel, the two variables associated with water storage dynamics (t½ and RT) were not associated with the tree size. Among the different morphometric variables tested, we only found a weak positive association between the stem base density and both t½ ( log ( y ) = 0.809 + 0.001099 x ,   R 2 = 0.16 ,   p = 0.048 ) and RT ( y = 1.05 + 0.00607 x ,   R 2 = 0.18 , p = 0.035 ). Conversely, the stem base density was negatively associated with WU and Vel ( log ( y ) = 4.684 0.00289 x ,   R 2 = 0.37 ,   p = 0.001 and log ( y ) = 2.56 0.00280 x ,   R 2 = 0.33 ,   p = 0.003 , respectively). This suggests that the larger water retention times and limited water transport in the small trees was partly due to the reduced water conductivity in the dense stems. Associations between the dry weight and hydraulic traits followed very similar patterns to those found for the fresh weight, but slightly weaker (data not shown).

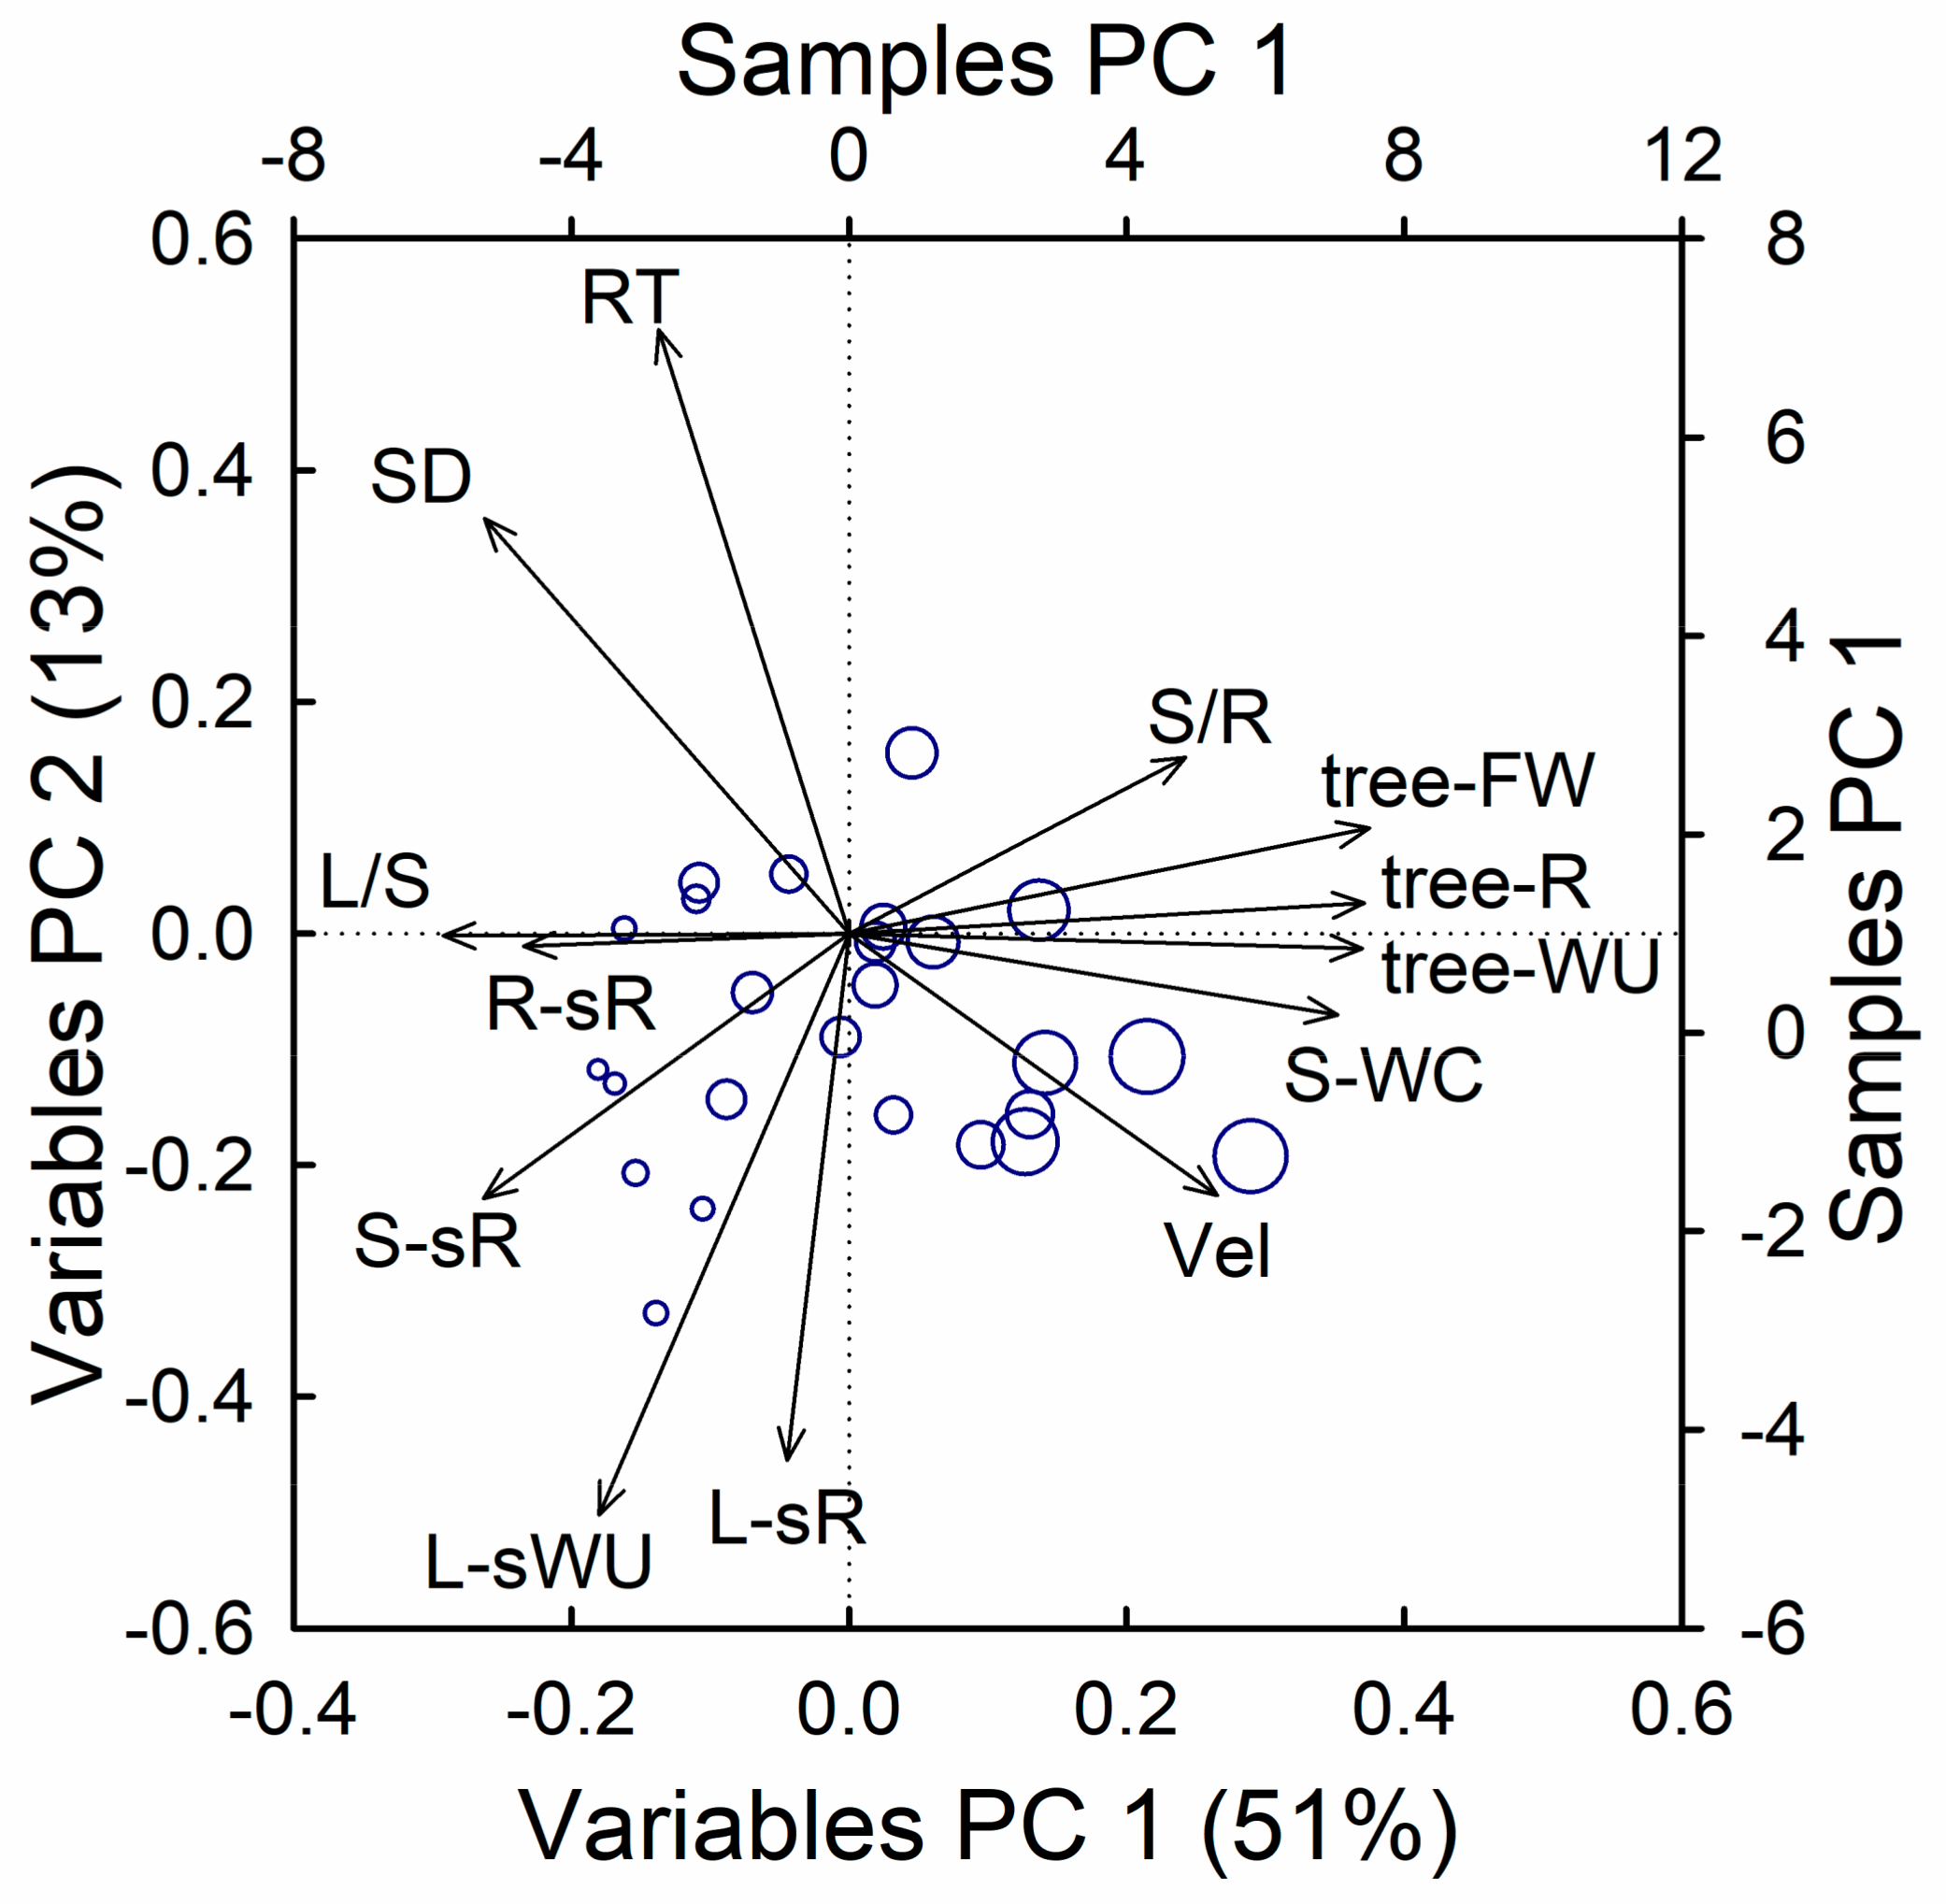
3.4. Association between Hydraulic, Metabolic, and Morphometric Traits

A principal component analysis, including the most relevant measured traits, revealed consistent associations between the respiration rate and the hydraulic traits (WU, WC, RT, and Vel, see Figure 8). The first axis, explaining 51% of the total variability, was mainly driven by size, and showed a tight association between the total fresh weight and total respiration, as well as the WU and stem WC, but negatively correlated with the leaf to stem ratio, stem density, and specific respiration in woody tissues (roots and stem). Along this axis, we also found negative associations between the tree size and leaf-specific WU and RT, and weak positive associations with the stem to root ratio and Vel. The second axis, explaining 13% of the total variability, was dominated by the tight association between the leaf-specific respiration and leaf-specific WU, and opposed to the stem density and RT. Along this axis, we also found positive associations between the leaf-specific traits and both the tracer velocity and stem specific respiration, and negative assosciations with stem to root ratio.
Looking in detail at the association between hydraulic traits and respiration, we found that respiration rates followed a power response to WU, being stronger and steeper (b > 1) in stem than in the leaves and roots (b ≈ 1; Table 3). Vel was best correlated with root and leaves respiration rates, but the relationship was steeper for stem and leaves than for the roots (Table 3). Respiration was positively associated with tissue WC in the stem and roots (R2 = 0.61 and 0.36, respectively), but not in the leaves (Table 3). Conversely, the respiration in all of the tissues was negatively correlated with the stem base density, but the association was stronger in the leaves (R2 = 0.41) than in the stem and roots (R2 = 0.32 and 0.26, respectively; see Table 3).

4. Discussion

4.1. Biomass Allocation Patterns Differ in Dominant and Suppressed Trees

In the highly competitive conditions of our study, the lack of age effects implies that the observed trends in the size and metabolic activity were driven by a dominance gradient (i.e., from small, slow-growing, suppressed trees, to large, fast-growing, dominant trees), rather than by developmental changes. As a consequence, the differences in the stem BA were largely determined by the differences in the recent growth (30–75% of the total BA was formed during the last three years, and this ratio was independent from the tree age). The large competition is further confirmed by the comparatively lower size of the measured individuals than in the other studies at the same age [42,48], and the lower growth rates than predicted by allometric equations (e.g., [37,49]).
Over the studied range, we did not find significant changes in the shoot/root ratio with the tree size, suggesting that this ratio is not affected by the dominance status in the juvenile stands. The shoot to root ratios in our study (2.3–4.5) were in the range of those reported in the literature for young Sugi trees (2.9–3.6 in <1-year seedlings [27]; 3.1–3.7 in <40 age classes [49]), but smaller than in the older trees (9.2 in <50 age class [49]). Contrasting with the invariance of the shoot/root ratio, there was a substantial change in the allocation pattern among the woody tissues (stem/root ratio), resulting in larger stem growth rates in the dominant individuals, but maintaining a constant root to leaf ratio. This implies a tight regulation of the leaf mass to adapt to the root size, by means of self-pruning, and translates into a lower leaf/stem ratio in the larger, dominant individuals than in the smaller, suppressed individuals.
Overall, our results contradict our initial hypothesis, indicating that the dominant trees do not allocate more carbon to the roots than to the suppressed trees. In more energy-limited than water-limited environments, as in our study, the root size does not limit the stem growth of the dominant trees. In this context, light interception and height growth becomes the main priority, at the expense of the root development [22,50,51]. However, the root size may still constrain the canopy development (i.e., leaf mass), as a strategy to couple the water losses with the root uptake capacity, thus avoiding hydraulic limitations in tall trees. These trends may not be restricted to young trees under competition; Lim et al. [49] also reported a constant leaf/root ratio from <20 to <50 age classes, together with declining leaf/stem ratios and increasing stem/root ratios. Our results also evidence the risk of using the shoot to root ratio as the only indicator of carbon allocation patterns, obviating the contrasting physiological function of the stem and leaves.

4.2. Metabolic Rates Tend to Compensate for Changes in Biomass Allocation

The size-dependent changes in the partition of the metabolic rates (i.e., respiration) differed from those found for the biomass allocation. The declining trend in the leaves/stem ratio was counteracted by the differential response to the size changes of the leaves and stem respiration. Whereas the specific respiration of the woody tissues (stem and roots) significantly declined with size, the leaves maintained nearly constant specific respiration rates, hence maintaining their relative contribution to shoot respiration. It is noteworthy that only the scaling of root respiration was not significantly larger than the b factor of the 3/4 predicted by the West, Brown, and Enquist (WBE) plant-scaling model [33], but even in this case, its confidence interval was centered at 6/7 (0.73–0.96). This is in agreement, however, with previous empirical evidence in young trees, showing b values lower than 1, but generally higher than 3/4 [30,52].
Although the stem/root respiration rates increased with the tree size, this trend was much weaker than expected from the changes in the biomass ratio. This suggests that, despite the declining biomass, the metabolic allocation to the roots was comparatively larger in the dominant trees. We also found a larger size-independent variability in the root respiration than in any other tissue, potentially linked to changes in the proportion of the fine and coarse roots among the individuals, as the root respiration tends to be negatively associated with the root diameter (see e.g., [53]). Although a decline in the proportion of the fine roots with size has been reported when comparing the young and mature stands of Sugi [50], this trend might be less consistent in a dominance-driven size gradient. In this regard, a further assessment of the biomass and metabolic partition within the root system is needed in order to understand the observed patterns in root respiration.
In the case of the leaves, b did not differ significantly from the unity, thus supporting the assumption that canopy metabolism results from the addition of N individual leaves with invariant metabolic rates [54]. Bearing in mind that the leaf respiration is largely substrate-limited, and thus dependent on leaf carbon fixation [55,56], our results could be interpreted as a lack of response of the taller trees to their higher light availability, apparently contradicting the observed trends in the growth rate. However, the leaf mass per area is known to increase with the tree height and canopy openness [40], and thus our results would be compatible with higher photosynthetic rates per leaf area in the larger trees. In this regard, it would be worth expanding the empirical assessment of the tree metabolic scaling by considering the differential role of mass and area expansion.

4.3. Transpiration Rates Show a Negative Allometric Response to Tree Size

Contrary to our hypothesis, the transpiration rates in the young competing trees did not increase linearly with the tree size, with the lower leaf-specific transpiration in the larger trees, thus contradicting the assumption of the invariant metabolic rates in the leaves [54]. Although the b coefficients in all of the tissues were closer to the linearity than the respiration in the woody tissues, they were less linear than the leaf respiration rates. Besides, we found a positive association between size and WC in the root and stem, indicating improved water distribution and larger water storage capacity in the large trees. However, although the leaves showed a variation in WC, it was not related to the tree size, suggesting that the WC in the leaves should be physiologically maintained within a certain threshold, at the expense of the stem and root water storage. In this regard, Kumagai et al. [57] found significant stem water storage effects, which could explain the different response to the transpiration rates in the WC at the base and the top of the stem. On the other hand, Himeno et al. [42] found that the leaves in young trees show significant changes in WC, and constitute a relevant storage pool for daily variations in water demand. Because of the longer time-scale considered in our study, we could not assess the daily changes in leaf WC, but this could be behind the scattering found in this variable.
The observed scaling factor b was compatible with the predicted 3/4 scaling, according to the WBE model [33], but the fitted values were larger than in previous empirical studies (for the shoots, b = 0.81 in our study, and b = 0.74 in the literature [58]). Unlike in our study, Meinzer et al. [58] included large, adult trees in their models, which, in agreement with the trends observed in our study, would exacerbate the limitation of transpiration with the increasing size. Our results indicate that the scaling factor for transpiration in young trees is closer to linearity than in the adult trees, similar to what has been reported for respiration [30,52]. According to our findings, the leaf mass was the most critical factor determining the size-scaling of transpiration; therefore, the progressive reduction in the leaf/stem ratio could contribute to the negative allometry in the association between the aboveground biomass and transpiration, particularly in the larger trees. This trend would be reinforced by the significant decline in water use per leaf mass with the tree size, although, as for respiration, this trend could be mainly driven by an increase in the leaf mass per area [40]. In this regard, despite methodological differences, our scaling models successfully predicted the tree water use in similarly young trees without competition (Himeno et al. 2017 [42]), but substantially overestimated the water use in much larger trees (Kumagai et al. 2009 [57]) (See Appendix B, Figure A2).
At this point, it should be noted that the larger trees tend to receive more direct sunlight, and hence may have a larger integrated evaporative demand [40]. Thus, the empirically determined scaling factors include both the physiological scaling and canopy-height environmental gradients. In our study, although we found a positive association between the average daily maximum PPFD at 2/3 of the tree height and WU ( y = 0.0005336 x 2.155 ,   R 2 = 0.76 ,   p < 0.001 ), it was much weaker than the associations found between the fresh weight and WU ( R 2 = 0.91 0.95 ,   p < 0.001 ). Furthermore, after standardizing the WU by the PPFD values (WU/PPFD), we still found a strong positive association with the fresh weight, particularly strong for the leaves ( R 2 = 0.77 0.84 ,   p < 0.001 ; see Appendix B, Table A1). Overall, this suggests that the observed association with the PPFD was mainly an indirect effect of the correlation between the PPFD and tree size. In any case, although removing the effect of the canopy gradients may be useful for the empirical validation of the theoretical models, they cannot be obviated when the aim is to attain a realistic estimate of the size-scaling under natural conditions.

4.4. Hydraulic Limitations in Suppressed Trees May Reduce Their Water-Use Efficiency

Considering that dominant trees show a larger biomass production (BAI), and constant (i.e., not declining) mass-specific leaf metabolic rates, but show a decline in the leaf-specific water use, the dominant trees would be more efficient in their use of water than the suppressed individuals. In our study, we found a significant decline in the stem density with the tree size. The stem density tends to be inversely correlated with the conduit diameter, and hence can be associated with the stem water conductivity [59,60,61]. This would explain the negative association between the stem density and WU and Vel, indicating a greater potential for the water transport per unit of sapwood area in the large, dominant trees. The distribution of the variables in the PCA revealed that the negative effect of the stem density on the WU and Vel was largely associated with a direct size effect. Therefore, the smaller trees were also the most limited by stem density, despite the larger demand for water transport in the dominant trees. From these results, we can conclude that the self-pruning was effective in adapting the water demand to the hydraulic capacity of the tree. This interpretation is supported by the steeper increase in the water concentrations with the size in the upper part of the stem, which suggests a greater ability to mobilize water resources along the stem in the larger trees.
Interestingly, we also found a negative association between the stem density and leaf-specific respiration rates, highlighting that the hydraulic limitations affected not only the transpiration but also the leaf metabolic rates. According to the strength of the association with the stem density and its distribution along the PCA axis, the stem density more strongly limited the leaf metabolic activity than the transpiration rates, contributing to the overall reduction in the water-use efficiency for the smaller trees. This might be a general trend, at least in the energy-limited environments, coinciding with the findings by Fardusi et al. [22], who presented a global positive intraspecific association between water-use efficiency and growth, particularly strong in the boreal conifers.

5. Conclusions

Contrary to our first hypothesis, the belowground to aboveground carbon allocation did not change with tree size and dominance status, but we found significant changes in the carbon allocation among the tree organs. On the one hand, the increase in the stem/root ratio with size, highlights that when the soil water is not limiting, the trees promote height growth and water transport through the stem, at the expense of root development. On the other hand, the leaf canopy development in larger trees was limited, coupling with the root size; hence, modulating the total tree water use to fit the water uptake capacity.
Our results partially supported our second hypothesis, namely, that the size-scaling factor of whole-tree transpiration was larger than the predictions of mass-scaling models, but still below unity. Interestingly, this was partly due to a decrease in the leaf-specific transpiration in larger trees, contrasting with the invariance in the leaf metabolic rates.
Comparing the scaling of water use and carbon metabolism, we can conclude that larger trees tend to increase the water-use efficiency, maintaining leaf metabolic rates while reducing the water use. According to the associations found with stem density, this can be attributed to larger hydraulic limitations in smaller, suppressed trees. Future directions of research should strengthen the focus on the interaction between water use and carbon metabolism at the whole-tree level, and consider the contrasting response of different plant organs in determining whole-plant metabolic scaling.

Supplementary Materials

The following are available online at https://www.mdpi.com/1999-4907/9/8/449/s1, Table S1: Individual values of the variables included in the study.

Author Contributions

J.P.F. and S.M. conceived and designed the experiments; J.P.F., M.W. and S.M. performed the experiments; J.P.F., M.W. and Y.K. analyzed the data; J.P.F., Y.K. and S.M. wrote the paper.

Funding

Japan Society for the Promotion of Science (JSPS KAKENHI Grant Numbers 15K14746 and 16H04871; JSPS long-term invitation fellowship L-14560).

Acknowledgments

This work was supported by JSPS KAKENHI, Grant Numbers 15K14746 and 16H04871. J.P.F. was also supported by JSPS long-term invitation fellowship L-14560 and ARAID Foundation. We thank the useful suggestions of two anonymous referees.

Conflicts of Interest

The authors declare no conflict of interest. The founding sponsors had no role in the design of the study; in the collection, analyses, or interpretation of data; in the writing of the manuscript; and in the decision to publish the results.

Appendix A

Figure A1. Evolution over time of isotope ratios in transpired water in each of the 25 individuals included in the study. Values standardized to the difference between the peak maximum and pre-injection (background) values. Green filled circles and red empty circles denote the upward and downward sections of the curve. Green and black line stand for the linear regression used to estimate tracer velocity, and the exponential decay curve used to estimate tracer half-life and residence time, respectively.
Forests 09 00449 g0a1

Appendix B

Figure A2. Log–log plot comparing the association between the stem volume and time-integrated tree water use (WU) in our study and in Himeno et al. [42] and Kumagai et al. [57]. (a) Uncorrected WU values, and (b) WU divided by the daily maximum water pressure deficit (vpd, in kPA) in each experiment (1732 kPa in our study, 2500 kPa in [42]; 1800 kPa in [57]). Plotted lines show the models fitted using only the data from our experiment ( y = 175373 x 0.653 ,   R 2 = 0.92 ,   p < 0.001 for WU; y = 2.005 x 0.653 ,   R 2 = 0.92 ,   p < 0.001 for WU/vpd). The trees in the literature [42] were 10 years old and with a stem height of 5.6–6.3; the trees in the literature [57] were 33 years old and reached 21.2 m.
Forests 09 00449 g0a2
Table A1. Summary statistics and coefficient estimates for the association between organ fresh weight (FW) and radiation-corrected time-integrated water use (WU/ppfd; N = 25).
OrganModelR2ab (95% c.i.) 1p-Value
Roots FWy = axb0.772.030.51(0.39 0.63)<0.001
Stem FW 0.781.780.43(0.33 0.52)<0.001
Leaves FW 0.841.400.55(0.45 0.65)<0.001
Shoot FWy = axb0.831.120.51(0.41 0.61)<0.001
Total FW 0.820.970.51(0.41 0.62)<0.001
1 c.i. confidence interval of the mean.

References

  1. Camarero, J.J.; Gazol, A.; Tardif, J.C.; Conciatori, F. Attributing forest responses to global-change drivers: Limited evidence of a CO2-fertilization effect in Iberian pine growth. J. Biogeogr. 2015, 42, 2220–2233. [Google Scholar] [CrossRef]
  2. Franklin, J.; Serra-Diaz, J.M.; Syphard, A.D.; Regan, H.M. Global change and terrestrial plant community dynamics. Proc. Natl. Acad. Sci. USA 2016, 113, 3725–3734. [Google Scholar] [CrossRef] [PubMed]
  3. Girardin, M.P.; Bouriaud, O.; Hogg, E.H.; Kurz, W.; Zimmermann, N.E.; Metsaranta, J.M.; de Jong, R.; Frank, D.C.; Esper, J.; Büntgen, U.; et al. No growth stimulation of Canada’s boreal forest under half-century of combined warming and CO2 fertilization. Proc. Natl. Acad. Sci. USA 2016, 113, E8406–E8414. [Google Scholar] [CrossRef] [PubMed]
  4. Fang, X.; Zhang, C.; Wang, Q.; Chen, X.; Ding, J.; Karamage, F. Isolating and Quantifying the Effects of Climate and CO2 Changes (1980–2014) on the Net Primary Productivity in Arid and Semiarid China. Forests 2017, 8, 60. [Google Scholar] [CrossRef]
  5. Shestakova, T.A.; Camarero, J.J.; Ferrio, J.P.; Knorre, A.A.; Gutiérrez, E.; Voltas, J. Increasing drought effects on five European pines modulate Δ13C-growth coupling along a Mediterranean altitudinal gradient. Funct. Ecol. 2017, 31, 1359–1370. [Google Scholar] [CrossRef]
  6. Shestakova, T.A.; Voltas, J.; Saurer, M.; Siegwolf, R.T.W.; Kirdyanov, A.V. Warming effects on Pinus sylvestris in the cold-dry Siberian forest-steppe: Positive or negative balance of trade? Forests 2017, 8. [Google Scholar] [CrossRef]
  7. Pšidová, E.; Živčák, M.; Stojnić, S.; Orlović, S.; Gömöry, D.; Kučerová, J.; Ditmarová, L.; Střelcová, K.; Brestič, M.; Kalaji, H.M. Altitude of origin influences the responses of PSII photochemistry to heat waves in European beech (Fagus sylvatica L.). Environ. Exp. Bot. 2017, 152, 97–106. [Google Scholar] [CrossRef]
  8. Jaramillo, F.; Cory, N.; Arheimer, B.; Laudon, H.; Van Der Velde, Y.; Hasper, T.B.; Teutschbein, C.; Uddling, J. Dominant effect of increasing forest biomass on evapotranspiration: Interpretations of movement in Budyko space. Hydrol. Earth Syst. Sci. 2018, 22, 567–580. [Google Scholar] [CrossRef]
  9. Mulder, C.; Boit, A.; Mori, S.; Vonk, J.A.; Dyer, S.D.; Faggiano, L.; Geisen, S.; González, A.L.; Kaspari, M.; Lavorel, S.; et al. Distributional (In)Congruence of Biodiversity-Ecosystem Functioning; Academic Press: Cambridge, MA, USA, 2012; Volume 46. [Google Scholar]
  10. Meng, S.; Jia, Q.; Zhou, G.; Zhou, H.; Liu, Q.; Yu, J. Fine root biomass and its relationship with aboveground traits of Larix gmelinii trees in Northeastern China. Forests 2018, 9, 1–11. [Google Scholar] [CrossRef]
  11. Ruehr, N.K.; Offermann, C.A.; Gessler, A.; Winkler, J.B.; Ferrio, J.P.; Buchmann, N.; Barnard, R.L. Drought effects on allocation of recent carbon: From beech leaves to soil CO2 efflux. New Phytol. 2009, 184, 950–961. [Google Scholar] [CrossRef] [PubMed]
  12. Hasibeder, R.; Fuchslueger, L.; Richter, A.; Bahn, M. Summer drought alters carbon allocation to roots and root respiration in mountain grassland. New Phytol. 2015, 205, 1117–1127. [Google Scholar] [CrossRef] [PubMed]
  13. Hernández-Montes, E.; Tomás, M.; Medrano, H.; Escalona, J.M. Effect of soil water availability on root respiration in grapevines—Importance for plant carbon balance. In Acta Horticulturae; International Society for Horticultural Science (ISHS): Leuven, Belgium, 2016; pp. 103–108. [Google Scholar]
  14. Teodosio, B.; Pauwels, V.R.N.; Loheide, S.P., II; Daly, E. Relationship between root water uptake and soil respiration: a modeling perspective. J. Geophys. Res. Biogeosci. 2017, 122, 1954–1968. [Google Scholar] [CrossRef]
  15. Pausch, J.; Kuzyakov, Y. Carbon input by roots into the soil: Quantification of rhizodeposition from root to ecosystem scale. Glob. Chang. Biol. 2018, 24, 1–12. [Google Scholar] [CrossRef] [PubMed]
  16. Andrews, M.; Raven, J.A.; Sprent, J.I. Environmental effects on dry matter partitioning between shoot and root of crop plant: relations with growth and shoot protein concentration. Ann. Appl. Biol. 2001, 138, 57–68. [Google Scholar] [CrossRef]
  17. Ledo, A.; Paul, K.I.; Burslem, D.F.R.P.; Ewel, J.J.; Barton, C.; Battaglia, M.; Brooksbank, K.; Carter, J.; Eid, T.H.; England, J.R.; et al. Tree size and climatic water deficit control root to shoot ratio in individual trees globally. New Phytol. 2018, 217, 8–11. [Google Scholar] [CrossRef] [PubMed]
  18. Hommel, R.; Siegwolf, R.; Saurer, M.; Farquhar, G.D.; Kayler, Z.; Ferrio, J.P.; Gessler, A. Drought response of mesophyll conductance in forest understory species—Impacts on water-use efficiency and interactions with leaf water movement. Physiol. Plant. 2014, 152, 98–114. [Google Scholar] [CrossRef] [PubMed]
  19. Martín-Gómez, P.; Aguilera, M.; Pemán, J.; Gil-Pelegrín, E.; Ferrio, J.P. Contrasting ecophysiological strategies related to drought: the case of a mixed stand of Scots pine (Pinus sylvestris) and a submediterranean oak (Quercus subpyrenaica). Tree Physiol. 2017, 37, 1478–1492. [Google Scholar] [CrossRef] [PubMed]
  20. Iwasa, Y.; Roughgarden, J. Shoot/Root balance of plants: optimal growth of a system with many vegetative organs. Theor. Popul. Biol. 1984, 105, 78–105. [Google Scholar] [CrossRef]
  21. Bloom, A.J.; Chapin, F.S.; Mooney, H.A. Resource Limitation in Plants—An Economic Analogy. Annu. Rev. Ecol. Syst. 1985, 16, 363–392. [Google Scholar] [CrossRef]
  22. Fardusi, M.J.; Ferrio, J.P.; Comas, C.; Voltas, J.; Resco de Dios, V.; Serrano, L. Intra-specific association between carbon isotope composition and productivity in woody plants: A meta-analysis. Plant Sci. 2016, 251, 110–118. [Google Scholar] [CrossRef] [PubMed] [Green Version]
  23. Lopez Caceres, M.L.; Nakano, S.; Ferrio, J.P.; Hayashi, M.; Nakatsuka, T.; Sano, M.; Yamanaka, T.; Nobori, Y. Evaluation of the effect of the 2011 Tsunami on coastal forests by means of multiple isotopic analyses of tree-rings. Isotopes Environ. Health Stud. 2018, 1–14. [Google Scholar] [CrossRef] [PubMed]
  24. Canham, C.D.; Berkowitz, A.R.; Kelly, V.R.; Lovett, G.M.; Ollinger, S.V; Schnurr, J. Biomass allocation and multiple resource limitation in tree seedlings. Can. J. For. Res. Can. Rech. For. 1996, 26, 1521–1530. [Google Scholar] [CrossRef]
  25. Coll, L.; Balandier, P.; Picon-Cochard, C.; Prévosto, B.; Curt, T. Competition for water between beech seedlings and surrounding vegetation in different light and vegetation composition conditions. Ann. For. Sci. 2003, 60, 593–600. [Google Scholar] [CrossRef] [Green Version]
  26. Yamashita, K.; Mizoue, N.; Ito, S.; Inoue, A.; Kaga, H. Effects of residual trees on tree height of 18- and 19-year-old Cryptomeria japonica planted in group selection openings. J. For. Res. 2006, 11, 227–234. [Google Scholar] [CrossRef]
  27. Nagakura, J.; Shigenaga, H.; Akama, A.; Takahashi, M. Growth and transpiration of Japanese cedar (Cryptomeria japonica) and Hinoki cypress (Chamaecyparis obtusa) seedlings in response to soil water content. Tree Physiol. 2004, 24, 1203–1208. [Google Scholar] [CrossRef] [PubMed]
  28. Du, H.; Zeng, F.; Peng, W.; Wang, K.; Zhang, H.; Liu, L.; Song, T. Carbon storage in a Eucalyptus plantation chronosequence in Southern China. Forests 2015, 6, 1763–1778. [Google Scholar] [CrossRef]
  29. Zavala, M.A.; Bravo De La Parra, R. A mechanistic model of tree competition and facilitation for Mediterranean forests: Scaling from leaf physiology to stand dynamics. Ecol. Modell. 2005, 188, 76–92. [Google Scholar] [CrossRef]
  30. Mori, S.; Yamaji, K.; Ishida, A.; Prokushkin, S.G.; Masyagina, O.V.; Hagihara, A.; Hoque, A.T.M.R.; Suwa, R.; Osawa, A.; Nishizono, T.; et al. Mixed-power scaling of whole-plant respiration from seedlings to giant trees. Proc. Natl. Acad. Sci. USA 2010, 107, 1447–1451. [Google Scholar] [CrossRef] [PubMed] [Green Version]
  31. Gargallo-Garriga, A.; Sardans, J.; Pérez-Trujillo, M.; Rivas-Ubach, A.; Oravec, M.; Vecerova, K.; Urban, O.; Jentsch, A.; Kreyling, J.; Beierkuhnlein, C.; et al. Opposite metabolic responses of shoots and roots to drought. Sci. Rep. 2014, 4, 1–7. [Google Scholar] [CrossRef] [PubMed]
  32. Kleiber, M. Body size and metabolism. Hilgardia A J. Agric. Sci. 1932, 6, 315–353. [Google Scholar] [CrossRef] [Green Version]
  33. West, G.B.; Brown, J.H.; Enquist, B.J. A general model for the origin of allometric scaling laws in biology. Science 1997, 276, 122–126. [Google Scholar] [CrossRef] [PubMed]
  34. DeLong, J.P.; Okie, J.G.; Moses, M.E.; Sibly, R.M.; Brown, J.H. Shifts in metabolic scaling, production, and efficiency across major evolutionary transitions of life. Proc. Natl. Acad. Sci. USA 2010, 107, 12941–12945. [Google Scholar] [CrossRef] [PubMed] [Green Version]
  35. Glazier, D. Body-Mass Scaling of Metabolic Rate: What are the Relative Roles of Cellular versus Systemic Effects? Biology (Basel) 2015, 4, 187–199. [Google Scholar] [CrossRef] [PubMed] [Green Version]
  36. Hedin, L.O. Physiology: Plants on a different scale. Nature 2006, 439, 399–400. [Google Scholar] [CrossRef] [PubMed]
  37. Hosoda, K.; Iehara, T. Aboveground biomass equations for individual trees of Cryptomeria japonica, Chamaecyparis obtusa and Larix kaempferi in Japan. J. For. Res. 2010, 15, 299–306. [Google Scholar] [CrossRef]
  38. Nishizono, T.; Kitahara, F.; Iehara, T.; Mitsuda, Y. Geographical variation in age-height relationships for dominant trees in Japanese cedar (Cryptomeria japonica D. Don) forests in Japan. J. For. Res. 2014, 19, 305–316. [Google Scholar] [CrossRef]
  39. Ishii, H. How do changes in leaf/shoot morphology and crown architecture affect growth and physiological function of tall trees? Tree Physiol. 2011, 4, 215–232. [Google Scholar] [CrossRef]
  40. Azuma, W.; Ishii, H.R.; Kuroda, K.; Kuroda, K. Function and structure of leaves contributing to increasing water storage with height in the tallest Cryptomeria japonica trees of Japan. Trees 2016, 30, 141–152. [Google Scholar] [CrossRef]
  41. Azuma, W.; Nakashima, S.; Yamakita, E.; Ishii, H.R.; Kuroda, K. Water retained in tall Cryptomeria japonica leaves as studied by infrared micro-spectroscopy. Tree Physiol. 2017, 37, 1367–1378. [Google Scholar] [CrossRef] [PubMed]
  42. Himeno, S.; Azuma, W.; Gyokusen, K.; Ishii, H.R. Leaf water maintains daytime transpiration in young Cryptomeria japonica trees. Tree Physiol. 2017, 37, 1394–1403. [Google Scholar] [CrossRef] [PubMed]
  43. Calder, I.R.; Kariyappa, G.S.; Srinivasalu, N.V.; Srinivasa Murty, K.V. Deuterium tracing for the estimation of transpiration from trees Part 1. Field calibration. J. Hydrol. 1992, 130, 17–25. [Google Scholar] [CrossRef]
  44. Meinzer, F.C.; James, S.A.; Goldstein, G. Dynamics of transpiration, sap flow and use of stored water in tropical forest canopy trees. Tree Physiol. 2004, 24, 901–909. [Google Scholar] [CrossRef] [PubMed] [Green Version]
  45. Calder, I.R.; Swaminath, M.H.; Kariyappa, G.S.; Srinivasalu, N.V.; Srinivasa Murty, K.V.; Mumtaz, J. Deuterium tracing for the estimation of transpiration from trees Part 3. Measurements of transpiration from Eucalyptus plantation, India. J. Hydrol. 1992, 130, 37–48. [Google Scholar] [CrossRef]
  46. Schwendenmann, L.; Dierick, D.; Köhler, M.; Hölscher, D. Can deuterium tracing be used for reliably estimating water use of tropical trees and bamboo? Tree Physiol. 2010, 30, 886–900. [Google Scholar] [CrossRef] [PubMed] [Green Version]
  47. Meinzer, F.C.; Brooks, J.R.; Domec, J.C.; Gartner, B.L.; Warren, J.M.; Woodruff, D.R.; Bible, K.; Shaw, D.C. Dynamics of water transport and storage in conifers studied with deuterium and heat tracing techniques. Plant Cell Environ. 2006, 29, 105–114. [Google Scholar] [CrossRef] [PubMed] [Green Version]
  48. Inoue, S.; Shirota, T.; Mitsuda, Y.; Ishii, H.; Gyokusen, K. Effects of individual size, local competition and canopy closure on the stem volume growth in a monoclonal Japanese cedar (Cryptomeria japonica D. Don) plantation. Ecol. Res. 2008, 23, 953–964. [Google Scholar] [CrossRef]
  49. Lim, H.; Lee, K.H.; Lee, K.H.; Park, I.H. Biomass expansion factors and allometric equations in an age sequence for Japanese cedar (Cryptomeria japonica) in southern Korea. J. For. Res. 2013, 18, 316–322. [Google Scholar] [CrossRef]
  50. Genet, M.; Kokutse, N.; Stokes, A.; Fourcaud, T.; Cai, X.; Ji, J.; Mickovski, S. Root reinforcement in plantations of Cryptomeria japonica D. Don: Effect of tree age and stand structure on slope stability. For. Ecol. Manage. 2008, 256, 1517–1526. [Google Scholar] [CrossRef]
  51. Klein, T.; Randin, C.; Körner, C. Water availability predicts forest canopy height at the global scale. Ecol. Lett. 2015, 18, 1311–1320. [Google Scholar] [CrossRef] [PubMed]
  52. Reich, P.B.; Tjoelker, M.G.; Machado, J.L.; Oleksyn, J. Universal scaling of respiratory metabolism, size and nitrogen in plants. Nature 2006, 439, 457–461. [Google Scholar] [CrossRef] [PubMed]
  53. Makita, N.; Kosugi, Y.; Dannoura, M.; Takanashi, S.; Niiyama, K.; Kassim, A.R.; Nik, A.R. Patterns of root respiration rates and morphological traits in 13 tree species in a tropical forest. Tree Physiol. 2012, 32, 303–312. [Google Scholar] [CrossRef] [PubMed] [Green Version]
  54. Bentley, L.P.; Stegen, J.C.; Savage, V.M.; Smith, D.D.; von Allmen, E.I.; Sperry, J.S.; Reich, P.B.; Enquist, B.J. An empirical assessment of tree branching networks and implications for plant allometric scaling models. Ecol. Lett. 2013, 16, 1069–1078. [Google Scholar] [CrossRef] [PubMed]
  55. Kodama, N.; Barnard, R.; Salmon, Y.; Weston, C.; Ferrio, J.P.; Holst, J.; Werner, R.; Saurer, M.; Buchmann, N.; Rennenberg, H.; et al. Temporal dynamics of the carbon isotope composition in a Pinus sylvestris stand—From newly assimilated organic carbon to respired CO2. Oecologia 2008, 156, 737–750. [Google Scholar] [CrossRef] [PubMed]
  56. Gessler, A.; Tcherkez, G.; Karyanto, O.; Keitel, C.; Ferrio, J.P.; Ghashghaie, J.; Kreuzwieser, J.; Farquhar, G.D. On the metabolic origin of the carbon isotope composition of CO2 evolved from darkened light-acclimated leaves in Ricinus communis. New Phytol. 2009, 181, 374–386. [Google Scholar] [CrossRef] [PubMed]
  57. Kumagai, T.; Aoki, S.; Otsuki, K.; Utsumi, Y. Impact of stem water storage on diurnal estimates of whole-tree transpiration and canopy conductance from sap flow measurements in Japanese cedar and Japanese cypress trees. Hydrol. Process. 2009, 23, 2335–2344. [Google Scholar] [CrossRef]
  58. Meinzer, F.C.; Bond, B.J.; Warren, J.M.; Woodruff, D.R. Does water transport scale universally with tree size? Funct. Ecol. 2005, 19, 558–565. [Google Scholar] [CrossRef] [Green Version]
  59. Santiago, G.; Meinzer, J.B.; Machado, K.; Woodruff, D.; Jones, T.L.S.; Goldstein, F.C.F. Leaf photosynthetic traits scale with hydraulic conductivity and wood density in Panamian forest canopy trees. Ecophysiology 2004, 140, 543–550. [Google Scholar]
  60. Chave, J.; Coomes, D.; Jansen, S.; Lewis, S.L.; Swenson, N.G.; Zanne, A.E. Towards a worldwide wood economics spectrum. Ecol. Lett. 2009, 12, 351–366. [Google Scholar] [CrossRef] [PubMed] [Green Version]
  61. Hoeber, S.; Leuschner, C.; Köhler, L.; Arias-Aguilar, D.; Schuldt, B. The importance of hydraulic conductivity and wood density to growth performance in eight tree species from a tropical semi-dry climate. For. Ecol. Manag. 2014, 330, 126–136. [Google Scholar] [CrossRef]
Figure 1. Climate and sampling schedule for the Deuterium dilution experiment. (a) Air temperature (T, °C) and relative humidity (RH, %); (b) photosynthetic photon flux density (PPFD, µmol m−2 s−1), accumulated precipitation (P, mm), cloud cover (CC, %) and sampling time span for the collection of transpired water. T, RH, P, and CC are three-hourly records at Shonai airport (38°48.73′, 139°47.23′ E, 22 m.a.s.l.); PPFD measured at 2/3 of hte tree height (mean and standard error across individuals, N = 25).
Forests 09 00449 g001
Figure 2. Deuterium-labelling method. (A,B) Injection of the D2O tracer in the trunk; (C) D2O mixing with the pool of water transpired; (D) sampling of the transpired water for isotope analyses; (E) scheme of the D2O-labelling peak and the main curve parameters that can be obtained. X-axis—time; Y-axis—D2O concentration above reference values in transpired water; Inj.—time of label injection; T1—time to reach 10% of the label; A—peak area; D2—exponential decay of the label.
Forests 09 00449 g002
Figure 3. (a) Fresh weight of the different plant organs for each individual, and in relation to total fresh weight; (b) Log-log plot of the association between total fresh weight and the ratio between different plant organs (on a fresh-weight basis).
Forests 09 00449 g003
Figure 4. Log–log plot of the relationship between fresh weight and respiration rates (a) for the root and the shoot; and (b) for the stem and leaves.
Forests 09 00449 g004
Figure 5. Log–log plot of the relationship between fresh weight and mass-specific respiration rates, on a fresh weight basis (a) for the root and the shoot; and (b) for the stem and leaves.
Forests 09 00449 g005
Figure 6. Relationship between log-transformed fresh weight of the different tree parts and (a) time-integrated whole-plant water use; and (b) tracer velocity.
Forests 09 00449 g006
Figure 7. Relationship between log-transformed total fresh weight and (a) water concentration (% of fresh weight) in the different tissues; and (b) stem density (dry weight per unit of stem volume).
Forests 09 00449 g007
Figure 8. Bi-plot of the principal component analysis including metabolic, hydraulic, and morphometric traits. RT, Vel, tracer residence time, and velocity; SD, stem density; L/S, S/R, leaf to stem and stem to root fresh weight ratio; R-sR, S-spR, L-spR, root, stem and leaf specific respiration; tree-FW, tree-R, tree-WU, total fresh weight, respiration and time-integrated water use; L-sWU, leaf-specific water use; S-WC, Stem water concentration. Symbol sizes are proportional to tree height.
Forests 09 00449 g008
Table 1. Mean and standard error, range, and median for tree morphometric variables (N = 25).
Variable 1Mean ± S.E.RangeMedian
Tree Height (m)1.60 ± 0.122[0.75 2.81]1.50
Basal Area (BA, mm2)494 ± 84.6[112 1605]413
BAI-3y (mm2 year−1)102 ± 20.8[12 391]74
Stem volume (cm3)372 ± 85.4[29 1673]231
Root FW (kg)0.39 ± 0.091[0.05 2.18]0.23
Stem FW (kg)0.46 ± 0.110[0.04 2.28]0.26
Leaf FW (kg)0.81 ± 0.166[0.11 3.52]0.53
Shoot FW (kg)1.27 ± 0.275[0.16 5.80]0.81
Total FW (kg)1.66 ± 0.364[0.21 7.98]1.03
1 BAI-3y—basal area increment in the last three years; FW—fresh weight.
Table 2. Mean and standard error, range, and median for water use and storage dynamics (N = 25).
Variable 1Mean ± S.E.RangeMedian
Time for peak maximum (days)1.1 ± 0.04[0.93 1.95]1.09
D/H atom % peak0.203 ± 0.0282[0.037 0.614]0.142
D/H atom % last sampling0.016 ± 0.0002[0.015 0.020]0.016
Tracer velocity (Vel, cm day−1)8.6 ± 2.12[1.7 53.0]4.3
Water use (WU, g day–1)943 ± 173.1[195 3415]649
Leaf-specific WU (g day-1 kg−1)1298 ± 65.9[949 2431]1212
Half life (t½, days)0.9 ± 0.09[0.4 2.3]0.8
Residence time (RT, days)2.8 ± 0.21[1.3 5.1]2.7
1 Leaf-specific WU—WU per unit of leaf fresh weight.
Table 3. Summary statistics and coefficient estimates for the association between the most relevant hydraulic traits and organ respiration (N = 25).
X-Variable 1OrganModelR2ab (95% c.i.) 2p-Value
WURootsy = 10axb0.85−3.830.942(0.77 1.12)<0.001
Stem 0.93−4.441.183(1.04 1.33)<0.001
Leaves 0.92−3.621.040(0.90 1.18)<0.001
VelRootsy = 10axb0.40−1.630.622(0.30 0.95)<0.001
Stem 0.36−1.630.707(0.30 1.12)0.001
Leaves 0.42−1.200.680(0.34 1.03)<0.001
WCRootsLog(y) = a + bx0.36−5.016.671(2.79 10.55)0.002
Stem 0.61−7.3811.85(7.76 15.93)<0.001
Leaves 0.01−1.791.705(−5.25 +8.66)0.6167
Stem densityRootsLog(y) = a + (b/100)x0.260.43−0.247(−0.43 −0.06)0.009
Stem 0.321.00−0.326(−0.53 −0.12)0.004
Leaves 0.411.44−0.330(−0.50 −0.16)<0.001
1 WU—time-integrated water use; Vel—tracer velocity; WC—tissue water concentration. 2 c.i. confidence interval of the mean.

