Article

Validation of a Methodology for Confidence-Based Participatory Forest Management

by
Eugenio Martínez-Falero
1,
Concepción González-García
1,
Antonio García-Abril
1 and
Esperanza Ayuga-Téllez
2,*
1
SILVANET, Research Group for Sustainable Environmental Management, Universidad Politécnica de Madrid (UPM), Ciudad Universitaria s/n, 28040 Madrid, Spain
2
Buildings, Infrastructures and Projects for Rural and Environmental Engineering (BIPREE), Universidad Politécnica de Madrid (UPM), Ciudad Universitaria s/n, 28040 Madrid, Spain
*
Author to whom correspondence should be addressed.
Forests 2018, 9(7), 399; https://doi.org/10.3390/f9070399
Submission received: 30 April 2018 / Revised: 29 June 2018 / Accepted: 2 July 2018 / Published: 4 July 2018
(This article belongs to the Special Issue Participatory Forestry: Involvement, Information and Science)

Abstract

:
This paper formulates a new strategy for participatory forest management consisting of encouraging public participation as long as it increases empathy among participants. The strategy requires the homogeneous representation of the opinion of a participant (i.e., to determine how they assess a forest plan and identify the best one). Utility assessments are prepared for participants through pair-comparisons between meaningful points in the territory and from value functions based on forest indicators. The best plan is designed by applying combinatorial optimization algorithms to the utility of a participant. The calculating of empathy—of one participant relative to another—is based on the equivalence of their respective utilities when the current forest plan is modified. This involves calculating the opinions that are due to systematic changes in the collective plan for those participants that each participant supposes will affect the utility of the other participants. Calculating empathy also requires knowing the interactions among participants, which have been incorporated through agent-based simulation models. Application of the above methodology has confirmed the association between increases in empathy and convergence of opinions in different scenarios: well and medium-informed participants and with and without interaction among them, which verifies the proposed strategy. In addition, this strategy is easily integrated into available information systems and its outcomes show advantages over current participatory applications.

1. Introduction

The paper validates an Artificial Intelligence methodology applicable to forest management. However, as in all AI process, the algorithms must be trained in the available data, never replicated. This requires a type of manager able to understand the performance of algorithms in order to propose modifications when they have to apply to real cases. The paper has been written by foresters for these types of forest managers.
A challenge most of foresters must face is to increase social accountability. Therefore, we start with a question: what would happen if we trust in others to make our own decisions?
Virtually all experiments show that the presence of a large number of decision makers improves individual decisions [1]. The internet certainly allows the processing of information from many participants, which mitigates the negative biases of individual decisions [2].
In addition, opinions often converge when working in trusted environments. In such environments, each person takes the reasons of others into consideration. To do this, all reasons must be known (which requires them to be explicitly described). In addition, if someone considers other reasons be reasonable, they ought to incorporate them into their personal judgments. Consequently, opinions will converge as empathy increases among the people involved in participative processes (participants). Empathy is reinforced using a common language of communication ICTs (Information and Comunication Tecnologies) and when participants have been educated regarding shared ethical and justice criteria.
However, it is more important to consider empathy as a dynamic process than to calculate it, because it is the increase or decrease of empathy that governs the convergence of opinions. This paper shows that it is possible to objectively measure the evolution of empathy throughout participatory processes, and to do it automatically. This inspires a strategy for collective decision-making based on confidence scenarios: to encourage participatory processes while confidence is increasing, and to conclude them as soon as it ceases to increase. Decisions must then be made by applying the available techniques for aggregation of opinions, but first, it is necessary to have an objective representation of the opinions in order to compare and aggregate them.

1.1. Representation of Opinions

This concept has been developed in past research and below we explain it succinctly. Below, we describe the models required for the case of application in detail in the corresponding section.
All opinions have two aspects: the way in which a person assesses a solution and the identification of the best solution for a person. The following notation will be adopted in the rest of this paper: X is a solution to a problem; A is an individual who participates in the collective decision-making; uA(X) is the assessment of X made by A; and XA is the best solution for A. Consequently, A´s opinion will be represented by the following pair: oA = [uA(X), XA].
Assessment is not easy because multiple variables are usually required to describe solutions (for example, a solution has a cost and a rate of return; generates a specific number of jobs, etc.). Not everyone will have the same answer to questions of the type: Would you prefer a project costing € 2M and returning € 5M or another project costing € 0.5M and returning € 2M? Assessment is usually individual for each person, and it is deduced from personal patterns of comparison. Assessment transforms each person’s preferences into a numerical value that determines how a person assesses a situation. When assessment is homogeneous, it allows third parties to make comparisons between individual preferences: all they need to do is compare their respective numerical representations.
From a methodological point of view, there are three procedures for assessment:
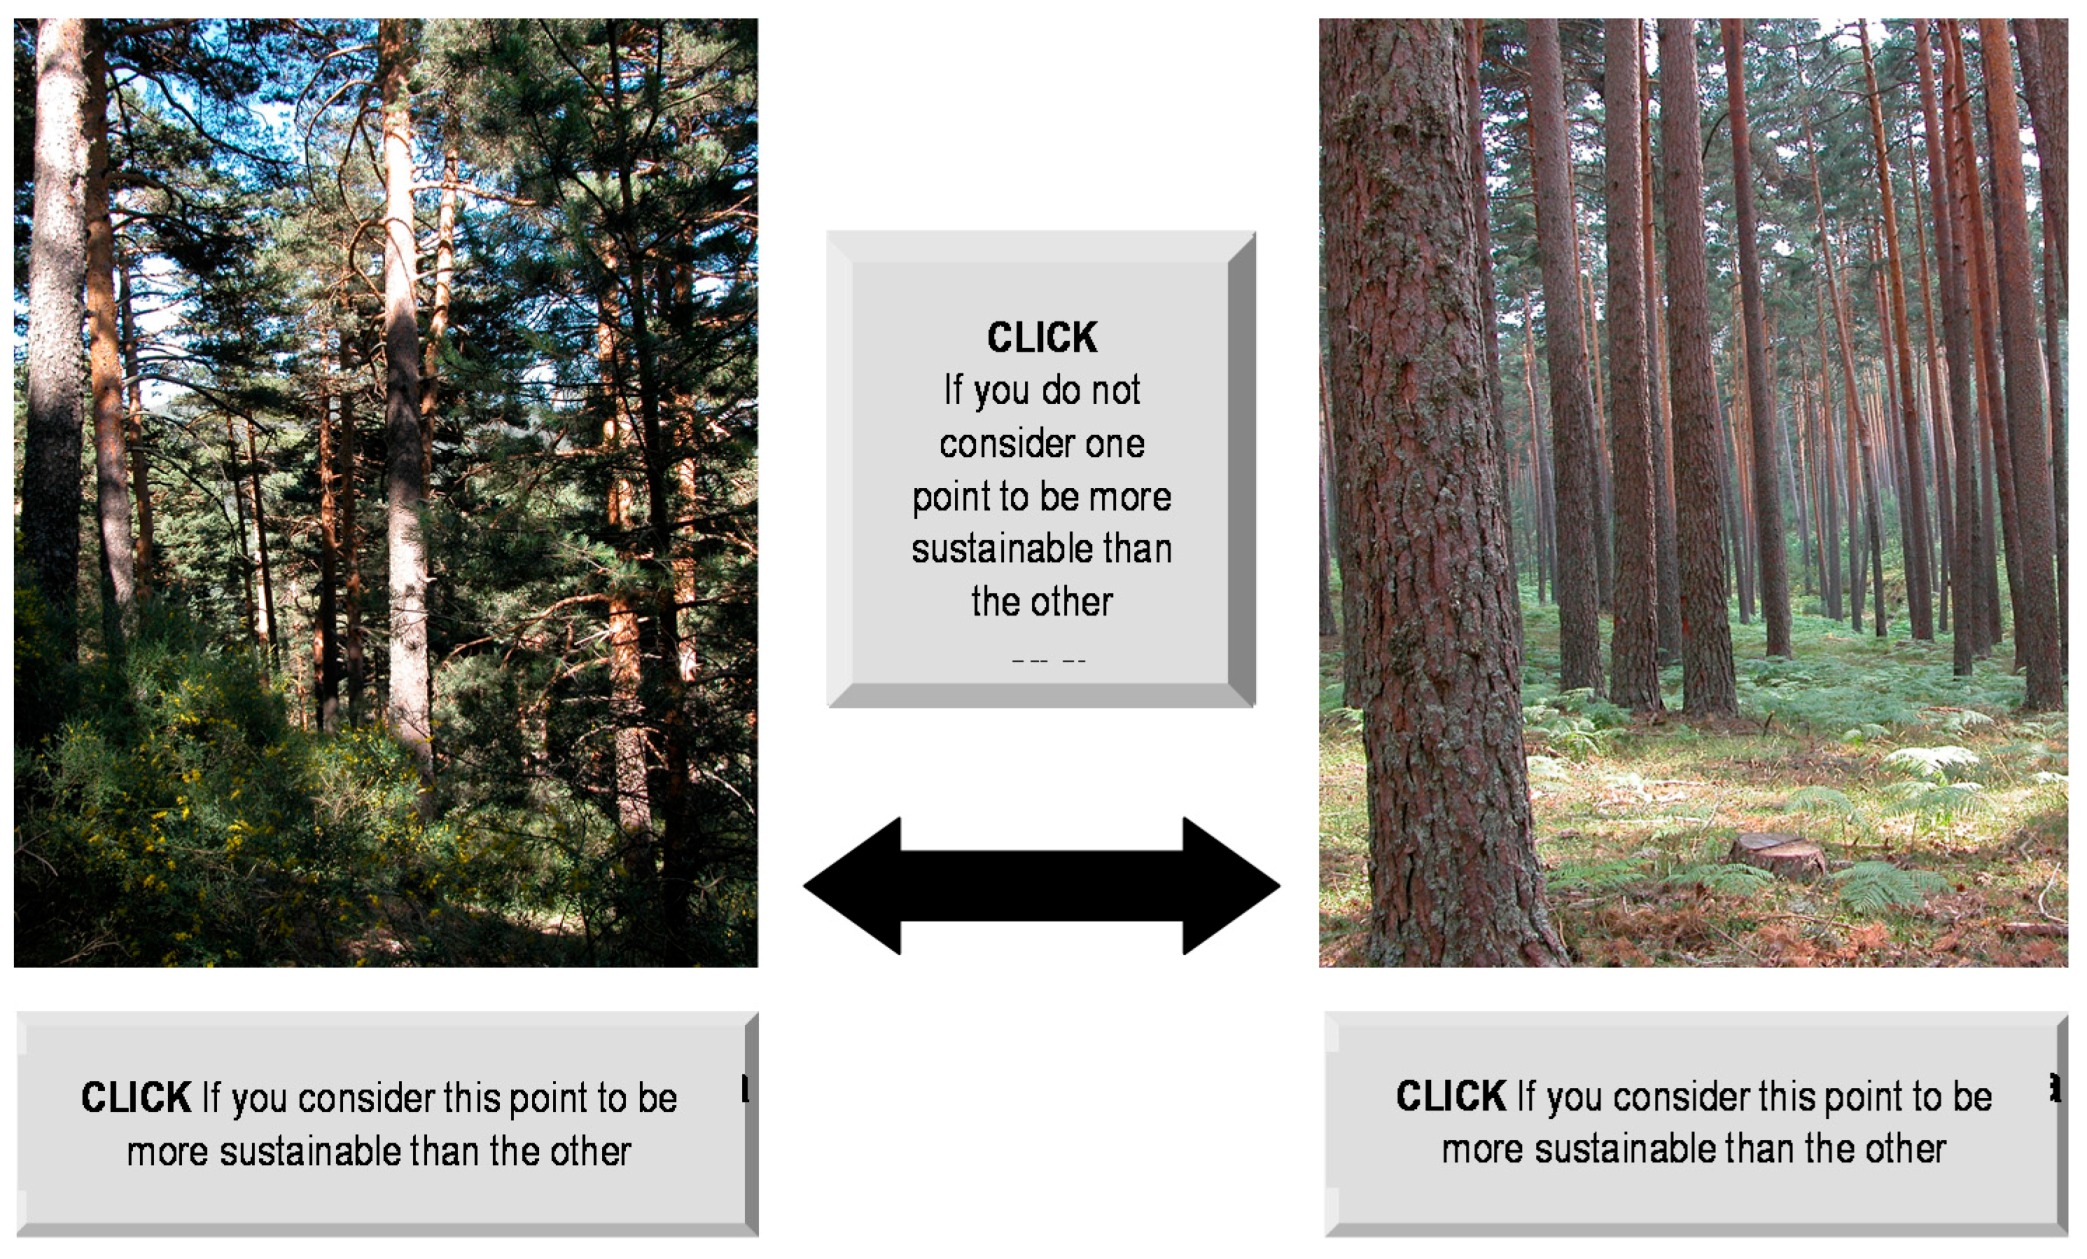
  • Pair-wise comparison of alternatives—which leads to preference modeling (see, for example, [3]). The evaluator directly compares pairs of alternatives to establish (subjectively) a preference relation between them. The preference is obtained from the global knowledge the evaluator has about alternatives and assessment derives—objectively—from the preference/indifference relations in all the pairs of compared alternatives.
  • The aggregation of criteria through the building of a value (or utility) function (first formalized by Debreau [4]) Here, the preference is induced measures of the different consequences of the alternatives being compared (consequences are objectively measured, for example, at a planning level, they will incorporate environmental, social, and economic dimensions), and the meaning that the evaluator attributes to the interrelationship between these consequences—which drives to a subjective aggregation process.
  • Analysis of past decisions (developed from the works of Arrow [5]).
The outcomes arising from the application of the three procedures are interchangeable (see [6]), which makes it possible to exchange the concepts of preference, utility, and choice (see, among other authors, Suzumura [7] and Sen [8], for the integration of the available procedures). It is also possible to apply the calculating capabilities of any of these methodologies to determine the outcomes in the others.
Assessment also helps obtain the solution that best fits the preferences of a participant. However, the number of solutions to forest management is normally so high that it is not operative to generate all feasible solutions and then assesses all of them to identify the best one. Instead, combinatorial optimization tools are applied to obtain acceptable solutions. In this context, the best solution is obtained under risk conditions, which means adopting the solution with the highest probability of satisfying the preferences of a specific participant. The building of this subjective likelihood is also based on the assessment procedures.
The design of the “best solution” is solved methodologically (see, for example, [9]) by applying different algorithms: recursive algorithms, heuristic optimization algorithms (mathematical programming, Monte Carlo methods, genetic algorithms, simulations of natural systems, tabu-search, etc.), and non-heuristic algorithms (basically neural network analysis), or a combination of all three.

1.2. Opinion Aggregation Techniques

Opinion aggregation plays a central role in the operation of collective decision making, but can a group choose between different options?
When a large number of people make their judgments to assess a solution, there are as many judgments that overestimate the solution as underestimate it. The result is that the average of assessments tends to approach the real value. However, despite efforts to reach consensus, not all members of a group must accept the aggregated solution. Some advances on these topics are discussed below.
The work by Arrow [10]—inspired by the work of Borda [11] and Condorcet [12]—relates “social choices” to individual preferences through social welfare functions. Unfortunately, results in this area are pessimistic: even some very mild conditions of reasonableness could not be simultaneously satisfied by a social choice. In consequence, aggregation of opinions will usually involve circumventing Arrow’s impossibility theorem by relaxing some of its applicability conditions (see, for example, [13,14]).
Social choice is focused on voting, which is the natural way that decisions are made in a democracy. However, voting is not harmless: methods expressing preferences can be manipulated to guarantee a choice of certain alternatives a priori [15]. Also, majority voting systems do not consider the choice of alternatives representing minorities. Currently, there are other social-choice mechanisms based on Web 2.0 tools: document ranking, folksonomy, recommender systems, open software, electronic prediction markets, and wikis. Sadly, these methods also need to relax even the softest reasonableness conditions to achieve collective decisions.
Parallel to social choice, the utilitarian approach [16,17]—inspired by Bentham [18]—used the aggregation of individual utilities to obtain evaluations of social interest. They were concerned with the total utility of the community, but they did not incorporate how utility is distributed or concentrated [19]. However, the arising of the logical positivism [20] allowed the identification of individual gains and losses, which made it possible to progress toward the “interpersonal comparison of utilities”. This enables the use of many different types of welfare rules (egalitarianism, envy-freeness, etc.), which differ in that way that fairness and efficiency are handled.
However, is it possible to make comparisons between the utilities of two or more people? There has been progress in this regard (see, for example, [21]) interpersonal utility comparisons have been developed from different postulates (as those proposed by [22]), and very general conditions have been defined for its implementation [23]. At present, the use of computational rules [24] allows aggregation of opinions based on Harsanyi’s theory [25,26]. This theory adds the notion of empathetic preferences [27,28,29] to Von Neuman-Morgenster’s hypotheses on utility and configures the paradigm of aggregation described in this paper.

1.3. Available Computer Applications for Collective Decision-Making

The progress in collective decision-making (see, for example, [30]) has led to the implementation of operative computer applications. All of them have important areas that require improvement, but the existing developments are already part of the solution rather than the problem. The applications presented below are grouped based on the decision-making model on which they are based:

1.3.1. Type-A Applications

These models were based on formalizing strategies for games on a network and require the current advances in computer technology and the methodology of information-decision systems. In these models, each participant tries to maximize their personal gain, which leads to a reduction in the earnings of others. There are two fundamental procedures: Group Decision Support Systems (GDSS) [31] which aim to reach an overall negotiated decision among the participants through face-to-face meetings; and the Social Decisions Support Systems (SDS) [32], which visualize the flow of discussion through a network of statements, opinions, arguments, and comments, which helps to gain consensus before voting on an issue.
• A-1: Group Decision Support Systems—GDSS-.
The largest number of applications are in this group: PLEXSYS from the University of Arizona [33]; Colab, designed for Xerox at the Palo Alto Research Center, [34]; Shell GDSS, developed at the University of Minnesota [31]; DECAID (Decision Aids for Groups), designed by [35]; LADN (Local Area Decision Network) [36]; and SMU Decision Room Project [37,38,39]. However, the most widely used is Loomio, which manages the decision-making in some emerging political parties in Europe [40].
• A-2: Social Decisions Support Systems—SDSS-.
Deliberative Opinion Poll (from Stanford University) [41].

1.3.2. Type-B Applications

In general, conflict resolution requires social collaboration, and this is where the generation of confidence becomes relevant for collective decisions. Applications in this area usually implement models that simulate the propagation of opinions, as is done with infection or contagion processes. In fact, social and environmental agents have always tried to know the propagation of their opinions among the components of the society.
The software available to simulate these models is not strictly for collective decision-making, but also for the analysis and processing of information (structured and unstructured) with multiple receivers. However, some applications have evolved to provide an aggregate solution by focusing on different aspects. We can distinguish between applications [42] that prioritize,
organization of information
-
Paramount [43] Decisions
-
Analytica [44]
assessment made by multiple agents
-
1000 Minds of IBM [45] and
Application of procedures to predict the evolution of systems (analysis of dynamic systems and agent-based simulation models) [46].

1.3.3. Type-C Applications

In the end, although the emphasis may be at one end of the spectrum, systems that consider both personal preferences and social interactions usually fit the population’s view better than systems that consider just one of these circumstances. Applications in this field lead to effective solutions, although they are not always efficient. Two programs are the most used:
LIQUIDFEEDBACK. This application, [47] developed at the Massachusetts Institute of Technology (MIT), incorporates social networks of confidence so that the decision can be delegated to others (liquid democracy). It does not ask direct questions about the result, but rather encourages participants to propose alternatives. It has a sophisticated voting system to allow participants to express their opinions without allowing tactical considerations.
ALLOURIDEAS. This application uses a pair-comparison method between alternatives, which each participant must select. The outcome is the sorting of a list of proposals (to which new ones can be added) by the whole group. This application was developed at Princeton University [48].

2. Methodology for Confidence-Based Collective Decision-Making Based

When decisions are reported through digital systems (or the computers capture decisions automatically) the behavior of each person is recorded. The behavioral analysis can be automated and is aimed at representing opinions, which means—as explained on Section 1.1—knowing how a person assesses a solution and which solution is best for such a person.
However, the possibilities of digital management go beyond representing opinions: as Harsany [25,26] proposed, we can also use empathy among opinions.
For our purposes, empathy is the ability of a person to see the world through the eyes of another. If A chooses the best solution for B rather than himself, A reveals a preference for B’s opinion over his own opinion. If A is consistent in this behavior, we can say A empathizes with B, but it is a bit more complex than this. Binmore [49] describes properly the additional assumptions of Harsany´s theory, arguing:
Besides our personal preferences, which may include sympathetic concerns for others, we also have empathetic preferences that reflect our ethical concerns. This means that empathy can be graduated. However, some empathetic identification is crucial to the survival of human societies because society needs commonly understood coordinating conventions that select an equilibrium when many options are available.
When a person empathizes with someone, they do so entirely successfully (the best known historical example of incomplete empathy is quoted from Longinus: “Were I Alexander”, said Parmenio, “I would accept of these offers made by Darius”. “So, would I too”, replied Alexander, “were I Parmenio”.). The empathetic utility function of a person simply expresses the fact that the person in question thinks that A and B personal utils can be traded off, so that A’s personal utils count the same as a of B’s personal utils. In other words, holding an empathetic preference is the same thing as subscribing to a standard for making interpersonal comparisons between A and B.
Under the above assumptions, the Harsanyi’s theory can be described using a Von Neumann and Morgenstern utility function.
The power of empathy comes from its association with convergence of opinions. It could be accepted that putting yourself in the place of other favors reaching a common opinion. All that is needed is to verify that increases in empathy lead to convergence of opinions. In this case, participation should be encouraged if empathy among participants improves, and if not, the process should end.
If the overall amount of empathy is high at the end of the participatory process, then the aggregate opinion is representative of the preferences of the people involved. Here, the aggregate opinion will be adopted as the group’s joint decision. Otherwise, the group of participants will need to be broken down into homogeneous subgroups (with common opinions within the subgroups) and other aggregation procedures applied to the preferences of the homogeneous communities.

2.1. Calculating Empathy

The methodology described below is applicable to the calculation of empathy in a non-competitive environment. A deeper explanation and the primitive formulation of it can be found in [21]. It is based on calculating empathy for participants connected on social networks [50,51] and in incorporating Adler´s developments [52].
To determine the empathy of one person (A) towards another (B), we must consider the opinions of all those who make up this empathy. At least, A and B opinions (oA and oB), an aggregation of the opinions A considers to be closest to B in the confidence networks (on(B)A), the history or, at least, the aggregated opinion of the whole group when empathy is calculated (og), and an explicit objective opinion formulated by experts (oOb).
The above opinions can be used to determine the utility that a person believes that a solution has for another person, but the weight of all opinions cannot be the same. Therefore, the utility that A believes that solution X has for B can be calculated as:
U A B ( X ) = i { A , B , n ( B ) A , g , O b } ( 1 D i B ) × ( 1 X X i ) × u i ( X )
where: D i B is the reciprocal distance between i and B’s opinions (calculated using the distance between i and B in the confidence networks) it is the complementary of the probability that the opinion of the first person will align with the opinion of the second person); X X i is the distance between the best solution for i (Xi) [9] and the solution for which we are calculating the utility (X); ui(X) is the assessment of X made by i; and i refers to all the involved opinions ( o i = [ X i , u i ( X ) ] ) ,   i { A , B , n ( B ) A , g , O b } .
However, Equation (1) does not yet indicate the empathy of A relative to B. As mentioned, the empathetic function expresses the equivalence in the utilities of A and B when the aggregate assessment of the group (Xg) is modified. To calculate this, we force L systematic changes in the values of the descriptive variables for the group’s opinion (for example, increasing or decreasing the cost and performance of the Xg solution) and we determine the changes that these modifications produce in both A and B’s utilities. If each of these changes is represented by Xg<k> (for k = 1, …, L) then, the modification it induces in the way A believes that B makes their assessments will be represented as:
eAB, k = UAB(Xg<k>) − UAB(Xg)
For k = 1, …, L, we get a L coordinates vector representing the empathy function of A relative to B:
e u f A B = [ e A B ,   1 e A B ,   2 e A B ,   L ]
The set of empathies of A for all participants (N) will be the empathetic utility matrix of A (which will be notated as emA):
e m A = [ e u f A A 1 ,   ,   e u f A A N ] = [ e A A 1 , 1 e A A N , 1 e A A 1 , L e A A N , L ]
This matrix collects all the information referring to the empathy of a person (A) with the other participants. The matrix shows the variations of the utility that A believes that certain changes in the aggregate solution (in the L rows of emA) induce in the rest of the participants (in the N columns of emA).
A measure of the separation of empathy between a pair of individuals can be obtained from these matrices. Thus, from general operations with matrices:
S A B = 1 ( e m A , e m B / N )
where: N is the total number of evaluators,
e m A , e m B = t r   ( ( e m A e m B ) ° ( e m A e m B ) T )
° denotes the usual multiplication of matrices and tr( ) represents the trace of a matrix
The average of Equation (5) for all possible participant pairs has been used as a measure of the percentage of empathy among participants:
S T = 1 N ( N 1 ) / 2 I = 1 N 1 J = I N S I J
Obviously, the average of similarities of empathy between pairs of participants does not describe the distribution of empathy among participants. For that, other centralization and dispersion measures would need to be applied to the similarities of empathy, but our objective is to measure the evolution of confidence and variation of average empathy over time, to detect the increase or decrease in total empathy and evolution over time represented by Equation (7) (see Figure 1).

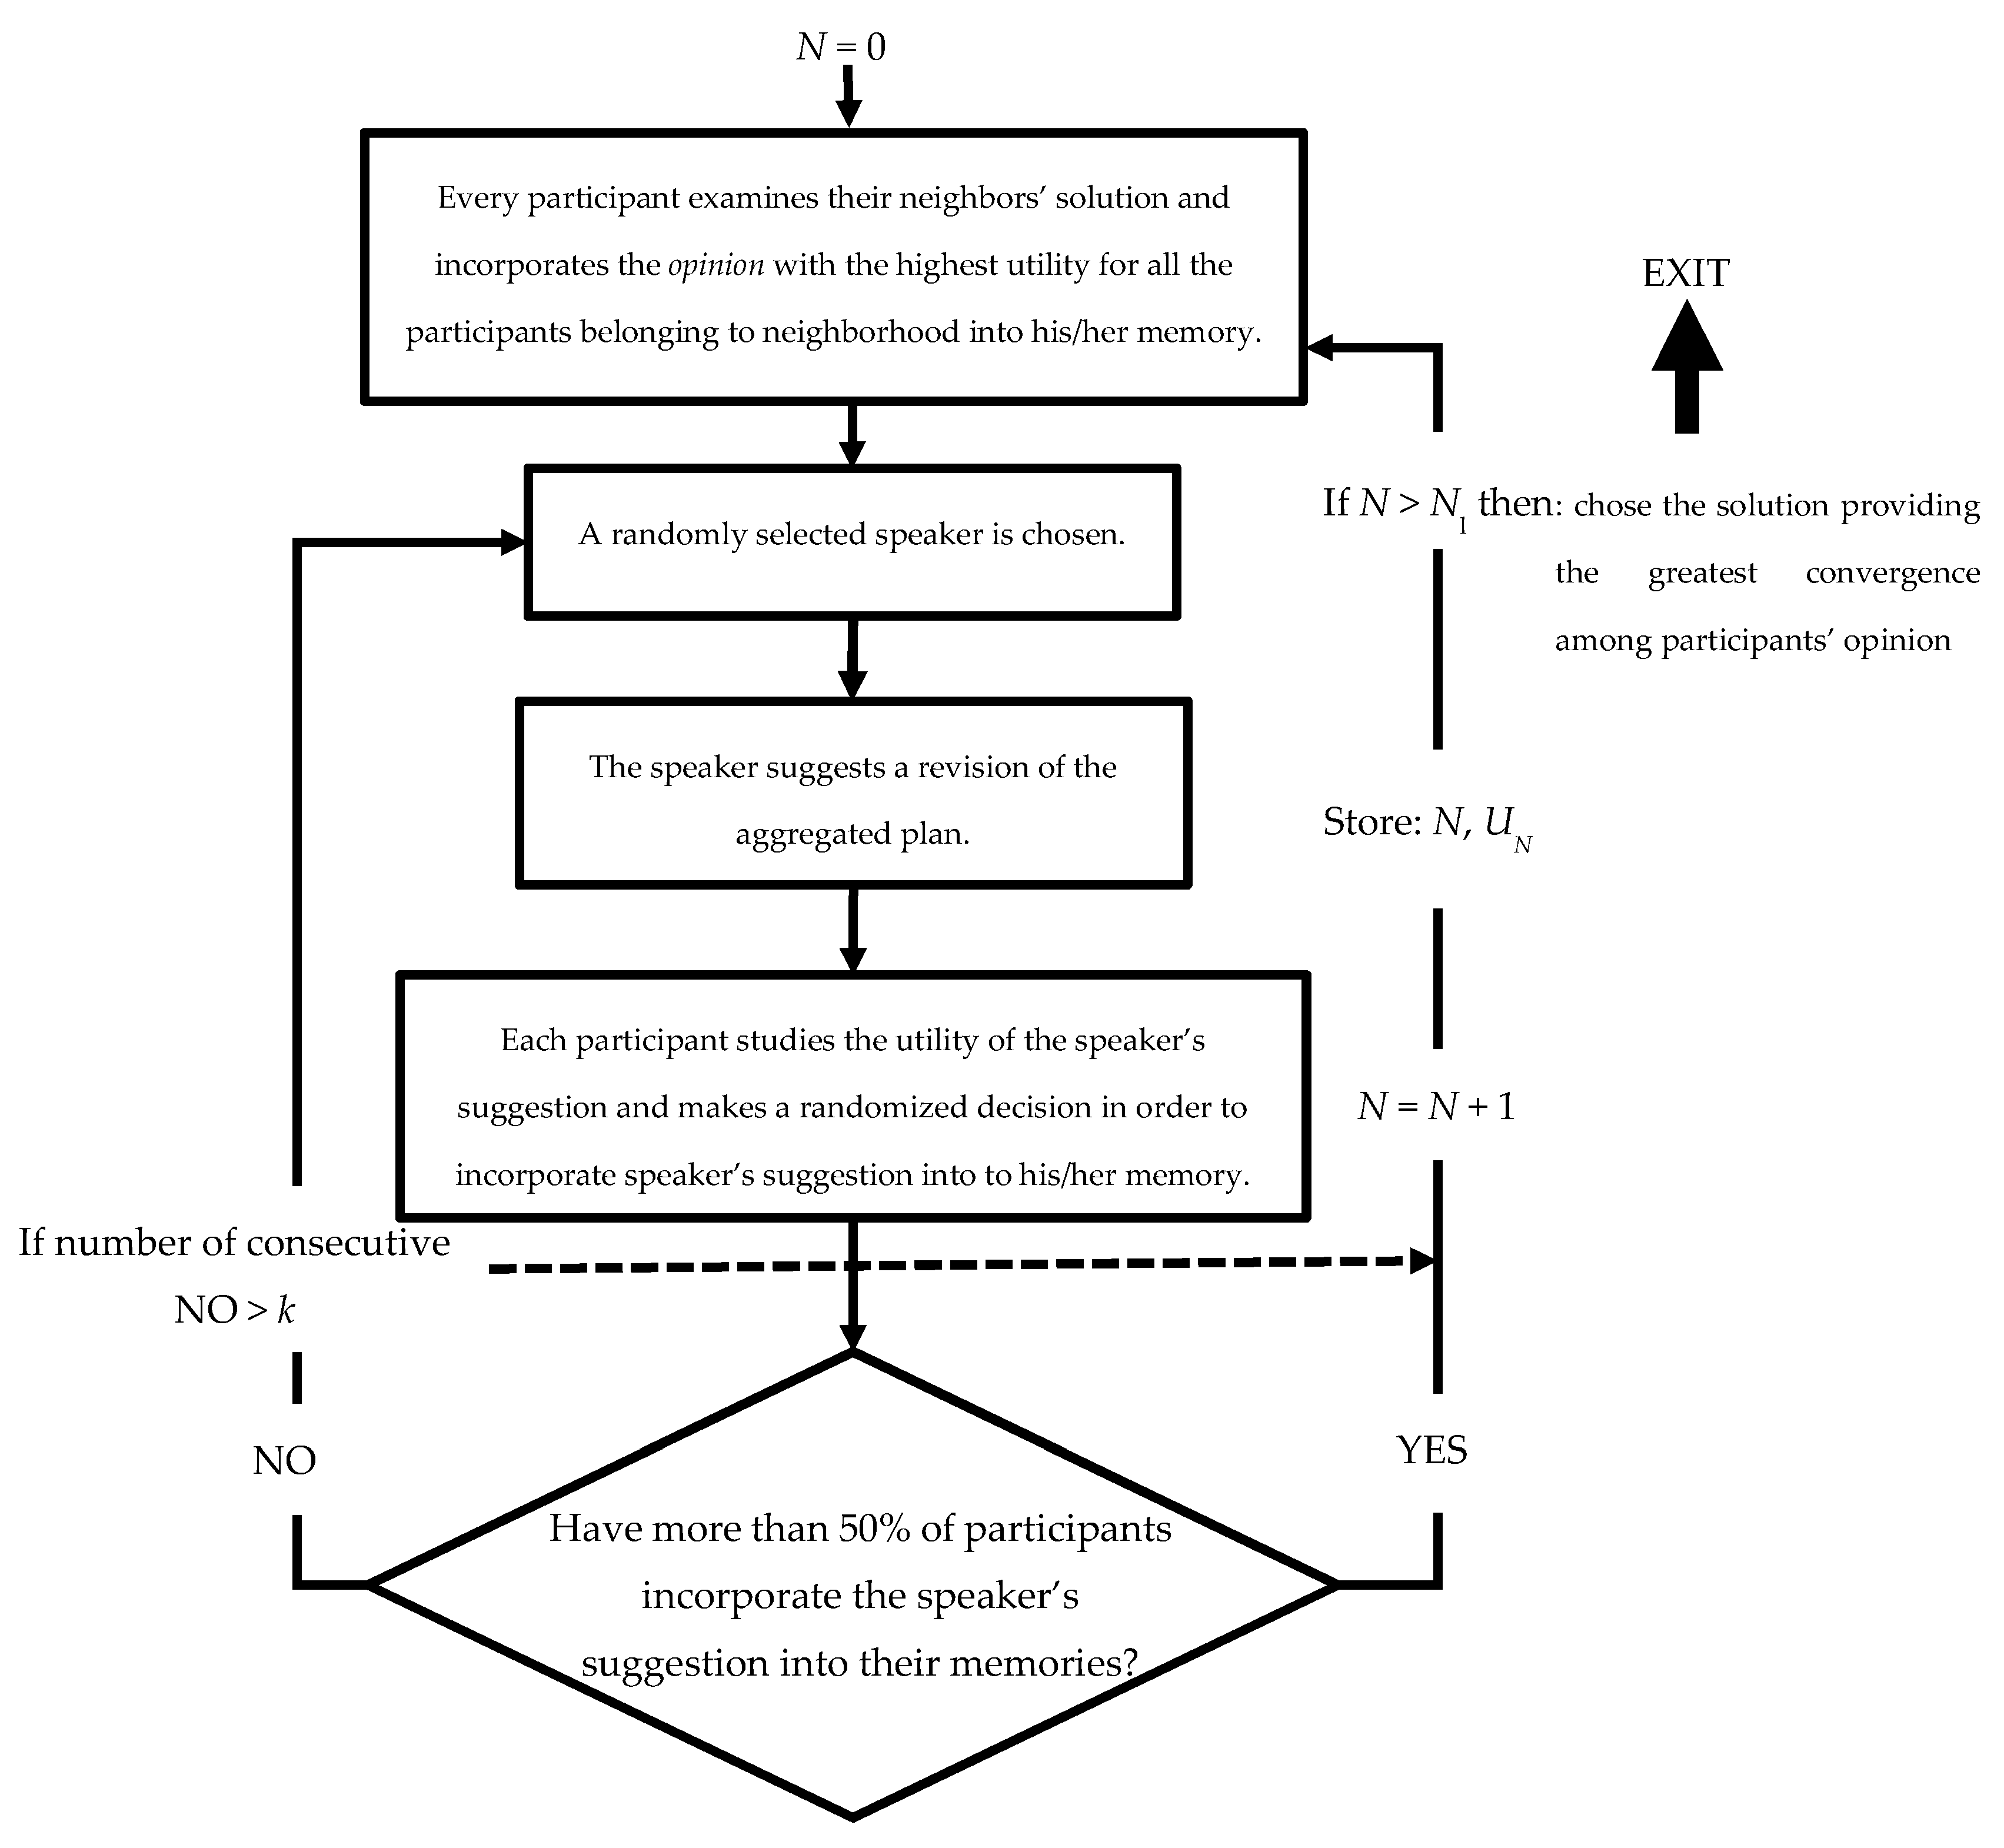
2.2. Simulating Interactions among Participants

Interactions among opinions occur naturally in participatory processes and can be promoted through digital forums and other tools offered by the Internet. Effects of interactions on collective decisions can also be simulated as described below.
The simulation is based on the works of Sayama [51]. Next, let us show the simulation frame with the mathematical notation and simplifications adopted in this paper:
  • Let oA = [uA(X), XA] be (as in the rest of the paper) the opinion of participant A.
  • Participants do not know the final aggregated assessment (ugF). The goal is to find a joint evaluation, which should be accepted by most participants at the end of the discussion process. However, the current aggregated value (ug) is known at any given time.
  • Each participant has a memory in which they store their personal comprehension of the problem and the history of group discussion. The memory is defined as a list of opinions either they have (or have had) or that other participants have expressed during the discussion. The memory of each participant (MA) can store up to p of their own opinions (the initial opinion plus the modifications they have accepted during the discussion) and up to q opinions expressed by each of the other participants (MA = {oA,k}, k = 1, …, p, p + 1, …, p + q). The total memory of one participant is limited to a certain number of opinions, thus p + ql. If the number of opinions participating in the personal understanding of the problem exceeds this number, then some of the opinions in the memory must be removed.
  • At least the following opinions always belong to the memory of a participant (A): oA, og, and oOb.
Interaction does not simply accept changes in view of other opinions. It requires discussion: each participant tries to impose their own solution on the group, but at the same time, the participant accepts changes in their solution if convinced. Discussion is an iterative process with the following phases on each one of the iteration:
1. Each participant examines whether there is an easy way to improve the utility of their current solution.
Every participant examines their neighbors’ solution and incorporates the opinion with the highest utility for all the participants belonging to their neighborhood into their memory. We shall denote this plan as un(A).
2. A randomly selected speaker is chosen.
We shall denote the speaker as S.
3. The speaker suggests the revision of the group plan.
The speaker (S) identifies which aspect of their individual plan has the most significant impact if incorporated into the group’s plan. To do this, we built emS matrix (Equation (4)), which is now calculated by adding the speaker’s opinion to that in the memory of all participants.
First, we have to calculate the utility that the speaker supposes the solution has for another participant (A) as:
U S A ( X ) = i S M A ( 1 D i A ) × ( 1 X X i ) × v i * ( X )
where S refers to the speaker´s assessments; MA is the memory of the A-evaluator; DiA, X and Xi are as in equation 1; and vi* is not the assessment of a solution (ui), it is referred to the expert’s opinion expressed as:
v i * = 1 | u i u O b |
Then, ug, which belongs to the memory of all participants, is systematically modified to calculate the emS matrix (equations 2 to 4). The row of this matrix with the highest sum of its components (j) determines the suggestion of change proposed by the speaker.
The new opinion that the speaker suggests to the group is expressed as og<j> = (ug<j>, Xg<j>).
4. The speaker’s suggestion is evaluated by all other participants, who respond to the suggestion at the individual level.
Each participant then studies the utility of the speaker’s suggestion, which is done by applying the next equation:
E A ( o g < j > ) = p M A ( ( 1 D p A ) × ( 1 X g < j > X p ) × u p )
where p is any opinion in the memory and MA is the memory of A.
If EA(og<j>) > EA(og), then the A-evaluator expresses support for the suggestion, and og<j> is incorporated to MA. Otherwise, i.e., EA(og<j>) ≤ EA(og), then A’s individual plan is not affected by the speaker’s suggestion. However, og<j> may still be randomly incorporated into the memory of A with a probability given by:
P ( o g < j > , o g ) = e x p ( E A ( o g < j > ) E A ( o g ) / T )
where: T is the “temperature” of the participant’s cognition (i.e., to what degree participants can tolerate low-utility suggestions).
If incorporating a new opinion exceeds the maximum number of opinions allowed in the memory, then the previous one has to be removed from memory.
5. Response to suggestion at group level.
The group determines if the speaker´s suggestion should be adopted as the new group solution by counting the number of participants that have incorporated the speaker´s suggestion into their memories. If this is more than 50%, then the old group opinion will be replaced by the suggestion (ogog<j>).
Figure 2 summarizes how to simulate iteration among participants. It is assured the convergence to better solutions, but not in a monotone way. Thus, you have to analyze results on all iterations to choose the best aggregated plan.

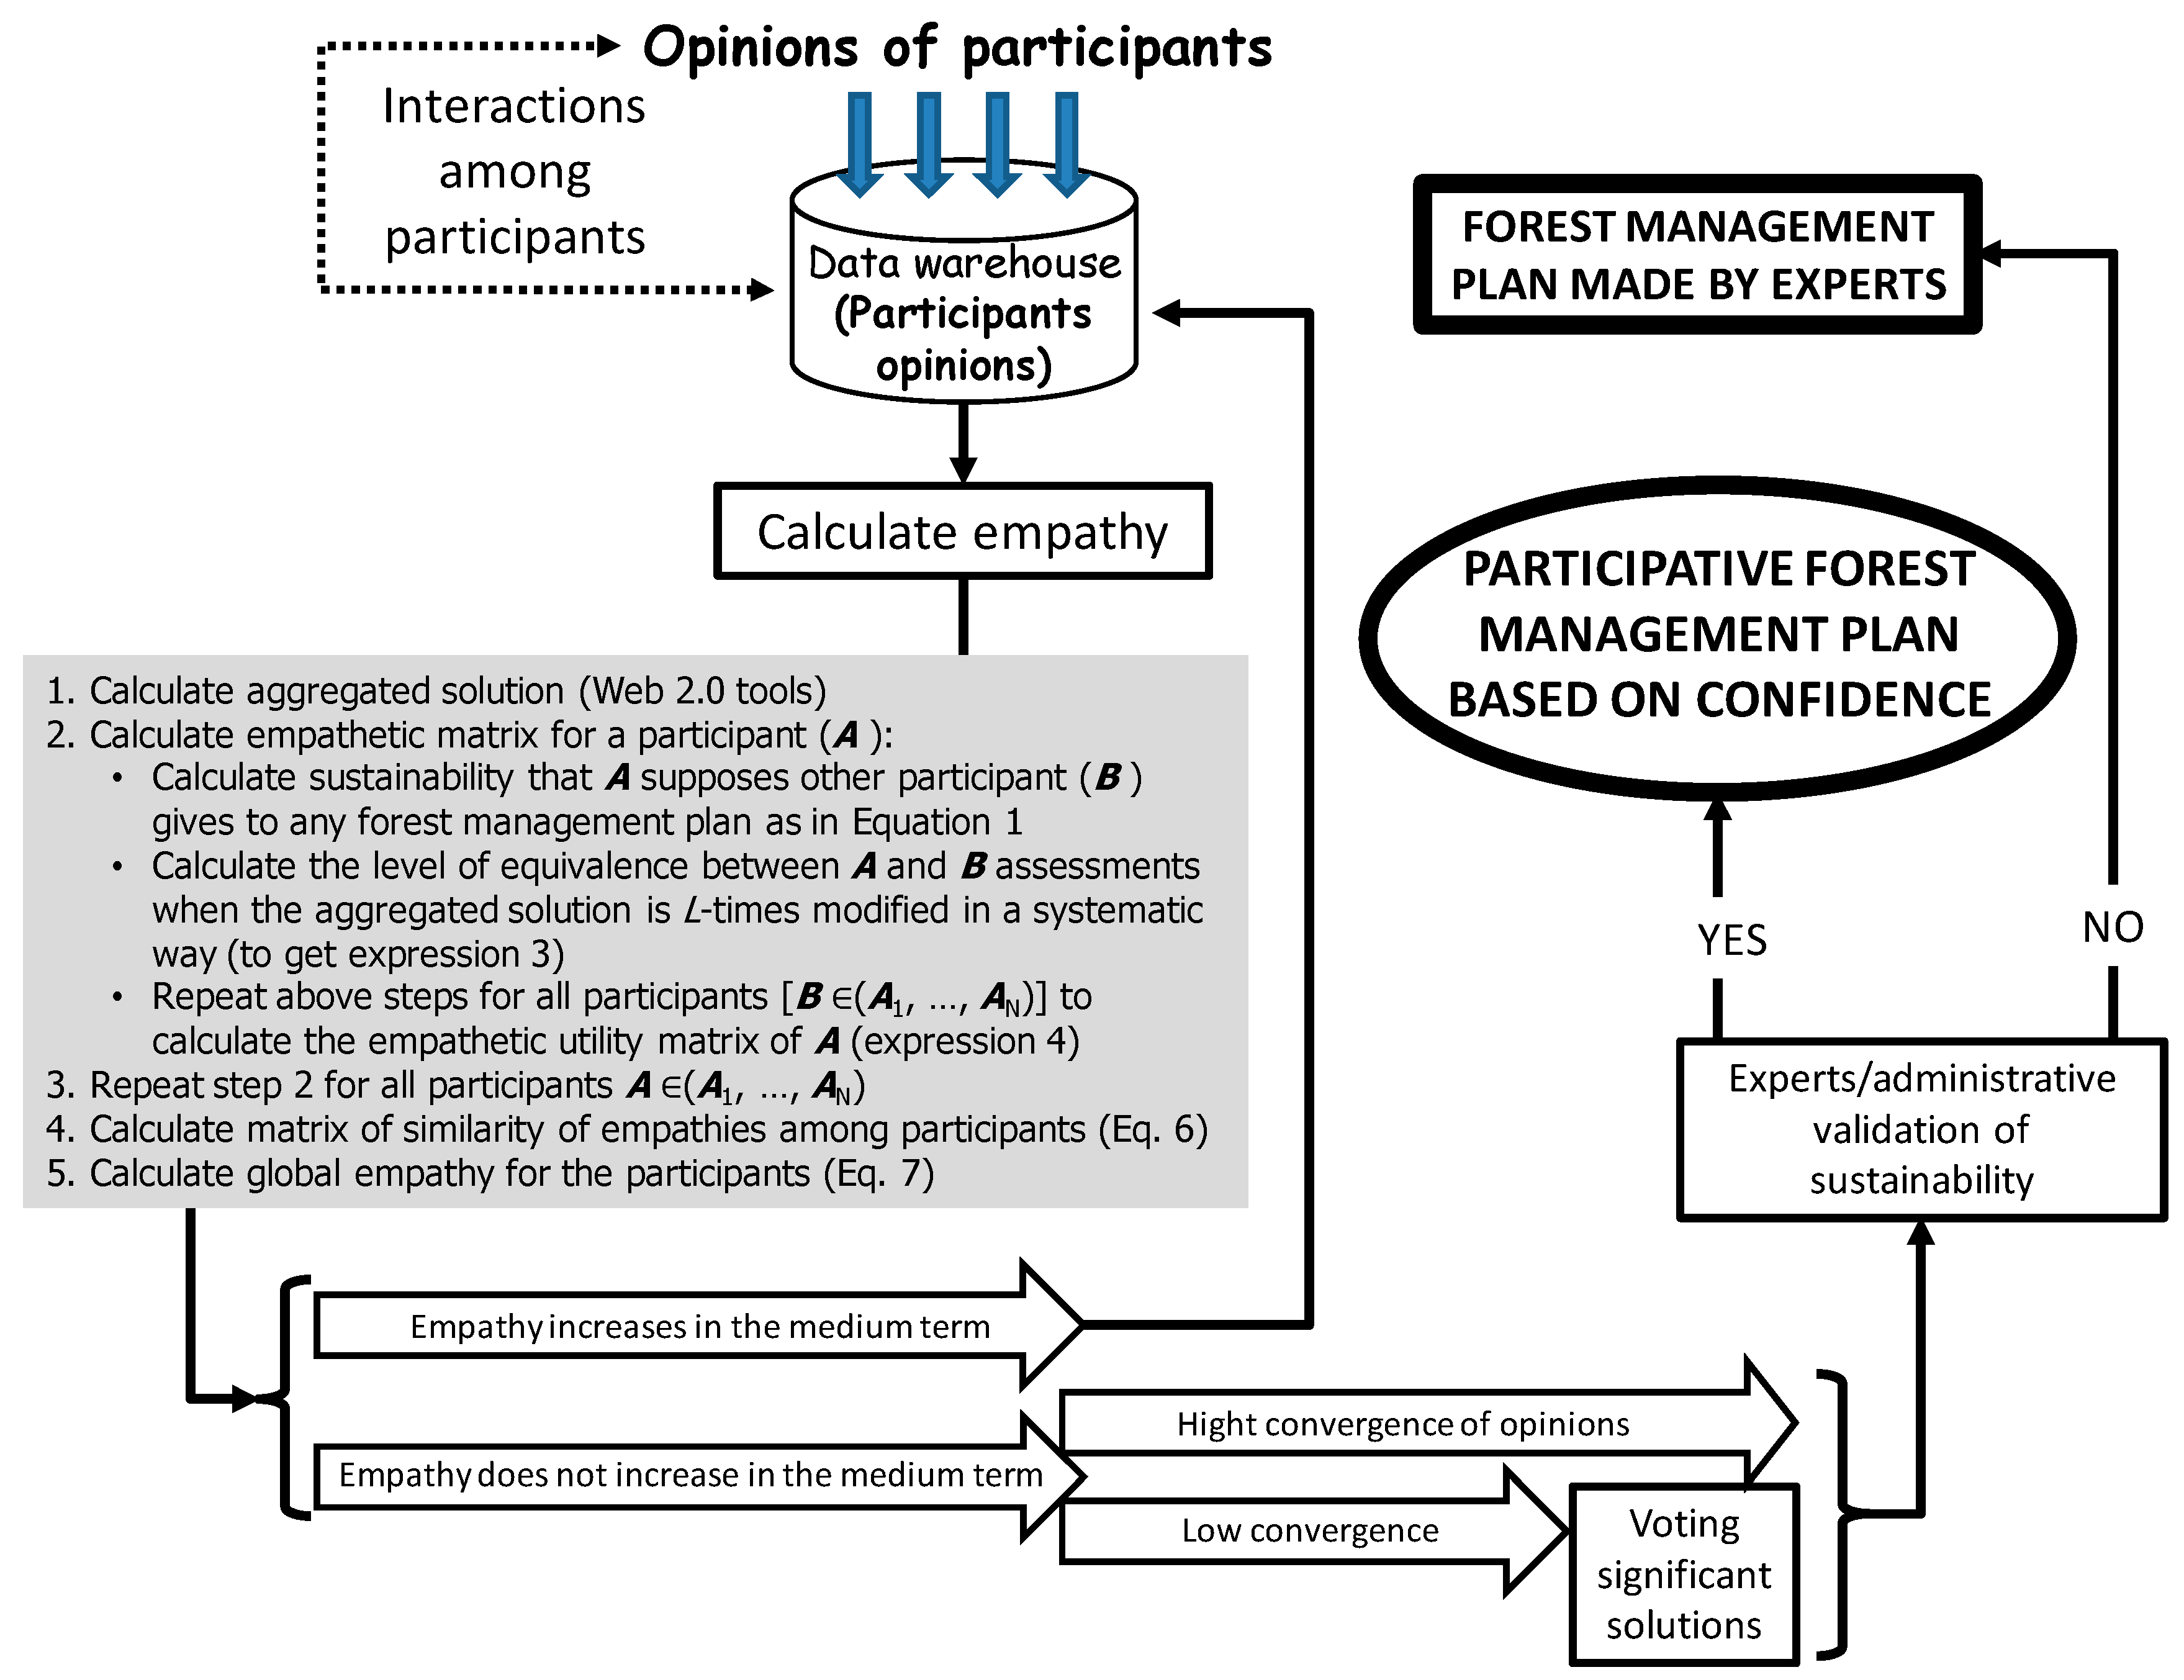
2.3. The Strategy for Confidence-Based Collective Decision-Making

From an operational point of view, the proposed strategy consists of the following stages:
a. Opening of an online information and participation process for anyone to formulate their preferences and to incorporate these preferences into the available information systems.
b. Encouraging participation, through the media or by community managers. Motivation should provide an incentive for both the recurrent participation of individuals already involved (they tend to modify their preferences because of interaction with other participants), and the incorporation of new participants.
c. Automatic representation of participant opinions. This requires determining how a participant assesses a solution (based on their personal preferences) and designing the solution that best fits a preference.
d. On-line calculation of the empathy of each participant with the others and of the total empathy for the opinions among all participants.
e. Supporting the participatory process if total empathy increases and terminating the process when there is no significant increase in empathy among participants.
f. Application, at the time of termination, of Web 2.0 tools, building of interpersonal functions, or both to choose the best aggregate decision. In case of a low convergence of preferences, another social or individual selection process should be used to choose representative and socially acceptable solutions.
It is evident that the confidence-based strategy satisfies the general requirements for participation to a greater degree than the public-participation applications that are currently available (see Table 1).

3. Case Study and Results

The case study focused on verifying the strategy for confidence-based collective decision-making. To do this, we simulated a participative process to design the most sustainable forest management plan at a real forest.
We apply the proposed methodology to “Valle de la Fuenfría” forest (Madrid, Spain). Environmental authorities have approved a sustainable long-term forest management plan with Scots pine (Pinus sylvestris L.) as the main vegetation. The case study is a territory within that forest (see Figure 3). It covers an area of 96.04 ha (40°45′ N, 4°5′ W), and has altitudes ranging from 1310 to 1790 m, an average annual temperature of 9.4 °C, and average annual rainfall of 1180 mm. Further information can be found in [53].
The strategy consisted of encouraging participation if empathy among participants increased. To verify this strategy, we needed to compare the evolutions of empathy with the convergence of opinions throughout the participative process (Section 3.3). To do that, we needed to measure both empathy and convergence of opinions (Section 3.2). In turn, this calculation requires the representation of the opinions of each of the participants in the process (Section 3.1).

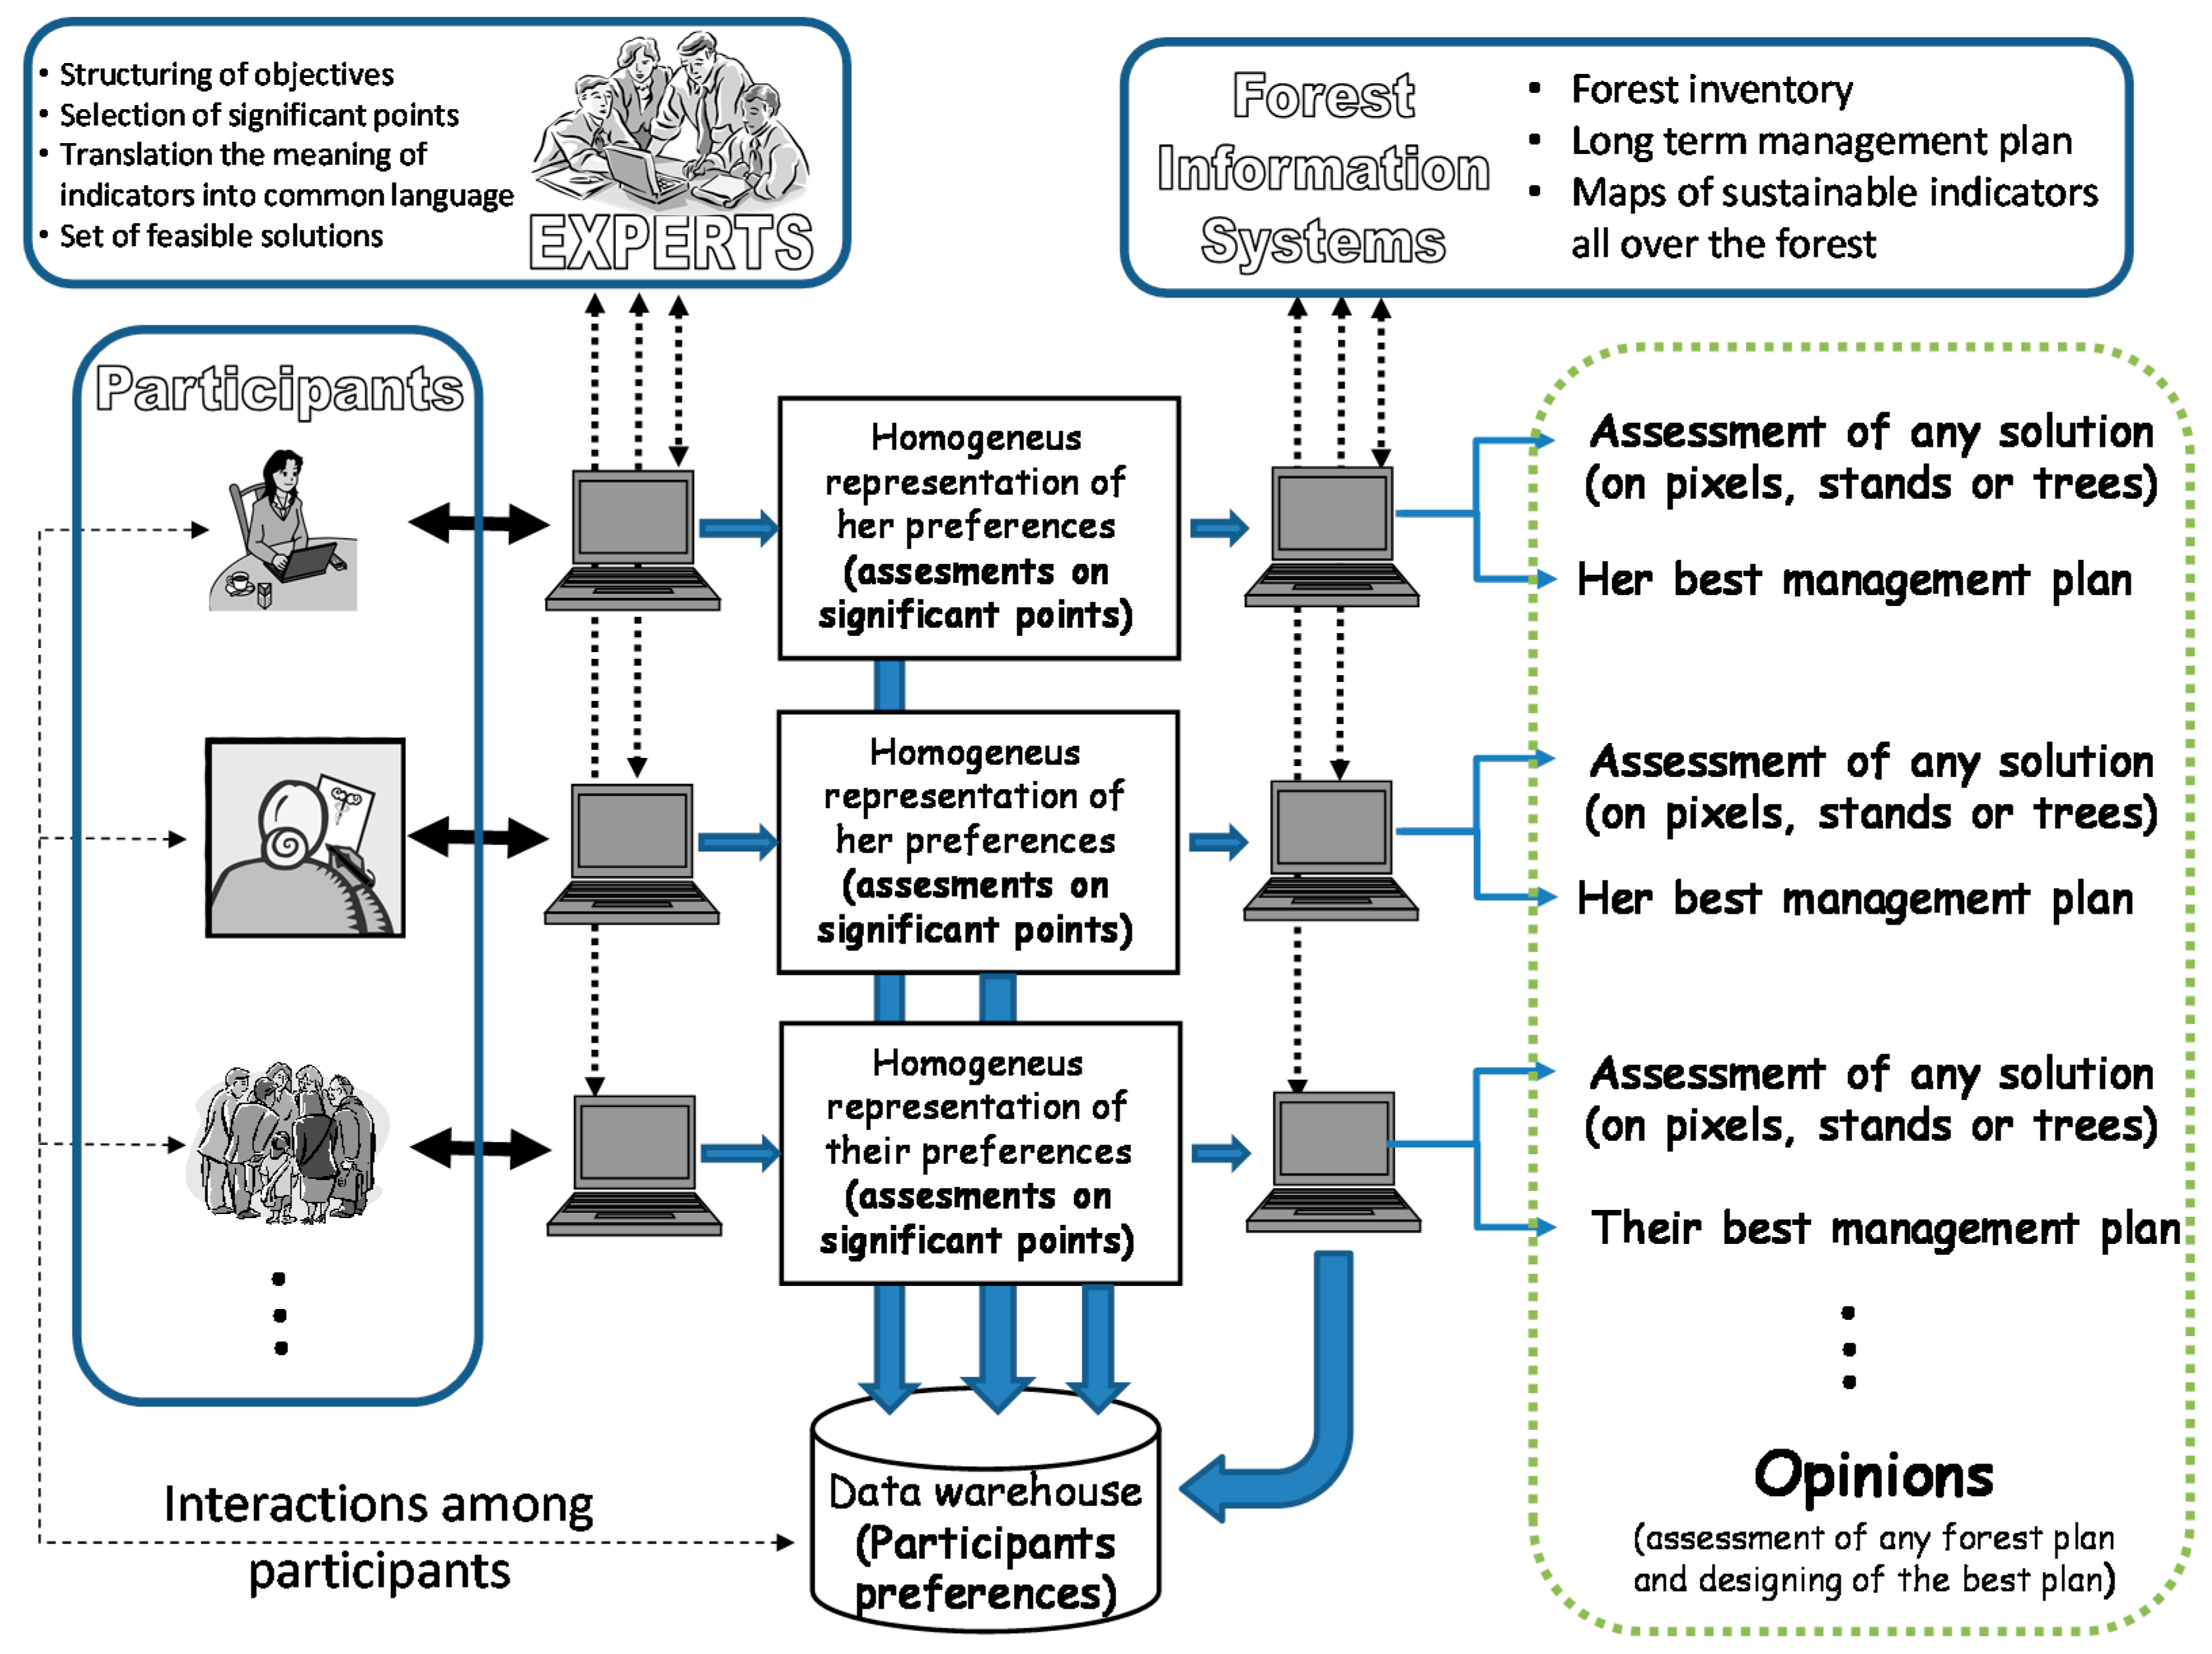
3.1. Representation of Opinions

Sustainability is a complex, multidimensional idea that does not allow an overall method of assessment. It is possible to measure partial aspects—indicators—but each person has their own way of aggregating those indicators for assessing sustainability. In other words, each person has an opinion on sustainability.
For this case study, representing an opinion means:
  • Assessing the sustainability on each one of the pixels of the territory according to personal preferences on sustainability.
  • Designing the forest management plan that best suits personal preferences on sustainability.
We have adopted pixels (instead of stands) because the accuracy of the inventory allows doing that [54]. Even trees could be decision units if you know the effects that any action carried on tree have in the tress on its neighborhood (see Equation (13)). Additionally, management based on pixels is applicable to analyze sustainability at different scales. In any case, you must remember that we are looking for a management plan of a forest under a long-term management plan based on stands, and any action must fit to this plan.

3.1.1. Personal Assessment of Sustainability at Each Point of the Territory

Sustainability is calculated at each one of the points of a grid superimposed on the study area with a pixel width of one meter.
The methodology for the assessment of sustainability was the one that incorporates SiLVANET [54], a computer application for participatory forest management. It calculates sustainability on hierarchical (and no hierarchical) indicators structuring that must be built by experts [55]. This case study focuses on a partial assessment (an aggregation of attributes to determine wood sustainability) within the larger structure. Nevertheless, the case shows all the challenges that faces sustainability assessment.
The information required came from three different sources: physical and management parameters of the area—mainly: height distribution of trees within a 50-m diameter around each point, it is a scale-invariant indicator that can be used in management based on stands or pixels, whatever their size [56], and sustainability indicators such as structural diversity, timber yield, or the biomass at each point; personal information on the individual whose opinion was going to be represented (gender, age, level of education, occupation, type of residence—urban or rural—and stakeholder category); and the personal sustainability preferences of each participant.
Preferences are captured through a pair-wise comparison (see [30]) of forest management regimens in specific points of the territory. Management regimens must be representative of all the management options for the forest and we shall refer them as meaningful or significant points. Comparison requires the selection of the meaningful points (see [54] for the points in this case study) and, after forming all feasible pairs of points, to ask the participants for their preferences within a pair (they must indicate which of the two points they consider to be more sustainable (see Figure 4). The answers are recorded in a preference matrix and then transformed into a numeric value of the sustainability on each one of the comparison points (see [57]). This value matches the preferences of the participant that has filled the preference matrix. Table 2 shows: geographical coordinates of comparison points, the matrix of preferences filled by a concrete participant, and the sustainability assessment on the comparison points. The number of meaningful points must be small. It is recommended not to choose more than six points, because the number of pairs to compare will be 15. The more comparisons the more decreases of concentration and the judgments tend to be inconsistent with the evaluator's own preferences [58].
Also, you must have an aggregation model to extend the above result to all the pixels in the study area. In this case, we have used an objective model that calculates sustainability as the statistical association between indicators on any pixel and indicators on an ideal point [55,56]. Experts must choose the appropriate sustainability indicators (it is possible to use pan-European or Montreal indicators). Although, you always must use an indicator that considers the annual increment of wood under allowable cut standards (we use the timber yield, see [55,56] for a description of how to compute it).
Sustainability in all the territory (Figure 4) is then calculated from information deduced from both procedures: pair-wise comparison and aggregation of criteria (see [55]). The pair-wise comparison value is the framework where the assessment of the pixels that are not subject to direct comparison is fitted. The thoughtful judgments required in the pair-wise comparison set the general pattern of value, and the valuation obtained from the aggregation of criteria incorporates the variability present in all alternatives to the evaluation process.
In the above context, the SiLVANET methodology [54,60] was applied to achieve the following outcomes:
  • To get the personal sustainability value at each one of the compared points (Table 2).
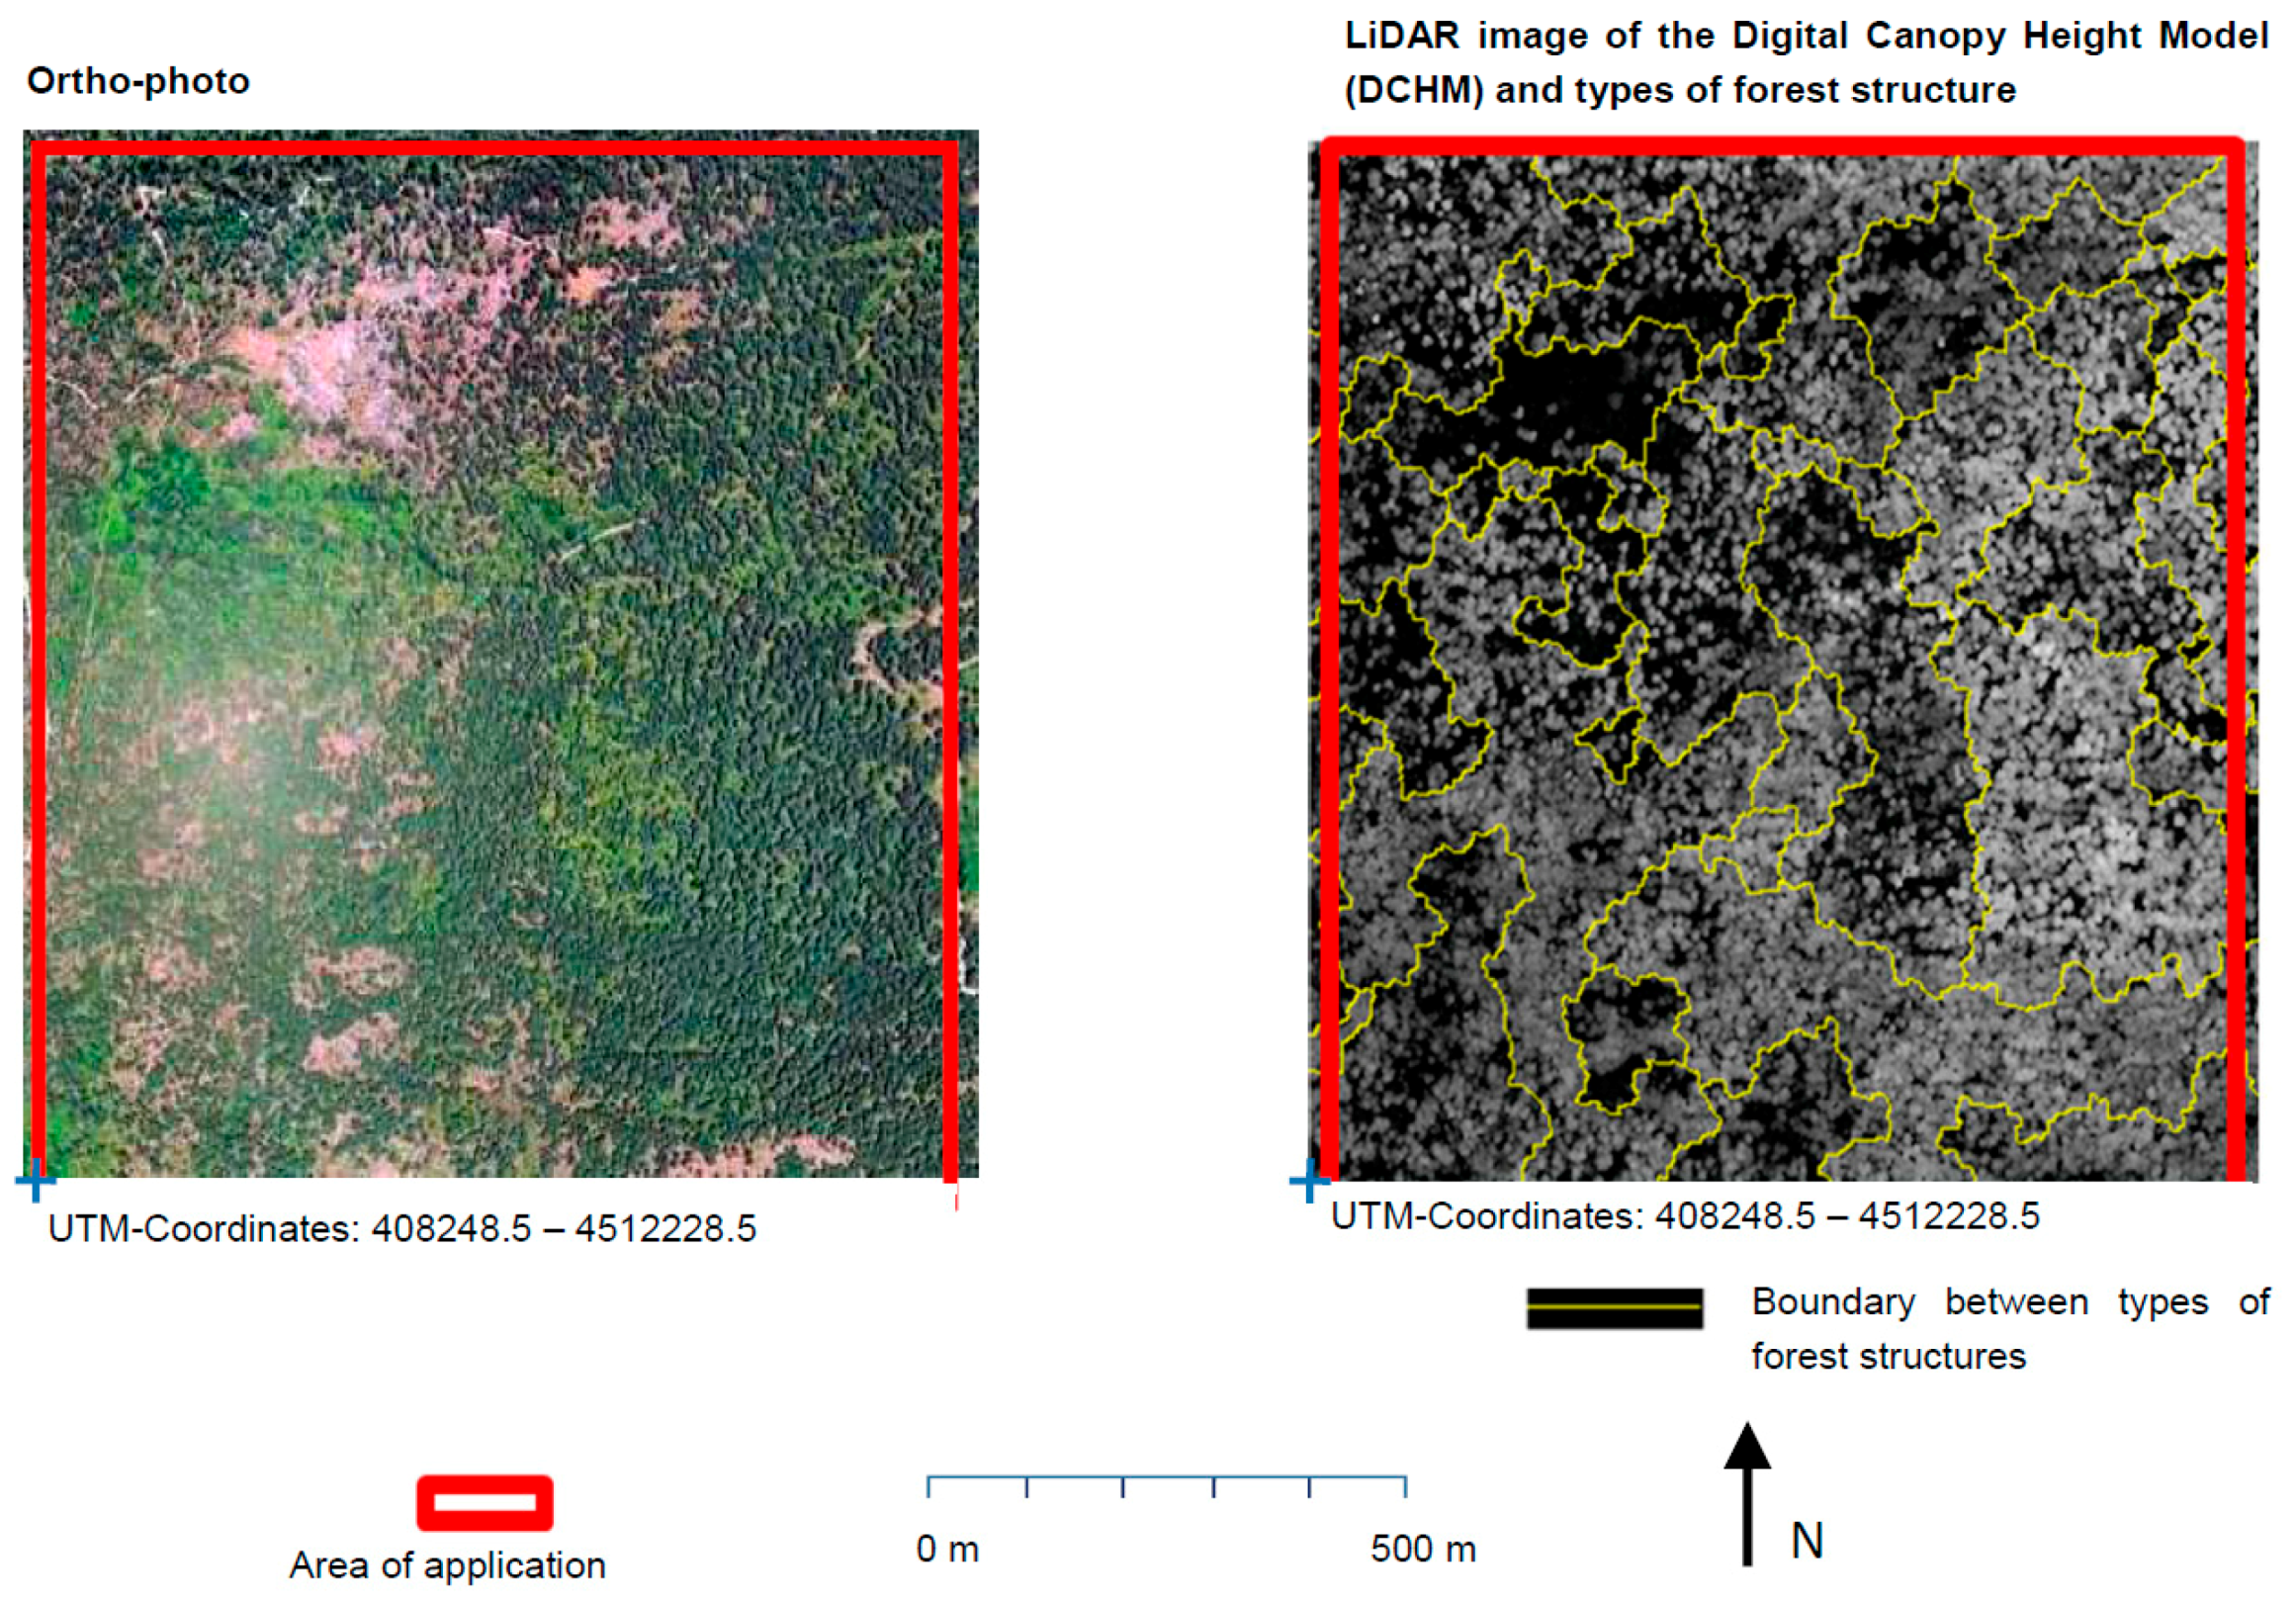
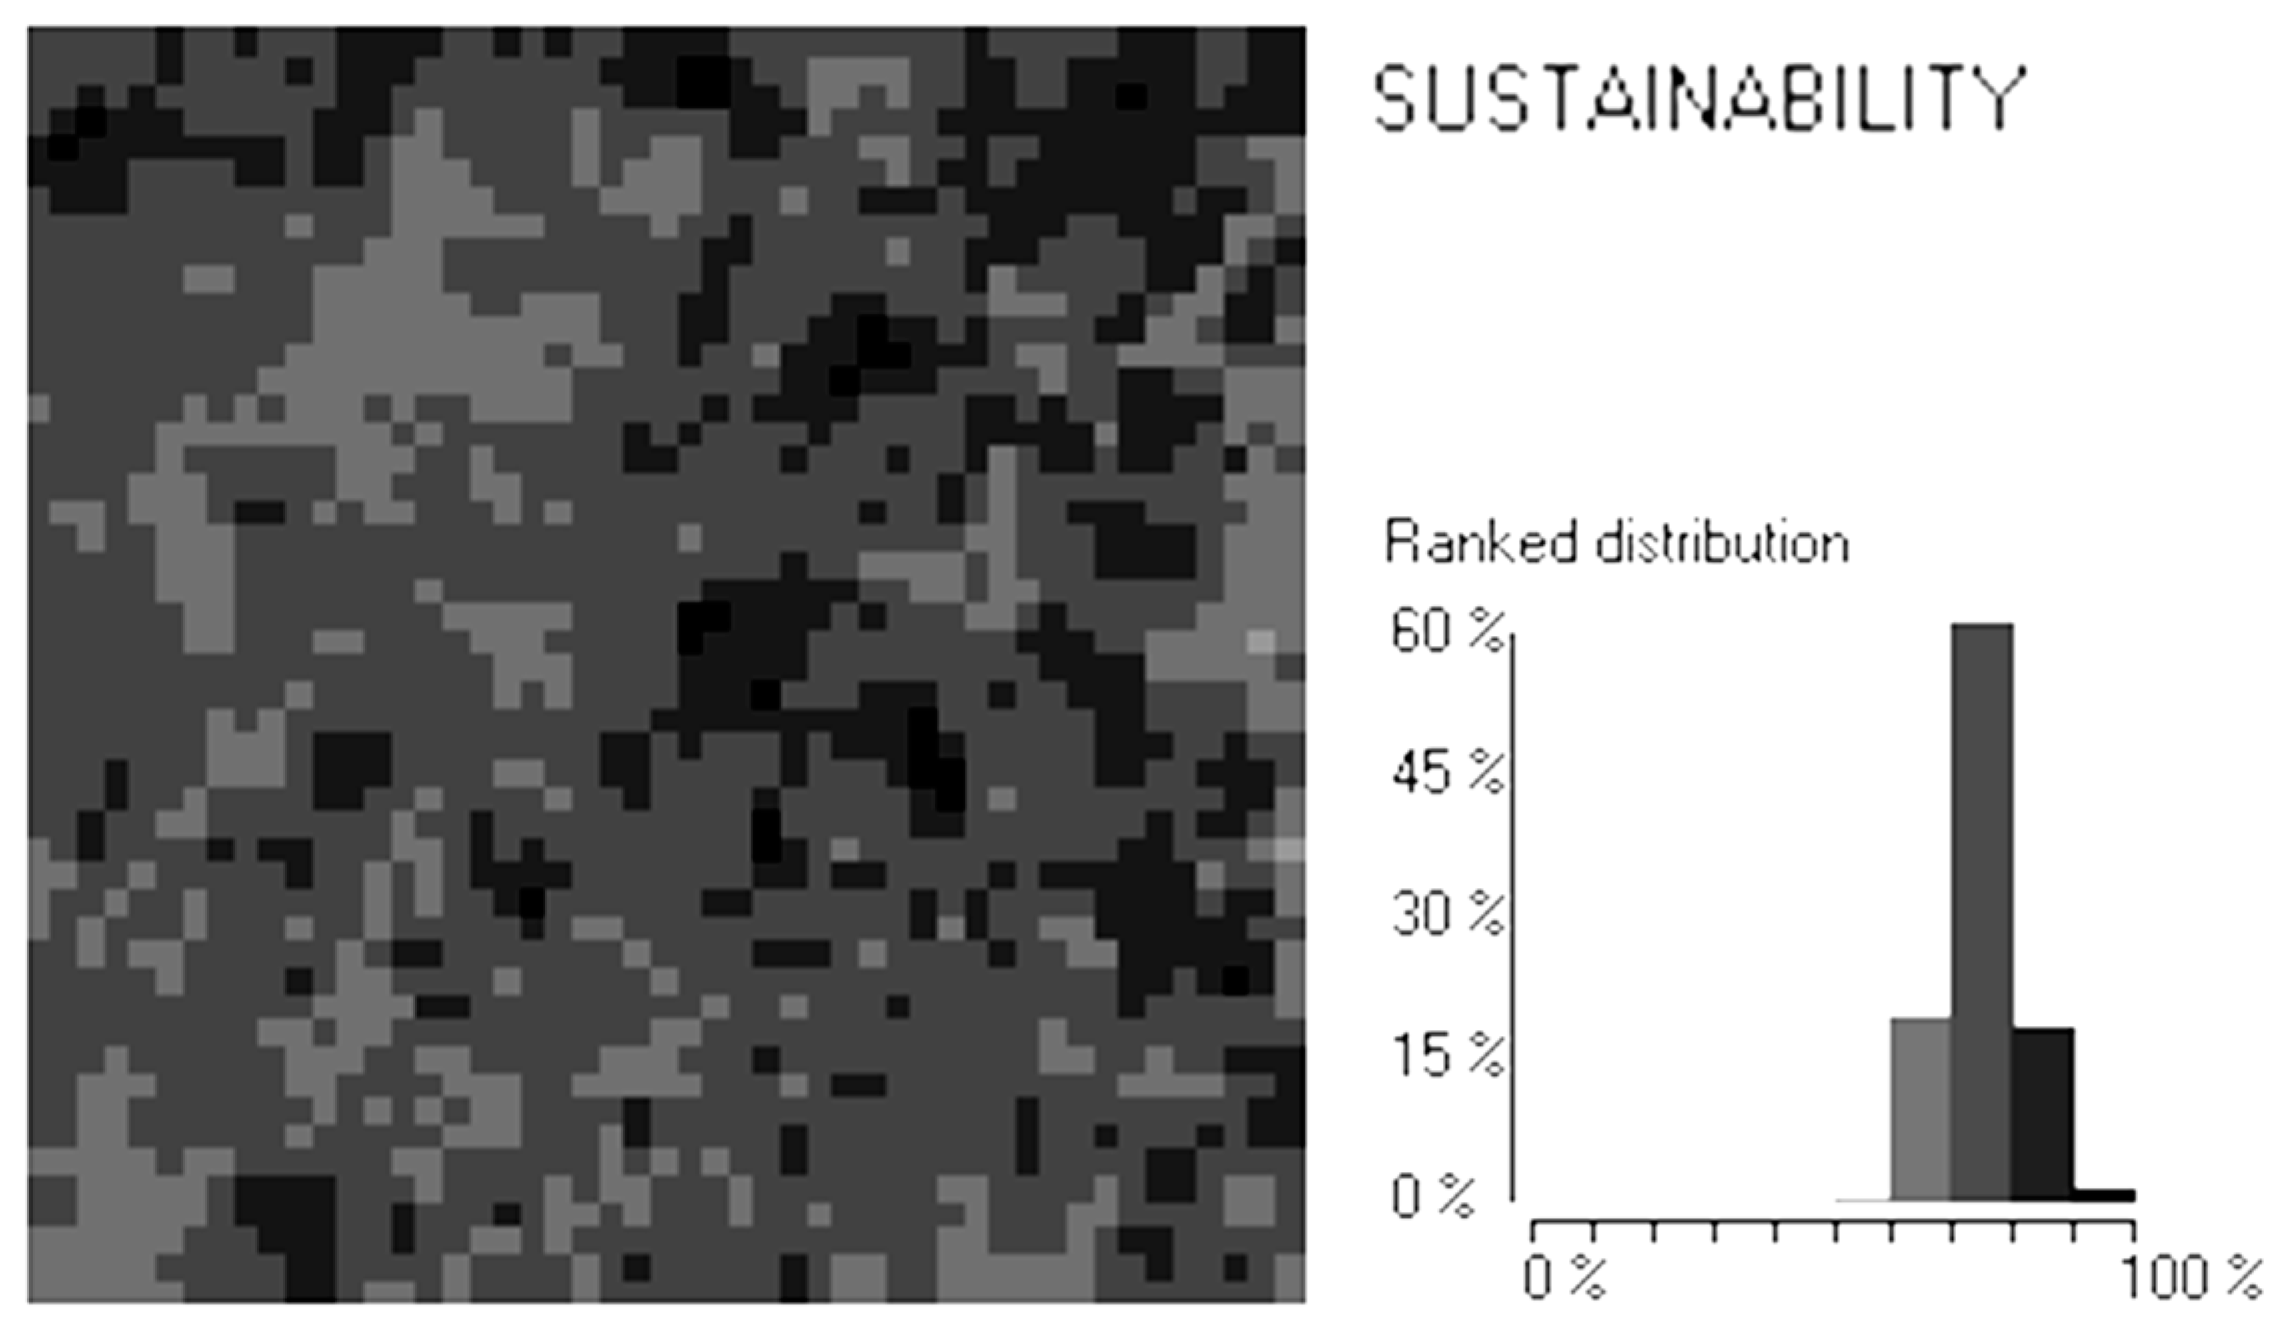
  • To extend the assessment to the remaining points in the area (Figure 5).
  • To estimate the mapping from sustainability indicators into the sustainability at each point, Equation (12) via a Multiple Regression Model. Independent variables are constrained to those statistically significative and with absolute values for their parameters greater than 1.5. This expression is used to extend the sustainability to the rest of the forest (the maps of sustainable indicators all over the forest is all you need) and to design the best management plan (Equation (12)).
Analytical equation of sustainability calculated through multiple regression analysis between the value in Figure 5 and the value of the main sustainability indicators at all of the points of the territory is
U = −3.166I2 + 5.08I1I3 + 1.519I2I3
where I1: Structural diversity; I2: Timber yield; I3: Biomass.
The above outcomes are sequential: first, the sustainability on the significant points was obtained (outcome number 1). Then, outcomes 2 and 3 were obtained by adding the physical and management parameters of the territory to outcome 1. Consequently, for specified forest exploitation, the relevant information came from the sustainability in the six points subjected to comparison.

3.1.2. The Management Plan that Best Suits Individual Preferences

A management plan involves formulating a set of temporally-located actions to be carried out at a point in the territory. However, the number of viable plans is so high that it is not feasible to generate all of the possible options to choose the best one. For instance, if there were ten activities per tree and year (cutting, pruning, labor, pest treatment, and any combination) and the number of trees in our study area was 500,000, then the number of potential management plans would be 100500,000 (for a planning horizon of ten years). To get around this problem, we determined the best management plan by applying combinatorial algorithms for optimization ([58] and [60]).
Specifically, we applied the Simulated Annealing algorithm [61] to optimize the following function:
U A ( X ) = ( i = 1 , , C j = 1 , , L 1 P i = y j u A ( P i = y j ) β V ( X ) )
where: A is a participant in the decision process. Pi is a point in the territory and its neighborhood (a circle of 50-m diameter around each point); Yj is a specified set of activities (cut trees, prune lower branches, styling, eliminate feedback, etc.) carried out on Pi; L is the number of feasible activities that can be carried out at any point and in its neighborhood; C is the number of points in the territory (usually the points are pixels, but they can also be trees or homogeneous territorial units); 1 is the indicator function (1 if Pi = yj and 0 otherwise); βV(X) is a regularization term; uA(Pi = yj) = k1vA(Pi = yj) + k2Bi(Pi = yj), where: vA(Pi = yj) is the A assessment of sustainability for Pi = yj and Bi(Pi = yj) is the economic balance for changing the current land use to Pi = yj.
Optimizing expression (13) leads to the most sustainable forest management plan for a specific participant. You can see [54,58,60] for a detailed explanation of the spatial-temporal location of activities given by the management plan. Basically, it determines (on each pixel) the number of trees to be cut (per ha) on each height class, and the labors required to facilitate natural regeneration. To ensure sustainability, the solutions are constrained to feasible sustainable solutions defined by the experts.
Table 3 describes the best forest management plan for the participant in Table 2 and Figure 5. Measures on Table 3 are trees heights because current data collection technologies (combining aerial and terrestrial LiDAR (Light Detection and Ranging), photogrammetry, and remote sensing with measurements in the field) make easy tree-heights measurements [62] in large forest areas. It is also socking to show the number of trees from 0 to 3 m height. It is because a dynamic programming model has been applied to predict the height classes evolution [54,56]. This model generates the future number of trees in all the height classes, which is incorporated in the timber yield indicator. In no case 0 to 3 m trees are harvested by clearing or precommercial thinning, the most correspond to natural self-thinning mortality. In the field, the inventory of trees from 0 to 3 m is made in a sub-plot and its exact height is not recorded, it is only recorded if it is in the range, visually.
Figure 6 shows the flow charge for representation of opinions for multiple participants.

3.2. Measuring Empathy and Convergence of Opinions

Our approach to collective decisions requires recurrent calculating of two items at any point in the process: the convergence of the expressed opinions, and the overall empathy among participants. This section describes how to calculate both items for a group of twenty participants (the analysis of larger groups is similar, but showing results is more complicated).
The information required to calculate these items is the representation of opinions for all participants, which is calculated from the sustainability at six meaningful points of the territory. Table 4 shows the sustainability for all members of the group at the most meaningful spatial points.

3.2.1. Convergence of Opinions

Calculation of convergence requires knowing the aggregated solution over the entire time. For this case study, the aggregated assessment is the average of the values for all the participants at the six meaningful points. Convergence of opinions (CoO) has been calculated as the sum of the variation coefficients at each of the six meaningful points:
C o O = 100 { i = 1 6 ( s i / x ¯ i ) } / 6
where x ¯ i and s i are, respectively, the average and the standard deviation of the sustainability assessments in the i-meaningful point and for all the participants in the group.

3.2.2. Overall Empathy of the Group

All the information necessary to calculate empathy is derived from the data provided in Table 4. Following the methodology described in Section 2.1, the first task to calculate is the utility that a participant (A) believes that a solution (X) has for another participant (B), which involves application of the equation 1. The variables we have used to calculate equation 1 are described below.
  • DiK, which is the reciprocal distance between i and B’s opinions, is calculated as:
    D i B = u i ( X Real ) ,   u B ( X Real ) = ( u i u B ) Σ 1 ( u i u B ) T D max
    where: DiB is the reciprocal similarity in the way participants i and B make their sustainability assessments; ui(XReal) = [vi(XReal)P1, , vi(XReal)P6] are the sustainability values that i assigns to the six points being compared (P1, …, P6) in the current land use (XReal); Σ−1 is the inverse covariance matrix of the sustainability assessments at the most representative territorial points for the data of all the active participants (Table 5); and Dmax is the maximum value of the numerator in Equation (15) for all pairs of active participants.
    Table 5. Sample covariance matrix and its inverse for the simulated opinions of 100 participants. Both are calculated for all the pairs of meaningful points (P1 to P6).
    Table 5. Sample covariance matrix and its inverse for the simulated opinions of 100 participants. Both are calculated for all the pairs of meaningful points (P1 to P6).
    Sample Covariance Matrix
    ParticipantsP1P2P3P4P5P6
    P10.08650.01127−0.02471−0.01023−0.019140.03407
    P20.0011270.10156−0.004280.003340.0266−0.01522
    P30.02471−0.004280.083950.027460.01118−0.02735
    P4−0.010230.003340.027460.06730.01217−0.01564
    P5−0.01914−0.02660.011180.012170.0692−0.01385
    P60.03407−0.01522−0.02735−0.01564−0.013850.09163
    Inverse of Sample Covariance
    ParticipantsP1P2P3P4P5P6
    P114.816−1.68992.4984−0.1722.1223−4.7533
    P2−1.689911.90611.0144−1.34974.86553.4124
    P32.49841.014415.3689−5.28020.11512.9422
    P4−0.172−1.3497−5.280217.7403−2.65660.8895
    P52.12234.86550.1151−2.656617.81462.2913
    P6−4.75333.41242.94220.88952.291314.6224
  • X X i is the distance between the best solution for i (Xi) and the solution to which we are calculating the utility (X):
    X X i = | U i ( X ) U i ( X i ) |
    where Ui(X) is the utility of X solution for the i participant, calculated like in Equation (12).
  • vi(X) is the assessment of X made by i.
    It is calculated as the average sustainability at all the points of the study area (see Section 3.1).
  • i refers to all the involved opinions ( o i = [ X i , v i ( X ) ] ) ,   i { A , B , n ( B ) A , g , O b } . A and B are the mentioned participants, and:
    n(B)A are the opinions that a participant (A) considers to be close to the opinion of each of the other participants (B). These opinions satisfy both: the reciprocal similarities between their sustainability assessments and the A assessment of sustainability are bounded to a fixed value (DAK < K0 for K = 1, …, N participants; with DAK calculated as shown in the Equation (14) and, simultaneously, their opinions belong to stakeholders of the same type as B.
    oOb is the expert opinion on sustainability (which is supposed to be more objective than other opinions).
    og is the aggregate opinion, calculated as an average of the assessment for all participants.
The next task is to determine the equivalence of the utilities of A and B when the aggregate assessment of the group (Xg) is modified. The changes we adopted represented a variation of ± 5% in the values of all the components in ug(Xg), which is the equivalent of 729 changes. We then carried out the process described in Section 2.1 up to calculate emfA for an A-participant (Equation (4)). Each one of these matrices has 729 rows and 20 columns.
The reciprocal similarities of empathy between participants (Equation (5)) are shown in Table 6.
Equation (6) is then applied to the data on Table 6 to calculate the average of the empathetic similarities. The overall similarity for the twenty analyzed participants is ST = 80.99%.

3.3. Verification of the Strategy for Confidence-Based Collective Decision-Making

We used simulated data instead of real opinions to verify the strategy because we wanted to analyze the influence of the two main factors affecting collective decisions: the number of well-informed participants and the interactions among them. It is not possible to separate a person’s own opinion from the changes due to interactions when dealing with human decision-makers, but it is easier to isolate the effects of these factors with simulated data.
As shown in Section 3.1 and Section 3.2, all the relevant information for calculating empathy and convergence comes from the sustainability at the six most meaningful points in the territory. We have therefore simulated the opinions of one hundred participants by assigning a sustainability value to these points, under the following conditions:
The sustainability for each meaningful point and each stakeholder came from sampling a normal distribution with the mean and standard deviation shown in Table 7. The mean corresponds to the sustainability assessments of a well-informed participant on each type of stakeholder. Standard deviations show variations in data from real participative processes [30,58].
Table 7 also shows the number of participants for each type of stakeholder.
The opinions for the simulated participants (one hundred) are summarized in Figure 7.
To measure the separation between opinions (Equation (4)), we used the inverse of the covariance matrix (for the one hundred simulated participants) between all the possible pairs of significant points. The covariance matrix and its inverse are shown in Table 6.
We consider the above participants to be well informed because the standard deviation is not too large (means are calculated by consulting experts on each stakeholder group). We consider that the larger the standard deviation, the worse-informed the participants.
The average convergence of opinions (Equation (14)) for the participants in Table 7 is: CoO = 73.67%.
To analyze the evolution of the participative process (Section 3.3.1), we started with a group of five participants (randomly chosen from the set of one hundred). For the participants in this group, we measured both the aggregated empathy among participants and the convergence of their opinions. These calculations were repeated in new groups, formed by randomly adding five new participants to the current group. The expansion process continued until one hundred participant groups were reached.
Later, Section 3.3.2 analyzes the effects of interactions among the simulated participants.

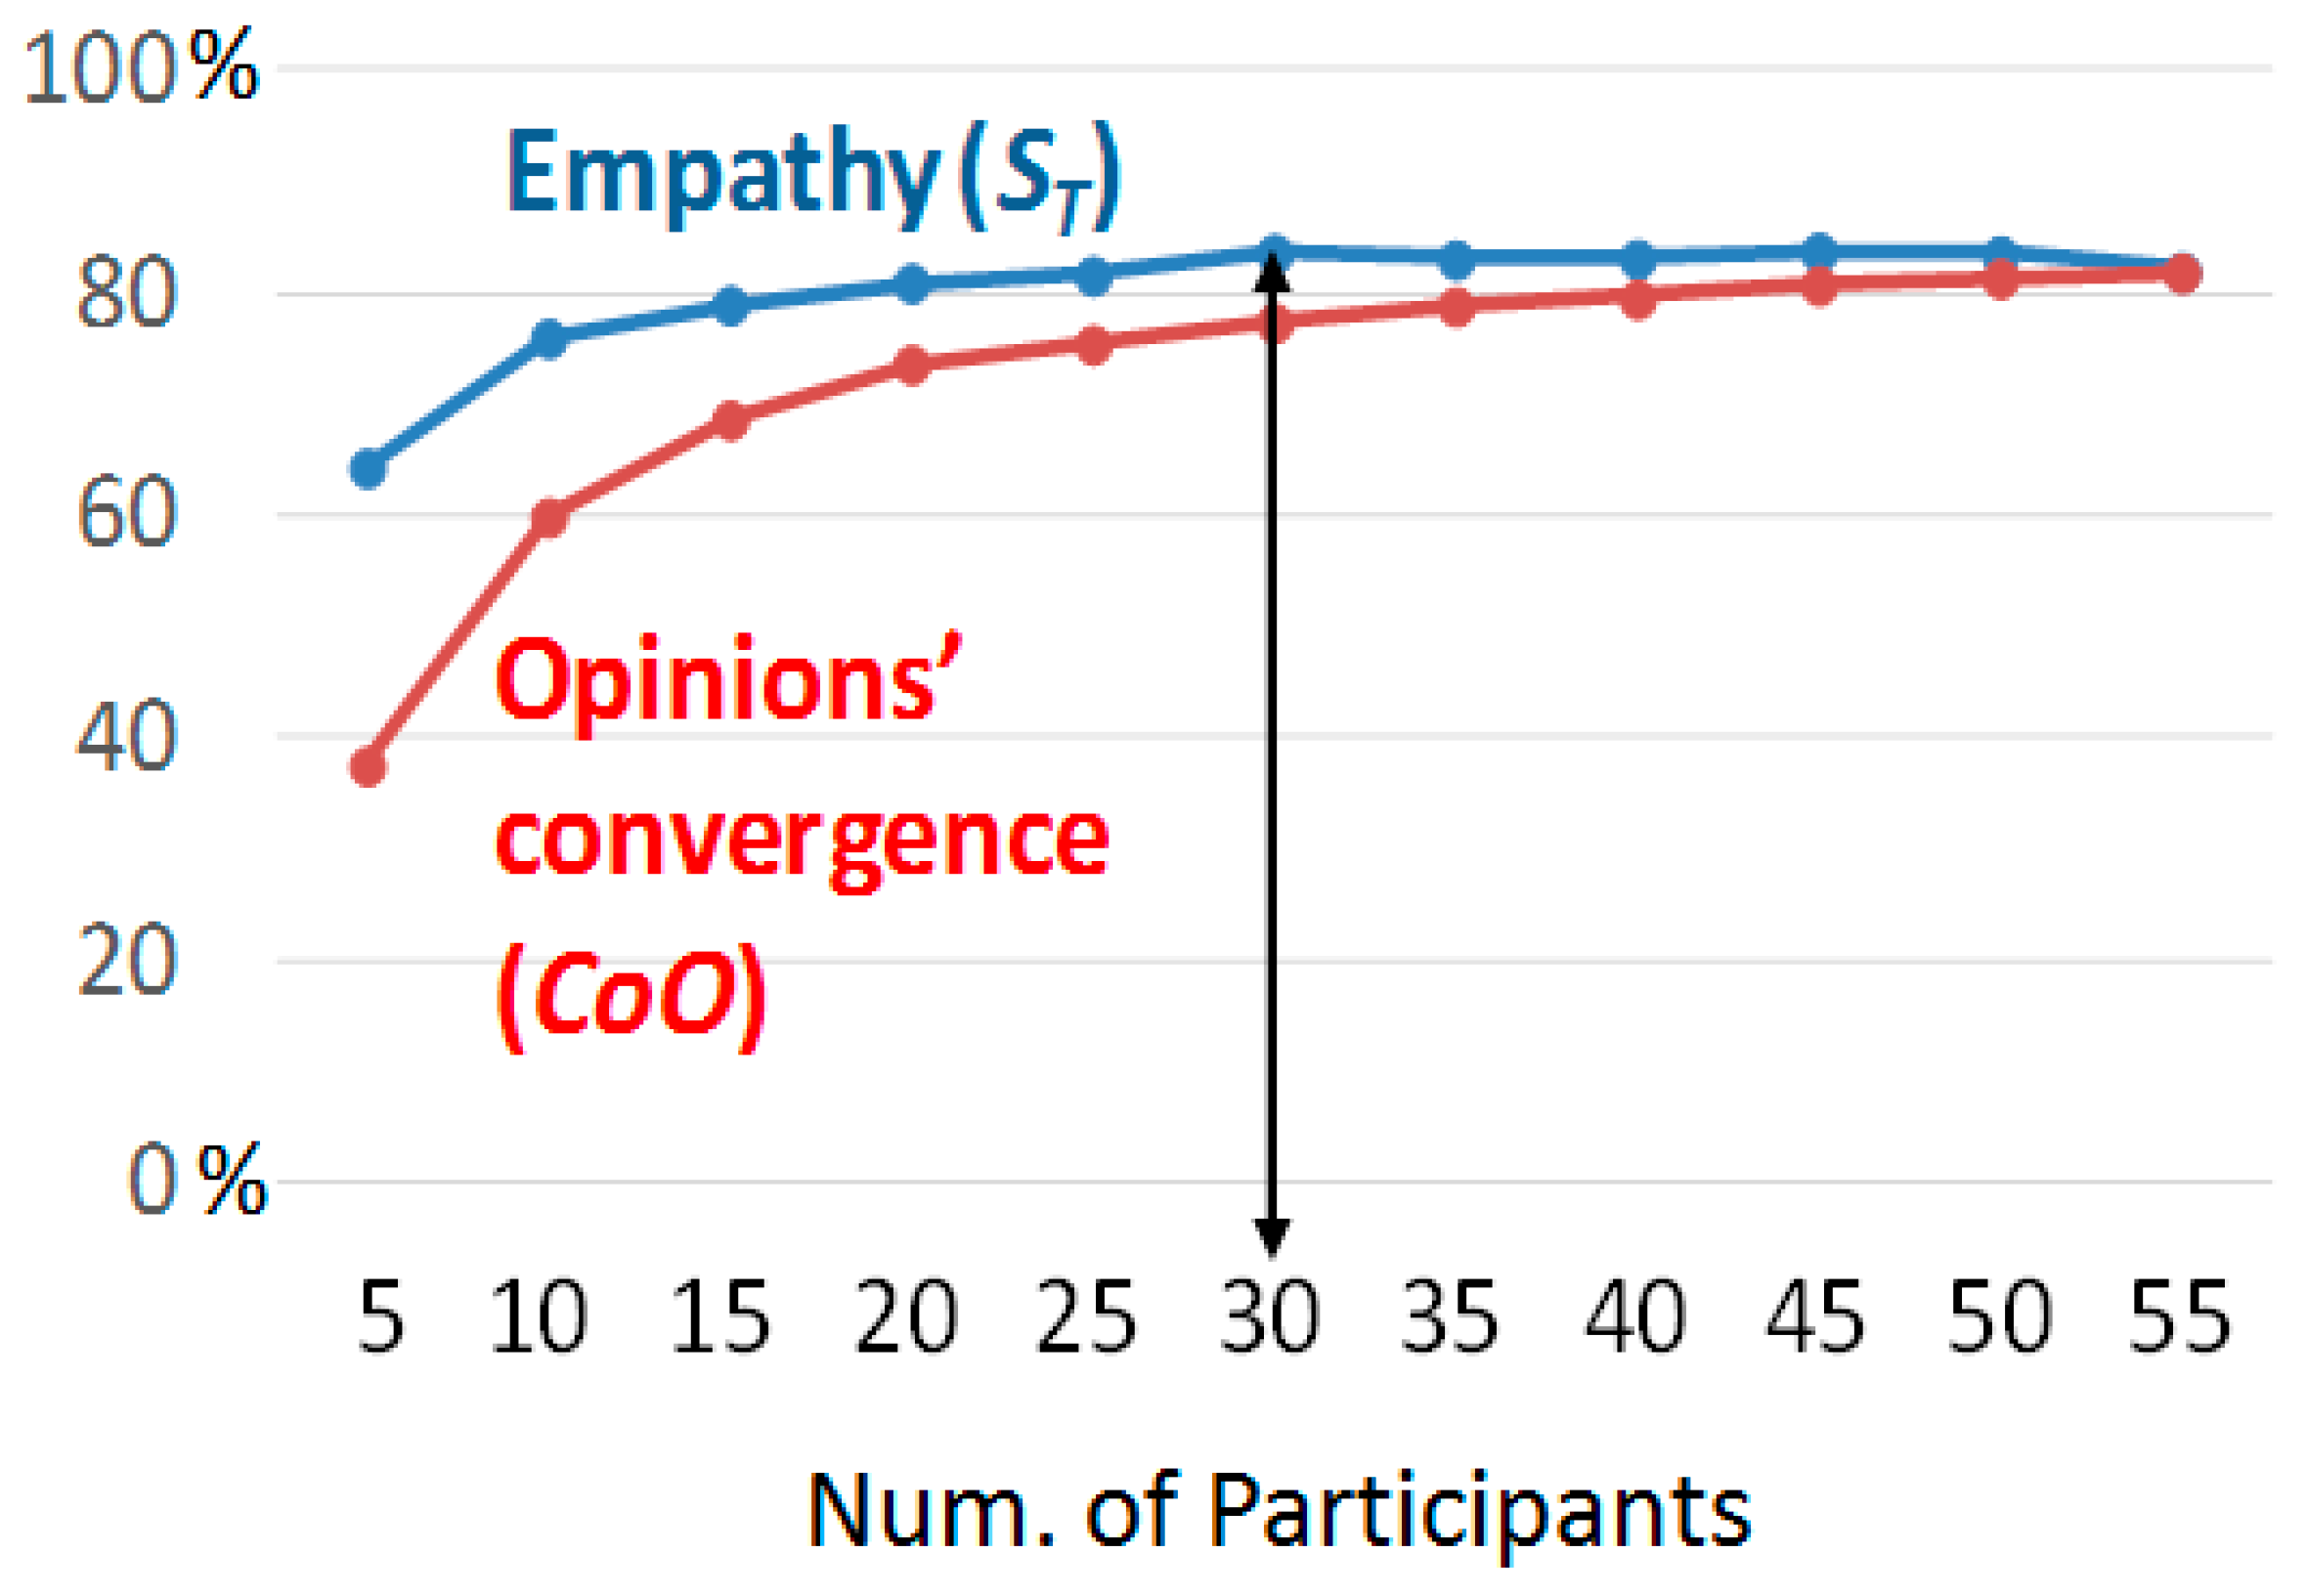
3.3.1. Convergence of Opinions by Adding New Participants

Figure 8 shows the evolution of the measures used to monitor the participative process: the overall empathy between the opinions of the group (ST, as in Equation (6)), and the convergence of opinions among the participants (CoO, as in Equation (14)).
As shown in the graph, empathy increased with participation until it reached a local maximum for thirty participants (ST(30) = 83.65%). It then shows very small changes that do not depend on the increase in the number of participants. On the other hand, the convergence of opinions grows rapidly from the group of five participants (CoO(5) = 37.59%) to the group of thirty participants (CoO(30) = 77.41%). It then continues to increase, but at a much lower rate (CoO(55) = 81.89%). The growth rate remains constant in the range between thirty and one hundred participants (for a number of participants not shown in the figure: CoO(80) = 84% and CoO(100) = 86.82%).
The association between empathy and convergence is evident: while empathy increased (up to 30 participants), convergence increased an average of 1.52% for each new participant. Subsequently, it increased at only a rate of 0.13% for each new participant.
The previous result could, on its own, validate the strategy of encouraging participation if empathy increases. However, aside from the number and quality of participants, there is another feature that plays a fundamental role in the convergence of opinions: the interactions among participants.

3.3.2. Influence of the Interactions among Participants on the Collective Solution

In participatory processes, the convergence of opinions due to the interactions among the participants would be expected to be at least as important as the convergence due to the number of well-informed participants. We validated this assertion through a computer simulation that analyzed the influence of interactions on the final decision (see Section 2.2 and Figure 2).
The mathematical simulation was used to calculate and compare the aggregate assessment of sustainability in two scenarios. The first one refers to an aggregate assessment for the participants generated based on the parameters in Table 7. The second scenario incorporates interactions through an agent-based simulation (described on Section 2.2) to explain the interactions among participants for the same participants than in the first case.
To get an aggregated assessment of sustainability without interactions, the joint value was calculated as the average of the individual sustainability for all the participants. We proceeded this way because it was the simplest method of aggregation. In general, there will be a different aggregate assessment, but this does not affect our objective: to see how interactions modify the aggregation of preferences. For this case study, ug = (0.71, 0.51, 0.58, 0.47, 0.24, 0.39).
We then applied the methodology described in Section 2.2 to trigger interactions among the members of the group of 100 participants. The simulation was parameterized as discussed below:
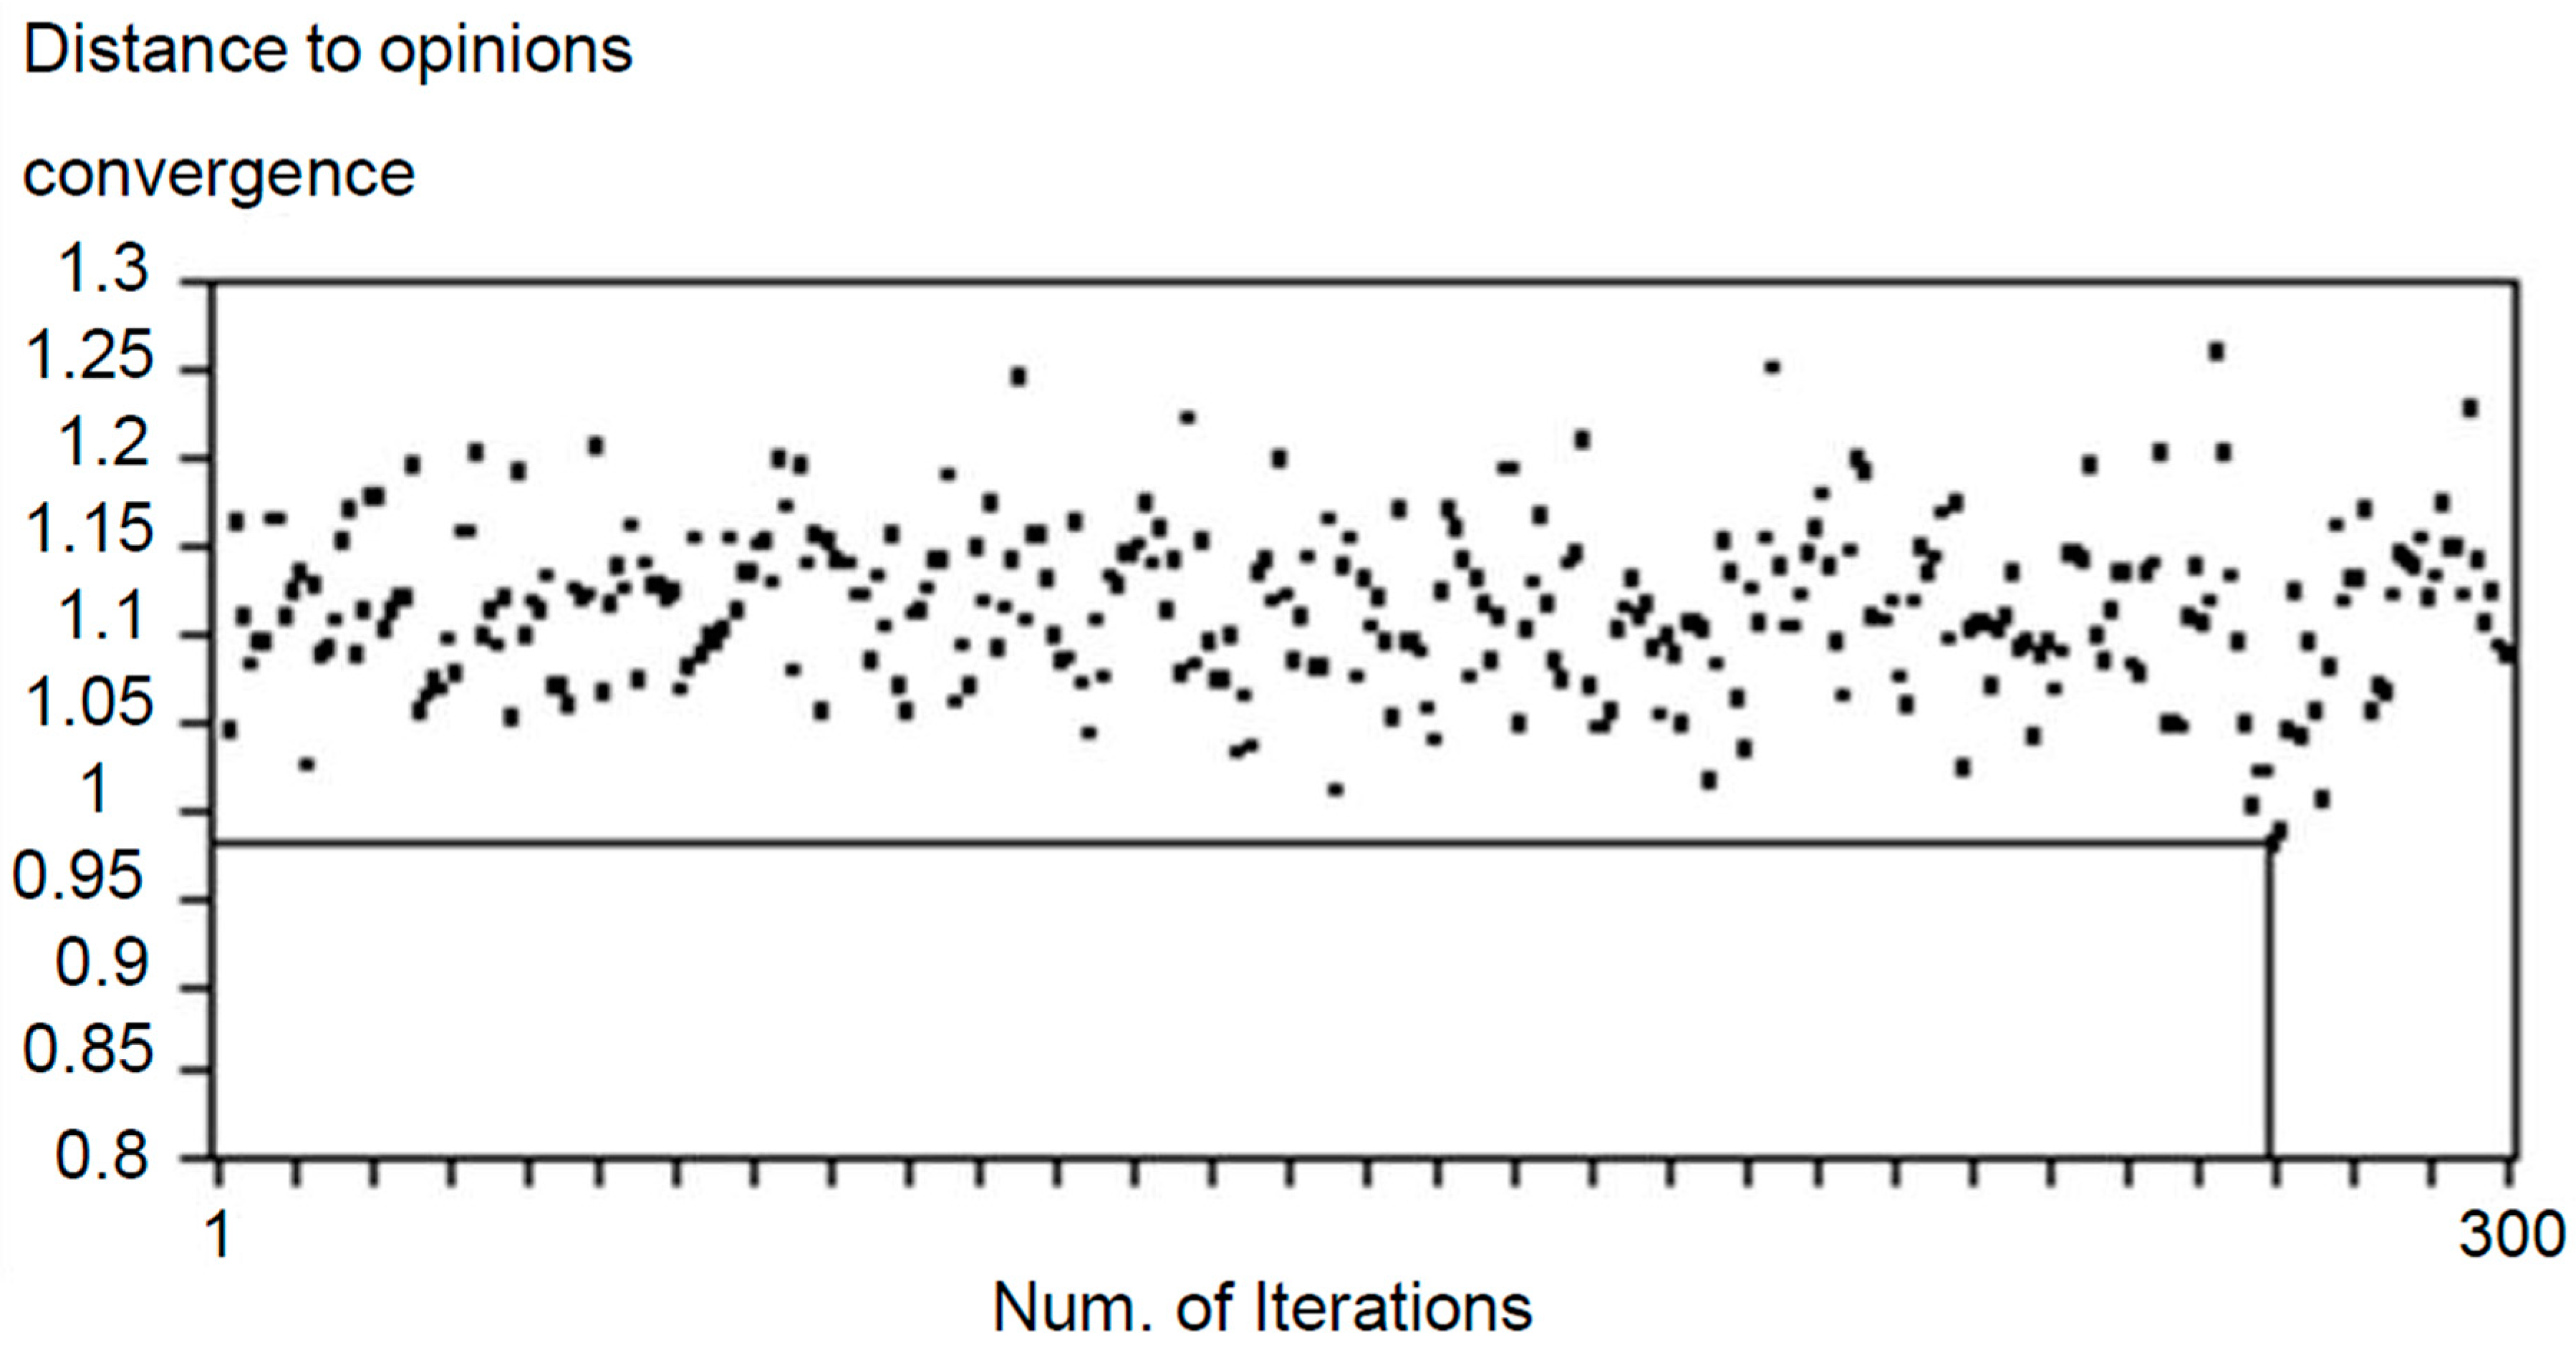
  • We were not interested in artificial acceleration of convergence of opinions. Therefore, only low-utility suggestions of changes were accepted in the random changes of opinion needed to simulate interactions. From a mathematical point of view, this meant adopting a low temperature for Equation (11) that controls the randomized changes of opinions.
  • Since we accepted random and synchronized changes of opinion (all participants change, at the same time, to solutions accepted by more than 50% of them), the convergence of this algorithm is not monotonous [63]. This means that each iteration does not have to improve the previous solution, but after a certain number of iterations (in our case we limited this to 300) there are clear improvements.
To measure the convergence for interaction among participants, we used the distance between the last group-opinion accepted by each evaluator into their memory (og(A) = (ug(A), vg(A))) and the current aggregated group-opinion (og = (ug, vg)). Both opinions change in each iteration of the process (i). We will therefore re-write them as og(A)−i and og−i respectively. So:
OpC i = 1 N A = 1 N u g ( A ) i u g i
where u g ( A ) i u g i as in equation 15; OpCi is the measure of the convergence of opinions in the i-iteration; and N is the total number of participants (N = 100).
In the simulation carried out, the maximum convergence of opinions corresponds to the iteration number 268 (see Figure 9). In this iteration, the aggregate evaluation corresponds to ug-268 = (0.81, 0.56, 0.53, 0.52, 0.24, 0.44), which represents an improvement of 12.07% with respect to the “no interaction” scenario (percentage of improvement between OpC268 and OpC1).
The reality is that there is no “no interaction” scenario with which to compare. We have simulated opinions around well-informed participants, but no opinion can be formed without interaction. That means all we have is a scenario of well-informed participants who have not interacted after formulating their opinions. On the other hand, we have a scenario with interaction after the initial formulation of preferences in which no new participants have entered. In any case, it is notable that:
Both scenarios improve convergence.
The only way we found to simulate participatory processes that do not converge is to avoid the simultaneous emergence of both factors. In other words, to incorporate ill-informed participants (with greater randomness in the opinion of the participants) and not allow post-formulation of opinions.
These outcomes reinforce the idea that participation means both things: the incorporation of a large number of participants and interaction between them.

4. Discussion and Conclusions

The paper validates an Artificial Intelligence methodology applicable to forest management. As in all AI (Artificial Intelligence) process, the algorithms must be trained in the available data, never replicated. This requires a type of manager able to understand the performance of algorithms to propose modifications when they have to apply to real cases. The paper has been written by foresters for these types of forest managers.
The first notable conclusion is that it is possible to measure confidence among participants in collective decisions. This is done through the construction of empathic utility functions.
A second conclusion deals with the association between empathy and the convergence of opinions. This relation has been commonly accepted, but this is the first time that it has been verified: the case study shows that increases in empathy are associated to greater convergence of opinions among participants, and when empathy ceases to increase, the rate of convergence of opinions slows.
The main conclusion of the paper was drawn by combining the two conclusions mentioned above: empathy variations can be incorporated to manage participatory processes, and this can be done by applying a simple strategy. The strategy is to encourage participation while empathy increases and, if not, to stop participation. When the participatory process ends, the results from the Web 2.0 and from interpersonal utilities are applied to aggregate opinions.
The strategy always leads to a solution for collective decision making. The aggregated solution will be socially acceptable in the case of high convergence of the opinions. In that case, the aggregate opinion will represent the preferences of almost all the people involved, and it will be the joint solution for the group. Otherwise, the set of participants must be broken down into homogeneous subgroups (with common opinions within each subgroup) and other aggregation procedures must be applied. These procedures may range from voting to an explained personal decision. Even in the case that the final decision was made by an official, the use of this strategy provides the information required for accountability.
It is also notable that incorporation of empathy improves the results obtained so far. When comparing the confidence-based strategy with the available participatory applications, it shows improvements in all the functional requirements required for a participative process.
Other conclusions deal with the power of networking. We confirmed that if participants report their judgments in digital systems, then the representation can be automated for both: the opinions of each participant, and the changes of empathy throughout the participative process. Automation also promotes an increase in the number of participants and facilitates interaction among them.
The influence of the number of participants is well known. Condorcet [12] was the first to relate the number of participants and the quality of the information they have with the final decision: when the components of a group are well-informed and the number of participants expands to incorporate all possible individuals, then the group will then certainly make correct decisions. The Web increases the number of people involved because access is free and it also allows “delegation” of the decisions of non-participants to participants close to them in social networks. However, the Web also increases the quality of the information, because participatory applications usually explain basic rules for forest management and for understanding natural processes. Besides, this information fits to the characteristics of a participant (for example, SILVANET, [54], provides information considering the coherence and depth of everyone’s knowledge). All of these factors increase the likelihood that a participant will be well informed, although it does not ensure that everyone to be well-informed (the likelihood of a participant making correct decisions is greater than 50%) as requires Condorcet´s theorem.
The consequences of interaction between participants are usually considered under the umbrella of self-organization (in the terminology of complex systems) [64]. Self-organization is the process by which coordination arises out of interactions between participants in collective decisions (see Section 2.2 and Section 3.3.2). A computer simulation has verified that self-organization enhances emergence (the whole—the results of the participatory process—is more than the parties—the mere aggregation of participants) in assessment of sustainability. In fact, the convergence of opinions after simulating interaction was greater than the convergence without self-organization. However, this does not seem to be the result just of the simulation carried out: self-organization has provided great advances in natural evolution, technology, and computation. Consequently, digital discussion forums should be favored to increase interactions among participants.
The confidence-based strategy also provides operative advantages, such as:
  • The homogeneous representation of opinions for all participants. This means knowing how a participant assesses a forest plan and which forest management plan is best for them.
  • The strategy is easily integrated into the most widely-used information systems. In fact, the information required is obtained from available information systems and from the preferences of each participant (which is new). Information is then processed with using the usual big-data and business analytic tools and, after applying the specific participatory algorithms described in this paper, the outcomes can be transferred to most common decision-support systems.
  • Accountability in collective decision-making.
There is another indirect advantage: the proposed strategy counteracts the excesses of new ICT developments that tend to limit universal access to information and propose decisions that are only economically efficient. Specifically, unlike the Web, which provides free and global access to results, some of the new ICT developments—such as Artificial Intelligence algorithms or Internet of Things—require large investments and their outcomes are owned by the entities that have made the investments. Most of the time, these entities are for-profit organizations that optimize only their economic returns.

Author Contributions

Conceptualization, E.M.-F.; Methodology, E.M.-F.; Project administration, E.A.-T.; Supervision, E.A.-T.; Visualization, A.G.-A.; Writing—original draft, E.M.-F.; Writing—review & editing, C.G.-G.

Funding

This research received no external funding.

Conflicts of Interest

The authors declare no conflict of interest.

References

  1. Bonabeau, E. Decisions 2.0: The power of collective intelligence. MIT Sloan Manag. Rev. 2009, 50, 45–52. [Google Scholar]
  2. Myers, D.G. Intuition, its Power and Perils, 3rd ed.; Yale University Press: New Haven, England, 2002; ISBN 9780300130270. [Google Scholar]
  3. Oztürk, M.; Tsoukiàs, A.; Vincke, P. Preference Modelling. In Multiple Criteria Decision Analysis: State of the Art Surveys; Figueira, J., Greco, S., Ehrgott, M., Eds.; Springer: New York, NY, USA, 2005; Volume 78, pp. 27–59. ISBN 978-0-387-23081-8. [Google Scholar]
  4. Debreu, G. Representation of a preference ordering by a numerical function. In Decision Processes; Thrall, R., Coombs, C.H., Davies, R., Eds.; John Wiley & Sons: Oxford, UK, 1954; pp. 159–175. Available online: https://archive.org/details/decisionprocesse033215mbp (accessed on 4 March 2018).
  5. Arrow, K. A difficulty in the concept of social welfare. J. Polit. Econ. 1959, 58, 328–346. [Google Scholar] [CrossRef]
  6. Aleskerov, F.; Bouyssou, D.; Monjardet, B. Utility Maximization, Choice and Preference, 2nd ed.; Springer: Berlin, Germany, 2007; Volume 16, p. 283. ISBN 978-3-540-34183-3. [Google Scholar]
  7. Suzumura, K. Rational Choice, Collective Decisions and Social Welfare; Cambridge University Press: New York, NY, USA, 1983; p. 278. ISBN 0521238625. [Google Scholar]
  8. Sen, A. On Ethics and Economics; Blackwell Publishing: Malden, MA, USA, 1987; p. 148. ISBN 978-0-6311-6401-2. [Google Scholar]
  9. Martín-Fernández, S.; Martínez-Falero, E.; Valentín-Gamazo, V. Optimization Methods to Identify the Best Management Plan. In Quantitative Techniques in Participatory Forest Management; Martínez-Falero, E., Martín-Fernández, S., García-Abril, A., Eds.; CRC Press: Boca Ratón, FL, USA, 2013; pp. 421–498. ISBN 9781466569249. [Google Scholar]
  10. Arrow, K. Social Choice and Individual Values, 2nd ed.; Yale University Press: Westford, MA, USA, 1963; p. 124. ISBN 0-300-01364-7. [Google Scholar]
  11. Borda, J.C. Mémoire sur les élections au scrutin. In Histoire de L’academie Royale des Sciences; Institut de France Academie des Sciences: Paris, France, 1784; pp. 657–665. [Google Scholar]
  12. Condorcet, M. Essai sur L’application de L’analyse ‘a la Probabilité des Décisius Rendues á la Pluralité des voix; Imprimerie de Du Pont: Paris, France, 1785; p. 304. [Google Scholar]
  13. Laukkanen, S.; Kangas, A.; Kangas, J. Applying voting theory in natural resource management: A case of multiple-criteria group decision support. J. Environ. Manag. 2002, 64, 127–137. [Google Scholar] [CrossRef]
  14. Vainikainen, N.; Kangas, A.; Kangas, J. Empirical study on voting power in participatory forest planning. J. Environ. Manag. 2008, 88, 173–180. [Google Scholar] [CrossRef] [PubMed]
  15. Stensholt, E. Voces populi and the art of listening. Soc. Choice Welf. 2011, 35, 291–317. [Google Scholar] [CrossRef]
  16. Edgeworth, F.J. Mathematical Psychics: An Essay on the Application of Mathematics to the Moral Sciences; C.K. Paul & Co.: London, UK, 1881; p. 168. Available online: https://archive.org/details/mathematicalpsyc00edgeuoft (accessed on 16 April 2018).
  17. Marshall, A. Principles of Economics, 8th ed.; Palgrave Macmillan: Basingstoke, UK; p. 754. ISBN 978-0-230-24929-5.
  18. Bentham, J. An Introduction to the Principles of Moral and Legislation; Payne and Son: London, UK, 1789; p. 377. Available online: http://www.koeblergerhard.de/Fontes/BenthamJeremyMoralsandLegislation1789.pdf (accessed on 16 April 2018).
  19. Sen, A.K. The possibility of social choice. Am. Econ. Rev. 1999, 89, 349–378. [Google Scholar] [CrossRef]
  20. Robbins, L. Interpersonal comparison of utility: A comment. Econ. J. 1938, 48, 635–641. [Google Scholar] [CrossRef]
  21. Ayuga-Téllez, E.; González-García, C.; Martínez-Falero, E. Multiparticipant Decision-Making. In Quantitative Techniques in Participatory Forest Management; Martínez-Falero, E., Martín-Fernández, S., García-Abril, A., Eds.; CRC Press: Boca Ratón, FL, USA, 2013; pp. 499–556. ISBN 9781466569249. [Google Scholar]
  22. Rawls, J. A Theory of Justice, rev. ed.; Belknap Press of Harvard University Press: Cambridge, MA, USA, 1999; p. 538. ISBN 0-674-00078-1. [Google Scholar]
  23. Hammond, P.J. Interpersonal Comparisons of Utility: Why and how they are and should be made. In Interpersonal Comparisons of Well-Being; Elster, J., Roemer, J.E., Eds.; Cambridge University Press: New York, NY, USA, 1991; pp. 200–254. ISBN 0-521-39274-8. [Google Scholar]
  24. Chevaleyre, Y.; Endriss, U.; Lang, J.; Maudet, N. A Short Introduction to Computational Social Choice. In SOFSEM-2007: Trends in Theory and Practice of Computer Science; van Leeuwen, J., Italiano, G.F., van der Hoek, W., Meinel, C., Sack, H., Plášil, F., Eds.; Springer: Berlin, Germany, 2007; Volume 4362, pp. 51–69. ISBN 978-3-540-69506-6. [Google Scholar]
  25. Harsanyi, J.C. Rational Behavior and Bargaining Equilibrium in Games and Social Situations; Cambridge University Press: New York, NY, USA, 1977; p. 314. ISBN 0 521 20886 6. [Google Scholar]
  26. Harsanyi, J.C. Normative validity and meaning of Von Neumann and Morgenstern utilities. Stud. Log. Found. Math. 1995, 134, 947–959. [Google Scholar] [CrossRef]
  27. Suppes, P. Some formal models of grading principles. Synthese 1966, 6, 284–306. [Google Scholar] [CrossRef]
  28. Sen, A. Collective Choice and Social Welfare, 1st ed.; Holden-Day: San Francisco, CA, USA, 1970; p. 225. ISBN 9780816277650. [Google Scholar]
  29. Arrow, K. Extended sympathy and the problem of social choice. Philosophia 1978, 7, 223–237. [Google Scholar] [CrossRef]
  30. Martínez-Falero, E.; Ayuga-Tellez, E.; Gonzalez-Garcia, C.; Grande-Ortiz, M.A.; Sánchez De Medina Garrido, A. Experts’ Analysis of the Quality and Usability of SILVANET Software for Informing Sustainable Forest Management. Sustainability 2017, 9, 1200. [Google Scholar] [CrossRef]
  31. De Sanctis, G.; Gallupe, R. A Foundation for the Study of Group Decision Support Systems. Manag. Sci. 1987, 33, 589–609. [Google Scholar] [CrossRef]
  32. Bonczek, R.H.; Holsapple, C.W.; Whinston, A.B. Foundations of Decision Support Systems; Academic Press Inc.: New York, NY, USA, 1981; pp. 3–25. ISBN 978-0-12-113050-3. [Google Scholar]
  33. Konsynski, B.R.; Kottemann, J.E.; Jay, F.; Nunamaker, J.F.; Stott, J.W. PLEXSYS-84: An Integrated Development Environment for Information Systems. J. Manag. Inf. Syst. 1984, 1, 64–104. [Google Scholar] [CrossRef]
  34. Stefik, M.; Foster, G.; Bobrow, D.G.; Kahn, K.; Lanning, S.; Suchman, L. Beyond the chalkboard: Computer support for collaboration and problem solving in meetings. Commun. ACM 1988, 30, 32–47. [Google Scholar] [CrossRef]
  35. Gallupe, R.B.; DeSanctis, G.; Dickson, G.W. The Impact of Computer Support on Group Problem Finding: An Experimental Approach. MIS Q. 1988, 12, 277–296. [Google Scholar] [CrossRef]
  36. Hale, D.P.; Haseman, W.D.; Munro, D.L. Architectural requirements for integrating group decision support systems into the daily managerial experience. In Proceedings of the Twenty-Second Annual Hawaii International Conference on System Sciences, Kailua-Kona, HI, USA, 3–6 January 1989; IEEE Xplore: Piscataway, NJ, USA; pp. 321–325. [Google Scholar]
  37. Gray, P.; Berry, N.W.; Aronofsky, J.S.; Helmer, O.; Kane, G.R.; Perkins, T.E. The SMU Decision Room Project. In Transactions of the 1st International Conference on Decision Support Systems; Young, D., Keen, P.G.W., Eds.; The Institute of Management Sciences: Providence, RI, USA, 1981; pp. 122–129. [Google Scholar]
  38. Aronson, J.E.; Aronofsky, J.S.; Gray, P. An Exploratory Experiment in Group Decision Support Systems Using the SMU Decision Room. In Proceedings of the Decision Sciences Institute, Boston, MA, USA, 1987; Decision Sciences Institute: Houston, TX, USA; pp. 428–430. [Google Scholar]
  39. Davison, R.M. A Survey of Group Support Systems: Technology and Operation. Sprouts 2008, 1, 1–12. [Google Scholar]
  40. Available online: https://www.loomio.org/about (accessed on 13 April 2018).
  41. What is Deliberative Polling®? Available online: http://cdd.stanford.edu/what-is-deliberative-polling/ (accessed on 13 April 2018).
  42. Available online: https://www.capterra.com/decision-support-software/ (accessed on 13 April 2018).
  43. Introducing Paramount Decisions. Available online: https://paramountdecisions.com/features/ (accessed on 13 April 2018).
  44. Available online: https://www.capterra.com/p/104768/Analytica/ (accessed on 13 April 2018).
  45. Available online: https://www.capterra.com/p/138255/1000Minds-Decision-Making/ (accessed on 13 April 2018).
  46. Bagdasaryan, A. Systems Theoretic Techniques for Modeling, Control and Decision Support in Complex Dynamic Systems. In Artificial Intelligence Resources in Control and Automation Engineering; González, E.J., Acosta, L., Hamilton, A.F., Eds.; Universidad de la Laguna: Canary Islands, Spain, 2012; pp. 15–72. ISBN 978-1-60805-589-0. [Google Scholar]
  47. LiquidFeedback. Available online: http://liquidfeedback.org/ (accessed on 13 April 2018).
  48. About this project. Available online: https://www.allourideas.org/about (accessed on 13 April 2018).
  49. Binmore, K. Natural Justice; Oxford University Press: New York, NY, USA, 2005; p. 224. ISBN 9780195178111. [Google Scholar]
  50. Salehi-Abari, A.; Boutilier, C. Empathetic Social Choice on Social Networks. In Proceedings of the 13th International Conference on Autonomous Agents and Multiagent Systems (AAMAS 2014), Paris, France, 5–9 May 2014; Lomuscio, A., Scerri, P., Bazzan, A., Huhns, M., Eds.; 2014; pp. 693–700, ISBN 978-1-4503-2738-1. [Google Scholar]
  51. Sayama, H.; Farrell, D.L.; Dionne, S.D. The Effects of Mental Model Formation on Group Decision Making: An Agent-Based Simulation. Complexity 2011, 16, 49–57. [Google Scholar] [CrossRef]
  52. Adler, M.D. Extended Preferences and Interpersonal Comparisons: A New Account. Econ. Philos. 2014, 30, 123–162. [Google Scholar] [CrossRef]
  53. Pascual, C.; Garcia-Abril, A.; Garcia-Montero, L.G.; Martin-Fernández, S.; Cohen, W.B. Object-based semi-automatic approach for forest structure characterization using lidar data in heterogeneous Pinus sylvestris stands. For. Ecol. Manag. 2008, 255, 3677–3685. [Google Scholar] [CrossRef]
  54. Martínez-Falero, E.; Martín-Fernández, S.; García-Abril, A. SILVANET. Participación Pública para la Gestión Forestal Sostenible; Fundación Conde del Valle de Salazar: Madrid, Spain, 2010; p. 106. ISBN 978-84-96442-36-8. [Google Scholar]
  55. Reynolds, K.M. EMDS Users Guide (Version 2.0): Knowledge Based Decision Support for Ecological Assessment; General Technical Report PNW-GTR-470; Forest Service, USDA: Washington, DC, USA, 1999; p. 63.
  56. Ayuga-Téllez, E.; Mauro-Gutiérrez, F.; Antonio García-Abril, A.; González-García, C.; Martínez-Falero, E. Comparison of estimation methods to obtain ideal distribution of forest tree height. Comput. Electron. Agric. 2014, 108, 191–199. [Google Scholar] [CrossRef]
  57. Martínez-Falero, E.; Martín-Fernández, S.; Orol, A. Assessment of Sustainability Based on Individual Preferences. In Quantitative Techniques in Participatory Forest Management; Martínez-Falero, E., Martín-Fernández, S., García-Abril, A., Eds.; CRC Press: Boca Ratón, FL, USA, 2013; pp. 499–556. ISBN 9781466569249. [Google Scholar]
  58. Martín-Fernández, S.; Martínez-Falero, E. Sustainability assessment in forest management based on individual preferences. J. Environ. Manag. 2018, 206, 482–489. [Google Scholar] [CrossRef] [PubMed]
  59. Fishburn, P.C. Interval Orders and Interval Graphs. A Study of Partially Ordered Sets; John Wiley & Sons Inc: New York, NY, USA, 1985; p. 230. [Google Scholar]
  60. Martín-Fernández, S.; García-Abril, A. Optimisation of spatial allocation of forestry activities within a forest stand. Comput. Electron. Agric. 2005, 49, 159–174. [Google Scholar] [CrossRef]
  61. Geman, S.; Geman, D. Stochastic Relaxation, Gibbs Distributions, and the Bayesian Restoration of Images. IEEE Trans. Pattern Anal. Mach. Intell. 1984, 6, 721–741. [Google Scholar] [CrossRef] [PubMed]
  62. Valbuena, R.; Hernando, A.; Manzanera, J.A.; Martínez-Falero, E.; García-Abril, A.; Mola-Yudego, B. Most similar neighbor imputation of forest attributes using metrics derived from combined airborne LIDAR and multispectral sensors. Int. J. Dig. Earth 2017. [Google Scholar] [CrossRef]
  63. Besag, J.E. On the Statistical Analysis of Dirty Pictures. J. R. Statist. Soc. Series B 1986, 48, 259–302. [Google Scholar] [CrossRef]
  64. Morçöl, G. Self-Organization in Collective Action: Elinor Ostrom’s Contributions and Complexity Theory. Complex. Gov. Netw. 2014, 1, 9–22. [Google Scholar] [CrossRef]
Figure 1. Flow chart to incorporate empathy.
Forests 09 00399 g001
Figure 2. Flow chart to simulate iterations among participants.
Forests 09 00399 g002
Figure 3. Area selected for the test case.
Forests 09 00399 g003
Figure 4. An example of pair comparison.
Forests 09 00399 g004
Figure 5. Sustainability assessment throughout the entire the Study Area for the participant who filled Table 2. Map of sustainability (for pixel of 10 m size) calculated by combining pair-wise comparison and objective criteria aggregation procedures.
Forests 09 00399 g005
Figure 6. Role of different agents in decision-making for confidence-based participation. Its output is the input of Figure 1.
Forests 09 00399 g006
Figure 7. Summary of the sustainability assessments for the participants (5 Stakeholders and the aggregated assessment) under the simulation parameters described in Table 4. Top ends of bars indicate observation means of the group. Line segments represent confidence intervals (1 − α = 95%) for the individual assessments.
Forests 09 00399 g007
Figure 8. Evolution of the overall empathy and of the convergence of opinions with the number of participants.
Forests 09 00399 g008
Figure 9. Convergence of aggregated opinion due to interactions among participants.
Forests 09 00399 g009
Table 1. Comparing available public-participation applications.
Capabilities of the Available Application of Public Participation to Manage Collective Decision-Making Type-A Systems Type-B Systems Type-C Systems Confidence-Based Strategy
See Section 1.3
General requirements To be transparent and allow rebuttal by third parties in all its decisionsYes Partially Yes Yes
Adaptive to the available information and to the knowledge that the evaluator has in the participation process.Partially Partially Partially Yes
Friendly (use is not affected by the technological, cultural or generational gap). No Yes Partially Yes
Optimizer of individual utility and socially intelligent. No No Yes Yes
To serve as an instrument for accountability to society. Yes Yes Yes Yes
Outcome requirements To provide assessments based on the representation of personal preferences. Yes No Yes Yes
Collective decision-making through aggregation of individual preferencesYes Yes Yes Yes
Design of the alternative that best fits to any system of preferences (individual or aggregated). Yes No No Yes
Capacity to solve large combinatorial problems Not available in current applications Yes
Table 2. Data entered (spatial location of comparison points (with meaningful forest management regiments) and pair comparison matrix (columns IDs are the same as rows IDs) filled by a concrete participant) and assessments of sustainability on the meaningful points (1, 2 ,..., 6).
Comparison PointsIndividual Preferences (Data Entered by a Participant) 1Preferences after Sequel and Transitive Closure [59] 2Sustainability at Compared Points
IDUTM X-coord.UTM Y-coord.123456123456Original value[0,1] Rank
1408916,54512672,53333120110114.30.86
2408776,54513172,533133310111151
3408916,54512272,532322101001130.6
4408976,54512852,53313121110104.10.82
5408936,54512252,52312311110013.90.78
6408516,54513012,51321231111003.70.74
1 Row more sustainable than column = 1; Column more sustainable than row = 2; No one preferred to another = 3. 2 Row preferred to column = 1; Column preferred to row = 0.
Table 3. Current stock, trees to be cut in the next 10 years and description of the current and of the proposed forest plan for the preferences of the participant in Table 2, for the total study area.
Stock Variables for Height Distribution
Tree Height (meters)Timber to Harvest in 10 Years (stems/ha)Trees after the Management Plan (stems/ha)Standing Trees (stems/ha)
0–330,879632,880230,142
3–6360046,40724,599
6–924581310614,741
9–1263071767508
12–1521061556774
15–1816550324869
18–216435153171
21–2426414591493
Economic Variables after the Plan (in Euros for the Entire Area of 96.04 ha)
Cut & Harvest wood COST39,549.01
Pruning & Debris elimination COST54,088.35
Gross Timber INCOME54,399.77
Bio-fuel & Public subsidies INCOME41,130.92
Sustainability (as % of the IDEAL FOREST sustainability)
Current overall sustainability value74.99
Overall sustainability after Plan86.51
Table 4. Assessments of sustainability for the group of 20 participants.
Participant-IDSustainability on the Comparison Points and for All the Territory
P-1P-2P-3P-4P-5P-6Study Area v(X)
E-10.490.410.120.070.120.420.272
E-20.890.160.370.270.070.420.363
E-30.370.070.520.570.520.320.395
E-40.420.340.870.460.4200.418
E-5100.220.50.220.590.422
E-60.590.460.970.270.070.270.438
E-7010.620.510.070.020.37
E-80.850.420.820.62000.452
E-910.620.22000.590.405
E-100.750.070.520.470.020.870.45
E-110.830.620.120.5500.740.477
E-120.450.6210.470.320.220.513
E-130.830.670.070.2500.940.46
E-140.320.220.720.670.920.220.512
E-150.920.070.720.520.770.070.512
E-160.570.070.670.520.970.020.47
E-170.540.660.970.9200.420.585
E-1810.720.320.70.320.640.617
E-190.420.0710.720.770.220.533
E-2010.870.070.80.270.640.608
Group (g)0.4140.2540.3410.3080.1830.2380.29
Expert (Ob)0.920.750.540.420.260.070.493
Table 6. Matrix of similarity of reciprocal empathy (%) between participant opinions for the group of 20 participants.
GroupE-1E-2E-3E-4E-5E-6E-7E-8E-9E-10E-11E-12E-13E-14E-15E-16E-17E-18E-19E-20
E-110083.2775.8372.9573.7972.3573.7972.3775.5771.7163.0860.8252.6763.263.4459.3556.7849.9755.6264.3
E-283.2710088.9385.3988.987.263.287.2971.8785.5762.5875.8346.965.5574.3854.1472.1566.0560.5674.46
E-375.8388.9310093.5888.1189.9754.9189.5861.3583.552.7382.436.5772.1483.1157.4275.8769.0867.6368.11
E-472.9585.3993.5810086.3491.2954.3991.3359.7182.751.685.3235.2374.4586.9557.8278.1969.4271.2867.35
E-573.7988.988.1186.3410090.756.5590.3266.3793.8359.5682.2142.4164.0979.0450.2479.5773.1962.5376.04
E-672.3587.289.9791.2990.710056.297.5563.988.957.1787.939.8466.9881.2250.8683.5474.0865.3774.18
E-773.7963.254.9154.3956.5556.210056.3679.1757.4471.4345.5768.6245.2145.4743.3344.4236.2640.1558.97
E-872.3787.2989.5891.3390.3297.5556.3610064.1588.1857.3487.3940.0367.0281.3250.9883.273.9265.2874.41
E-975.5771.8761.3559.7166.3763.979.1764.1510067.7586.4253.0974.4644.2249.7438.2953.6248.1939.8973.91
E-1071.7185.5783.582.793.8388.957.4488.1867.7510062.3581.2144.8661.0675.9447.0680.9673.1160.7378.33
E-1163.0862.5852.7351.659.5657.1771.4357.3486.4262.3510048.0980.334.1641.9426.5350.9146.5931.2974.54
E-1260.8275.8382.485.3282.2187.945.5787.3953.0981.2148.0910029.8663.6581.844.8890.6780.7964.5468.82
E-1352.6746.936.5735.2342.4139.8468.6240.0374.4644.8680.329.8610021.6325.8318.132.0627.2617.9855.26
E-1463.265.5572.1474.4564.0966.9845.2167.0244.2261.0634.1663.6521.6310077.9778.0256.0846.3986.7344.2
E-1563.4474.3883.1186.9579.0481.2245.4781.3249.7475.9441.9481.825.8377.9710060.0274.465.7479.1858.31
E-1659.3554.1457.4257.8250.2450.8643.3350.9838.2947.0626.5344.8818.178.0260.0210037.4928.3869.7531.03
E-1756.7872.1575.8778.1979.5783.5444.4283.253.6280.9650.9190.6732.0656.0874.437.4910085.0557.9772.77
E-1849.9766.0569.0869.4273.1974.0836.2673.9248.1973.1146.5980.7927.2646.3965.7428.3885.0510047.0271.44
E-1955.6260.5667.6371.2862.5365.3740.1565.2839.8960.7331.2964.5417.9886.7379.1869.7557.9747.0210042.45
E-2064.374.4668.1167.3576.0474.1858.9774.4173.9178.3374.5468.8255.2644.258.3131.0372.7771.4442.45100
Table 7. Parameters for generating sustainability of 100 participants, grouped into five stakeholder types (S1 to S5 in Figure 8) and at six meaningful points (P1 to P6 in Table 2). Sustainability assessments are simulated from sampling an N(μ; σ) distribution with the parameters shown in the table. The number of simulations carried out for each type of stakeholder is also shown.
Type of StakeholderParameters: (μ; σ)Number of Simulations
P1P2P3P4P5P6
S1(0.88; 0.2)(0.6; 0.3)(0.75; 0.4)(0.55; 0.2)(0.2; 0.3)0.25; 0.4)18
S2(0.4; 0.4)(0.92; 0.4)(0.75; 0.4)(0.54; 0.2)(0.1; 0.2)(0.2; 0.2)13
S3(0.5; 0.2)(0.2; 0.2)(0.75; 0.2)(0.6; 0.2)(0.7; 0.2)(0.3; 0.2)14
S4(0.96; 0.2)(0.5; 0.3)(0.25; 0.2)(0.33; 0.3)(0.1; 0.2)(0.72; 0.2)23
S5(0.77; 0.3)(0.69; 0.4)(0.75; 0.3)(0.5; 0.4)(0.2; 0.3)(0.4; 0.4)32

