Article

Late Spring Frost in Mediterranean Beech Forests: Extended Crown Dieback and Short-Term Effects on Moth Communities

1
Council for Agricultural Research and Economics, Research Centre for Forestry and Wood (CREA-FL), Contrada Li Rocchi, 87036 Rende (CS), Italy
2
Institute of Methodologies for Environmental Analysis - National Research Council of Italy (IMAA-CNR), c.da Santa Loja, 85050 Tito Scalo (PZ), Italy
*
Author to whom correspondence should be addressed.
Forests 2018, 9(7), 388; https://doi.org/10.3390/f9070388
Submission received: 15 May 2018 / Revised: 26 June 2018 / Accepted: 28 June 2018 / Published: 1 July 2018
(This article belongs to the Section Forest Ecology and Management)

Abstract

:
The magnitude and frequency of Extreme Weather Events (EWEs) are increasing, causing changes in species distribution. We assessed the short-term effects of a late spring frost on beech forests, using satellite images to identify damaged forests and changes in v-egetation phenology, as well as to support the analyses on associated moth communities. The EWE caused crown dieback above 1400 m of altitude, recovered only after several weeks. Nine stands for moth sampling, settled in impacted and non-impacted forests, allowed us to study changes in moth communities and in the wingspan of the most impacted species. The EWE modified community structures, reducing the abundance of beech-feeder species, but leaving species richness unaltered. Operophtera fagata and Epirrita christyi, dominant before the EWE, lost 93% and 89% of their population, respectively. We found a general increase in the average wingspan for these species, caused by the loss of small specimens in most impacted forests, suggesting a re-colonization from non-impacted forests. According to our results, populations of some species could be more resilient than others after an EWE due to their different dispersal ability. Forest ecosystems appear to be dynamic entities able to cope with extreme weather events but, likely, only if they continue to occur in the future at the current rate.

1. Introduction

The relative importance of climate warming as a major driver of biodiversity and ecosystem changes is expected to increase in the future [1]. The rate of change will likely exceed the ability of many species to adapt, amplifying the risk of cascading effects through ecosystem interactions. Warming is already changing the seasons in temperate zones, favoring milder winters and unpredictable Extreme Weather Events (EWEs) [2,3,4,5,6]. Over the past few decades, EWEs have caused serious economic/environmental damages [7], notably affecting ecosystems [8] and magnifying the negative impact of gradual warming on biodiversity [9,10,11]. The most tangible evidence of these climatic events is the alteration of species ranges due to extinctions and colonization processes, changing the structure of entire ecosystems [12,13]. The long-term consequences of climatic events appear to be detrimental, especially to declining populations living at the edge of the species range, by shifting their distribution and/or their phenology [14,15,16,17,18].
Mountain ecosystems are known to be highly sensitive to global warming as many biological processes are strictly climate-dependent [19,20]. In particular, forest habitats are vulnerable to abrupt EWEs due to the slow adaptation of trees to sudden environmental changes [21,22,23]. Occasional late spring frosts are one of the most serious threats to mountain forests as they are even more frequently preceded by mild winters, causing a strong reduction of the photosynthetic period due to the death of blooms and fresh foliage [24,25]. This was reported in several studies concerning beech forests [26,27,28,29,30], the broadleaved forest type distributed at the highest elevations in southern Europe.
The European distribution of the common beech Fagus sylvatica L. extends from southern England and southern Sweden, where it is a lowland tree, to the Apennines of central-southern Italy, where it is confined to mountainous regions occupying an altitudinal belt between 900 and 1900 m above sea level [27,31,32,33]. Mediterranean beech forests are particularly precious as they are ecologically and biogeographically older than in the rest of Europe [34], home to species of conservation concern and biogeographic interest [34,35,36]. Then, the effects of heavy/frequent EWEs on the fauna associated with Mediterranean beech forests can be detrimental to the biodiversity on a continental scale; however, impacts of late frost events on beech ecosystems have only rarely been reported for southern Europe [25].
Among other taxa, Lepidoptera are critical to the functioning of forest ecosystems as they represent a relevant portion of biomass, playing several ecological roles as selective herbivores, pollinators, and prey [37]. Extreme cold events could impact the structure and compositions of Lepidoptera forest communities at different spatial scales [38], as well as affect life cycles of single species causing direct or indirect mortality in young hectothermic larvae [39,40,41]. Direct mortality can occur when larvae are exposed to unusual extreme cold during early stages [40,42]. Indirect mortality is mainly due to the increase of antagonists after an EWE [43,44,45] and/or to starvation caused by the loss of trophic resources [13].
Nowadays, assessing climate- and weather-driven natural hazards by improving proximal and remote observational tools and by integrating data on different ecosystem components is a primary challenge. Differently from drought and heatwaves, which can be predicted some weeks or months before the events, frosts are largely unpredictable in time and in space. Their effects on biodiversity are therefore studied by analyzing weather datasets and population measures of a given taxon several years after the occurrence of EWEs [46,47,48,49], losing the possibility to investigate direct causal effects and short-term responses of affected biota.
A multi-year study of forest moth diversity began in the spring of 2015 in different areas of Calabria, southern Italy (see [50]). One of the investigated areas was Pollino National Park, which was affected by an extraordinary late frost that occurred during spring 2016. The effects of this EWE extended to the entire Apennine beech forest, from Tuscany to Calabria, and caused extensive crown dieback, favored by a mild winter which promoted early bud flushing [25]. The availability of data describing moth communities before the EWE, and the access to satellite image sequences capturing the beech forest response to the EWE, allowed us to carry out pre- and post-event comparative analyses in order to search for casual effects of the EWE on moth communities. In detail, we analyzed moth diversity and abundance, focusing our attention on species trophically dependent on beech trees, especially on those having young larvae feeding in springtime on the buds and immature leaves of beeches. We carried out ad hoc elaborations of multi-temporal satellite data to delimit the impacted forests, so as to link changes in moth communities to the crown dieback and therefore to the EWE.

2. Materials and Methods

2.1. Study Area and the 2016 Spring EWE

The study area is entirely within Pollino National Park, an interregional park spread over the Calabria and Basilicata regions, Italy (Figure 1). The Pollino Massif is the highest mountainous area in the southern Apennines (2267 m). Forests cover 86,326 hectares, of which 39.6% are beech. There are two main types of beech forests, according to the altitudinal range along which Fagus sylvatica extends: one is more thermophilous (Aquifolium-fagetum), up to 1500–1600 m a.s.l., and one is more mesophilous (Asyneumati-fagetum), up to the highest elevations [51].
In this area, very high temperatures occurred in the winter of 2015/2016, with a peak in February 2016 (http://www.aer.com/winter2016). The positive trend observed in the Campotenese meteorological station, the nearest to the study area, continued until the temperature dropped abruptly on 26 April 2016 (Figure 2). The differences with 2015 and with the average estimated from 2002 to 2015 in the same meteorological station show the particular spring of 2016 to be warmer than usual in the first part and colder than usual after the EWE, despite the fact that the mean values estimated for the total period are comparable (~8.5 °C). As temperature values usually decrease with elevation (about −6 °C/1000 m, e.g., [52]), the severity of cold spells increases accordingly and the most damage is expected in the elevation range where the greening season of the forest was already under way on the frost date. Temperature is not sufficient to determine the impacted areas; however, the evolution of the temperature over time (Figure 2), which regulated the forest phenology [53] during 2016, provided a guide for selecting the best periods to follow significant greening stages, to detect the adverse effects of the EWE on crowns, and to evaluate the recovery from frost. The first image was selected early in spring when the temperature values started to become higher than the 2002–2015 averages; the second was selected in the period after the EWE when these values became lower than the 2002–2015 averages; and, finally, the last one was selected when temperatures attained the average historical values.

2.2. Satellite Images and Supplementary Data

We used satellite images from two different sensors to characterize the phenology of the Pollino beech forest and to assess damage and potential recovery:
- MODIS (Moderate Resolution Imaging Spectroradiometer) satellite time series were used to compare the greening season between 2015 and 2016. The MOD13Q1 NDVI (Normalized Difference Vegetation Index), available as a 16-day composite with 250-m spatial resolution (from the National Aeronautics and Space Administration Land Processes Distributed Active Archive Center, see https://earthexplorer.usgs.gov/), proved to be suitable for investigating ecological impacts of extreme events at regional scales [54].
- The most recent Sentinel-2 data (launch 23 June 2015), with a higher spatial resolution (10 m), were suitable to carry out studies at the local scale. Three satellite images (Level-1C reflectance) were acquired (from the European Space Acency Scientific Data Hub) in different periods: before the EWE (20 April 2016), approximately one month later (23 May 2016), and two months later (29 June 2016). These images were selected on the basis of the low percentage of cloud cover in the investigated areas (completely free of clouds in the sampled sites).
To identify beech forests and differentiate elevation levels, we downloaded the 2012 Corine Land Cover map (CLC-IV level) and a Digital Elevation Model (DEM) with 20 m × 20 m grid cells from the Italian National Institute for Environmental Protection and Research (ISPRA) (http://www.sinanet.isprambiente.it/it/sia-ispra/download-mais/).

2.3. Methods Devised to Identify Forest Areas Impacted by the EWE

Our study was fundamentally based on the analysis of the NDVI, which is a proxy for photosynthetic activity [55], known to be valuable at different spatial scales for the investigated Mediterranean mountainous ecosystems [56,57,58]. This index is calculated according to the following formula:
NDVI = ( ρ N I R ρ R E D ) ( ρ N I R + ρ R E D )
where ρNIR and ρRED are the reflectances at the near-infrared and red wavelengths (respectively bands 8 and 4 in the case of Sentinel-2; available as MOD13Q1 product for MODIS).
To synthesize the shock-recovery process, we investigated the normalized differences between Sentinel-2 NDVI maps by calculating the ΔNDVI as follows:
NDVI i = NDVI fin NDVI in NDVI in
where fin = 29 June 2016 and in = 23 May 2016 for i = 1; fin = 29 June 2016 and in = 20 April 2016 for i = 2; fin = 23 May 2016 and in = 20 April 2016 for i = 3.
An RGB composition was obtained using ΔNDVI1, ΔNDVI2, and ΔNDVI3 as the intensity of red (R), green (G), and blue (B), respectively. This composition enabled the synthesis of the shock-recovery process observed on three dates in a single image and the identification of areas with different behaviors.
Finally, class 3115 (forest with a prevalence of beech) was selected from the CLC map to identify beech forests, and contour lines with a step of 100 m were extracted from the DEM of the area.

2.4. Moth Sampling and Dataset Organization

The sampling stands for the monitoring of moth communities were located between 990 and 1475 m a.s.l. and covered a large area of the altitudinal belt of the Pollino (PO) thermophilous beech forests. We selected nine stands grouped into three different elevation classes: low (PO_A1-2-3, 990–1035 m), medium (PO_B1-2-3, 1310–1370 m), and high (PO_C1-2-3, 1460–1475 m) elevation (Figure 1). For each elevation class, the three stands correspond to different successional stages of the beech forest: mature and unevenly aged beech (stand 1); young beech forests/mature coppices converted to high forests (stand 2); and clearings and pastures surrounded by a forest matrix (stand 3).
Moths were sampled in each stand from May to November using one Ultra Violet Light Emitting Diode (UV-LED) light trap powered by a portable battery (45 Ah, 12 V) (for further details, see Reference [59]). Since moth sampling can vary significantly from one night to the next depending on abiotic factors (e.g., temperature, wind speed, moon phase, rainfall), we turned on the traps in all the stands simultaneously one night per month.
The sampling stands analyzed in this work represent a subset of a larger network originally designed for monitoring moth communities in the whole Calabria region. Before the EWE, within the Pollino sub-area, the experiment was designed to investigate the moth community composition of selected stands during the first year, replicating the stands at the highest altitude (PO_C1-2-3) in the following year. After the EWE occurrence, we hypothesized that the species with overwintering eggs and larvae feeding on beech leaves during springtime were the most impacted. In order to test our hypothesis, we integrated the original design with additional ad hoc samplings during the autumn (September–November), including all the stands sampled before the EWE. For such ad hoc samplings, we turned on the traps when meteorological conditions were optimal for moth activity to avoid an underestimation of species abundances due to unfavorable collecting nights. Then, we selected for community comparisons the most abundant sampling night per month, separated at least by three weeks.
From the collected samples, three datasets were organized (see Supplementary Material, Datasets):
-
Dataset 1 contained samples from the three stands of PO_C site collected from May to November 2015 and 2016; in total, we used 42 samples to compare species richness and abundance before and after the EWE at high elevation.
-
Dataset 2 contained samples from all of the stands of PO_A, PO_B, and PO_C sites collected from September to November 2015 and 2016; in total, we used 54 samples to search for changes in community structures and in abundance patterns of individual species.
-
Dataset 3 contained wing measurements of all the specimens belonging to the two dominant species collected during all sampling sessions.

2.5. Methods to Evaluate the EWE Impact on Moth Communities

The collected specimens were identified using specialized literature [60,61,62,63,64,65,66,67,68,69] and stored in the collection of the Council for Agricultural Research and Economics, Research Centre for Forestry and Wood (CREA-FL), Rende, Cosenza, Italy.
The three datasets obtained from the two-year field campaigns were analyzed separately, focusing on the differences which can reveal EWE effects.
Dataset 1 was used to focus on the changes that occurred at the highest elevation (PO_C stands). We compared the number of individuals (N) and species (S) before and after the EWE, as a whole and partitioned into two guilds: beech feeders (BFs), which included species whose larvae can feed on beeches; and non-beech feeders (n-BFs), which included species whose larvae have other host plants. To depict the changes in abundance and richness of the entire communities and of the feeding guilds, we built individual-based rarefaction curves, including standard deviations. We tested differences in relative abundances of feeding guilds before and after the EWE using the non-parametric Kruskal-Wallis test of medians, focusing the analyses on the 10 most abundant species for each guild in 2015 and 2016.
Dataset 2 was used to evaluate the changes in community structures by performing a cluster analysis based on a paired group algorithm and adopting presence/absence-based (Dice) and abundance-based (Bray-Curtis) indices as similarity measures.
Dataset 3 was used to compare wingspans changes between 2015 and 2016 of the most abundant species. To provide a proxy of wingspan, we measured the distance between the insertion point of the forewing and its apex, analyzing males and females separately. The dataset was subjected to a t-test with a 95% confidence interval to compare measures obtained before and after the EWE in the same site.
Diversity and abundance values were compared using raw data (number of species and number of individuals) as the same sampling effort was carried out during the same collecting nights. All statistical analyses were performed using the free software Past, version 3.08 [70].

3. Results

3.1. The Impact of EWE on Beech Forests

The analysis of the MODIS time series at 250 m was useful to evaluate the large scale phenology response of the forest to the EWE. The greening season of the whole beech forest during 2016 significantly differed from 2015 (Figure 3).
During 2015 the photosynthetic activity was accelerated between the first half of April and the first half of May and showed a more gradual trend until June. Conversely, in 2016, we observed a rapid increase in late March–early April followed by a growth break and a final restart in the first few days of June. Due to the high temperature values recorded in the first period, the greening season onset was about half a month earlier compared to 2015, making the EWE impact on beech trees more severe for the presence of fresh foliage.
A more detailed local scale analysis, based on Sentinel-2 data at 10 m, was performed to discriminate areas differently affected by the EWE. The sequence of the selected 2016 NDVI images allowed us to display the evolution of the vegetation activity in the area (Figure 4a). In the NDVI map before the EWE (Figure 4a, 20 April 2016), only beeches at a very high altitude were still dormant (bluish areas), while the remaining forest showed a good level of vegetation activity (reddish areas). In the images acquired approximately one month after the EWE (Figure 4a, 23 May 2016), a large portion of beech forest showed a decrease in NDVI, which returned to high values two months after the EWE (Figure 4a, 29 June 2016). These changes in NDVI values were synthesized in an RGB composition, which allowed us to separate areas impacted by the EWE from areas that were not affected (Figure 4b). The NDVI values of low elevation beech forests (grey-blue) increased in the EWE period as the frost here was not particularly severe. The beech forests at highest altitudes (green-yellow) approached greenness in June and did not suffer significant negative effects. Only the areas located at intermediate altitudes (orange), characterized by a decrease in NDVI values from April to May and by an increase from May to June, were negatively impacted by the EWE.
According to the RGB composition (Figure 4b), the severely impacted area was delimited by two elevation boundaries (1400 m and 1600 m). By overlapping this area and the three single-date NDVI maps (Figure 4a), we can define an NDVI threshold (0.60) which can be associated with the vegetation activity level characterizing the forest in an advanced greening phase. On 20 April 2016, the NDVI values were greater than 0.60 up to 1600 m, whereas above this elevation lower NDVI values were estimated. This upper boundary, therefore, identifies the forest which was already greening on the EWE date. On 23 May 2016, the 0.60 NDVI threshold moved from 1600 m down to 1400 m, thereby indicating that below 1400 m the severity of the cold spell was not sufficient to damage the forest. Finally, on 29 June 2016, the NDVI values exceeded the 0.60 threshold for the entire area, showing that the recovery was completed.
It is worth noting that the impacted area is not fragmented and elevation is therefore the basic parameter to delimit the areas affected by the EWE.

3.2. The Impact of EWE on Moth Communities

On the basis of satellite analyses, the moth sampling stands most impacted by EWE corresponded to PO_C1-2-3. Also, PO_B2 presented marginal effects, probably due to a partial loss of crown foliage at the border of the impacted area.

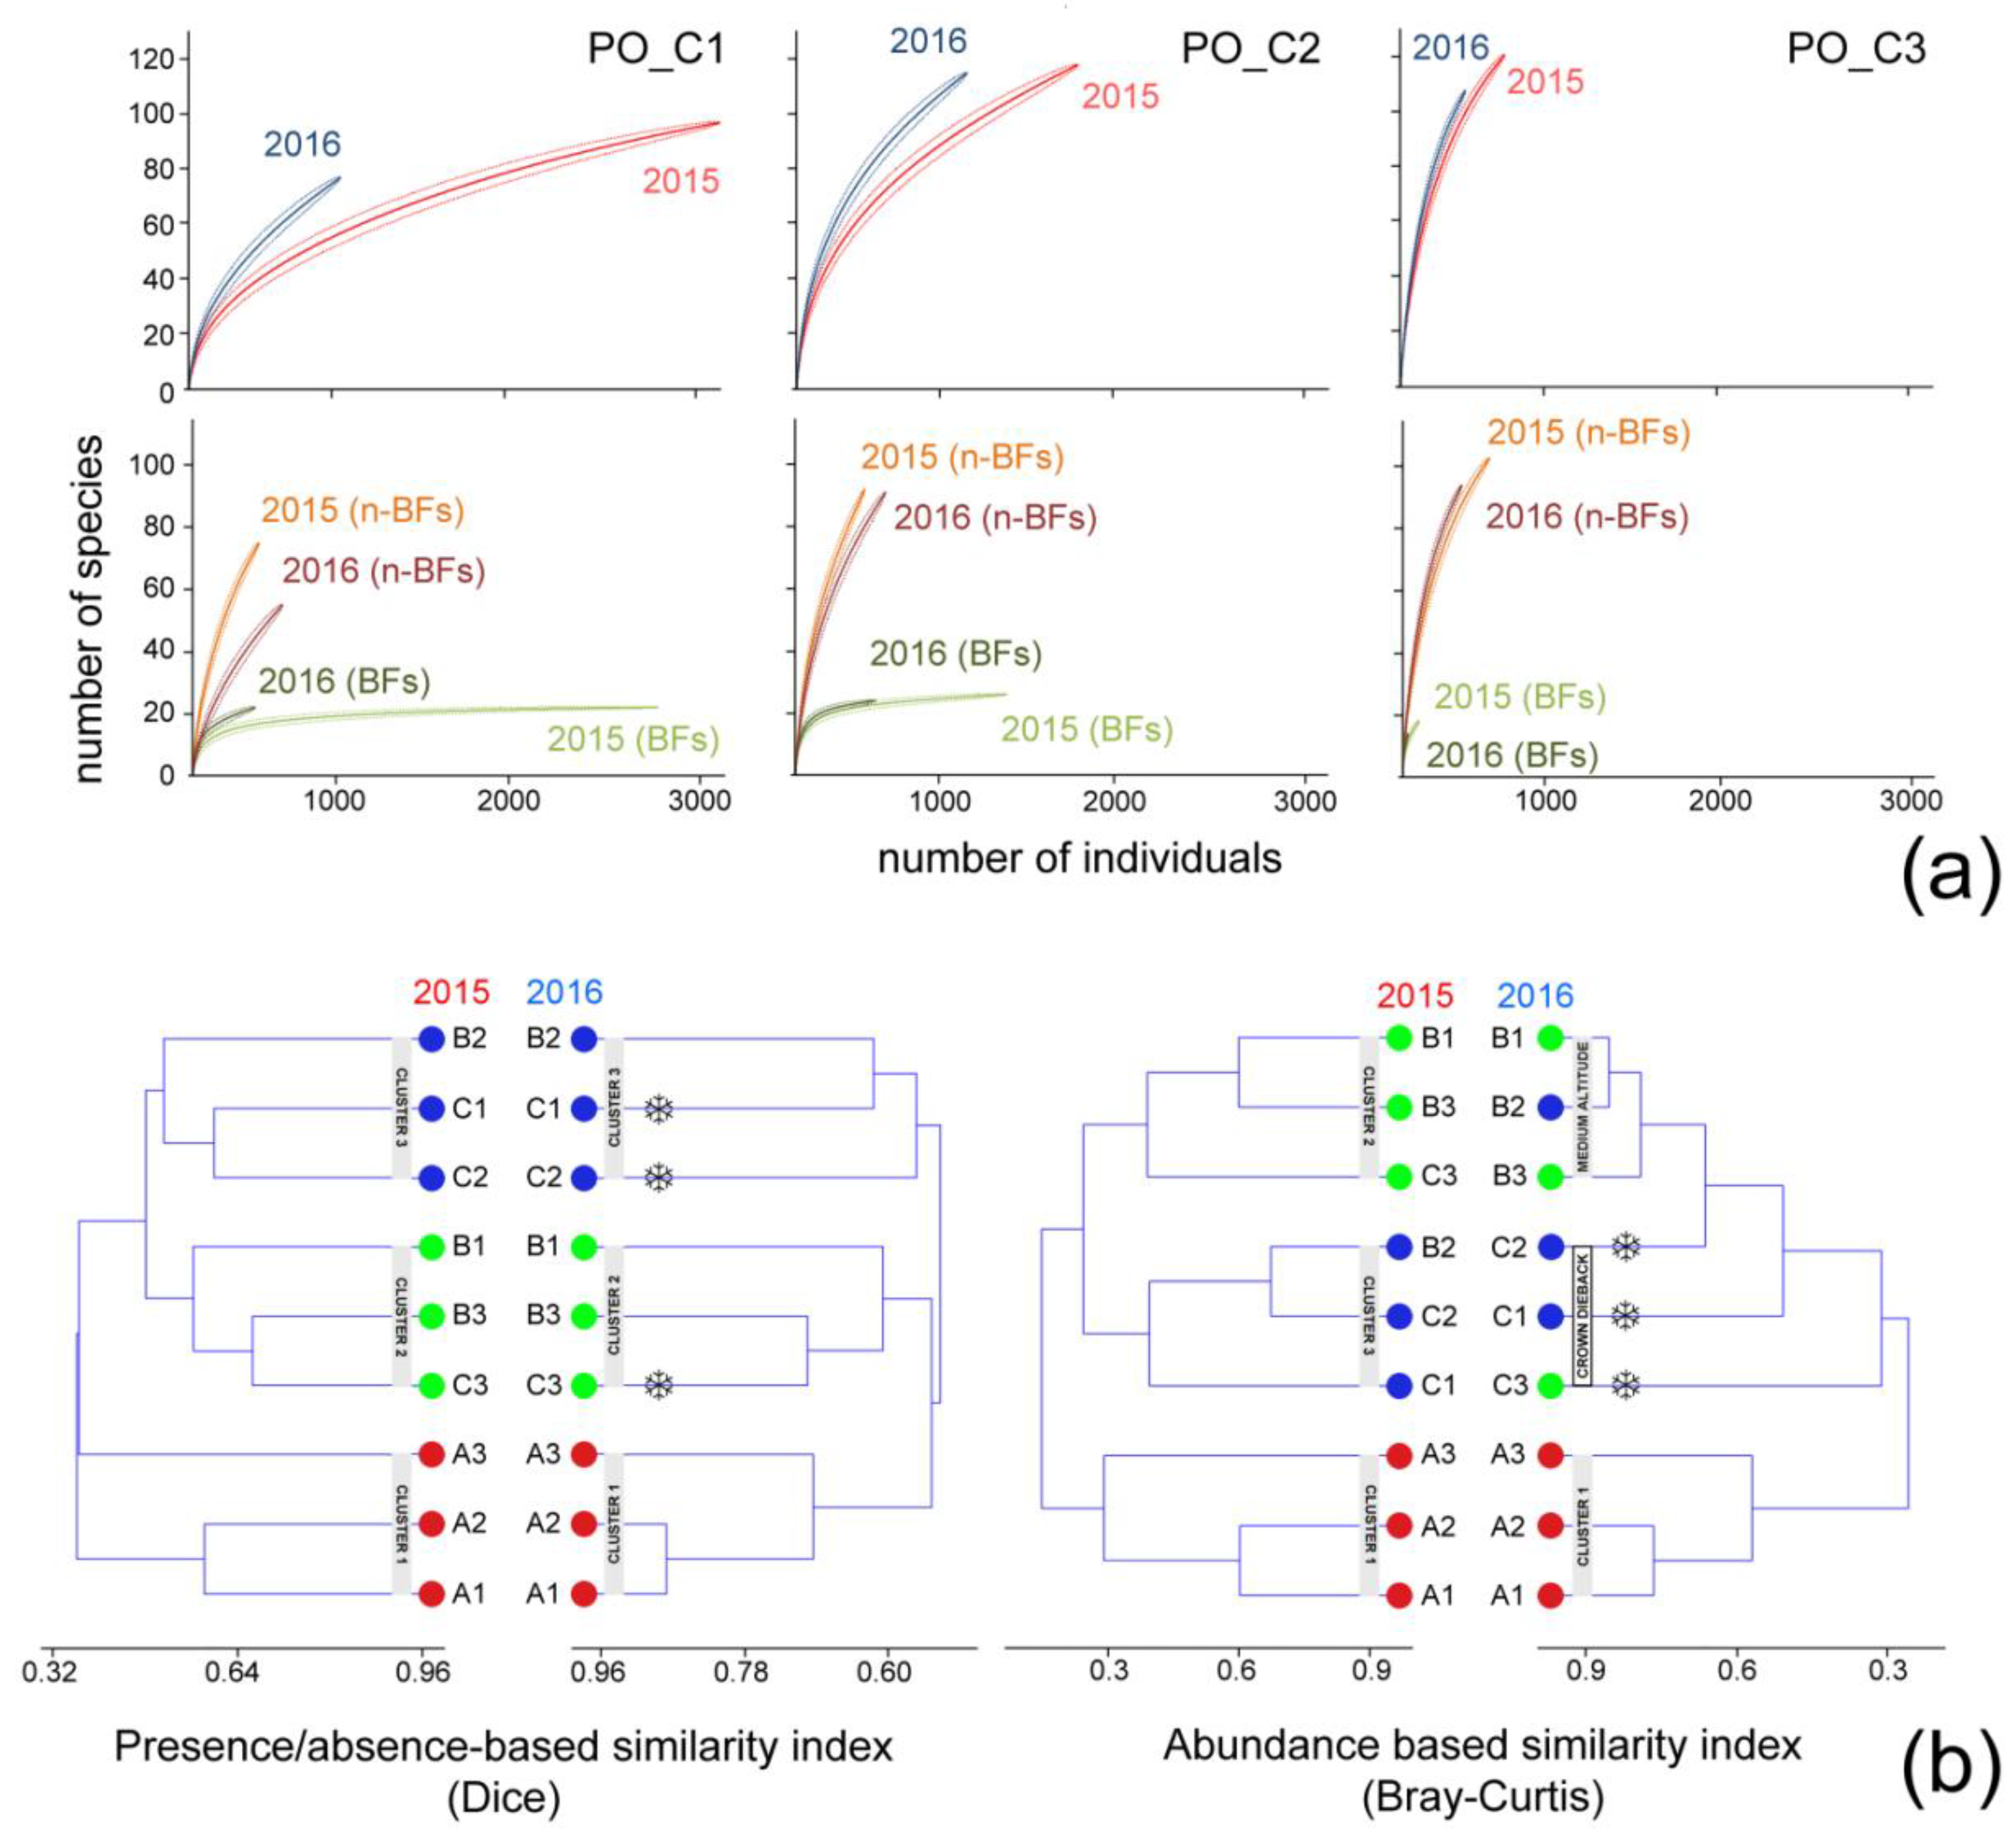
3.2.1. Diversity and Abundance before and after the EWE

We analyzed the most impacted stand communities, composed of 8557 individuals and 249 species (Dataset 1), by rarefaction curves which showed a very similar trend between years in the sampled open habitat (PO_C3) only. In contrast, rarefaction curves of the forest stands (PO_C1 and PO_C2) showed evident differences, mainly due to the decrease of individuals, whilst species richness was quite stable (Figure 5a). We found that the abundance of n-BFs slightly changed between years in all stands, whilst the abundance of BFs strongly decreased in forest PO_C1 and PO_C2 stands during 2016. On the other hand, species richness was quite stable, showing only a substantial decrease of n-BFs in PO_C1 (Figure 5a).
The 10 most abundant species of BFs and n-BFs represented 70.8% and the 13.1% of PO_C communities during 2015, respectively. BFs decreased to the 33.6% and n-BFs increased to the 42.0% after the EWE. Nevertheless, this resulted in a non-significant change of the median of relative abundances of BFs between years (Kruskal-Wallis test: BFs_2015 = 0.025, BFs_2016 = 0.022, p = 0.88), with the strong reduction being attributable to only a few species. The median of relative abundances of n-BFs showed an increase just below the threshold of significance (Kruskal-Wallis test: n-BFs_2015 = 0.010, n-BFs_2016 = 0.019, p = 0.059). On the other hand, we found a significant difference between BF and n-BF medians only during 2015 (p = 0.013), as they were not significantly different during 2016 (p = 0.60), showing an increased relative importance of n-BFs within moth communities after the EWE.
At the species level, the BFs Operophtera fagata Scharfenberg and Epirrita christyi Allen, both in flight in autumn, were the most abundant species before the EWE, with 2260 and 654 specimens, respectively. These species suffered a strong decrease after the EWE, with an abundance loss of 93% in the former and 89% in the latter. This decrease was registered in PO_C1 and C2 stands. Also, the abundance of other BF species, such as Campaea margaritaria Linnaeus, strongly decreased (−81%). Differently, the n-BFs Eilema lurideola Zincken and Lithosia quadra Linnaeus, both with lichenophagous larvae, showed a marked increase in abundance (an increase of two and 12 times, respectively).

3.2.2. Consistency of Autumn Moth Communities between Impacted and Non-Impacted Sites

Cluster analyses (CA) performed on the autumn communities sampled before and after the spring EWE were based on a dataset composed of 6177 individuals and 112 species (Dataset 2). The CA, based on presence/absence data (Dice similarity index), produced identical clusters in both years. We identified one group which included low-elevation stands (cluster 1), one which included open habitats and one perturbed forest stand (cluster 2), and one which included unperturbed beech forests (cluster 3) (Figure 5b). According to the presence/absence data, the EWE-impacted stands preserved their identity over the study years. However, the CA based on abundance data (Bray-Curtis similarity index) produced a different clustering between years. Before the EWE, the abundance data produced clusters identical to those of the presence/absence data, whereas in the autumn following the EWE, we observed a more confusing ordination, with only the first cluster remaining unmodified. Medium elevation stands, which were near but outside the most impacted beech forests, were grouped together, whereas stands that experienced crown dieback did not produce a cluster and showed a loss of defined community structure.
The overall abundance of autumn communities strongly decreased in PO_C and PO_B stands, remaining stable in PO_A stands, as similarly observed for BFs (Table 1). On the other hand, n-BFs showed a general increase in all sites, but more evidently in PO_B and PO_C stands. As observed in the previous paragraph, the abundances of O. fagata and E. christyi showed a significant decrease in PO_C1+2+3. The abundance of O. fagata was substantially stable in PO_B1+2+3 and PO_A1+2+3, whilst E. christyi showed a significant decrease in PO_B1+2+3 and a significant increase in PO_A1+2+3 (Table 1). The strong decrease of both species at a high altitude supported the hypothesis of causal detrimental effects of the EWE in the most impacted forest area.

3.2.3. Changes in the Wing Measurements of Epirrita christyi and Operophtera fagata

We measured nearly all of the specimens collected in 2016, whilst we measured only the stored specimens from 2015 as the EWE was unexpected. Few reference specimens were spread, whereas others were stored in paper envelopes. Measurements obtained from males and females of E. christyi were analyzed separately; however, this was not applicable to O. fagata as the brachypterous females did not enter the light traps. The dataset for O. fagata included a total of 1383 measurements, with 878 for 2015 and 505 for 2016. We measured a total of 1,223 specimens of E. christyi, including 504 males (350 for 2015 and 154 for 2016) and 719 females (588 for 2015 and 131 for 2016) (Dataset 3).
After the EWE, the O. fagata wings were significantly larger in the forest portion affected by crown dieback, whereas their dimensions were unvaried in the forest portion unaffected by foliage death (Figure 6). This pattern was mainly determined by the loss of small specimens, whereas large specimens were similarly represented before and after the EWE. Epirrita christyi showed a significant increase in wing dimension in all surveyed sites, regardless of elevation. Nevertheless, a loss of small specimens was observed after the EWE only in sites which experienced an evident decrease in abundance. The species pattern was determined by females, whereas males significantly increased only at a low elevation (Figure 6).

4. Discussion

We used meteorological and remote sensing data to study the effects of a frost event on the Pollino Mediterranean beech forest in 2016. These results were integrated with moth biometric data to draw some inferences of general value from the single-event observations [71].
Moderate-resolution MODIS satellite data allowed us to pick up the features of the greening season of the whole forest during the total investigated period and high-resolution Sentinel-2 data enabled us to single out the areas most damaged by the EWE, as the revisit time and spectral range of this Earth observation mission are particularly suited to monitor plant health and growth [72,73]. Selected images, investigated by an appositely devised multi-temporal analysis, allowed us to identify an elevation belt where the already greening beech forest experienced a temporary phenology break/throwback before recovery and where we expected major damage for moth species trophically dependent on beech trees.
Modifications in Lepidoptera were observed at both community and population levels, as evidenced by changes in community structures and by an overall decrease of abundance, whereas the number of species was quite stable. Forest Lepidoptera usually present periodic species-related fluctuations in their populations due to several factors, and a decrease in one species generally corresponds to an increase in another species with the same feeding habit. In our study, we observed a population decrease in all the dominant beech feeder species, but only in the high-elevation forests presenting crown dieback. Similar population crashes have been commonly observed after climatically extreme years [49]. The death of beech-associated moths was likely caused by the exposure of larvae to lethal cold temperatures at high elevation and/or to a long starvation period as leaves only appeared several weeks after the crown dieback.
The vulnerability of lepidopteran life stages varies according to the type of climatic extreme under consideration [48]; however, the sudden occurrence of an EWE and the magnitude of the event play a key role in determining the effects on biota. The cold tolerance of Lepidoptera varies during their life cycle, and it is higher in overwintering stages when they have time to acclimate to expected colder temperatures [74]. During the investigated spring EWE, beech feeder larvae suffered unexpected cold temperatures after a period with mild temperatures, having no time for acclimation. These larvae belong to species that are in flight during the autumn and overwinter as eggs. In fact, in this study, the species that were most abundant during the autumn before the EWE, i.e., Operophtera fagata and Epirrita christyi, experienced a marked population reduction at high-elevation stands, where the beech forest was strongly impacted by the EWE which caused the complete depletion of foliage. At lower elevations, these species were stable or showed increased abundance. This asymmetric pattern confirms the negative causal effect of the EWE on moth populations, supporting the hypothesis of a high mortality of larvae feeding on young beech leaves in late April. In detail, O. fagata only showed decreases in the forest area presenting crown dieback, whereas E. christyi also showed decreases in the site outside the impacted forest but close to its borders. This pattern can be explained by the larval behavior of the former species, being likely less susceptible to direct exposure to freezing temperatures as larvae could be protected by a small cocoon of leaves in which they feed [68]. Then, for O. fagata, starvation can be hypothesized as the main factor causing larval mortality. E. christyi was likely more affected by low temperatures, such as those experienced during this extreme event in the forest contiguous to the area presenting crown dieback, where mature leaves did not die as they were less susceptible to extreme cold. Studies on the cold tolerance of the young larvae of these moths are not available. Their altitudinal range in southern Italy supports the hypothesis that O. fagata, observed only in the beech-dominated forests in the mountainous regions of this geographic area, should be more tolerant to cold than E. christyi, which was also found at a lower elevation [18,75,76].
A generalized increase in the wing dimensions for O. fagata and E. christyi was found in 2016, especially significant in the damaged forests and for females. This change usually occurs in Lepidoptera as a consequence of increased food availability and/or increased habitat quality for larvae; however, these reasons can only explain the larger dimensions of E. christyi at low elevations, where we recorded higher abundance and larger individuals after the EWE. At higher elevations, where the foodplant was absent for several weeks, the increase of average wingspan can only be explained by a different process, i.e., the presence of vagrant individuals from forests unaffected by the EWE, a hypothesis which was also supported by the loss of the smallest specimens. Larger individuals can usually cover greater distances [77,78] and are likely more able to re-colonize forests affected by EWEs. The most recurrent significant increase in the E. christyi wingspan was observed for females. Larger females are associated with a higher number of eggs [79,80], which supports a more rapid re-colonization of impacted forest sites and population resilience. The same cannot occur for O. fagata, as brachypterous females had a very low mobility. The dispersal of this species is likely wind-mediated and promoted by the ballooning of young larvae, as observed for several taxa producing silk [81]. For this reason, we expect a delayed recovery of pre-EWE population densities of O. fagata.

5. Conclusions

In this paper we discussed the short-term negative effects of a late spring frost on beeches and associated moth communities.
To our knowledge this is the first empirical study documenting the effects of a late spring frost on vegetation and associated moth biodiversity by the comparison of data collected before and after the event.
Although the EWE caused an extended crown dieback in the 1400–1600 m altitudinal belt, the beech forests recovered efficiently from the meteorological disturbance, likely thanks to the storage of photosynthetic products in roots and latent buds [82]. This finding suggests that forests could be prepared for a fast recovery after an EWE, but this response could become less efficient if EWEs become more frequent in the future [5]. The late spring frost produced changes in the community structures and abundance patterns of moths, leaving species richness almost unaltered. According to our results, the populations of some species could be more resilient than others after an EWE due to their higher dispersal ability. Populations of some of the most affected species could be able to recover their pre-EWE abundance levels due to within-population dynamics, such as the movement of large vagrant females with potentially higher fecundity.
The studied beech forests are not fragmented and cover a wide altitudinal belt, favoring the movement of colonizers from unaffected to affected forest areas. Due to the large geographic range impacted by the EWE [25], the occurrence of local extinctions of the most impacted species in areas where the beech forests are smaller and more fragmented and moth populations are less abundant [83] cannot be ruled out, especially for those with low dispersal abilities. Several authors have highlighted the risk of local extinctions as a consequence of climate change and even more frequent EWEs [10,84,85]; however, our findings emphasize the possible role of a seamless forest cover as a factor that increases the resilience of the associated biota. Some studies, based on the analysis of long-term impacts on metapopulation metrics, such as occupancy, colonization, and extinction, have concluded that EWEs do not have an effect on ectothermic animals [86]. Our study, which was based on the short-term effects on communities and population patterns of moths, demonstrates that an EWE can affect communities, and also shows that some species can apply strategies to conceal detrimental effects within a short time, explaining why long-term population trends are not affected by EWEs [49,86].
Forest ecosystems appear to be dynamic entities able to cope with extreme weather events occurring at the current rate. Unfortunately, the expected increase in the frequency and magnitude of extreme events in the future could exceed the resilience of forest ecosystems.

Supplementary Materials

The following are available online at https://www.mdpi.com/1999-4907/9/7/388/s1, Excel file Datasets: sheet Dataset 1, data used to compare species richness and abundance before and after the EWE at high elevation; Sheet Dataset 2, data used to search for changes in the community structures and abundance patterns of individual species; sheet Dataset 3, data used to compare wingspan changes before and after the EWE of the most relevant species.

Author Contributions

S.S., T.S., M.I., S.G., R.C., and V.I. conceptualized this study and designed the integrated methodology. S.S., M.I., S.G., and C.D. performed moth sampling in the field. S.S. and M.I. conducted the moth species identification. R.C., V.I., and M.L. collected and selected meteorological and satellite data. R.C., V.I., M.L., and T.S. designed the analysis and performed the investigation of meteorological and satellite data. S.S. led the discussion evaluating the effect of crown dieback on moth communities. T.S. led the discussion interpreting satellite imagery to determine the effect of frost on beech forests. All authors critically discussed the results and contributed to the revision of the manuscript drafted by S.G. and S.S.

Funding

This research was funded by the Project “ALForLab” (PON03PE_00024_1), co-funded by the National Operational Programme for Research and Competitiveness (PON R and C) 2007–2013 through the European Regional Development Fund (ERDF) and a national resource (Revolving Fund—Cohesion Action Plan (CAP) MIUR).

Acknowledgments

We thank Pollino National Park for allowing us to perform our study and the Regional Agency for Environmental Protection in Calabria (ARPACal) for access to climatic data.

Conflicts of Interest

The authors declare no conflict of interest. The founding sponsors had no role in the design of the study; in the collection, analyses, or interpretation of data; in the writing of the manuscript, and in the decision to publish the results.

References

  1. Field, C.B.; Barros, V.R. Climate Change 2014: Impacts, Adaptation, and Vulnerability: Working Group II Contribution to the Fifth Assessment Report of the Intergovernmental Panel on Climate Change; Cambridge University Press: New York, NY, USA, 2014. [Google Scholar]
  2. Hänninen, H. Does climatic warming increase the risk of frost damage in northern trees? Plant Cell Environ. 1991, 14, 449–454. [Google Scholar] [CrossRef]
  3. Kramer, K.; Friend, A.; Leinonen, I. Modelling comparison to evaluate the importance of phenology and spring frost damage for the effects of climate change on growth of mixed temperate-zone deciduous forests. Clim. Res. 1996, 5, 31–41. [Google Scholar] [CrossRef]
  4. Jentsch, A.; Kreyling, J.; Beierkuhnlein, C. A new generation of climate-change experiments: Events, not trends. Front. Ecol. Environ. 2007, 5, 365–374. [Google Scholar] [CrossRef]
  5. Rigby, J.R.; Porporato, A. Spring frost risk in a changing climate. Geophys. Res. Lett. 2008, 35. [Google Scholar] [CrossRef] [Green Version]
  6. Hansen, J.; Ruedy, R.; Sato, M.; Lo, K. Global surface temperature change. Rev. Geophys. 2010, 48. [Google Scholar] [CrossRef]
  7. Rosenzweig, C.; Iglesias, A.; Yang, X.B.; Epstein, P.R.; Chivian, E. Climate change and extreme weather events; implications for food production, plant diseases, and pests. Glob. Change Hum. Health 2001, 2, 90–104. [Google Scholar] [CrossRef]
  8. Jentsch, A.; Beierkuhnlein, C. Research frontiers in climate change: Effects of extreme meteorological events on ecosystems. C. R. Geosci. 2008, 340, 621–628. [Google Scholar] [CrossRef]
  9. Sala, O.E.; Chapin, F.S.; Armesto, J.J.; Berlow, E.; Bloomfield, J.; Dirzo, R.; Huber-Sanwald, E.; Huenneke, L.F.; Jackson, R.B.; Kinzig, A. Global biodiversity scenarios for the year 2100. Science 2000, 287, 1770–1774. [Google Scholar] [CrossRef] [PubMed]
  10. Piessens, K.; Adriaens, D.; Jacquemyn, H.; Honnay, O. Synergistic effects of an extreme weather event and habitat fragmentation on a specialised insect herbivore. Oecologia 2009, 159, 117–126. [Google Scholar] [CrossRef] [PubMed]
  11. Jiguet, F.; Brotons, L.; Devictor, V. Community responses to extreme climatic conditions. Curr. Zool. 2011, 57, 406–413. [Google Scholar] [CrossRef] [Green Version]
  12. Melillo, J.M.; Callaghan, T.V.; Woodward, F.I.; Salati, E.; Sinha, S.K. Effects on ecosystems. Clim. Chang. IPCC Sci. Assess. 1990, 283–310. [Google Scholar]
  13. Parmesan, C.; Root, T.L.; Willig, M.R. Impacts of extreme weather and climate on terrestrial biota. Bull. Am. Meteorol. Soc. 2000, 81, 443–450. [Google Scholar] [CrossRef]
  14. Parmesan, C.; Ryrholm, N.; Stefanescu, C.; Hill, J.K. Poleward shifts in geographical ranges of butterfly species associated with regional warming. Nature 1999, 399, 579. [Google Scholar] [CrossRef]
  15. Parmesan, C. Ecological and Evolutionary Responses to Recent Climate Change. Annu. Rev. Ecol. Evol. Syst. 2006, 37, 637–669. [Google Scholar] [CrossRef]
  16. Hellmann, J.J.; Pelini, S.L.; Prior, K.M.; Dzurisin, J.D.K. The response of two butterfly species to climatic variation at the edge of their range and the implications for poleward range shifts. Oecologia 2008, 157, 583–592. [Google Scholar] [CrossRef] [PubMed]
  17. Diamond, S.E.; Frame, A.M.; Martin, R.A.; Buckley, L.B. Species’ traits predict phenological responses to climate change in butterflies. Ecology 2011, 92, 1005–1012. [Google Scholar] [CrossRef] [PubMed]
  18. Scalercio, S.; Bonacci, T.; Mazzei, A.; Pizzolotto, R.; Brandmayr, P. Better up, worse down: Bidirectional consequences of three decades of climate change on a relict population of Erebia cassioides. J. Insect Conserv. 2014, 18, 643–650. [Google Scholar] [CrossRef]
  19. Jentsch, A.; Beierkuhnlein, C. Global climate change and local disturbance regimes as interacting drivers for shifting altitudinal vegetation patterns. Erdkunde 2003, 57, 216–231. [Google Scholar] [CrossRef]
  20. Walck, J.L.; Hidayati, S.N.; Dixon, K.W.; Thompson, K.; Poschlod, P. Climate change and plant regeneration from seed. Glob. Chang. Biol. 2011, 17, 2145–2161. [Google Scholar] [CrossRef]
  21. Kramer, K.; Leinonen, I.; Loustau, D. The importance of phenology for the evaluation of impact of climate change on growth of boreal, temperate and Mediterranean forests ecosystems: An overview. Int. J. Biometeorol. 2000, 44, 67–75. [Google Scholar] [CrossRef] [PubMed]
  22. Lindner, M.; Maroschek, M.; Netherer, S.; Kremer, A.; Barbati, A.; Garcia-Gonzalo, J.; Seidl, R.; Delzon, S.; Corona, P.; Kolström, M.; et al. Climate change impacts, adaptive capacity, and vulnerability of European forest ecosystems. For. Ecol. Manag. 2010, 259, 698–709. [Google Scholar] [CrossRef]
  23. De Feudis, M.; Cardelli, V.; Massaccesi, L.; Lagomarsino, A.; Fornasier, F.; Westphalen, D.; Cocco, S.; Corti, G.; Agnelli, A. Influence of Altitude on Biochemical Properties of European Beech (Fagus sylvatica L.) Forest Soils. Forests 2017, 8, 213. [Google Scholar] [CrossRef]
  24. Inouye, D.W. Effects of climate change on phenology, frost damage, and floral abundance of montane wildflowers. Ecology 2008, 89, 353–362. [Google Scholar] [CrossRef] [PubMed]
  25. Bascietto, M.; Bajocco, S.; Mazzenga, F.; Matteucci, G. Assessing spring frost effects on beech forests in Central Apennines from remotely-sensed data. Agric. For. Meteorol. 2018, 248, 240–250. [Google Scholar] [CrossRef]
  26. Dittmar, C.; Fricke, W.; Elling, W. Impact of late frost events on radial growth of common beech (Fagus sylvatica L.) in Southern Germany. Eur. J. For. Res. 2006, 125, 249–259. [Google Scholar] [CrossRef]
  27. Giesecke, T.; Hickler, T.; Kunkel, T.; Sykes, M. T.; Bradshaw, R.H.W. Towards an understanding of the Holocene distribution of Fagus sylvatica L. J. Biogeogr. 2007, 34, 118–131. [Google Scholar] [CrossRef]
  28. Augspurger, C.K. Spring 2007 warmth and frost: Phenology, damage and refoliation in a temperate deciduous forest: Warmth and frost. Funct. Ecol. 2009, 23, 1031–1039. [Google Scholar] [CrossRef]
  29. Augspurger, C.K. Reconstructing patterns of temperature, phenology, and frost damage over 124 years: Spring damage risk is increasing. Ecology 2013, 94, 41–50. [Google Scholar] [CrossRef] [PubMed]
  30. Kreyling, J.; Thiel, D.; Nagy, L.; Jentsch, A.; Huber, G.; Konnert, M.; Beierkuhnlein, C. Late frost sensitivity of juvenile Fagus sylvatica L. differs between southern Germany and Bulgaria and depends on preceding air temperature. Eur. J. For. Res. 2012, 131, 717–725. [Google Scholar] [CrossRef]
  31. García-Plazaola, J.I.; Becerril, J.M. Effects of drought on photoprotective mechanisms in European beech (Fagus sylvatica L.) seedlings from different provenances. Trees 2000, 14, 485–490. [Google Scholar] [CrossRef]
  32. Subramanian, N.; Bergh, J.; Johansson, U.; Nilsson, U.; Sallnäs, O. Adaptation of Forest Management Regimes in Southern Sweden to Increased Risks Associated with Climate Change. Forests 2016, 7, 8. [Google Scholar] [CrossRef]
  33. De Marco, A.; Fioretto, A.; Giordano, M.; Innangi, M.; Menta, C.; Papa, S.; Virzo De Santo, A. C Stocks in Forest Floor and Mineral Soil of Two Mediterranean Beech Forests. Forests 2016, 7, 181. [Google Scholar] [CrossRef] [Green Version]
  34. Walentowski, H.; Müller-Kroehling, S.; Bergmeier, E.; Bernhardt-Römermann, M.; Gossner, M.M.; Reif, A.; Schulze, E.-D.; Bußler, H.; Strätz, C.; Adelmann, W. Faunal diversity of Fagus sylvatica forests: A regional and European perspective based on three indicator groups. Ann. For. Res. 2014, 57, 215–231. [Google Scholar]
  35. Scalercio, S.; Bonacci, T.; Turco, R.; Bernardini, V. Relationships between Psychidae communities (Lepidoptera: Tineoidea) and the ecological characteristics of old-growth forests in a beech dominated landscape. Eur. J. Entomol. 2016, 113, 113–121. [Google Scholar] [CrossRef] [Green Version]
  36. Greco, S.; Coluzzi, R.; Imbrenda, V.; Infusino, M.; Simoniello, T.; Scalercio, S. Relationships between landscape and moth diversity in Mediterranean mountain forest ecosystems at multiple spatial scales. Forest@ 2017, 14, 75–83. [Google Scholar] [CrossRef] [Green Version]
  37. Summerville, K.S.; Ritter, L.M.; Crist, T.O. Forest moth taxa as indicators of lepidopteran richness and habitat disturbance: A preliminary assessment. Biol. Conserv. 2004, 116, 9–18. [Google Scholar] [CrossRef]
  38. Boggs, C.L.; Murphy, D.D. Community composition in mountain ecosystems: Climatic determinants of montane butterfly distributions. Glob. Ecol. Biogeogr. Lett. 1997, 6, 39–48. [Google Scholar] [CrossRef]
  39. Cooke, B.J.; Roland, J. The Effect of Winter Temperature on Forest Tent Caterpillar (Lepidoptera: Lasiocampidae) Egg Survival and Population Dynamics in Northern Climates. Environ. Entomol. 2003, 32, 299–311. [Google Scholar] [CrossRef] [Green Version]
  40. Matter, S.F.; Doyle, A.; Illerbrun, K.; Wheeler, J.; Roland, J. An assessment of direct and indirect effects of climate change for populations of the Rocky Mountain Apollo butterfly (Parnassius smintheus Doubleday). Insect Sci. 2011, 18, 385–392. [Google Scholar] [CrossRef]
  41. Boggs, C.L.; Inouye, D.W. A single climate driver has direct and indirect effects on insect population dynamics. Ecol. Lett. 2012, 15, 502–508. [Google Scholar] [CrossRef] [PubMed]
  42. Roland, J.; Matter, S.F. Variability in winter climate and winter extremes reduces population growth of an alpine butterfly. Ecology 2013, 94, 190–199. [Google Scholar] [CrossRef] [PubMed]
  43. Ehrlich, P.R.; Breedlove, D.E.; Brussard, P.F.; Sharp, M.A. Weather and the “regulation” of subalpine populations. Ecology 1972, 53, 243–247. [Google Scholar] [CrossRef]
  44. Singer, M.C.; Thomas, C.D. Evolutionary Responses of a Butterfly Metapopulation to Human- and Climate-Caused Environmental Variation. Am. Nat. 1996, 148, S9–S39. [Google Scholar] [CrossRef]
  45. Thomas, C.D.; Singer, M.C.; Boughton, D.A. Catastrophic extinction of population sources in a butterfly metapopulation. Am. Nat. 1996, 148, 957–975. [Google Scholar] [CrossRef]
  46. Easterling, D.R.; Evans, J.L.; Groisman, P.Y.; Karl, T.R.; Kunkel, K.E.; Ambenje, P. Observed variability and trends in extreme climate events: A brief review. Bull. Am. Meteorol. Soc. 2000, 81, 417–425. [Google Scholar] [CrossRef]
  47. Smart, S.M.; Ellison, A.M.; Bunce, R.G.H.; Marrs, R.H.; Kirby, K.J.; Kimberley, A.; Scott, A.W.; Foster, D.R. Quantifying the impact of an extreme climate event on species diversity in fragmented temperate forests: The effect of the October 1987 storm on British broadleaved woodlands. J. Ecol. 2014, 102, 1273–1287. [Google Scholar] [CrossRef] [Green Version]
  48. McDermott Long, O.; Warren, R.; Price, J.; Brereton, T.M.; Botham, M.S.; Franco, A.M.A. Sensitivity of UK butterflies to local climatic extremes: Which life stages are most at risk? J. Anim. Ecol. 2017, 86, 108–116. [Google Scholar] [CrossRef] [PubMed]
  49. Palmer, G.; Platts, P.J.; Brereton, T.; Chapman, J.W.; Dytham, C.; Fox, R.; Pearce-Higgins, J.W.; Roy, D.B.; Hill, J.K.; Thomas, C.D. Climate change, climatic variation and extreme biological responses. Philos. Trans. R. Soc. B Biol. Sci. 2017, 372, 20160144. [Google Scholar] [CrossRef] [PubMed] [Green Version]
  50. Infusino, M.; Greco, S.; Turco, R.; Bernardini, V.; Scalercio, S. Managed mountain forests as diversity reservoirs in Mediterranean landscapes: New data on endemic species and faunistic novelties of moths. Bull. Insectology 2016, 69, 249–258. [Google Scholar]
  51. Piovesan, G.; Biondi, F.; Bernabei, M.; Di Filippo, A.; Schirone, B. Spatial and altitudinal bioclimatic zones of the Italian peninsula identified from a beech (Fagus sylvatica L.) tree-ring network. Acta Oecologica 2005, 27, 197–210. [Google Scholar] [CrossRef]
  52. Lanfredi, M.; Coppola, R.; D’Emilio, M.; Imbrenda, V.; Macchiato, M.; Simoniello, T. A geostatistics-assisted approach to the deterministic approximation of climate data. Environ. Model. Softw. 2015, 66, 69–77. [Google Scholar] [CrossRef]
  53. Hanes, J.M. Spring leaf phenology and the diurnal temperature range in a temperate maple forest. Int. J. Biometeorol. 2014, 58, 103–108. [Google Scholar] [CrossRef] [PubMed]
  54. Wato, Y.A.; Heitkönig, I.M.A.; van Wieren, S.E.; Wahungu, G.; Prins, H.H.T.; van Langevelde, F. Prolonged drought results in starvation of African elephant (Loxodonta africana). Biol. Conserv. 2016, 203, 89–96. [Google Scholar] [CrossRef]
  55. Rouse, J.W., Jr.; Haas, R.H.; Schell, J.A.; Deering, D.W. Monitoring the Vernal Advancement and Retrogradation (Green Wave Effect) of Natural Vegetation; Progress Report RSC 1978-1, NTIS No. E73-10693; Remote Sensing Center and A and M University: College Station, TX, USA, 1974. [Google Scholar]
  56. Simoniello, T.; Lanfredi, M.; Liberti, M.; Coppola, R.; Macchiato, M. Estimation of vegetation cover resilience from satellite time series. Hydrol. Earth Syst. Sci. Discuss. 2008, 5, 511–546. [Google Scholar] [CrossRef]
  57. Simoniello, T.; Lanfredi, M.; Coppola, R.; Imbrenda, V.; Macchiato, M. Correlation of Vegetation and Air Temperature Seasonal Profiles-Spatial Arrangement and Temporal Variability, Phenology and Climate Change. Available online: https://www.intechopen.com/books/phenology-and-climate-change/correlation-of-vegetation-and-temperature-seasonal-profiles-spatial-arrangement-and-temporal-variabi (accessed on 21 March 2012).
  58. Lanfredi, M.; Coppola, R.; Simoniello, T.; Coluzzi, R.; D’Emilio, M.; Imbrenda, V.; Macchiato, M. Early Identification of Land Degradation Hotspots in Complex Bio-Geographic Regions. Remote Sens. 2015, 7, 8154–8179. [Google Scholar] [CrossRef] [Green Version]
  59. Infusino, M.; Brehm, G.; Di Marco, C.; Scalercio, S. Assessing the efficiency of UV LEDs as light sources for sampling the diversity of macro-moths (Lepidoptera). Eur. J. Entomol. 2017, 114, 25–33. [Google Scholar] [CrossRef] [Green Version]
  60. Berio, E. Lepidoptera Noctuidae. I. Generalities. Hadeninae, Cucullinae; Officine Grafiche Calderini: Bologna, Italy, 1985; Volume XXII, ISBN 88-7019-235-0. [Google Scholar]
  61. Berio, E. Lepidoptera Noctuidae II: Sezione Quadrifide; Officine Grafiche Calderini: Bologna, Italy, 1991; Volume XXVII, ISBN 88-7019-469-8. [Google Scholar]
  62. Marini, M.; Trentini, M. I Macrolepidetteri dell’appennino lucchese; Arti Grafiche Tamari: Bologna, Italy, 1986. [Google Scholar]
  63. Bertaccini, E.; Fiumi, G.; Provera, P. Bombici e sfingi d’Italia: (Lepidoptera Heterocera); Natura-Giuliano Russo Editore: Bologna, Italy, 1995; Volume I. [Google Scholar]
  64. Bertaccini, E.; Fiumi, G.; Provera, P. Bombici e sfingi d’Italia: (Lepidoptera Heterocera); Natura-Giuliano Russo Editore: Bologna, Italy, 1997; Volume II. [Google Scholar]
  65. Rákosy, L. Die Noctuiden Rumäniens: Lepidoptera Noctuidae; Oberösterreichisches Landesmuseum: Linz, Austria, 1996. [Google Scholar]
  66. Flamigni, C.; Fiumi, G.; Parenzan, P. Lepidotteri eteroceri d’Italia: Geometridae Ennominae; Natura Edizioni Scientifiche: Bologna, Italy, 2007. [Google Scholar]
  67. Hellmann, F.; Parenzan, P. I macrolepidotteri del Piemonte; Museo Regionale di Scienze Naturali: Torino, Italy, 2010. [Google Scholar]
  68. Hausmann, A.; Viidalepp, J. Larentiinae I (Perizomini and Eupitheciini). Geom. Moths Eur. 2012, 3, 1–743. [Google Scholar]
  69. Scalercio, S.; Infusino, M.; Hausmann, A. Nothocasis rosariae sp. n., a new sylvicolous, montane species from southern Europe (Lepidoptera: Geometridae, Larentiinae). Zootaxa 2016, 4161, 177. [Google Scholar] [CrossRef] [PubMed] [Green Version]
  70. Hammer, Ø.; Harper, D.A.T.; Ryan, P.D. PAST-palaeontological statistics, ver. 1.89. Palaeontol. Electron. 2001, 4, 1–9. [Google Scholar]
  71. Altwegg, R.; Visser, V.; Bailey, L.D.; Erni, B. Learning from single extreme events. Philos. Trans. R. Soc. B Biol. Sci. 2017, 372, 20160141. [Google Scholar] [CrossRef] [PubMed]
  72. Imbrenda, V.; D’emilio, M.; Lanfredi, M.; Macchiato, M.; Ragosta, M.; Simoniello, T. Indicators for the estimation of vulnerability to land degradation derived from soil compaction and vegetation cover. Eur. J. Soil Sci. 2014, 65, 907–923. [Google Scholar] [CrossRef]
  73. Puletti, N.; Chianucci, F.; Castaldi, C. Use of Sentinel-2 for forest classification in Mediterranean environments. Ann. Silvic. Res. 2017, 42, 1. [Google Scholar]
  74. Khani, A.; Moharramipour, S.; Barzegar, M. Cold tolerance and trehalose accumulation in overwintering larvae of the codling moth, Cydia pomonella (Lepidoptera: Tortricidae). Eur. J. Entomol. 2007, 104, 385. [Google Scholar] [CrossRef]
  75. Parenzan, P. Contributi alla conoscenza della Lepidotterofauna dell’Italia meridionale: XVII. Geometridae. Entomologica, Bari 1994, 28, 99–246. [Google Scholar]
  76. Scalercio, S.; Infusino, M.; Tuscano, J. I macrolepidotteri notturni della faggeta di Monte Curcio, Sila Grande (Calabria, Italia meridionale) (Lepidoptera). Quad. Della Stazione Ecol. Civ. Mus. Storia Nat. Ferrara 2008, 18, 5–19. [Google Scholar]
  77. Shirai, Y. Longevity, flight ability and reproductive performance of the diamondback moth, Plutella xylostella (L.)(Lepidoptera: Yponomeutidae), related to adult body size. Res. Popul. Ecol. 1995, 37, 269–277. [Google Scholar] [CrossRef]
  78. Sekar, S. A meta-analysis of the traits affecting dispersal ability in butterflies: Can wingspan be used as a proxy? Factors affecting dispersal ability in butterflies. J. Anim. Ecol. 2012, 81, 174–184. [Google Scholar] [CrossRef] [PubMed]
  79. Wickman, P.O.; Karlsson, B. Abdomen Size, Body Size and the Reproductive Effort of Insects. Oikos 1989, 56, 209. [Google Scholar] [CrossRef]
  80. Tammaru, T.; Kaitaniemi, P.; Ruohomäki, K.; Ruohomaki, K. Realized Fecundity in Epirrita autumnata (Lepidoptera: Geometridae): Relation to Body Size and Consequences to Population Dynamics. Oikos 1996, 77, 407. [Google Scholar] [CrossRef]
  81. Bell, J.R.; Bohan, D.A.; Shaw, E.M.; Weyman, G.S. Ballooning dispersal using silk: World fauna, phylogenies, genetics and models. Bull. Entomol. Res. 2005, 95, 69–114. [Google Scholar] [CrossRef] [PubMed]
  82. Awaya, Y.; Tanaka, K.; Kodani, E.; Nishizono, T. Responses of a beech (Fagus crenata Blume) stand to late spring frost damage in Morioka, Japan. For. Ecol. Manag. 2009, 257, 2359–2369. [Google Scholar] [CrossRef]
  83. Higgins, K. Metapopulation extinction risk: Dispersal’s duplicity. Theor. Popul. Biol. 2009, 76, 146–155. [Google Scholar] [CrossRef] [PubMed]
  84. McLaughlin, J.F.; Hellmann, J.J.; Boggs, C.L.; Ehrlich, P.R. Climate change hastens population extinctions. Proc. Natl. Acad. Sci. 2002, 99, 6070–6074. [Google Scholar] [CrossRef] [PubMed] [Green Version]
  85. Oliver, T.H.; Marshall, H.H.; Morecroft, M.D.; Brereton, T.; Prudhomme, C.; Huntingford, C. Interacting effects of climate change and habitat fragmentation on drought-sensitive butterflies. Nat. Clim. Chang. 2015, 5, 941–945. [Google Scholar] [CrossRef] [Green Version]
  86. Malinowska, A.H.; van Strien, A.J.; Verboom, J.; WallisdeVries, M.F.; Opdam, P. No Evidence of the Effect of Extreme Weather Events on Annual Occurrence of Four Groups of Ectothermic Species. PLoS ONE 2014, 9, e110219. [Google Scholar] [CrossRef] [PubMed]
Figure 1. (a) Distribution of beech forests (green colored) of Italy, extracted from the Corine Land Cover (CLC) 2012 Level IV—class 3115. (b) Study area within the Calabria region. (c) Sampling stands (yellow dots) located on the Pollino Massif. Contour lines indicate elevation.
Forests 09 00388 g001
Figure 2. Daily minimum temperature recorded at the Campotenese meteorological station (973 m above sea level, source: Regional Agency for Environmental Protection in Calabria (ARPACal)). Continuous line: values recorded during 2016; dashed line: values recorded during 2015; grey area profile: average values from 2002–2015. The low percentage of missing data allowed us to obtain a reliable reconstruction of the long-term averages in the study period.
Forests 09 00388 g002
Figure 3. Pollino beech forest phenological profiles obtained from MOD13Q1 product (NDVI; Normalized Difference Vegetation Index) data for 2015 and 2016. For the ordinates of NDVI values (range 0:1), the abscissa dates correspond to the 16-day compositing periods of Moderate Resolution Imaging Spectroradiometer (MODIS) data (using dates for 2016, which is a leap year; for the non-leap year 2015, dates should be advanced by one day).
Forests 09 00388 g003
Figure 4. (a) NDVI maps from high-resolution (10 m) Sentinel-2 satellite images acquired in different periods: 1- before the Extreme Weather Event (EWE) (20 April 2016); 2- approximately one month later (23 May 2016); and 3- approximately two months later (29 June 2016). Reddish areas (high NDVI) enhance forests with a good level of vegetation activity, while bluish areas (low NDVI) indicate forests that are dormant or damaged. (b) RGB composition map of ΔNDVI1, ΔNDVI2, and ΔNDVI3. Areas severely impacted by EWE (orange) are separated from non-affected areas (yellow + grey). Contour lines with a step of 100 m are in black.
Forests 09 00388 g004
Figure 5. Comparisons of moth communities sampled before (2015) and after (2016) the extreme weather event (EWE). (a) Individual-based rarefaction curves with standard deviation (dotted lines) of communities sampled within stands showing crown dieback (PO_C1-2-3). Communities were analyzed as a whole and partitioned into beech feeders (BFs) and non-beech feeders (n-BFs). (b) Cluster analysis (paired group) performed on autumn samples. Communities constituting a cluster before the EWE are indicated by circles of the same color and maintained as a reference for a given stand. Snowflakes mark stands showing crown dieback.
Forests 09 00388 g005
Figure 6. Box and Jitter plots for wing measurements (distance between the insertion point and apex of the forewings) of Operophtera fagata and Epirrita christyi. Red dots of Jitter plots indicate 2015 measurements that exceeded the 2016 range, and green dots indicate 2016 measurements that exceeded the 2015 range. For each sampling site is given the numbers of measured specimens (n), differences between years were evaluated using the t-test and p-level reported in parentheses; n.s. means not significant.
Forests 09 00388 g006
Table 1. Changes in abundance of autumn communities after the EWE in the investigated sampling sites (PO_A, PO_B, and PO_C). In detail, we reported the number of individuals collected before and after the EWE (2015/2016) and the differences between the two sampling years as a percentage (∆%) regarding total community (TOT), beech feeders (BFs), non-beech feeders (n-BFs), and most impacted species (Operophtera fagata and Epirrita christyi).
TOTBFsn-BFsOperophtera fagataEpirrita christyi
PO_A(1+2+3)2015/2016574/607227/225347/3839/1075/152
∆%6−11011103
PO_B(1+2+3)2015/2016828/480759/37769/103400/338257/23
∆%−42−5049−16−91
PO_C(1+2+3)2015/20163188/5003066/268122/2322260/161654/70
∆%−84−9190−93−89

