Article

National REDD+ Implications for Tenured Indigenous Communities in Guyana, and Communities’ Impact on Forest Carbon Stocks

1
College of Environmental Science and Forestry, State University of New York, Syracuse, NY 13210, USA
2
ARC Centre of Excellence for Environmental Decisions, School of Biological Sciences, The University of Queensland, St. Lucia, QLD 4072, Australia
3
Environmental Change Institute, School of Geography and the Environment, Oxford University, Oxford OX1 3QY, UK
4
School of Economic, Political and Policy Sciences, University of Texas at Dallas, Richardson, TX 75080, USA
5
Department of Anthropology, Stanford University, Stanford, CA 94035, USA
6
Department of Biology & Center for Latin American Studies, Stanford University, Stanford, CA 94035, USA
*
Author to whom correspondence should be addressed.
Present address: California Academy of Sciences, San Francisco, CA 94118, USA. Instituto Nacional de Pesquisas da Amazonia (Inpa/MCTIC) (INPA), 69.067-375, Manaus, Brazil.
Forests 2018, 9(5), 231; https://doi.org/10.3390/f9050231
Submission received: 15 February 2018 / Revised: 29 March 2018 / Accepted: 25 April 2018 / Published: 27 April 2018
(This article belongs to the Special Issue The Performance of REDD+: From Global Governance to Local Practices)

Abstract

:
Early project-level initiatives of ‘reducing emissions from deforestation and forest degradation’ (REDD+) have left a negative impression among many forest-dependent peoples (FDP) across the tropics. As countries move towards national-level implementation and results-based payments, it is timely to analyze the effects of ‘national REDD+’ on FDP. We use Guyana’s technically approved United Nations Forest Reference Emission Level (FREL) submission and Opt-In Mechanism to assess how fifteen indigenous communities with tenured forestland may financially benefit from national REDD+, and evaluate whether, and to what extent, Guyana forms a best-case scenario. In addition, we provide a first-time assessment whether field estimates of the average carbon density of mature forests managed by fifteen forest-dependent communities (beyond rotational farming lands) equals that of nearby unmanaged mature forest, as this could affect REDD+ payment levels. We conclude that, notwithstanding some pending issues, Guyana’s national REDD+ program could be very beneficial for FDP, even under a modest United States (US) $5 unit carbon price. We present economic evidence to support forest governance change domestically in sovereign developing countries that may ease FDP tenure and national REDD+ implementation. The average carbon density was locally substantially less in FDP-managed forest, but had little effect on the overall carbon stock of the titled forest area, and is considered modest when incorporating ecological and socioeconomic attributes. Partnerships with FDP when combined with advances in remote sensing could have potential for economic monitoring of forest emissions across the tropics.

1. Introduction

Reducing Emissions from Deforestation and forest Degradation (REDD+) aims to reduce emissions from tropical forests while ensuring livelihoods of forest-dependent people (FDP) [1]. REDD+ was explicitly mentioned as a mitigation option in the 2015 Paris Climate Accord, where most nations signed an agreement to keep global temperature rise below 2 °C [2], encouraging tropical forest countries to submit proposals for national REDD+ programs [3]. FDP inclusion in these processes, however, has been peripheral at best [4,5,6]. The term “forest-dependent peoples” (FDP) has been defined in various ways [7]. In the context of communities’ impact on forest carbon stocks of indigenous lands, we define forest-dependent peoples as residents of communities that are spatially located within or in close proximity to forests, which have de jure or de facto user rights, and which depend significantly (though not necessarily exclusively) upon forests for residents’ livelihood needs.
The involvement of FDP with REDD+ around the world thus far has ranged from problematic (e.g., [8]), to very negative [9,10], leading to a backlash from ‘no-redd’ civil and NGO movements (e.g., [11,12]). Reported challenges of REDD+ pilots or demonstration projects with FDP include lagging global finance for REDD+, tenure insecurity, non-mandatory forest safeguards [8], poor adherence to Free Prior Informed Consent (FPIC) principles, and prioritizing carbon credits over local interests [9,10]. Much of the REDD+ literature has converged on the belief that REDD+ cannot be implemented without first resolving FDP tenure, in order to prevent land grabbing, regulate FDP resource use restrictions, and ensure equitable REDD+ benefit sharing [13,14,15,16]. Although REDD+ is intended for implementation at the national level [3], all REDD+ experiences to date are based on sub-national initiatives [17], and there has been no assessment of the national implications for FDP.
Guyana was the first country to submit a comprehensive Forest Reference Emission Level (FREL) proposal to the United Nations Framework Convention on Climate Change (UNFCCC), which included countrywide forest emissions, forest degradation due to logging, and countrywide variation in the carbon density of its forests [18]. The submission was technically approved by the UN [19]. In addition to its FREL-submission, Guyana has developed an ‘Opt-In Mechanism’ for its indigenous communities. The Opt-In Mechanism provides indigenous villages with titled lands (documented legal ownership of the land, including forest, Section 2.1) the opportunity to use their forests as a part of the national REDD+ program [20] (detailed in Section 2.2). Guyana thus provides a first example and opportunity to examine the implications of national-level REDD+ for FDP, including its financial benefits. We subsequently explore to what extent Guyana forms a best-case scenario due to the carbon density of its forests, its High Forest Low Deforestation (HFLD) status, and FDP tenure.
FDP are regarded by many as the best forest stewards, based on observations that their lands retain most forest cover in comparison to other forest uses, including fully protected areas (e.g., [21,22,23]). However, this omits a core cause of deforestation and generally hesitant recognition of FDP forest rights, which is that commercial forest uses (CFU, e.g., agriculture, mineral, and wood extraction) provide revenue and add to a country’s gross domestic product, while FDP use does not. Neither does ‘FDP retaining most forest cover’ imply that their forest (beyond rotational farming areas) retains the carbon content of mature forest, even if a closed canopy cover is present, as people may log for domestic or commercial purposes (labeled as ‘forest degradation’). If their mature titled forests do hold significantly lower carbon stocks than unmanaged forests, this would have implications for levels of future carbon payments to FDP. To address this, we assess the impact of 15 FDP communities on surrounding mature forest in Guyana to determine the extent of their influence on forest carbon stocks. In this paper we combine data from Guyana’s UN-FREL submission and Opt-In Mechanism with our field measurements and remote sensing data on titled forest areas to examine how Guyana’s national REDD+ program would affect FDP and evaluate the wider applicability of these results.

2. Study Area and Methods

2.1. Indigenous People and Land Rights

In 2012, there were nearly 80,000 indigenous people of nine ethnicities in Guyana [24], making up 10.5% of the national population. Locally named ‘Amerindians’, the nine groups live in approximately 146 indigenous communities, 96 of which have titled lands [25], which collectively occupies approximately 14% of the national forest area (2.6 M ha of 18.4 M ha, [26]). The first legal government commitment to provide Indigenous land rights in Guyana was rooted in the fact that, at the time of independence from British rule (1966), the Indigenous vote was important for the other two major ethnicities (African Guyanese and Indo-Guyanese) [25]. It has, however, taken four more decades, with the passage of the Amerindian Act [27], that there has been a systematic acceleration of indigenous communities gaining title to traditionally inhabited lands. Under the Act, Amerindian communities established at least 25 years and with more than 150 people can apply for title. The government subsequently has six months to visit the community to gather relevant information, and another six months for the Minister to make a decision, which, if the community disagrees, can be appealed in court [27] (‘Part VI’). The title provides permanent full collective ownership of the land and its forest resources by the community, as protected by the Constitution, but does not include rivers and 20-m wide riverbanks. Belowground mineral resources remain state ownership, but a community (‘village’ when it has title) can deny access to (small and medium-scale) mining on its titled land [27] (‘Part VI’). The titled land is owned equally by all residents of the community. While a household may occupy an area for generations and the wider village will accept and respect that piece of land as theirs, the household could not formally use this as an asset. Although rights to carbon stocks were not defined in the 2006 Act, the government has acknowledged these rights by giving communities with titled lands the choice of opting in or out of enrolling their forest in Guyana’s national REDD program and to receive compensation from government under a REDD+ agreement (see Section 2.3) [20].

2.2. Guyana and REDD+

Guyana is classified as a High Forest-Low Deforestation (HFLD) country [28], with about 83.3% of its area being covered by forest (18.4 M ha, [26]). HFLD was coined in 2007 by Da Fonseca et al. [28] to denote a group of countries that were at risk of being omitted from a new framework for reducing emissions from deforestation—those with high forest cover (>50% of land area in 2005) and low rates of deforestation (below global average of 0.22% during 1990–2000) [28]. We return to HFLD in Section 4.3.2. The national population is around 750,000 and Guyana is ranked 151th in the world in terms of per capita gross domestic product [29]. The country has been at the forefront of REDD+ development since 2006, and it is a partner country of both the UN REDD+ Programme and the World Bank’s Forest Carbon Partnership Facility [3,30]. In late 2009, Guyana signed a five-year bilateral performance-based REDD+ agreement with Norway to facilitate REDD+ readiness and implement low carbon projects [31,32].

2.3. Guyana’s Opt-In Mechanism Strategy
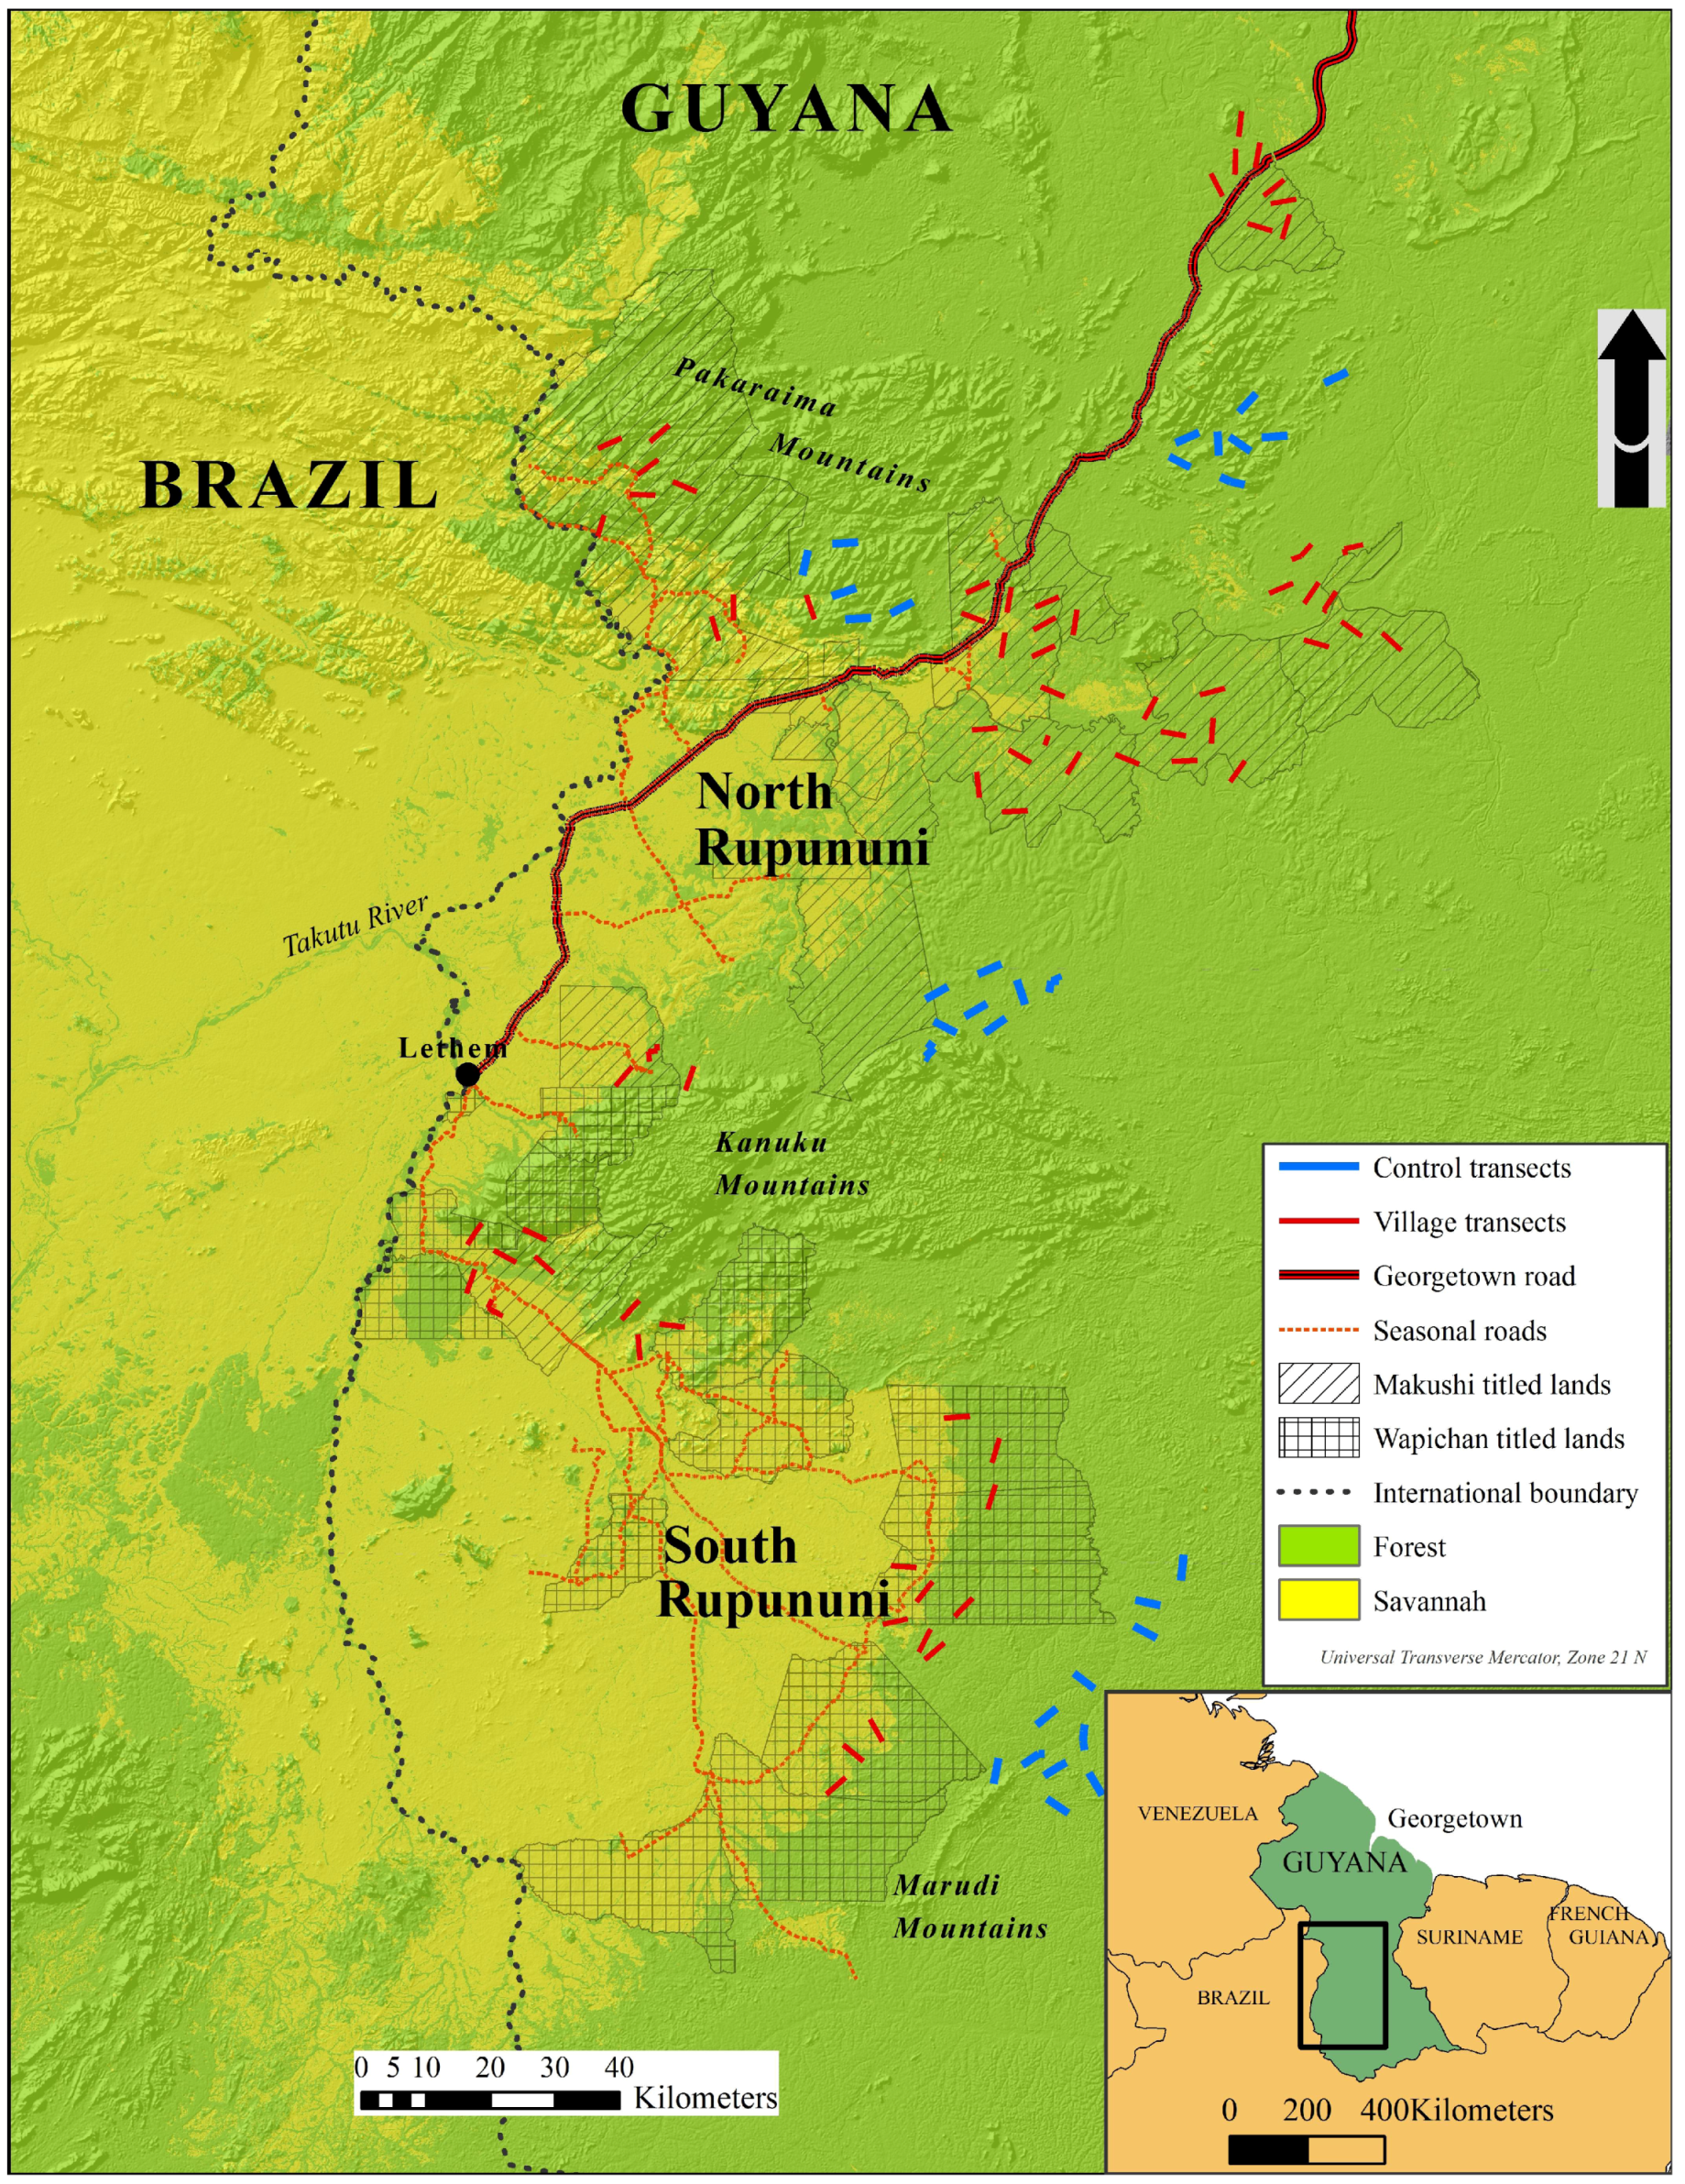
Concurrent with its UNFCCC submission, Guyana developed an ‘Opt-In Mechanism’ that stipulates the conditions and benefits under which indigenous villages may be included in the national REDD+ scheme [20]. The Opt-In Mechanism (OIM) was developed in consultation with indigenous leaders nationwide that provided reviews to inform the documents, and is not yet finalized [20]. Opting in is the decision of individual villages: it is voluntary, reversible, and without a deadline or consequences for other national development programs. If, after due Free Prior Informed Consent (FPIC) villages decide to opt in, traditional activities, including swidden farming, are permitted to continue. Emissions of village activities will be monitored, and the difference with the national reference level will be used to determine the amount of payment each year per village (see below). Transaction and implementation costs would be shared between government and village. Chiefly, the government provides one-off initial support to villages for the OIM to become operational, while subsequent running and monitoring costs would be covered by the village’s REDD+ earnings [20]. REDD+ revenues will not translate into direct payments to the village or its households, but are to be used to finance projects that are included in the Village Plan. This plan is updated annually and outlines the village’s vision for development, including the management of forest resources [27].
Levels of annual payments to each village will be calculated in a similar way as at the national level [18]. At the national level, the annual emission rate and the forest area of the country is used to calculate payments, and these variables will be replaced by the annual emission rate of the individual village and the carbon stock of its titled forest [20]. Consequently, a village’s REDD+ revenue will be calculated as:
Annual revenue = (National Reference Emission Level − Community Emission Level in Yrx) × Community’s forest CO2 stock in Yrx−1 × Carbon price
The national reference emission level is based on the 12-year average of countrywide forest emissions from deforestation and forest degradation during 2001–2012, expressed as a percentage of the country’s total carbon stock, in carbon dioxide, CO2, equivalents [18]. As a simplified example, a country with a 1,000,000 ha forest area, with a ‘carbon density’ of 200 tC ha−1, has a national ‘carbon stock’ of 200 million tC, or 733 Mt in CO2 equivalents (the conversion factor C—CO2 is 44/12 = 3.667, based on the atomic weights of carbon (12) and oxygen (16)). If the country deforested on average 3000 ha per year in recent history (3000 × 200 × 3.67 = 2.2 Mt CO2), its ‘historical emission rate’ is 0.3% (2.2/733). Any forest degradation, e.g., through logging, would similarly have to be converted to CO2-equivalents, and added to the 2.2 MtCO2 from deforestation [18]. The annual community emissions are similarly expressed as a percentage of the total carbon stock of the community’s titled forest. The difference between the reference level and the community’s emission rate in a given year represents the rate at which the community has avoided emissions as compared to the national baseline rate. This is multiplied by the total forest carbon stock of the village’s titled forest (in tCO2) in the year prior to the assessment, and by the carbon price (US$ per tCO2), to arrive at the amount of revenue earned that year (Equation (1)). Section 3.1 provides an elaborated example.
Equation (1) shows there are two variables under influence of the communities; how much carbon they emit each year (‘Community Emission Level’, CEL), and how much carbon they have on their titled land (‘Community’ forest CO2 stock’, CFS). Guyana is still developing the methodology to monitor annual community emissions, and is test-casing which emission sources to include by balancing significance versus monitoring cost [26]. Since forest clearance for rotational farming or shifting cultivation forms no ‘permanent conversion from forest to non-forest use’ (it is left to regrow after some years of crop cultivation), Guyana does not categorize this as deforestation but as forest degradation, for which emission factors are being developed [26]. In the absence of numbers on annual community emissions, we enter low and high emission rates for CEL in Equation (1) to obtain the range of REDD+ revenue the average village could expect if it opts in to the national REDD+ program.
Our field-assessment of the average carbon density of titled community forest could affect the variable CFS, if found significantly different from the government’s preliminary estimate of 283.7 tC ha−1 (above + belowground carbon) for this region [18,33], and thereby the level of annual REDD+ payment (Equation (1)). Guyana has thus far used the interim carbon price set by Brazil’s Amazon Fund (US$5 per tCO2, [31]). We utilize the same carbon price in our analysis, and evaluate carbon price trends in the Discussion section.

2.4. Study Sites

The carbon assessment of mature forests that were used by FDP, and of unused ‘control’ forests, formed part of a larger study of human-wildlife dynamics in the context of socio-economic change, and the feasibility of large-scale environmental monitoring by FDP (‘Project Fauna’, 2007–2011, [34]). The assessment took place in Guyana’s Region 9, also known as The Rupununi, an area that is covering approximately 48,000 km2 of both the Amazon and Essequibo watersheds in southwest Guyana (Figure 1).
The Rupununi consists of a mostly flat-to-undulating landscape (~150 m above sea level, with mountain peaks up to 1000 masl) of tropical forest with defined boundaries to natural grassland savannah with scattered stunted trees, interspersed with small forest ‘islands’, and Mauritia flexuosa L.f. palms along creeks (more details in [34,35]).
Approximately 40 communities are scattered across the study area, ranging in population from around 60 to 1200, and predominantly located in lowland savanna close (<5 km) to the forest edge [34,35]. Nearly all the residents of the 15 villages that were included in this biomass study self-identified as being indigenous (predominantly Wapichan and Makushi). The people rely on their forests for swidden agriculture, building materials, small canoes, charcoal for clay brickmaking, firewood (typically slash from farms or dead wood in nearby forest), non-timber forest products (NTFP), and medicines [36]. Community-based forest management exists, but it is not well documented. In this sense it is more informal and based on tradition rather than law. Major forest management decisions, such as timber extraction and negotiation with the government and mining companies, are undertaken at the village and district levels (representing the North, South Central, and South Rupununi districts). Smaller-scale forest management and utilization, including most hunting and foraging activities, as well as small scale timber extraction, occur at the household level. For the purposes of this paper, we assume the community has made collective decisions over what kinds of activities are allowed across their lands.

2.5. Community REDD+ Revenue

Since annual emissions of individual villages were not available at the time of this study, we entered low and high village emission rates for the variable ‘Community Emission Level’ in Equation (1) to obtain the range of REDD+ revenue the average village could expect. We used ‘no emissions’ as the hypothetical lowest rate (generating highest revenue), and ‘0.1%’ as the highest rate. The latter rate was the maximum rate under the 2010–2015 Guyana-Norway agreement [31]. Under this agreement Guyana self-imposed a cap of 0.1% (instead of its reference level 0.242% [18]) to show its commitment to mitigating climate change, beyond which it would receive no revenue [31]. The UNFCCC threshold was still under discussion at the time of Guyana’s UN-submission [18]. As a further example, we present the revenue level when a community emits at the same rate as the national historical rate (0.049%, [18]).
In accordance with Project Fauna’s agreement with partner villages (to protect the anonymity of specific villages), here we provide mean regional results. Project Fauna has informed the individual villages of the size of their forest area and total standing carbon stock, to allow for calculating the revenue range of their specific village, an essential yet so far lacking piece of information for indigenous villages to make an informed decision (in line with the principles of FPIC) whether or not to join REDD+ (Overman and Fragoso, unpublished data).

2.6. Assessments of Carbon Stocks and Titled Forest Areas

Local indigenous technicians received three days of classroom and field training to assess biomass in mature forest plots (i.e., excluding successional forests recovering from rotational farming) that were located between 0 and 12 km around 15 villages, and at five control areas that were reported to be free of any human activities, at least in the recent past, as confirmed by subsequent onsite technician observations (‘undisturbed’, 15–40 km away from any village, Figure 1). Biomass plots in mature forest were selected in a stratified random way, by making use of previously established transects for the larger ‘Project Fauna’ study on human-wildlife dynamics. These transects had been inventoried for vegetation types by trained local technicians, which allowed for selecting mature forest for the biomass plots (for more details see [37]). Transect arrays around each village had been divided in two concentric zones, ‘near’ (0–6 km from village center) and ‘far’ (6–12 km), with four transects, each 4 km in length, within each zone [34]. Start point and bearing of the straight-line transects were randomly generated, but placement was stratified by a minimum of 3 km distance between adjacent transects. The 6 km boundary was selected as evidence has shown that most hunting activity, and thus most walking activity in forest occurs within 5 km of villages, while the 6–12 km zone was established to determine source-sink dynamics of hunted wildlife [35]. These forest zones were used to group plots and obtain average biomass per zone (0–6 km, 6–12 km and 15–40 km (controls) from village centers).
Aboveground biomass of forests was estimated by the local technicians for trees ≥10 cm diameter at breast height (dbh) in 564 plots of 10 m × 10 m on 111 transects (5.64 hectares, Figure 1), using the regression equation for moist tropical forest of IPCC [38], multiplied by 0.5 to derive above ground carbon densities. More details on the methodology, including the verification of technician estimates, can be found in [37]. A total of 386 plots were located in the 0–12 km village zone, and 178 plots in control areas. Above ground carbon stocks data for undisturbed plots and plots located within 0–12 km of a village center were compared statistically (ANOVA) after the data were log transformed using the stats package in R [39]. Areas of forest within titled lands were derived from Landsat imagery and raster counts of 30 × 30 m pixels in ArcGIS. The computation of forest areas did not allow for distinction between mature and secondary forests [37]. This constitutes a risk for overestimating carbon stocks from forest cover of titled areas, which is discussed in Section 4.2.

3. Results

3.1. Community REDD+ Revenue

Based on Equation (1) and the reported (above and belowground) carbon density for this region, 283.7 tC ha−1 [18,33], payment for the average village would fluctuate between US$166,000 and $284,000 per year, depending on the community’s emissions each year (Table 1). The $166,000, for example, is given by: (0.00242 − 0.00100) × 22,544 ha × 283.7 tC ha−1 × (44/12) × $5 (Equation (1)), where 0.00242 represents the national reference emission level (0.242%, [18]), 0.00100 is a hypothetical community emission level (0.1%), 22,544 ha is the area of titled forest for the average community, 283.7 tC ha−1 is the mean carbon density [18,33], (44/12) represents the conversion factor from C to CO2, and $5 represents the carbon price.
The range in gross REDD+ income for the average community (with 80 households) would equate to between ~$2100 and $3500 per household per year. In comparison, available estimates of household cash income were $300–600 per year (Table 1), while the minimum wage in Guyana was ~$2600 per year in 2017 [44].

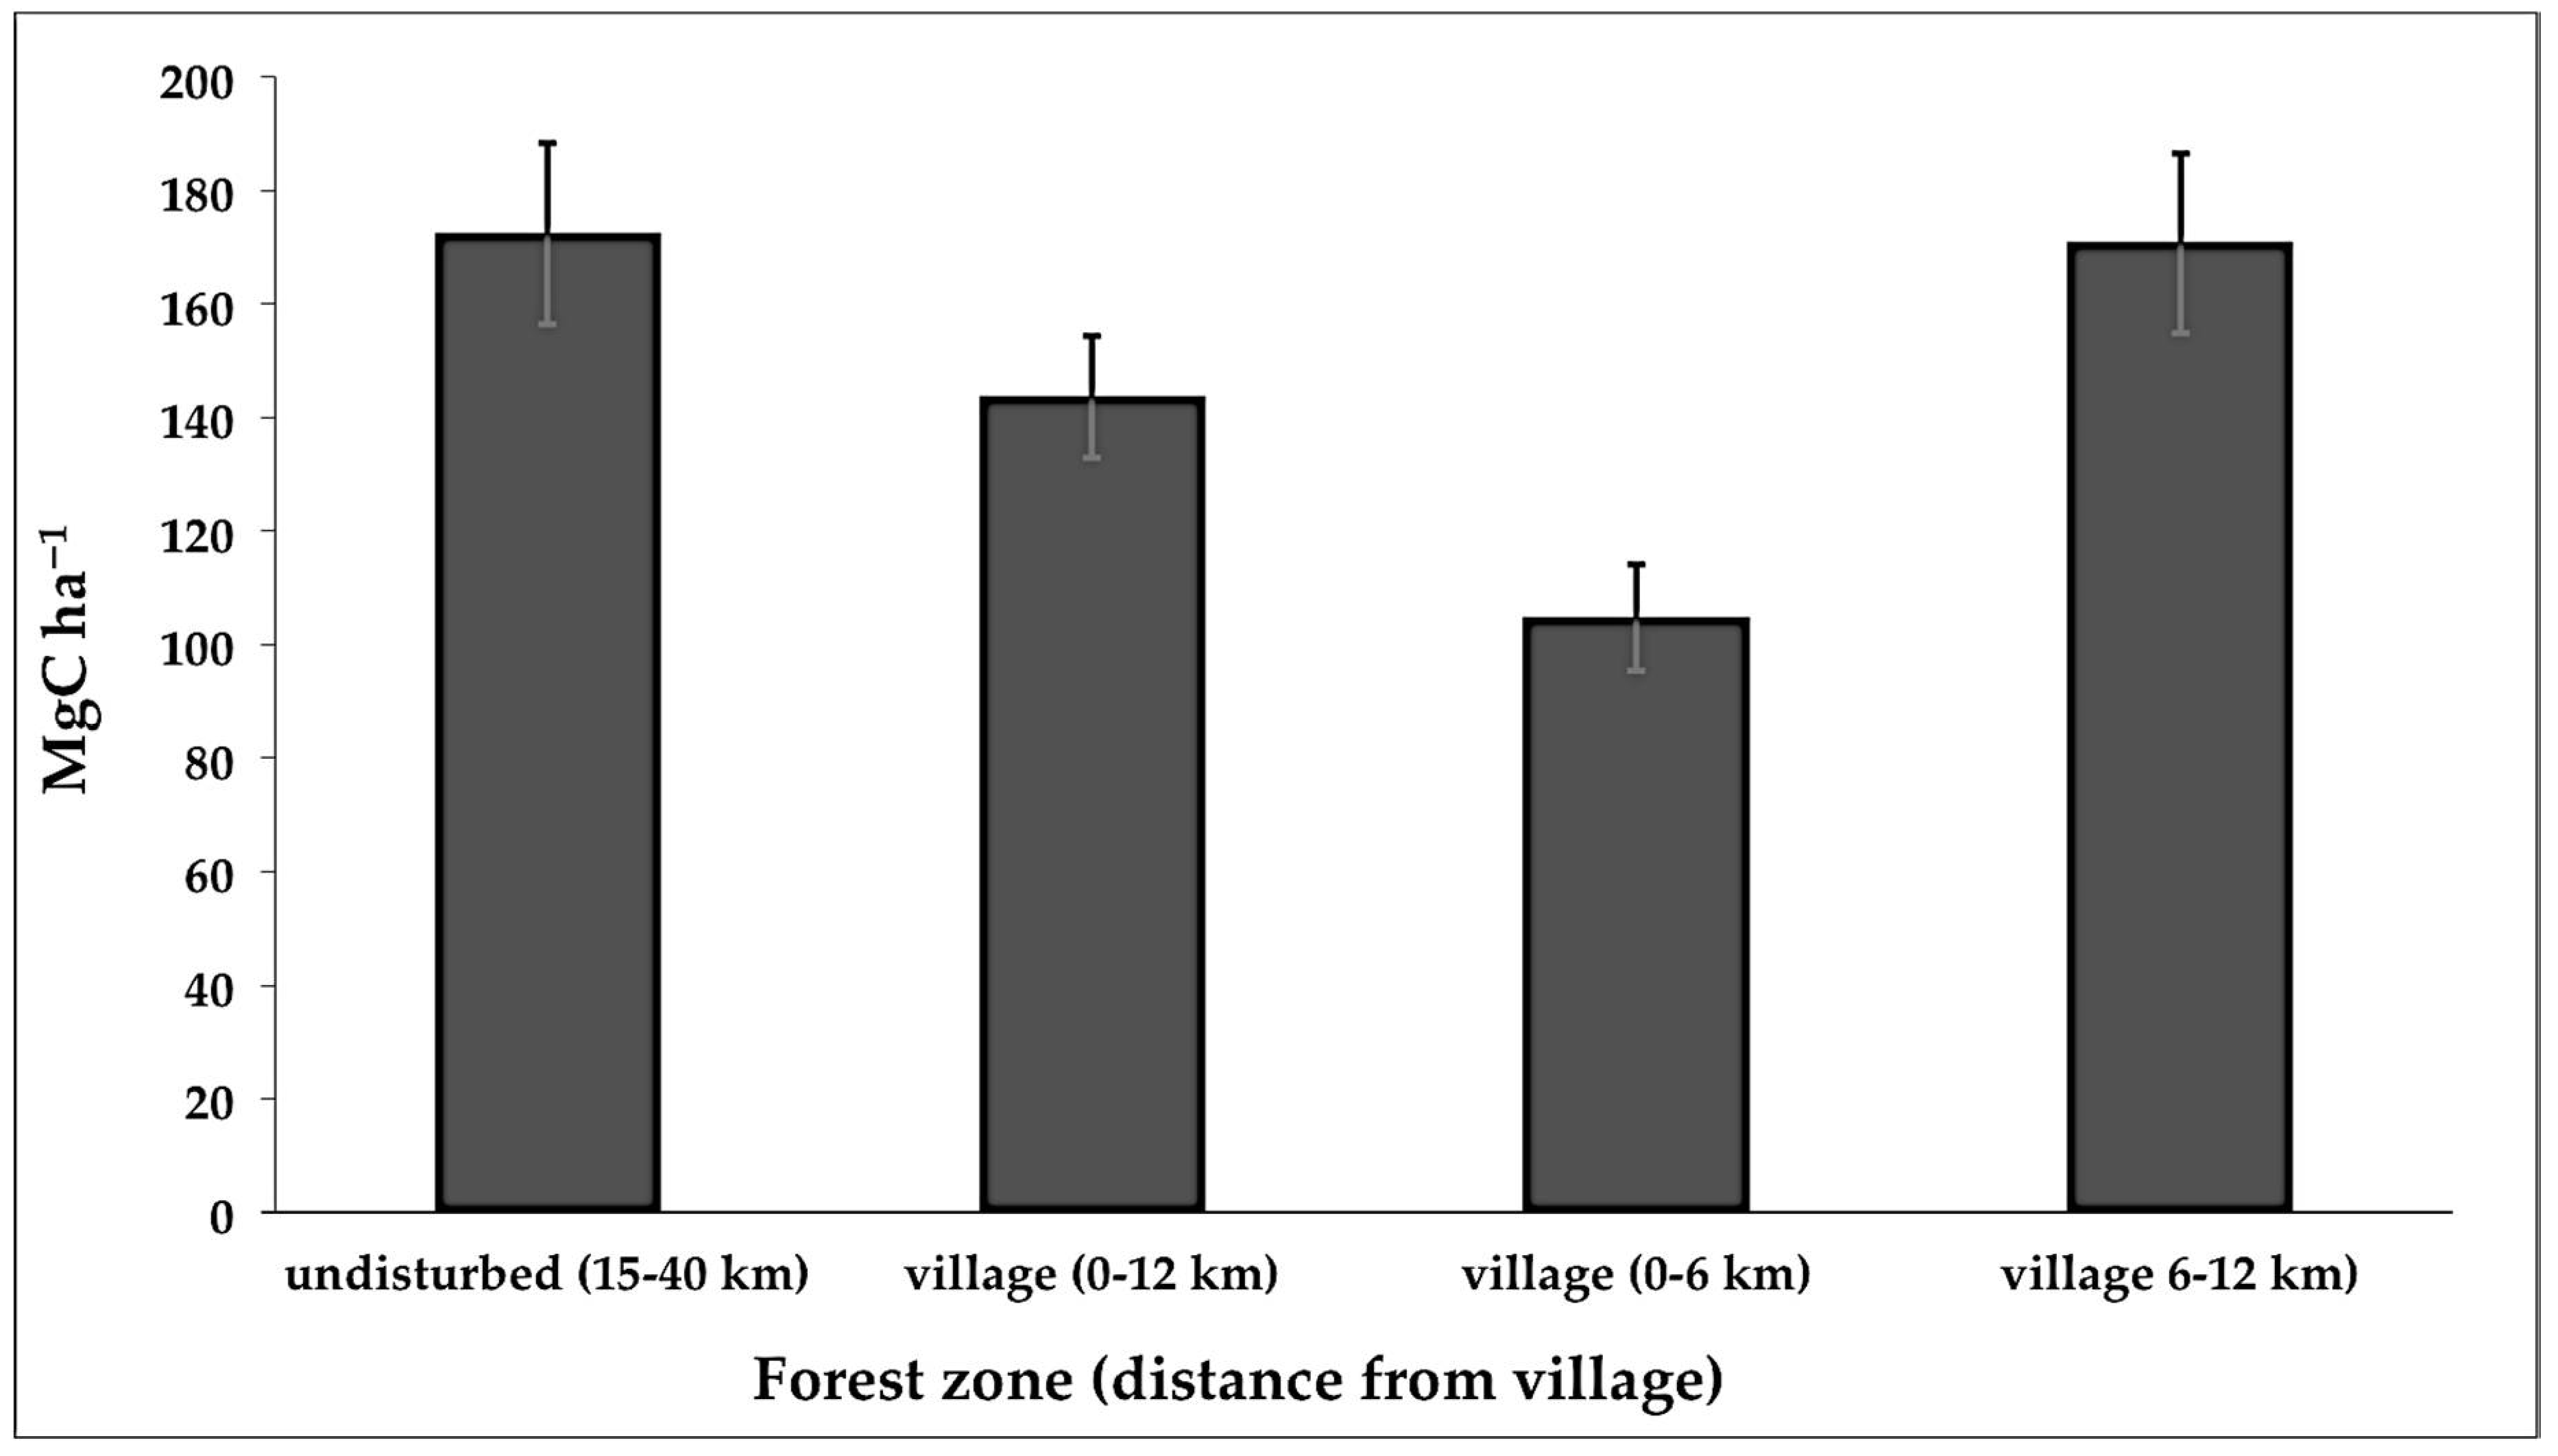
3.2. Community Carbon Impact

The aboveground living biomass component of mature forests without human activity in the region (‘Undisturbed’, 15–40 km away from any village) contained an average 172.4 Mg (mega gram, or metric ton) carbon per hectare (se (standard error) = 15.9, n = 178 plots, Figure 2, see also [37]).
Mature forests within a 12 km radius of the villages contained on average 17% less carbon per hectare than Undisturbed forest (143.6 tC ha−1, se = 10.8, n = 386 plots, p-value = 0.002). Further analysis revealed that the carbon impact is restricted to within a 6 km radius from villages, since the mean carbon density of forests that were located 6–12 km from village centers was statistically not different from that of more distant Undisturbed forest (170.5 vs. 172.4 tC ha−1, se = 15.9, n = 228 plots, p = 0.111). The mature forests within 0–6 km from villages contained an average 39% less carbon than Undisturbed forests (104.8 tC ha−1, se = 9.4, n = 158 plots, p < 0.001).
Landsat imagery analysis [37] revealed that, on average, 19.3% of communities’ titled forest area was located within 6 km of the village (including an unknown area of fallow forest), implying that at least 80.7% of indigenous titled forest areas had no measurable difference in stored carbon when compared to undisturbed forests. This means that the indigenous titled forests in the Rupununi contained on average at most 7.5% less carbon than forests untouched by people (39% × 19.3%). If, for example, half of the 19.3% was fallow forest, then the mature titled forest contained on average 3.76% less carbon than nearby forest untouched by people.

4. Discussion

4.1. Indigenous Impacts on Forests

To our knowledge for the first time, we provided an estimate of the average impact that 15 indigenous communities appear to have had over time on carbon stocks of adjacent mature forests beyond fallow areas. The average 39% lower carbon density of the 0-6km forest zone appears high, as it implies that more than a third of the biomass has been extracted from every hectare of mature forest within 6 km of village centers (i.e., beyond savanna and rotational farming areas). However, as mentioned, this impact is confined to less than ~20% of the titled forest area, which dilutes the overall impact on the titled forest to less than 7.5%. In addition, apart from larger sample sizes improving the accuracy, there may be potential selection bias around the choice of the 6 km boundary zone used to differentiate levels of forest use and related carbon stocks. It should also be realized that 39% of the biomass in tropical forest may be contained in just the 15 biggest trees per hectare [45], and that chainsaw logging has an inherent overall efficiency of only 5–12% (i.e., for every board produced, the equivalent of 8–19 more boards go up in CO2, [46,47,48], details in Supplementary Materials (Note S1)). There may have been several other factors of unknown magnitude that can have influenced results, such as possibly lower carbon density in natural forests bordering on savanna, cases where neighboring non-sampled communities use the same forest area, et cetera. Given these factors, the observed difference in carbon density appears modest for, on average, 75 year-old communities with 80+ households, the majority of whom are fully dependent on forests for their livelihoods (more details in Supplementary Materials (Note S1)). In sum, while the 39% difference was found to be statistically significant (p < 0.001), it appears confined to a small area which reduces the overall carbon stock of titled mature forest areas only slightly (below 7.5%) compared to nearby forest untouched by people, which may be negligable for carbon payments under REDD+.

4.1.1. Carbon Density of Southern Guyana Forest

The preliminary mean aboveground carbon density reported by the government for the study area (229.7 tC ha−1, [18,33]) was not supported by our study (172.4 tC ha−1 for Undisturbed forest, Figure 2), even after adding carbon from 5–10 cm dbh trees (4.4 tC ha−1, adopted from [45]), which we omitted: 176.8 tC ha−1. The difference is about a quarter less carbon per hectare (23%), which would imply 23% less revenue for indigenous communities in this region (‘Community’s forest CO2 stock’, Equation (1)). The observed lower carbon density of Undisturbed forest in the region is corroborated by another biomass assessment across the North Rupununi that used the same methodology as the GoG (166 tC ha−1, [49]), as well as by earlier assessments of the forests in southern Guyana [50]. Future government-planned biomass estimations in southern Guyana will reveal whether thusfar reported carbon densities for this region need adjustment.

4.1.2. Economic Pantropical Monitoring of Forest Emissions

Our Project Fauna study [34,37,51], and several others, e.g., [52,53,54,55,56,57,58], have shown that with short training periods, FDP can acquire the skills to estimate biomass, follow systematic work plans, handle GPS units, smartphones, and unmanned aerial vehicles (UAV, or drones) in the field, with similar accuracy as professionals at much lower costs. This supports the suggestion in the literature that more ground derived biomass data are needed from tropical forests to improve calibration of remote sensing (RS) estimates for different forest types, which has been hampered by field costs e.g., [59,60,61,62,63]. We describe how teams of local people with third-party verifiers could economically provide such data. A further 6–12 fold field cost reduction may be possible if forest carbon densities are derived from measuring only plot trees over 30 cm, or 20 cm, in diameter (approximately 83, resp. 155 trees per hectare, containing 75% resp. 85% of the carbon, instead of measuring all trees over 5 cm (~1000 per ha) [45]).
Once the RS signatures of the different forest types are ground-calibrated, maps can be created that more accurately describe the carbon density variation across tropical forests. This will improve the accuracy of calculating emissions from satellite-detected areas of deforestation across forest basins. When combined with rapid advances in RS technology (in both image data fusion and resolution e.g., [61,64,65,66,67,68]) and tree gap emission factors [48,69], this could have potential for economic monitoring of forest degradation emissions from logging across the tropics, remotely and objectively. Since global logging emissions are significant [69], this aids the credibility and feasibility of the REDD+ mechanism for climate change mitigation. Accurate countrywide monitoring of emissions by each forest concession holder (e.g., registered mining and logging concessions, FDP titled forest) would also contribute to transparent and equitable sharing of burdens and benefits of REDD+ among forest stakeholders.

4.2. National REDD+ and FDP

We found that Guyana’s approach towards implementing REDD+ nationally would produce a large financial benefit to FDP, equating to a 3.5–12 fold increase in cash income for the majority of households (Table 1). REDD+ would not only form a significant source of revenue, but has the potential to provide a stable revenue source, for all of the country’s indigenous communities with titled forest, independent of what other communities decide or emit, with funds to be allocated to self-identified development priorities.
We underline that these are gross revenue estimates from which, as yet unfinalized [20], REDD+ costs due by the village will be subtracted (Section 2.3), which could be significant. While not entirely overlapping with apparent communities’ costs in Guyana, a recent review of studies estimating different REDD+ costs found ‘transaction and implementation’ costs averaging US$ 3.39 tCO2−1 (range $0.03–$20.93) [70]. None of the 60 studies however, analysed REDD+ costs at the national (country) level (but used a ‘local empirical, global empirical, or global simulation’ approach), and the authors warned that available estimates were inadequate, suggesting an important gap in the literature [70]. We further note that REDD+’s high benefit is in large part due to extremely low current FDP levels of cash income ($300–600 yr−1), and that several policy issues still remain to be resolved in Guyana (see Supplementary Materials (Note S2)). Also, our REDD+ revenue figures will be slightly overestimated since our satellite imagery was unable to distinguish secondary from mature forest, implying that all of the forest cover in titled areas was regarded as mature forest in calculations of communities’ forest carbon stock. Recovering forest after swidden agriculture is, however, on average, a small proportion of total titled forest cover [26].

4.3. How Exceptional Is Guyana?

The beneficial nature of Guyana’s national REDD+ program for FDP is in distinct contrast to FDP experiences with many earlier REDD+ projects in other countries e.g., [8,17]. One reason is that Guyana’s, UN-approved, national REDD+ mechanism functions quite differently from REDD+ at the project level. For instance, national REDD+ is not subject to the structural difficulties of REDD+ projects (setting reference levels, national leakage, permanence [17]), since each country develops its reference level based on historical countrywide forest emissions, which serves as the baseline of normal emissions, per year. Any subsequent annual emissions below this base level reflect active reductions, and are traded as carbon credits [18,71]. Guyana does, however, appear to have three advantages over many other developing countries, which contribute to the level of positive outcomes of national REDD+ for FDP: comparatively high forest carbon density, HFLD status, and secure FDP tenure. We discuss these below.

4.3.1. Carbon Density

The reported average carbon density of Guyana’s forests (283.7 tC ha−1, [18]) is almost twice as high as the densities that were reported by other Amazon countries (Brazil, Colombia, Ecuador, [3]), implying twice less revenue per avoided hectare of deforestation in these latter countries. High carbon densities in Guiana Shield forests are consistent with research e.g., [72], although Guyana’s reported value for the south part of the country may need some downward adjustment in update reports to the UN (Section 4.1.1). Further, if carbon prices rise, due to the urgency of global emission reductions (e.g., to $40–80 tCO2−1 by 2020, [73,74]), such price increases would more than compensate lower carbon density forests in other countries.

4.3.2. High Forest Low Deforestation (HFLD)

Global REDD+ models aim to provide financial incentives to all tropical forest nations to join REDD+ to avoid international leakage of forest emissions [71,75]. However, if payments were only based on emission reductions, developing countries with historically low forest emission rates (HFLD countries) would have little incentive to join REDD+. Instead, they could be persuaded to accept offers from forest based industries that come under pressure in other REDD+ countries to operate in their (HFLD) forest, resulting in not a reduction, but a relocation or ‘leakage’ of emissions, thus invalidating REDD+ credits of the non-HFLD country [71]. In Guyana’s technically approved FREL submission to the UN [18,19], the Combined Incentive approach of Strassburg et al. [71] is adopted to develop a payment model. This model raises the reference level of HFLD countries as Guyana above their historical rate [18], which can result in substantial annual REDD+ payments at current emission rates [76]. These funds would enable Guyana to reward its FDP for emissions below the national reference level, instead of demanding resource use restrictions for (‘result-based’) payments. However, an argument should be made in favor of FDP as responsible forest users. Contrary to some perceptions, FDP have been shown to be a minor contributor to countries’ total forest emissions, not only in Guyana but also across continents [26,77,78,79]. We argue FDP would be an even smaller ‘emission driver’ (source of emissions) if emissions were not expressed per driver but per household. To illustrate, the average household working in the overall mining and logging sectors in Guyana emits 41, respectively, 20 times more CO2 from forest per year than the average FDP household (1% of the country’s total forest emissions is emitted by 11,000 FDP households, while 91% of the total is emitted by 23,000 jobs, i.e. households, in the overall wood sector and 13,000 jobs in mining [18,26,29,80,81]). The low emission lifestyle of FDP, for generations, indicates there is very little potential for emission reductions, i.e., results-based payments, with this driver, which would directly affect their livelihoods, and hence breach the minimal ‘no harm’ REDD+ Safeguard. Instead, it strongly supports the notion that FDP should benefit from REDD+ well beyond ‘no harm’, with establishment of solid and objective FDP safeguards, i.e., containing a ‘monitoring, reporting and verification’ aspect.
By contrast, there would be much more potential gain for the country in reducing the emissions of commercial forest uses (91% of total in Guyana [18]), which was recently found to generate large overall net profit along private supply chains, shared ~99:1 with the resource-owning country [76]). Commercial forest use (CFU) emissions may be reduced by ‘cleaning supply chains’ and moving commodity production out of primary forest e.g., [82,83], and by ‘cleaning profit chains’ to fund better forest management [76].

4.3.3. FDP Tenure

In the context of REDD+, settling FDP tenure rights has been described as an essential requisite before REDD+ implementation, so as to avoid land grabbing, regulate FDP resource use restrictions, and enable equitable REDD+ benefit sharing with FDP [13,14,15,16]. An assessment of Guyana’s UN-approved FREL submission [76], however, indicated that land grabbing appears unlikely to occur under national REDD+ because owning or acquiring standing forest would yield virtually no annual forest rent, whereas logging or clearing standing forest will substantially cost the owner, if not the state (see below). In addition, the frequently stated sequestration capacity of standing forest does not pass REDD+’s additionality criterion (i.e., the CO2 removal or reduction would not have happened without human effort/intervention). As such, the sequestration of standing forest is unlikely to generate credits, while sequestration credits from re/afforestation or enhanced regeneration with native species are small per hectare when compared to credits of avoided deforestation and degradation (between $9–101 ha−1 yr−1 at a $5 carbon price [84,85]).
Further, while CFUs are often hailed in terms of progress, employment, or national development, actual net revenue for a developing country can be quite small, e.g., $13 and 0.5 jobs per hectare for selective logging, and $4100 gross and 2.8 jobs per hectare for alluvial gold mining in Guyana, while costing $560, respectively, $5200 per hectare in foregone REDD+ revenue at $5 tCO2−1 [76]. Such figures make it harder for governments to grant commercial concessions on FDP lands, given that CFUs are typically associated with large and long-term social and environmental disruption for hundreds of citizens in FDP communities e.g., [86].
Lastly, higher carbon prices, such as the $40–80 required by 2020 stated by [73,74], may in fact generate tenure security, when lost REDD+ income from commercial forest damage becomes economically inhibitive for tropical forest nations (e.g., $41,000–83,000 ha−1 to deforest, and $4500–9000 to log a 284 tC ha−1 forest [71,76]).
Economic considerations and assessments in the context of national REDD+, as presented here and in concurrent work [76], may provide domestic leverage for forest governance change beneficial to FDP, since economic aspects often reflect the reality behind land use in the tropics [87]. Public general awareness of the economics of current forest governance may aid government and electorate decision-making in sovereign developing countries in a national REDD+ era, which would in all likelihood be beneficial for FDP livelihoods.

5. Conclusions

In contrast to many project-level experiences, our analysis shows that REDD+ implemented nationally in Guyana could have large annual financial benefits for FDP with legal forest tenure, equivalent to 3.5–12 fold increases in cash income for the majority of housholds. While legal forest tenure is not common for many FDP in the tropics, and Guyana has some additional comparative advantages (high forest carbon density, HFLD), we suggest that these advantages do not appear to be essential for national REDD+ to have positive outcomes for FDP in other countries. Concurrent work [76] suggests how policy can eliminate incentives to land grabbing, which is perceived to be a main argument for FDP tenure. Restrictions on FDP resource use would also appear to be unlikely as FDP emit little when compared to commercial forest emissions, and such restrictions would directly breach UN social safeguard obligations. These and other presented lines of economic evidence (e.g., modest net per hectare state benefits from CFU, extremely skewed private-public sharing of net revenue on forest-based resources, inhibitive forest damage costs at rising carbon prices, REDD+’s competitiveness with CFUs at $5 tCO2−1 [76]), may motivate forest governance change domestically in sovereign developing countries in a national REDD+ era, and ease facilitating FDP tenure. Advances in remote sensing, when combined with carbon ground calibration through FDP partnerships, suggest large potential for accurate economic monitoring of tropical forest emissions under a global REDD+ mechanism.
The average carbon density of mature forest managed by 15 indigenous communities in Guyana appeared locally substantially less (39%) than that of nearby unmanaged forest. The lower carbon density is however modest when considering ecological and socioeconomic attributes, and constitutes a small (less than 7.5%) reduction in overall carbon stocks of titled forest areas when compared to unmanaged forest, which may be negligable for carbon payments under REDD+.

Supplementary Materials

The following are available online at https://www.mdpi.com/1999-4907/9/5/231/s1, S1: Socio-economic and ecological factors behind indigenous carbon impact, S2: Some pending aspects of Guyana’s land titling and Opt-In Mechanism Strategy.

Author Contributions

H.O. conceived, researched and analyzed this article, with contributions from N.B., A.R.C., J.B.L. and J.M.V.F., N.B. prepared biomass data, A.R.C. performed statistical analysis and developed Figure 1. H.O. led writing with significant contributions from N.B., A.R.C., J.B.L. and J.M.V.F. in completing the manuscript.

Acknowledgments

The US National Science Foundation (Grant BE/CNH 05 08094) and the Gordon and Betty Moore Foundation (Grant 2054.01) provided funding for the biomass project, which was designed by the late K.Y. (‘Kye’) Epps of Stanford University. The larger ‘Project Fauna’ study was conceived by J.M.V.F. and K.M. Silvius. We thank the Guyana Environmental Protection Agency and the Ministry of Indigenous Peoples for authorizing the field study. The Iwokrama International Centre for Rainforest Conservation and Development, the North Rupununi District Development Board, and the South Central and Deep South Districts Toshaos Council acted as in-country partners and provided important logistic support. Many thanks go to the Makushi and Wapichan technicians and all other Project Fauna personnel, and Takuya Iwamura for remote sensing data on titled forest areas. This article is dedicated to the memory of our colleague Kye Epps (Stanford University).

Conflicts of Interest

The authors declare no conflict of interest.

References

  1. United Nations Framework Convention on Climate Change. Safeguards Factsheet. 2016. Available online: http://redd.unfccc.int/fact-sheets/safeguards.html (accessed on 10 October 2016).
  2. United Nations Framework Convention on Climate Change. Adoption of the Paris Agreement. COP 21. 2015. Available online: http://unfccc.int/resource/docs/2015/cop21/eng/l09r01.pdf (accessed on 20 September 2017).
  3. United Nations Framework Convention on Climate Change. Country Submissions. 2015. Available online: http://redd.unfccc.int/submissions.html?topic=6 (accessed on 20 September 2017).
  4. Mbatu, R.S. REDD+ research: Reviewing the literature, limitations and ways forward. For. Policy Econ. 2016, 73, 140–152. [Google Scholar] [CrossRef]
  5. Rights and Resources Initiative. Indigenous Peoples and Local Community Tenure in the INDCs. Status and Recommendations. 2016. Available online: http://rightsandresources.org/wp-content/uploads/2016/06/Indigenous-Peoples-and-Local-Community-Tenure-in-the-INDCs_RRI_April-2016_Summary.pdf (accessed on 2 August 2017).
  6. Rights and Resources Initiative. Community Rights and Tenure in Country Emission Reduction Programs. Status and Risks for the FCPF Carbon Fund. 2016. Available online: http://rightsandresources.org/wp-content/uploads/2016/06/RRI_Community-Rights-and-Tenure-in-Country-Emission-Reduction-Programs_June-2016.pdf (accessed on 2 August 2017).
  7. Newton, P.; Miller, D.C.; Byenkya, M.A.A.; Agrawal, A. Who are forest-dependent people? A taxonomy to aid livelihood and land use decision-making in forested regions. Land Use Policy 2016, 57, 388–395. [Google Scholar] [CrossRef]
  8. Sills, E.O.; Atmadja, S.S.; de Sassi, C.; Duchelle, A.E.; Kweka, D.L.; Resosudarmo, I.A.P.; Sunderlin, W.D. (Eds.) REDD+ on the Ground: A Case Book of Subnational Initiatives across the Globe; CIFOR: Bogor, Indonesia, 2014. [Google Scholar]
  9. Friends of the Earth. The Great REDD Gamble. 2014. Available online: http://www.foei.org/wp-content/uploads/2014/09/The-great-REDD-gamble.pdf (accessed on 28 September 2015).
  10. World Rainforest Movement. REDD: A Collection of Conflicts, Contradictions and Lies. 2015. Available online: http://wrm.org.uy/wp-content/uploads/2014/12/REDD-A-Collection-of-Conflict_Contradictions_Lies_expanded.pdf (accessed on 26 August 2015).
  11. Global Alliance Against Redd. 2016. Available online: http://no-redd.com (accessed on 20 July 2016).
  12. No REDD in Africa Network. 2016. Available online: http://no-redd-africa.org (accessed on 20 July 2016).
  13. Sunderlin, W.D.; Larson, A.M.; Duchelle, A.E.; Resusodarmo, I.A.P.; Huynh, T.B.; Awono, A.; Dokken, T. How are REDD+ proponents addressing tenure problems? Evidence from Brazil, Cameroon, Tanzania, Indonesia, and Vietnam. World Dev. 2014, 55, 37–52. [Google Scholar] [CrossRef]
  14. Larson, A.M.; Brockhaus, M.; Sunderlin, W.D.; Duchelle, A.; Babon, A.; Dokken, T.; Pham, T.; Resosudarmo, I.A.P.; Selaya, G.; Awono, A.; et al. Land tenure and REDD+: The good, the bad and the ugly. Glob. Environ. Chang. 2013, 23, 678–689. [Google Scholar] [CrossRef]
  15. Loft, L.; Ravikumar, A.; Gebara, M.F.; Pham, T.T.; Resosudarmo, I.A.P.; Assembe, S.; Gonzales Tovar, J.; Mwangi, E.; Andersson, K. Taking stock of carbon rights in REDD+ candidate countries: Concept meets reality. Forests 2015, 6, 1031–1060. [Google Scholar] [CrossRef]
  16. Duchelle, A.E.; de Sassi, C.; Jagger, P.; Cromberg, M.; Larson, A.M.; Sunderlin, W.D.; Atmadja, S.S.; Resusodarmo, I.A.P.; Pratama, C.D. Balancing carrots and sticks in REDD+: Implications for social safeguards. Ecol. Soc. 2017, 22, 2. [Google Scholar] [CrossRef]
  17. Fischer, R.; Hargita, Y.; Günter, S. Insights from the ground level? A content analysis review of multi-national REDD+ studies since 2010. For. Policy Econ. 2015, 66, 47–58. [Google Scholar] [CrossRef]
  18. Government of Guyana. The Reference Level for Guyana’s REDD+ Program. 2015. Available online: http://redd.unfccc.int/files/guyanas_proposal_for_reference_level_for_redd__-_final_sept_2015.pdf (accessed on 23 October 2015).
  19. United Nations Framework Convention on Climate Change. Report on the Technical Assessment of the Proposed Forest Reference Emission Level of Guyana Submitted in 2014. 2015. Available online: http://unfccc.int/resource/docs/2015/tar/guy.pdf (accessed on 22 November 2016).
  20. Office of the President. Draft Opt-In Mechanism Strategy. Draft for Discussion; 2014. Available online: http://www.lcds.gov.gy/index.php/documents/reports/local/draft-opt-in-strategy (accessed on 12 October 2017).
  21. Nepstad, D.; Schwartzman, S.; Bamberger, B.; Santilli, M.; Ray, D.; Schlesinger, P.; Lefebvre, P.; Alencar, A.; Prinz, E.; Fiske, G.; et al. Inhibition of Amazon deforestation and fire by parks and indigenous lands. Conserv. Biol. 2006, 20, 65–73. [Google Scholar] [CrossRef] [PubMed]
  22. Rights and Resources Initiative. Recognizing Indigenous and Community Rights. Priority Steps to Advance Development and Mitigate Climate Change. 2014. Available online: http://www.rightsandresources.org/wp-content/uploads/Securing-Indigenous-and-Communtiy-Lands_Final_Formatted.pdf (accessed on 9 August 2016).
  23. Stevens, C.; Winterbottom, R.; Springer, J.; Reytar, K. Securing Rights, Combatting Climate Change; World Resources Institute/Rights and Resources Initiative: Washington, DC, USA, 2014. [Google Scholar]
  24. Guyana Bureau of Statistics. Compendium 2 Population Composition. 2016. Available online: http://www.statisticsguyana.gov.gy/census.html#comp (accessed on 23 January 2018).
  25. Bulkan, J. ‘Original lords of the soil’? The erosion of Amerindian territorial rights in Guyana. Environ. His. 2016, 22, 351–391. [Google Scholar] [CrossRef]
  26. Guyana Forestry Commision and INDUFOR Asia Pacific. Guyana REDD+ Monitoring Reporting & Verification System (MRVS). Year 5 Summary Report. 1 January 2014–31 December 2014. Version 1; 2015. Available online: http://www.forestry.gov.gy/wp-content/uploads/2015/10/MRVS-Summary-Report-Year-51.pdf (accessed on 27 October 2015).
  27. Government of Guyana. Amerindian Act 2006. Act No 6 of 2006; 2006. Available online: http://parliament.gov.gy/documents/acts/4680-act_no_6_of_2006.pdf (accessed on 5 October 2013).
  28. Da Fonseca, G.A.B.; Rodrigues, C.M.; Midgley, G.; Busch, J.; Hannah, L. Mittermeier R.A. No forest left behind. PLoS Biol. 2007, 5, e216. [Google Scholar] [CrossRef] [PubMed]
  29. CIA. The World Factbook. 2015. Available online: https://www.cia.gov/library/publications/the-world-factbook/geos/gy.html (accessed on 6 November 2016).
  30. Forest Carbon Partnership Facility. REDD+ Country Participants. 2017. https://www.forestcarbonpartnership.org/redd-countries-1 (accessed on 20 September 2017).
  31. Joint Concept Note. Joint Concept Note on REDD Cooperation between Guyana and Norway. Third Update. 2015. Available online: http://www.regjeringen.no/en/aktuelt/norge-vil-gi-300-millioner-til-guyana/id2410147/ (accessed on 26 May 2015).
  32. The REDD Desk. REDD in Guyana. 2016. Available online: http://theredddesk.org/countries/guyana (accessed on 23 April 2016).
  33. Brown, S.; Goslee, K.; Casarim, F.; Harris, N.L.; Petrova, S. Sampling Design and Implementation Plan for Guyana’s REDD+ Forest Carbon Monitoring System (FCMS): Version 2. Submitted by Winrock International to the Guyana Forestry Commission; 2014. Available online: http://www.forestry.gov.gy/Downloads/Guyana_Sampling_Design_and_Implementation_Plan_for_FCMS.pdf (accessed on 26 February 2015).
  34. Luzar, J.B.; Silvius, K.M.; Overman, H.; Giery, S.T.; Read, J.M.; Fragoso, J.M.V. Large-scale environmental monitoring by indigenous peoples. BioScience 2011, 61, 771–781. [Google Scholar] [CrossRef]
  35. Read, J.M.; Fragoso, J.M.V.; Silvius, K.M.; Luzar, J.; Overman, H.; Cummings, A.; Giery, S.T.; Flamarion de Oliveira, L. Space, place, and hunting patterns among indigenous peoples of the Guyanese Rupununi region. J. Latin Am. Geogr. 2010, 9, 213–243. [Google Scholar] [CrossRef]
  36. Cummings, A.R. For Logs, for Traditional Purposes and for Food: Identification of Multiple-Use Plant Species of Northern Amazonia and an Assessment of Factors Associated with Their Distribution. Ph.D. Dissertation, Syracuse University, Syracuse, NY, USA, 2013. [Google Scholar]
  37. Butt, N.; Epps, K.; Overman, H.; Iwamura, T.; Fragoso, J.M.V. Assessing carbon stocks using indigenous peoples’ field measurements in Amazonian Guyana. For. Ecol. Manag. 2015, 338, 191–199. [Google Scholar] [CrossRef]
  38. Intergovernmental Panel on Climate Change (IPCC). Good Practice Guidance for Land Use, Land-Use Change and Forestry; Penman, J., Gytarsky, M., Hiraishi, T., Krug, T., Kruger, D., Pipatti, R., Buendia, L., Miwa, K., Ngara, T., Tanabe, K., et al., Eds.; IPCC/IGES: Hayama, Japan, 2003. [Google Scholar]
  39. R Development Core Team. R: A Language and Environment for Statistical Computing; R Development Core Team: Vienna, Austria, 2016; ISBN 3-900051-07-0. [Google Scholar]
  40. Inter-American Institute for Cooperation on Agriculture. Workshop on the Production, Processing and Marketing of Peanuts in the Rupununi, Region 9. Workshop Proceedings and Plan of Action. 2000. Available online: https://books.google.com.br/books?id=_McqAAAAYAAJ&pg=PP1&lpg=PP1&dq=Inter-American+Institute+for+Cooperation+on+Agriculture+2000+Workshop+on+the+production,+processing+and+marketing+of+peanuts+in+the+rupununi,+Region+9.+Workshop+proceedings+and+plan+of+action.+Feb+25-28,+2000.&source=bl&ots=Kkocb5AkFd&sig=ZdoJZ5sRb8O_lMbFHXsIaPCGKi4&hl=en&sa=X&ved=0ahUKEwix0Mist5jKAhVLdj4KHS-MDLgQ6AEIIDAA#v=onepage&q=income&f=false (accessed on 23 March 2017).
  41. Xavier, B. Community Participation in the Management of the Cock-of-the-Rock as an Eco-tourism Initiative. Master’s Thesis, University of Guyana, Georgetown, Guyana, 2007. [Google Scholar]
  42. Conservation International-Guyana. The Rupununi Economic and Ecological Baseline Report. 2015. Available online: http://conservation.org.gy/publications/Economic_Baseline_report.pdf (accessed on 23 March 2017).
  43. Skoufias, E. A Poverty Map for Guyana; World Bank: Washington, DC, USA, 2005. [Google Scholar]
  44. Guyana Chronicle. New Minimum Wage Order. 2016. Available online: http://guyanachronicle.com/2016/11/24/new-minimum-wage-order (accessed on 6 July 2016).
  45. Chave, J.; Condit, R.; Lao, S.; Caspersen, J.; Foster, R.; Hubbell, S. Spatial and temporal variation of biomass in a tropical forest: Results from a large census plot in Panama. J. Ecol. 2003, 91, 240–252. [Google Scholar] [CrossRef]
  46. Kerrett, R.; Wit, M. Chainsaw Milling in Guyana: A Synopsis of the Issues; Tropenbos International: Wageningen, The Netherlands, 2009. [Google Scholar]
  47. Trevin, J.; Nasi, R. Forest Law Enforcement and Governance and Forest Practices in Guyana; CIFOR/IWOKRAMA: Bogor, Indonesia, 2009. [Google Scholar]
  48. Pearson, T.; Brown, S.; Casarim, F. Carbon emissions from tropical forest degradation caused by logging. Environ. Res. Lett. 2014, 9. [Google Scholar] [CrossRef]
  49. Sabogal, D.; Global Canopy Programme, Oxford, UK. Personal communication, 2015.
  50. Ter Steege, H.; Hammond, D.S. Character convergence, diversity and disturbance in a tropical rainforest in Guyana. Ecology 2001, 82, 3197–3212. [Google Scholar] [CrossRef]
  51. Fragoso, J.M.V.; Levi, T.; Oliveira, L.F.B.; Luzar, J.B.; Overman, H.; Read, J.M.; Silvius, K.M. Line transect surveys under detect terrestrial mammals: Implications for the sustainability of subsistence hunting. PLoS ONE 2016, 11, e0152659. [Google Scholar] [CrossRef] [PubMed]
  52. Skutsch, M. (Ed.) Community Forest Monitoring for the Carbon Market; Opportunities under REDD; Earthscan: London, UK, 2011; 186p. [Google Scholar]
  53. Danielsen, F.; Adrian, T.; Brofeldt, S.; van Noordwijk, M.; Poulsen, M.K.; Rahayu, S.; Rutishauser, E.; Theilade, I.; Widayati, A.; The An, N.; et al. Community monitoring for REDD+: International promises and field realities. Ecol. Soc. 2013, 18, 41. [Google Scholar] [CrossRef]
  54. Paneque-Gálvez, J.; McCall, M.K.; Napoletano, B.M.; Serge, A.; Wich, S.A.; Pin Koh, L. Small drones for community-based forest monitoring: An assessment of their feasibility and potential in tropical areas. Forests 2014, 5, 1481–1507. [Google Scholar] [CrossRef]
  55. Bellfield, H.; Sabogal, D.; Goodman, L.; Leggett, M. Case study report: Community-based monitoring systems for REDD in Guyana. Forests 2015, 6, 133–156. [Google Scholar] [CrossRef]
  56. Venter, M.; Venter, O.; Edwards, W.; Bird, M.I. Validating community-led forest biomass assessments. PLoS ONE 2015, 10, e0130529. [Google Scholar] [CrossRef] [PubMed]
  57. Cummings, A.R.; McKee, A.; Kulkarni, K.; Markandey, N. The rise of UAVs. Photogramm. Eng. Remote Sens. 2017, 83, 317–325. [Google Scholar] [CrossRef]
  58. Cummings, A.R.; Cummings, G.R.; Hamer, E.; Moses, P.; Norman, Z.; Captain, V.; Bento, R.; Butler, K. Developing a UAV-based monitoring program with Indigenous Peoples. J. Unmanned Vehicle Syst. 2017. [Google Scholar] [CrossRef]
  59. Asner, G.P.; Mascaro, J. Mapping tropical forest carbon: Calibrating plot estimates to a simple LiDAR metric. Remote Sens. Environ. 2014, 140, 614–624. [Google Scholar] [CrossRef]
  60. Mitchard, E.T.A.; Feldpausch, T.R.; Brienen, R.J.W.; Lopez-Gonzalez, G.; Monteagudo, A.; Baker, T.R.; Lewis, S.L.; Lloyd, J.; Quesada, C.A.; Gloor, M.; et al. Markedly divergent estimates of Amazon forest carbon density from ground plots and satellites. Glob. Ecol. Biogeogr. 2014. [Google Scholar] [CrossRef] [PubMed] [Green Version]
  61. Goetz, S.J.; Hansen, M.; Houghton, R.A.; Walker, W.; Laporte, N.; Busch, J. Measurement and monitoring needs, capabilities and potential for addressing reduced emissions from deforestation and forest degradation under REDD+. Environ. Res. Lett. 2015, 123001. [Google Scholar] [CrossRef]
  62. Schimel, D.; Pavlick, R.; Fisher, J.B.; Asner, G.P.; Saatchi, S.; Townsend, P.; Miller, C.; Frankenberg, C.; Hibbard, K.; Cox, P. Observing terrestrial ecosystems and the carbon cycle from space. Glob. Chang. Biol. 2015. [Google Scholar] [CrossRef] [PubMed]
  63. Avitabile, V.; Herold, M.; Heuvelink, G.B.M.; Lewis, S.L.; Phillips, O.L.; Asner, G.P.; Armston, J.; Ashton, P.S.; Banin, L.; Bayol, N.; et al. An integrated pan-tropical biomass map using multiple reference datasets. Glob. Chang. Biol. 2016, 22, 1406–1420. [Google Scholar] [CrossRef] [PubMed] [Green Version]
  64. Reiche, J.; Souza, C.M.; Hoekman, D.H.; Verbesselt, J.; Persaud, H.; Herold, M. Feature level fusion of multi-temporal ALOS PALSAR and Landsat data for mapping and monitoring of tropical deforestation and forest degradation. IEEE J. Sel. Top. Appl. Earth Obs. Remote Sens. 2013, 6, 2159–2173. [Google Scholar] [CrossRef]
  65. Mitchell, A. Joint GFOI/GOFC-GOLD R&D Expert Workshop on Approaches to Monitoring Forest Degradation for REDD+. University of Wageningen, 2014. Available online: http://www.gfoi.org/wp-content/uploads/2015/03/GFOI-GOFCGOLD_RDExpertWS2_Report.pdf (accessed on 27 September 2017).
  66. DigitalGlobe. The DigitalGlobe Constellation 2017. Available online: https://dg-cms-uploads-production.s3.amazonaws.com/uploads/document/file/223/Constellation_Brochure_forWeb.pdf (accessed on 15 August 2017).
  67. Planet. Monitor and Manage Global Forestry. 2017. Available online: https://www.planet.com/products/hi-res-monitoring/ (accessed on 15 August 2017).
  68. Schulte to Bühne, H.; Pettorelli, N. Better together: Integrating and fusing multispectral and radar satellite imagery to inform biodiversity monitoring, ecological research and conservation science. Methods Ecol. Evolut. 2017. [Google Scholar] [CrossRef]
  69. Pearson, T.R.H.; Brown, S.; Murray, L.; Sidman, G. Greenhouse gas emissions from tropical forest degradation: An underestimated source. Carbon Balance Manag. 2017, 12. [Google Scholar] [CrossRef] [PubMed]
  70. Rakatama, A.; Pandit, R.; Ma, C.; Iftekhar, S. The costs and benefits of REDD+: A review of the literature. For. Policy Econ. 2017, 75, 103–111. [Google Scholar] [CrossRef]
  71. Strassburg, B.; Turner, R.K.; Fisher, B.; Schaeffer, R.; Lovett, A. Reducing emissions from deforestation—The “combined incentives” mechanism and empirical simulations. Glob. Environ. Chang. 2009, 19, 265–278. [Google Scholar] [CrossRef]
  72. Ter Steege, H.; Pitman, N.C.A.; Phillips, O.L.; Chave, J.; Sabatier, D.; Duque, A.; Molino, J.; Prévost, M.; Spichiger, R.; Castellanos, H.; et al. Continental-scale patterns of canopy tree composition and function across Amazonia. Nature 2006, 443, 444–447. [Google Scholar] [CrossRef] [PubMed]
  73. Carbon Tracker Initiative, Climate Action Tracker Consortium, Potsdam Institute for Climate Impact, Yale University. 2020 the Climate Turning Point. 2017. Available online: http://www.mission2020.global/2020%20The%20Climate%20Turning%20Point.pdf (accessed on 10 July 2017).
  74. Carbon Pricing Leadership Coalition. Report of the High-Level Commission on Carbon Prices. Commission Chairs J. Stiglitz and N. Stern. 2017. Available online: https://static1.squarespace.com/static/54ff9c5ce4b0a53decccfb4c/t/59244eed17bffc0ac256cf16/1495551740633/CarbonPricing_Final_May29.pdf (accessed on 6 June 2017).
  75. May-Tobin, C. Points of Reference: Finding Common Ground among Reference Level Approaches to Move REDD+ Forward; Union of Concerned Scientists: Cambridge, MA, USA, 2011. [Google Scholar]
  76. Overman, H.; Cummings, A.R.; Luzar, J.B.; Fragoso, J.M.V. National REDD+ Outcompetes Gold and Logging: The Potential of Cleaning Profit Chains. PeerJ 2018. [Google Scholar] [CrossRef]
  77. De Sy, V.; Herold, M.; Achard, F.; Beuchle, R.; Clevers, J.G.P.W.; Lindquist, E.; Verchot, L. Land use patterns and related carbon losses following deforestation in South America. Environ. Res. Lett. 2015, 10, 124004. [Google Scholar] [CrossRef]
  78. Elias, P.; May-Tobin, C. Tropical forest regions. In What’s Driving Tropical Deforestation Today? The Root of the Problem; Boucher, D., Elias, P., Lininger, K., May-Tobin, C., Roquemore, S., Saxon, E., Eds.; Union of Concerned Scientists: Cambridge, MA, USA, 2011. [Google Scholar]
  79. Houghton, R.A. How well do we know the flux of CO2 from land-use change? Tellus 2010, 62, 337–351. [Google Scholar] [CrossRef]
  80. Guyana Geology and Mines Commission. Guyana’s Gold and Diamond Mining Subsector. Economic and Legal Framework. Presentation (W. Alleyne) to UN Environmental Program. 2010. Available online: http://unep.org/chemicalsandwaste/Portals/9/Mercury/Documents/ASGM/Presentations_Forum/Day%202/guyana's_gold_and_diamond.pdf (accessed on 25 September 2015).
  81. Guyana Forestry Commission. Forest Sector Information Report January–June 2014. 2014. Available online: http://www.forestry.gov.gy/Downloads/Forest_Sector_Information_Report_January_to_June_2014.pdf (accessed on 21 May 2015).
  82. Boucher, D.; Elias, P.; Lininger, K.; May-Tobin, C.; Roquemore, S.; Saxon, E. (Eds.) The Root of the Problem. What Is Driving Tropical Deforestation Today? 2011. Available online: http://www.ucsusa.org/sites/default/files/legacy/assets/documents/global_warming/UCS_Rooto ftheProblem_DriversofDeforestation_FullReport.pdf (accessed on 29 September 2015).
  83. Strassburg, B.B.N.; Latawiec, A.E.; Barioni, L.G.; Nobre, C.A.; da Silva, V.P.; Valentim, J.F.; Vianna, M.; Assad, E.D. When enough should be enough: Improving the use of current agricultural lands could meet production demands and spare natural habitats in Brazil. Glob. Environ. Chang. 2014, 28, 84–97. [Google Scholar] [CrossRef] [Green Version]
  84. Poorter, L.; Bongers, F.; Mitchell Aide, T.; Almeyda Zambrano, A.M.; Balvanera, P.; Becknell, J.M.; Boukili, V.; Brancalion, P.H.S.; Broadbent, E.N.; Chazdon, R.L.; et al. Biomass resilience of Neotropical secondary forests. Nature 2016. [Google Scholar] [CrossRef] [PubMed]
  85. Baccini, A.; Walker, W.; Carvalho, L.; Farina, M.; Sulla-Menashe, D.; Houghton, R.A. Tropical forests are a net carbon source based on aboveground measurements of gain and loss. Science 2017. [Google Scholar] [CrossRef] [PubMed]
  86. Colchester, M.; LaRose, J.; James, K. Mining and Amerindians in Guyana; The North-South Institute: Ottawa, ON, Canada, 2002. [Google Scholar]
  87. Lambin, E.F.; Turner, B.L.; Geist, H.J.; Agbola, S.B.; Angelsen, A.; Bruce, J.W.; Coomes, O.T.; Dirzo, R.; Fischer, G.; Folke, C.; et al. The causes of land-use and land-cover change: Moving beyond the myths. Glob. Environ. Chang. 2001, 11, 261–269. [Google Scholar] [CrossRef]
Figure 1. Study area with savannah and forest cover, indigenous titled lands, and village and control transects where biomass was estimated.
Forests 09 00231 g001
Figure 2. Estimates of mean aboveground carbon density in forests without human activities (‘undisturbed’), compared to mature forests around 15 indigenous villages in southern Guyana.
Forests 09 00231 g002
Table 1. Gross annual Reducing Emissions from Deforestation and forest Degradation (REDD+) revenue for the average indigenous community (n = 15) and household equivalent under different emission scenarios vs. current household income.
Emission ScenarioEmission RateAnnual Revenue (US$)
Average Community (22,544 ha Titled Forest, se. 2414)Per Household (Mean 80, se. 13.3)
National historical rate (2001–2012)0.049%226,3002830
Maximum rate (beyond which payments may stop a)0.100%166,5002080
No emissions0.000%283,7503550
Mean annual household cash income estimates b 300–600
Costs of clear-felling 1 ha intact forest c 520154
a Under the 2010–2015 Guyana-Norway agreement, Guyana self-imposed a cap of 0.1% (instead of its reference level 0.242%, [18]) to show its commitment to mitigating climate change, beyond which it would receive no revenue [31]. The UNFCCC threshold was still under discussion at the time of Guyana’s UN-submission [18]. b Based on two earlier estimates [40,41]. A recent estimate of $3079 [42] is considered a marked overestimation and disregarded [43], authors’ comms. with village leaders. c Above and belowground live biomass, 283.7 tC ha−1 [18,33], times (44/12), times $5. (‘44/12’ is the conversion factor from C to CO2 based on atomic weights: C = 12, and O = 16).

