Article

Developing Models to Predict the Number of Fire Hotspots from an Accumulated Fuel Dryness Index by Vegetation Type and Region in Mexico

1
Facultad de Ciencias Forestales, Universidad Juárez del Estado de Durango, Río Papaloapan y Blvd, Durango S/N Col. Valle del Sur, CP 34120 Durango, Mexico
2
Instituto de Silvicultura e Industria de la madera, Universidad Juárez del Estado de Durango, Boulevard del Guadiana 501, Ciudad Universitaria, Torre de Investigación, 34120 Durango, Mexico
3
Comisión Nacional para el Conocimiento y Uso de la Biodiversidad (CONABIO), Liga Periférico-Insurgentes Sur 4903, Parques del Pedregal, Del. Tlalpan, CP 14010 Ciudad de Mexico, Mexico
4
School of Environmental and Forest Sciences. University of Washington, Mailbox 352100, University of Washington, Seattle, WA 98195, USA
5
Pacific Southwest Research Station, US Department of Agriculture Forest Service, (retired), 4955 Canyon Crest Drive, Riverside, CA 92507, USA
6
Centro de Investigación Forestal–Lourizán, Xunta de Galicia (Spain), Carretera de Marín km 3.5, CP 36153 Pontevedra, Spain
7
Departamento de Ingeniería Agroforestal, Universidad de Santiago de Compostela, Escuela Politécnica Superior de Ingeniería, Campus Universitario s/n, 27002 Lugo, Spain
8
Rocky Mountain Research Station, USDA Forest Service, (retired), 1505 Khanabad Drive, Missoula, MT 59802, USA
9
Pacific Southwest Research Station, USDA Forest Service, 800 Buchanan, St. Albany, CA 94710, USA
*
Author to whom correspondence should be addressed.
Forests 2018, 9(4), 190; https://doi.org/10.3390/f9040190
Submission received: 20 February 2018 / Revised: 24 March 2018 / Accepted: 29 March 2018 / Published: 7 April 2018

Abstract

:
Understanding the linkage between accumulated fuel dryness and temporal fire occurrence risk is key for improving decision-making in forest fire management, especially under growing conditions of vegetation stress associated with climate change. This study addresses the development of models to predict the number of 10-day observed Moderate-Resolution Imaging Spectroradiometer (MODIS) active fire hotspots—expressed as a Fire Hotspot Density index (FHD)—from an Accumulated Fuel Dryness Index (AcFDI), for 17 main vegetation types and regions in Mexico, for the period 2011–2015. The AcFDI was calculated by applying vegetation-specific thresholds for fire occurrence to a satellite-based fuel dryness index (FDI), which was developed after the structure of the Fire Potential Index (FPI). Linear and non-linear models were tested for the prediction of FHD from FDI and AcFDI. Non-linear quantile regression models gave the best results for predicting FHD using AcFDI, together with auto-regression from previously observed hotspot density values. The predictions of 10-day observed FHD values were reasonably good with R2 values of 0.5 to 0.7 suggesting the potential to be used as an operational tool for predicting the expected number of fire hotspots by vegetation type and region in Mexico. The presented modeling strategy could be replicated for any fire danger index in any region, based on information from MODIS or other remote sensors.

1. Introduction

The quantification of the influence of varying fuel dryness on temporal fire occurrence risk is critical for improving decision-making in strategic fire management planning (e.g., [1,2,3]), especially under growing conditions of vegetation stress associated with climate change, which can alter the length and severity of the fire seasons (e.g., [4,5,6,7]).
Based on weather information, several operational fire danger systems have been developed to estimate fuel dryness and associated fire occurrence risk (e.g., [8,9,10,11,12,13]). Examples of these widely applied weather-based fire danger indices are those from the Canadian Forest Fire Danger Rating System, (CFFDRS) (e.g., [14,15,16,17]), or the fire danger indices of the National Fire Danger Rating System, (NFDRS) (e.g., [18,19,20]). Such indices have demonstrated their usefulness for predicting the temporal fire occurrence probability (e.g., the expected days of fire activity thorough the season; [18,21,22]) and also for predicting the temporal evolution in the expected number of fires (e.g., [14,15,23,24,25,26]), which can be used for decision support in strategic fire suppression resource allocation and prioritization (e.g., [1,27]). In addition, some authors have proposed indices that combine both weather and satellite information for predictions of fire occurrence risk [28,29,30,31,32,33,34,35] based on works that have demonstrated the potential of satellite sensors for monitoring vegetation greenness and associated fire danger and risk (e.g., [36,37,38,39,40,41]).
One of the most used operational indices that integrates meteorological and satellite information is the Fire Potential Index (FPI) [28]. The FPI combines remotely sensed estimates of vegetation greenness—as measured by 10-day Normalized Difference Vegetation Index (NDVI) composites—with daily estimates of dead fuel moisture content [42,43] for mapping fuel dryness conditions and associated fire risk and danger. The FPI fuel dryness index has been operationally used for fire danger monitoring and occurrence risk prediction in the United States of America (USA) [28,33,34,35], Indonesia [44], and on the European continent (e.g., [29,30,31,45]), including studies of regional application in northern Spain [46,47,48]. Several of these works have highlighted the need to understand how the same values of a fuel dryness index such as FPI result in different patterns of fire occurrence under different bioclimatic regions and vegetation types.
In Mexico, Manzo-Delgado et al. [49,50] demonstrated the potential of the temporal evolution of NDVI-based indices as indicators of fuel drought and associated fire risk for the central region of the country. Some studies have evaluated the role of weather variables such as precipitation or temperature on fire occurrence risk (e.g., [51,52,53]), mainly at regional or local scales. The work of Pompa-Garcia et al. [54] explored the association between fire records and the Standardized Precipitation-Evapotranspiration Index (SPEI) drought index, finding that the relationships of drought and fire vary by regions in the country. The FPI system [28] was tested by Sepulveda et al. [55,56] in the region of Baja California, but its performance has not been tested nationally for fire occurrence prediction.
Fire monitoring efforts in Mexico country include the development of an interface for active fire hotspots [57] near-real time monitoring [58,59]. The monitoring of fire hotspots is used for strategic decision making in fire suppression by considering the number of active fire hotspots as indicators of the level of fire ignitions and potential for forest fire spread in the main regions of the country.
Previous analysis of monthly fire MODIS hotspot and NDVI-based fuel greenness dynamics for the main vegetation types in Mexico [60,61] suggested that the relationship between fire hotspots occurrence and fuel dryness varied by month, with similar values of fuel dryness resulting in a higher number of fire hotspots as the fire season advanced. These results suggested that the accumulated dryness from the previous months might have potential for explaining the temporal evolution in fire hotspot occurrence.
Based on the above-mentioned results, this study provides further insight into the potential benefit of using an accumulated fuel dryness to explain forest fire occurrence variability. The current study tested an Accumulated Fuel Dryness Index (AcFDI), to predict 10-day (dekad) number of MODIS active fire hotspots, expressed as a Fire Hotspot Density index (FHD). The AcFDI was calculated from the temporal accumulation of a remote-sensing-assessed fuel dryness index (FDI)—based on the structure of the FPI index [28]—for the main ecoregions and vegetation types of Mexico.
Overall, the considerably wide variety of vegetation domains, meteorological conditions, and fire seasonality patterns existing in Mexico offered a valuable opportunity to explore the relationships of fire occurrence and fuel dryness under a variety of vegetation types, ecoregions, and weather conditions.
The specific goals of the current work are (1) to estimate thresholds for fire occurrence for the fuel dryness index (FDI) for each vegetation type and region in Mexico; and (2) to develop models to predict 10-day MODIS Fire Hotspot Density (FHD) for the main vegetation types and regions in Mexico.

2. Materials and Methods
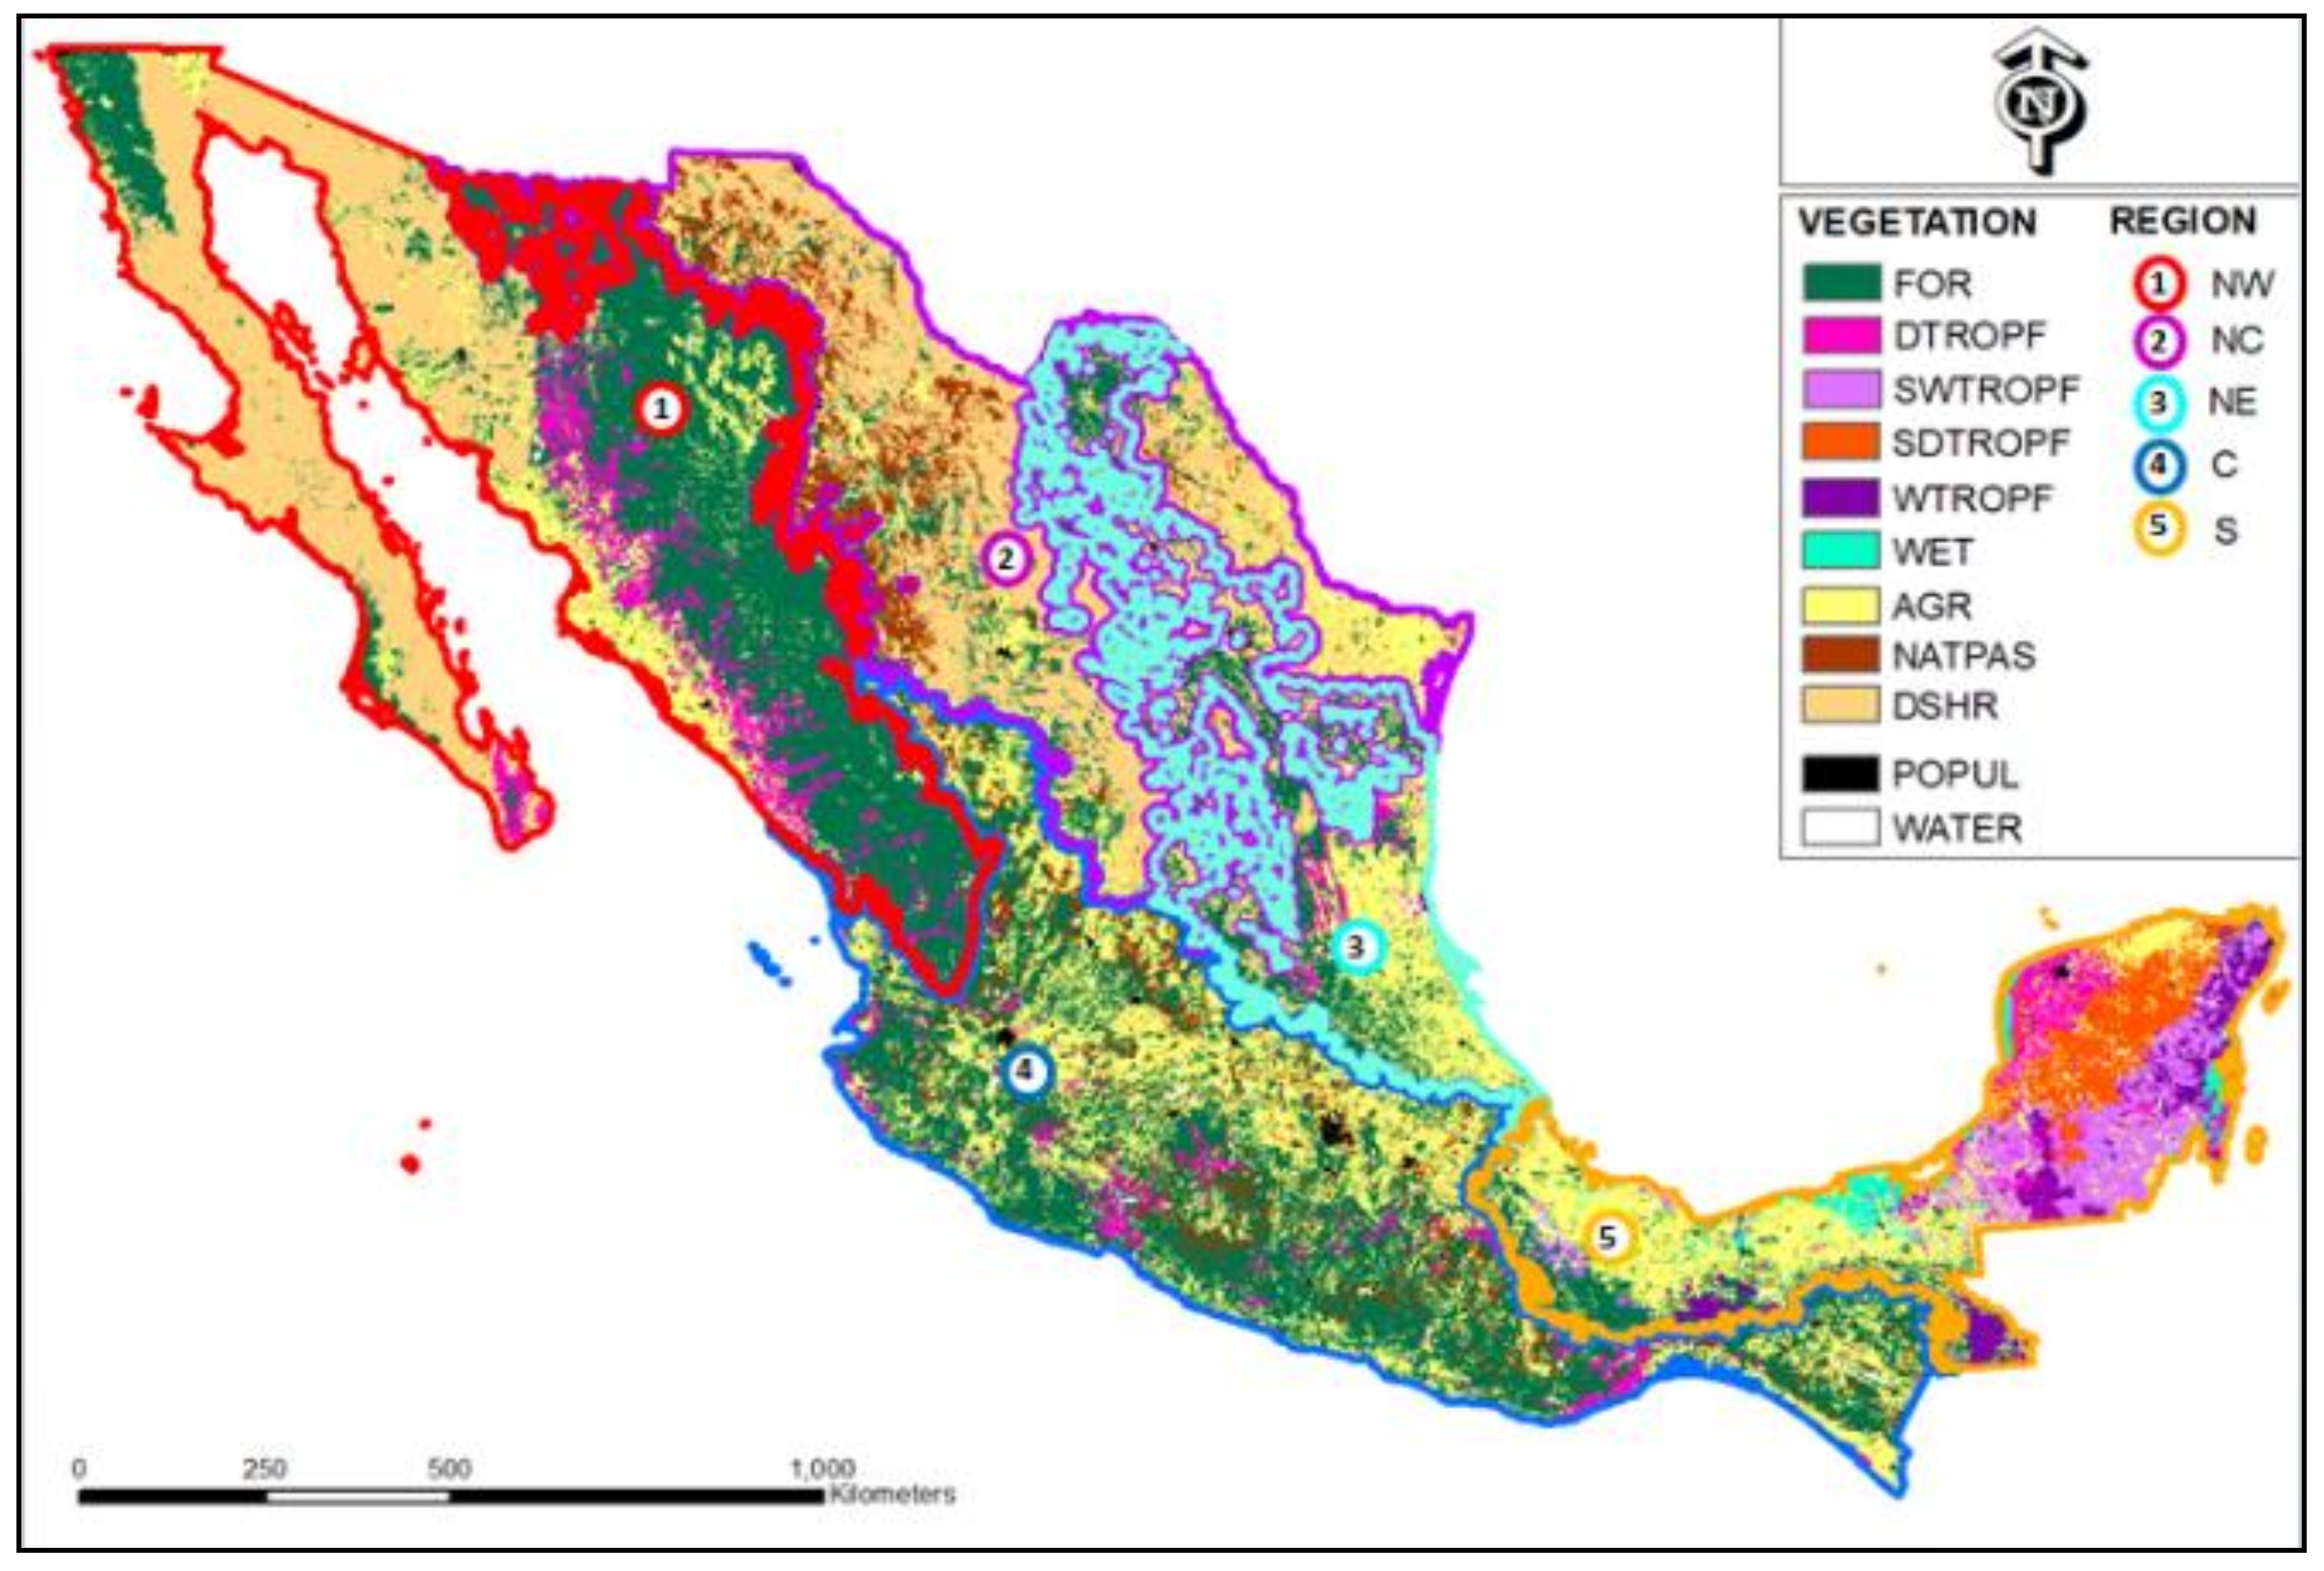
2.1. Study Area

The area of study was the whole Mexican territory. Figure 1 shows the main vegetation types in the country according to the most recent land use map (INEGI Land Use Map Series V, year 2011, 1:25,000 http://www.inegi.org.mx/geo/contenidos/recnat/usosuelo/) of the National Institute of Geography and Statistics (INEGI in Spanish). Given the well-documented variations in fire regimes seasonality in the country (e.g., [62,63,64,65]), five geographical regions were established: Northwest (NW), Northeast (NE), North-Centre (NC), Centre (C), and South (S) (Figure 1). The definition of regions was based on the North American Level 3 Ecoregions Map (EPA, https://www.epa.gov/eco-research/ecoregions-north-america), together with previous analysis of the temporal trends and spatial patterns of clustering in fire hotspots in the country [54,60,61]. Vegetation types were reclassified into the following categories: temperate forest (FOR), dry tropical forest (DTROPF), seasonally dry tropical forest (SDTROPF), seasonally wet tropical forest (SWTROPF), wet tropical forest (WTROPF), wetlands (WET), desert shrubby vegetation (DSHR), natural pastureland (NPAS), and agricultural croplands (AGR) (Figure 1). Agricultural lands were included in our analysis because of the relevance of agricultural burns, including escaped burns from agriculture and slash-and burn agriculture in the occurrence of forest fires in the country—particularly in the Centre and South regions (e.g., [54,61,66]). The desert shrubby vegetation of all regions and natural pastureland of the North-Centre arid region were excluded from our analysis because of the relatively low registered number of hotspots and fire suppression registers in these vegetation types and regions. This resulted in a total of 17 vegetation and region units (Figure 1).

2.2. MODIS Active Fire Hotspots

MODIS active fire hotspots for the study period were compiled from the Forest Fire Early Warning System operated by the National Commission for Knowledge and Use of Biodiversity (CONABIO) (http://incendios1.conabio.gob.mx/). Active fires were obtained based on the Contextual Fire Detection Algorithm for MODIS [57]. The algorithm classifies MODIS pixels as possible active fires by applying minimum thresholds for brightness temperature and considering the context of the surrounding pixels [57,67].
To minimize false detections, active fire hotspot data were filtered by CONABIO following the protocol described by Cruz-Lopez [67]. This process includes the consideration of specific thresholds for brightness temperature [67], in order to avoid false detection by sun-light and very high albedo (e.g., [68]). Several additional masks were also considered in the filtering, such as a NDVI and vegetation mask to remove desert areas without vegetation, or a stable light mask, generated from DMSP satellite images (http://julius.ngdc.noa.gov:8080/production/BIOMASS/night.html), as described in [67].

2.3. Fire Hotspot Density Index (FHD) Calculation

For each of the 17 vegetation types and regions considered, Fire Hotspot Density was calculated for each 10-day (dekad) period by dividing the number of MODIS hotspots observed by dekad in each vegetation/region by the surface (km2) of the corresponding vegetation/region considered, scaled to a Fire Hotspot Density index (FHD) as follows (Equation (1)):
FHD = Number   of   hotspots / Surface   ( km 2 ) × 20.000
The scaling factor was chosen as 1/10 of a reference surface of 200.000 km2, which is approximately equivalent to the surface of the temperate forests of the Northwest or Centre regions that are the main regions of forest fire occurrence in the country. Therefore, the FHD index directly represents 1/10 of the observed number of hotspots by dekad on a reference surface of 200.000 km2.

2.4. Fuel Dryness Index (FDI) Inputs

The inputs for calculating FDI were daily images of the estimated moisture content of 100-h time-lag dead fuels (H100) [42] and 10-day NDVI composites. The daily H100 images were calculated in CONABIO following the Cervera-Taboada [69] calibration of the NFDRS algorithms of dead fuel moisture content [42,43] for Mexico. This is based on temperature and relative humidity from MODIS atmospheric profiles combined with precipitation data from the TRMM satellite [58,59,69]. CONABIO calculated the 10-day MODIS NDVI composite images with a spatial resolution of 1 × 1 km, using the harmonic time series methodology (HANTS) proposed by Roerink et al. (2000), cited by De Badts et al. [70], as described by Cruz-Lopez [67]. The study timeframe was from 2011 to 2015, based on the availability of historical H100 images calculated daily by CONABIO. We computed the average FDI value for 10-day periods for each vegetation type and region in the period of study.

2.5. Fuel Dryness Index (FDI) Calculation

The FDI was calculated based on the Fire Potential Index (FPI) developed by Burgan et al. [28], which integrates NDVI information with daily maps of dead fuels moisture content. FDI followed the general index structure proposed by Burgan et al. [28] (Equation (2)):
FDI = ( 1 LR ) × ( 1 MR ) × 100
where LR is the live ratio obtained from 10-day NDVI images following Equations (3)–(5), and MR is dead fuels moisture ratio obtained following Equation (6).
Following Burgan et al. [28], the index represents the fuel dryness, with values close to 100 when both live and dead fuel moisture values are close to the maximum fuel dryness values, and lowest values when the fuels have higher fuel greenness and higher dead moisture conditions.
Whereas some works have suggested a potential improvement by using the Normalized Difference Water Index (NDWI) instead of NDVI for the FPI calculation (e.g., [33]), we chose to utilize NDVI as in the original model formulation and several related works (e.g., [30,31,34,35]). The reason for this was the operational availability of 10-day MODIS NDVI compounds from the near-real-time fire monitoring systems of CONABIO [58]. This availability is advantageous both for the historical period and also for future real-time implementation of the fuel dryness index calculation.
The first component of the index—live ratio—was calculated based on relative greenness values following Burgan et al. [28] (Equations (3) and (4)):
LR = RG × LR max / 100
where RG is relative greenness, calculated as:
RG = ( NDVI 0 NDVI min ) / ( NDVI max NDVI min ) × 100
where NDVI0 is the observed NDVI for each pixel every 10-days, NDVImin and NDVImax are the absolute minimum and maximum NDVI values for each pixel from the period of study, and LRmax is the maximum live ratio value for each pixel.
In the first FPI formulation [37], LRmax was determined as a function of the live and dead loads, but this original proposal resulted in overestimated FPI values for some areas in the U.S. A second empirical formulation was proposed by Burgan et al. [28] for the calculation of LRmax in the U.S., scaling this index from 35 to 75% based on the NDVImax map. For the FDI index calculation in this work, based on the observed number of hotspots for every LR value in Mexican vegetation types, we scaled LRmax following Equation (5):
LR max = 30 + 30 × ( NDVI max 125 ) / ( 255 125 )
where LRmax is the live ratio for a given pixel when the vegetation is at maximum greenness, and NDVImax is the historical maximum NDVI observed for a given pixel. The values 125 and 255 are the absolute minimum and maximum NDVI values observed for Mexico, following Burgan et al. [28].
The second component of the FDI—MR—represents the ratio of dead fuel moisture. In the formulation of Burgan et al. [28] for the FPI, MR is calculated as a ratio of dead fuels moisture to fuels moisture of extinction based on the NFDRS fuels map for the U.S. Because no fuel extinction moisture map is available for Mexico, we tested the following expression for scaling MR for the FDI (Equation (6)):
MR = ( H 100 H 100 min ) / ( H 100 max H 100 min )
where H100 is the observed value of 100 h dead fuel moisture, and H100max, H100min are maximum and minimum observed H100 values for each pixel.

2.6. Threshold FDIp Values by Vegetation Type and Region

We calculated the accumulated percentage of fire hotspots by FDI for each vegetation type and region for the whole study period. Based on the accumulated percentage of fire hotspots, we calculated the minimum values of FDI above which 85%, 90%, and 95% of the accumulated FHD values occurred (FDIp, with p = 85%, 90%, 95%), similar to the work of Sebastián-López et al. [31].

2.7. Accumulated Fuel Dryness Index (AcFDI)

We tested a simple accumulated fuel dryness index AcFDI, based on the sum of the FDI values above the threshold for fire occurrence (FDIp) in the previous three months. The index was assumed to be zero at values below the FDIp threshold (Equation (7)).
The index was calculated for each vegetation type and region as follows:
If   FDI i < FDI p ,   AcFDI i = 0 ;   If   FDI i > FDI p ,   AcFDI i = i = n 9 n ( FDI i FDI p )
where AcFDIi is the Accumulated Fuel Dryness Index for dekad i, FDIi is the observed Fuel Dryness Index for each dekad i, n is the current dekad, and FDIp is the Fuel Dryness Index threshold for fire occurrence, calculated for each vegetation type and region as the FDI value above which the p percentage of hotpots occurs, with p = 85%, 90% and 95% (Section 2.6).
The nine-dekad period for accumulating fuel dryness above the threshold was selected based on previous indices of accumulated fuel dryness derived for tropical countries (e.g., [71]), together with the observation of the FDI and FHD temporal evolution plots, by observing the average time difference between the start of fuel dryness accumulation above the FDI threshold and the observed starts and peaks of the fire season from FHD observations.

2.8. Models for the Prediction of Fire Hotspot Density (FHD)

We tested linear and non-linear models for the prediction of FHDi from FDIi or AcFDIi. Because the most robust results were obtained from non-linear models, here we report only results for these non-linear models. However, results for all linear models tested are available upon request from the corresponding author. The non-linear models tested were (Equations (8) and (9)):
FHD i = a × FHD i b
FHD i = a × AcFDI i b
where FHDi is Fire Hotspot Density index for dekad i (Equation (1)), FDIi is Fuel Dryness Index for dekad i (Equation (2)), AcFDIi is Accumulated Fuel Dryness Index for dekad i (Equation (7)), and a and b are model coefficients to be estimated.
In addition, we also tested the following non-linear model, including an autoregressive term to account for the effect of the fires that occurred in the previous dekad FHDi−1 on the predicted FHDi values at dekad i, as follows (Equation (10)):
FHD i = a × AcFDI i b + c × FHD i 1
The c coefficient for the autocorrelation of FHD was estimated as the calculated correlation coefficient between FHDi and FHDi−1 values for each vegetation type and region.
The models were fitted using non-linear least-squares regression (NLS) and non-linear quantile regression (NLQ) [72], using the packages nls and nlrq, respectively, of the software R [73]. For the quantile regression, we tested as candidate percentile values ranging 5 percentile units from 55 to 95%.
These candidate models were evaluated by using the coefficient of determination for nonlinear regression (R2) as a statistical criterion (see [74], pp. 419 and 424), together with root mean square error (RMSE) and model Bias. R2 is defined as the square correlation coefficient between the measured and estimated values ( r y i   y i ^ ) and the root mean square error (RMSE), which can be defined as follows (Equations (11)–(13)):
R 2 = r 2 y i   y i ^
RMSE = ( y i   y i ^ ) 2 n p
B i a s   = ( y i   y i ^ )   /   n  
where y i and y i ^ are the observed and estimated values of the dependent variable, respectively, n is the total number of observations used to fit the model, and p is the number of model parameters.
Because the models will be used for fire risk strategic decision making, conservative predictions would be preferred. Therefore, in addition to highest R2 and lowest RMSE values, we established as a criteria for selecting as best models those where the bias ranged from −5 to −15, therefore providing conservative overestimations for most of the observed values, as preferred for cautious risk decision making.

3. Results

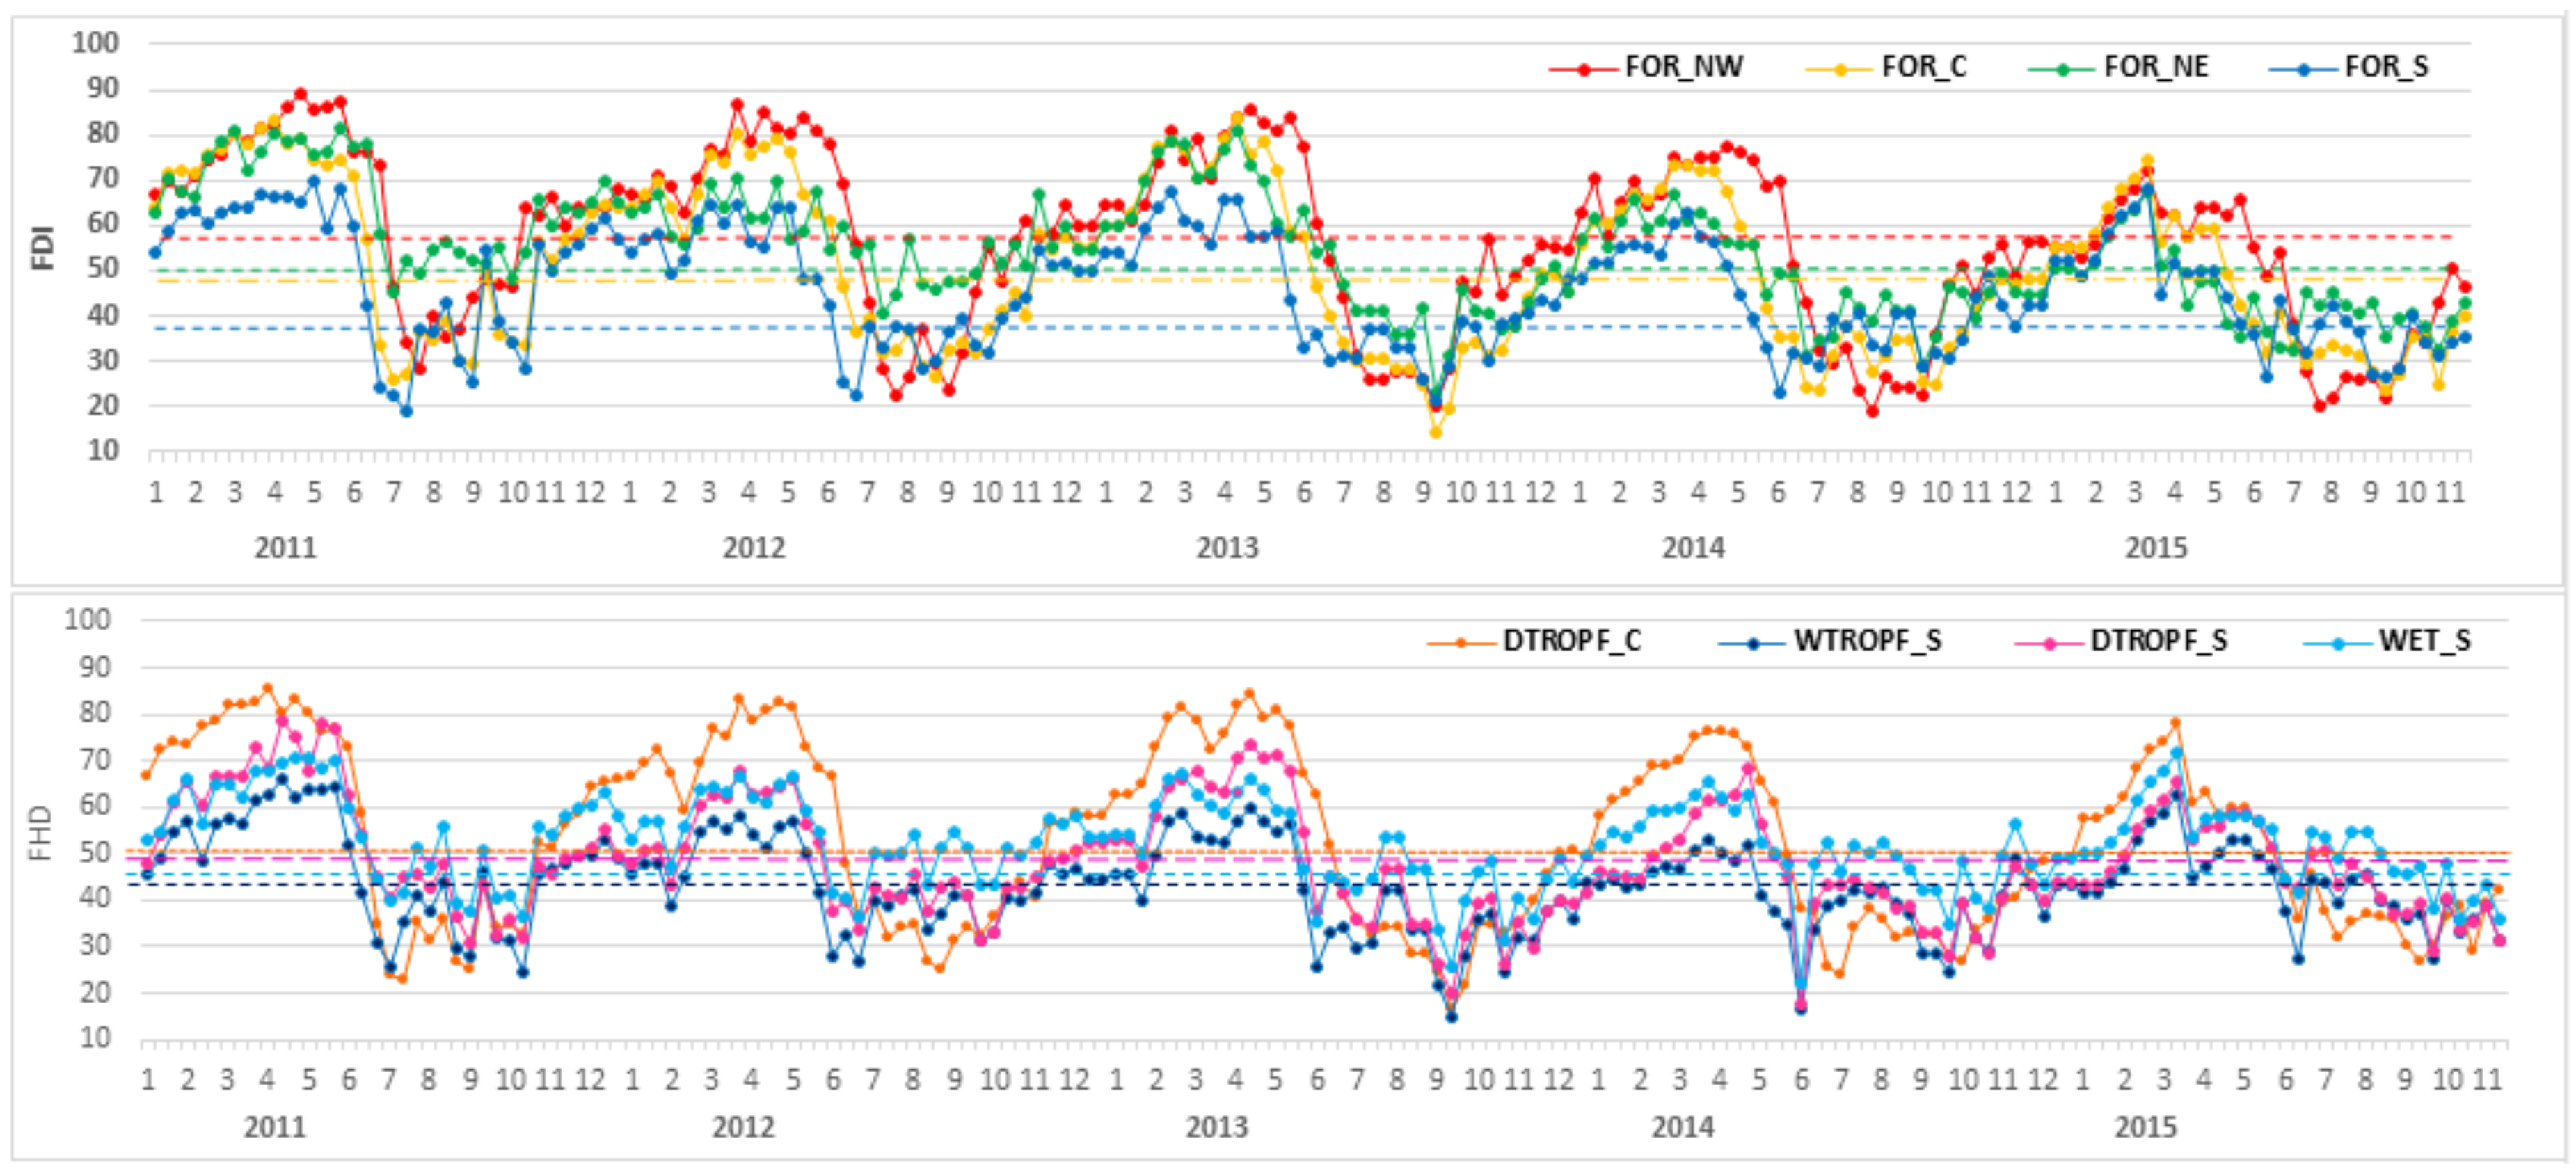
3.1. Observed Fuel Dryness Index for Vegetation Types and Regions

As expected, the observed temporal evolution of FDI varied by vegetation type and region. The observed FDI temporal trends for temperate forests of four regions (Figure 2 top plot) and for four tropical forests in the South region (Figure 2 bottom plot) for the five years of study are shown in Figure 2.
Results show that more arid regions had higher FDI values, with the highest values found for temperate forest of the Northwest that reached maximum values of close to 90 in the years 2011, 2012, and 2013, and up to 80 for the wetter years 2014 and 2015. In the case of temperate forest of the Centre and Northeast regions, the maximum values of approximately 80–85 were reached in the dry years 2011 and 2013 (Figure 2).
The lowest FDI values for the temperate forest were observed for the South region, which receives the highest precipitations in the country (>2000 mm). In this more humid region, the highest observed FDI values were approximately 70 in the dry years 2011 and 2013, reaching maximum values of 60 to 65 in the remaining years (Figure 2). As expected, higher FDI values were found for the dry tropical forest compared to the wet tropical forest in the south region, the latter reaching maximum values from around 60 to approximately 50 in the wet year 2014. The dates at which FDI started rising and decreasing also varied by vegetation type, region, and year (Figure 2).

3.2. Threshold FDIp Values by Vegetation Type and Region

Based on the accumulated percentage of hotspot distributions, we calculated the threshold FDIp values above which accumulated percentages values p of 85%, 90%, and 95% of the fire hotspots occurred for each vegetation type. The FDIp values for each vegetation type are shown in Table 1. Drier regions such as temperate and tropical forest of the Northwest had higher threshold values for fire occurrence (e.g., FDI95 of approximately 60), compared to lower thresholds observed in the wetter vegetation types and regions such as temperate and wet tropical forests of the south, with FDI95 values of approximately 40. The Centre and Northeast regions showed intermediate threshold values, with FDI95 values in the range of 45–50.
Thresholds for FDI95 are shown together with temporal evolution plots of FDIi in Figure 2 for some vegetation types. These plots allow visualization of the trends of fuel dryness accumulation above the threshold for the AcFDI index (Equation (7)). Once the FDI goes down to values below the threshold, fires are predicted to cease, according to the first condition of Equation (7). Therefore, these plots also allow visual interpretation of the predicted ends of the fire season each year based on FDI. FDI values in forests of the Northwest and Northeast generally started to decrease and reached values below the threshold one month later (June–July) than forests of Centre and South regions (May–June). The date of the FDI decrease also varied between years, possibly reflecting the differences in the occurrence of rain events between years and regions.

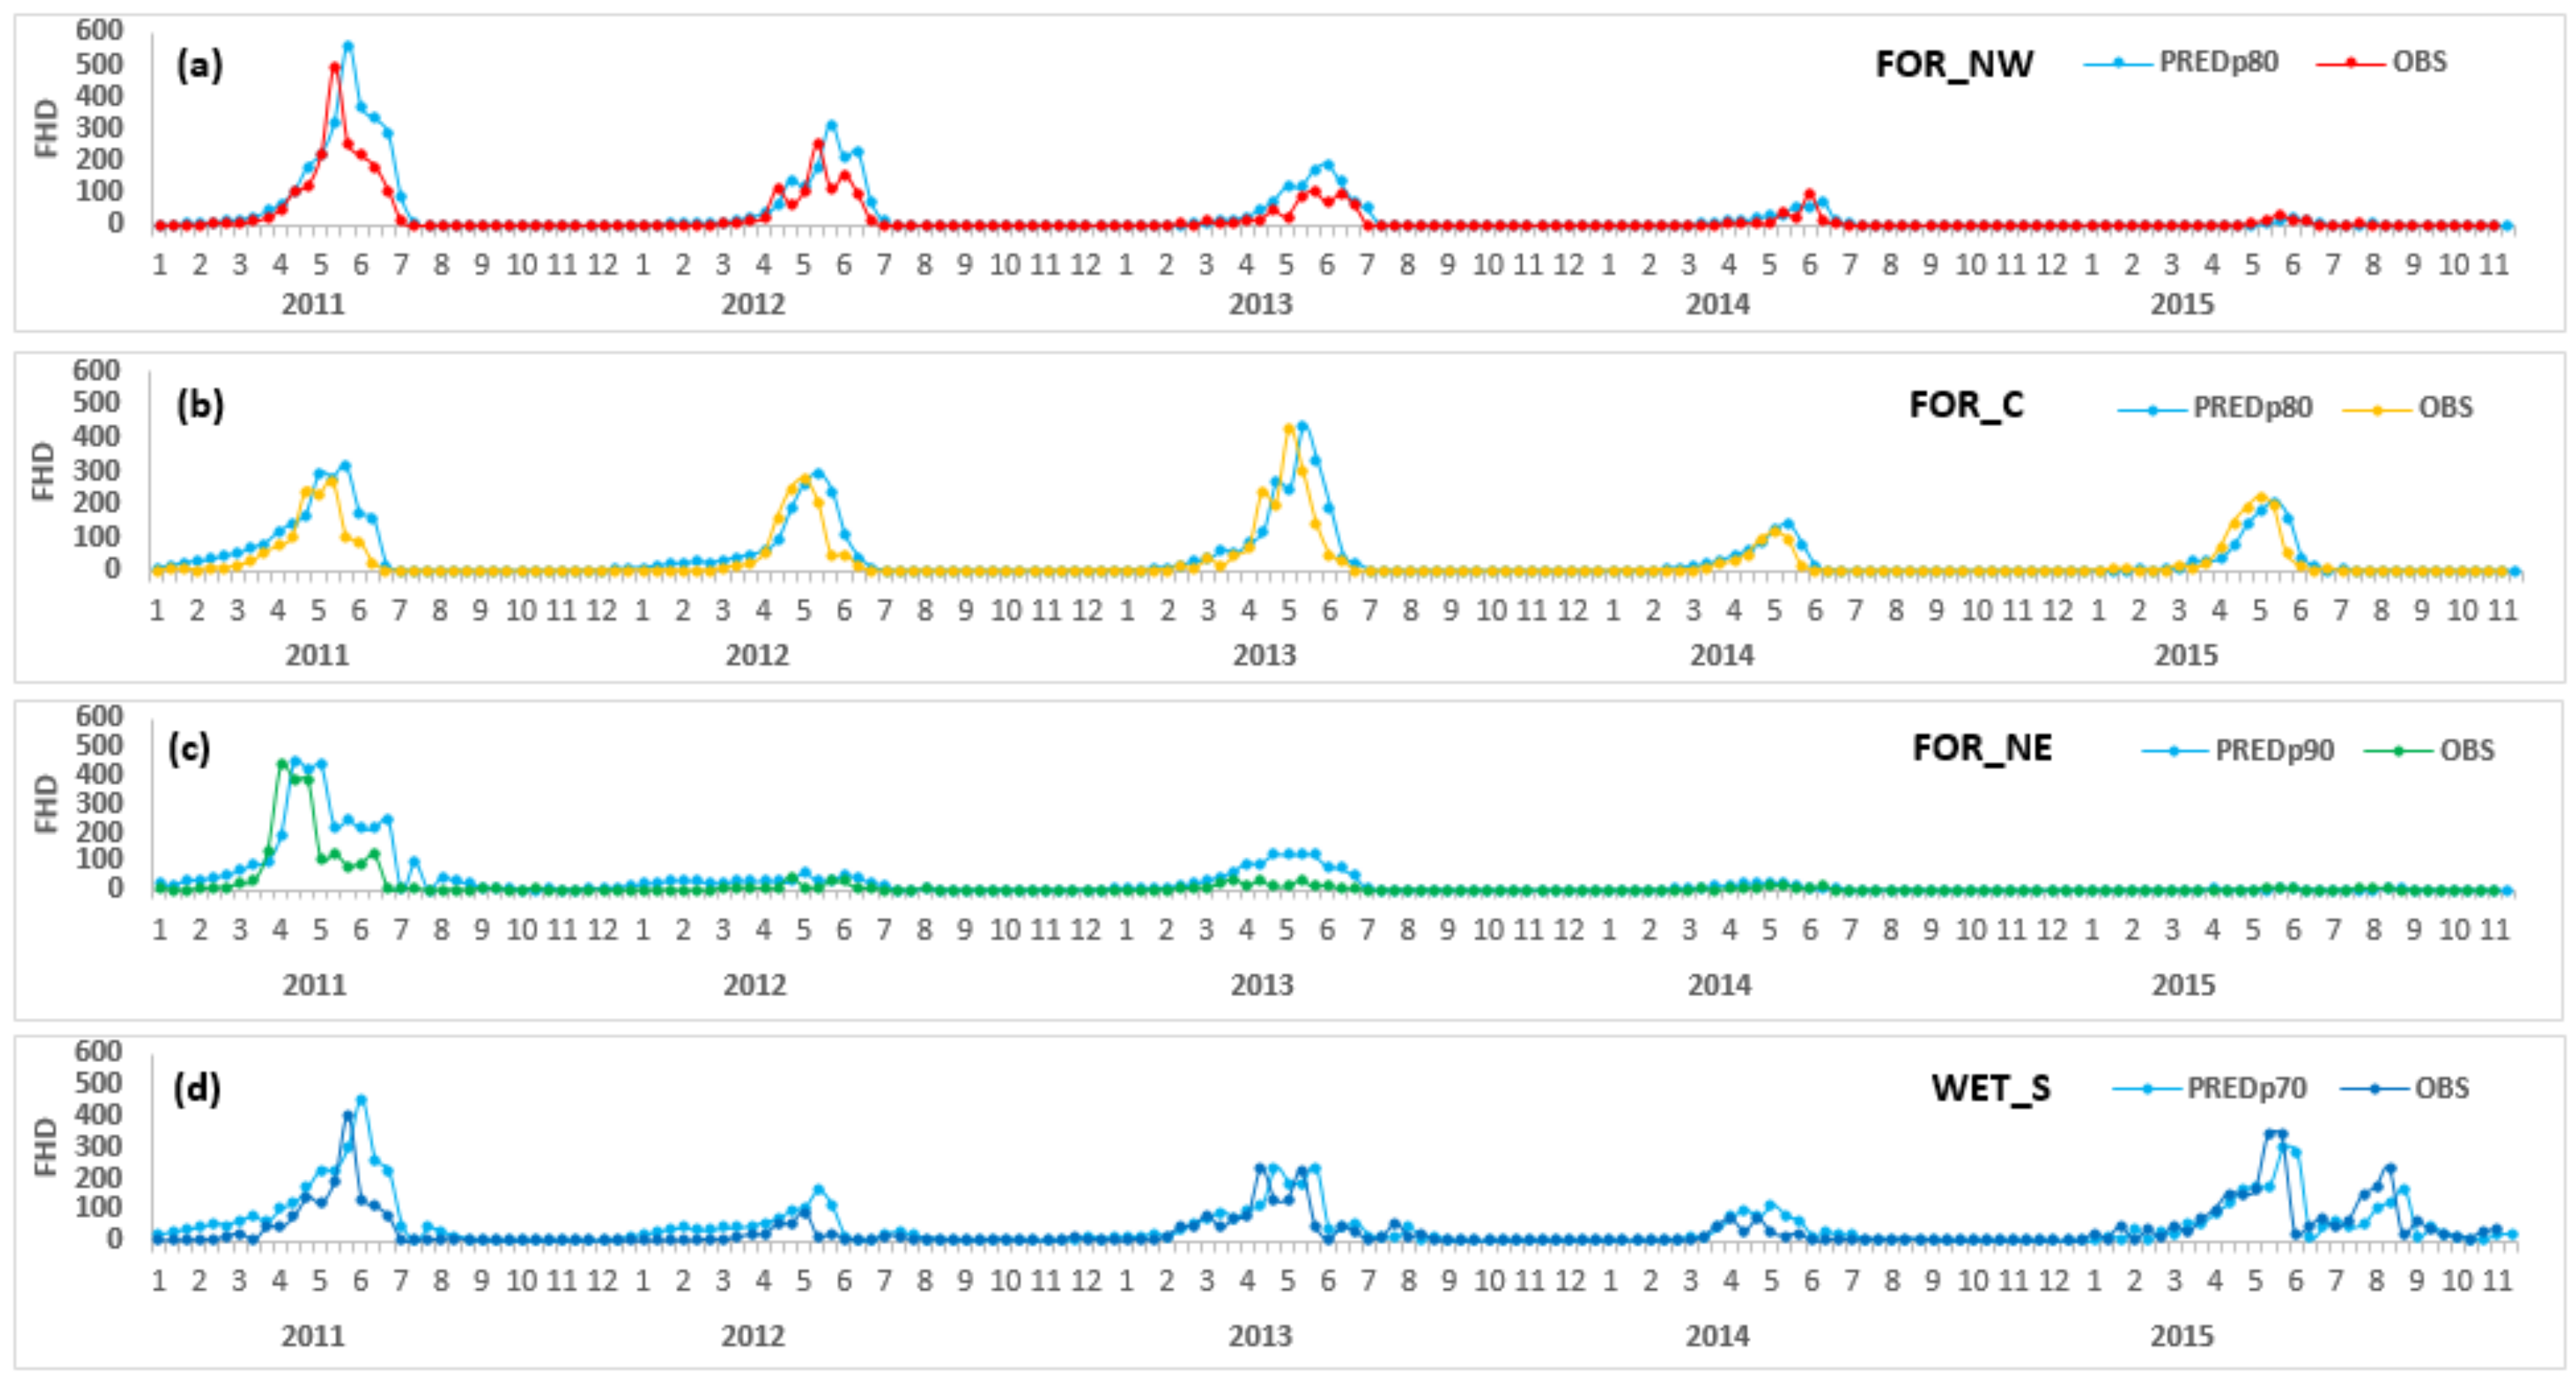
3.3. Predicting Fire Hotspot Density (FHD) from AcFDI by Vegetation Type and Region

Non-linear models based on fuel dryness showed higher goodness of fit statistics compared to linear models. The R2 values for non-linear models using AcFDI and FDI (Equations (8) and (9), respectively) are shown in Table S1. For all vegetation types and regions, higher or similar predictive capacity for estimation of FHD was obtained using AcFDI compared to FDI (Table S1). The highest improvements for FHD using AcFDI instead of FDI were observed for temperate and tropical forests of Centre and temperate forests of the Northwest (NW), where R2 values increased from 0.19, 0.21, and 0.35 to 0.51, 0.50, and 0.74, respectively (Table S1). Smaller gains or marginal increases were obtained for tropical forests of the South (S) and Northeast (NE) regions.
The best models for predicting fire FHD by vegetation type and region and the corresponding goodness of fit coefficients are summarized in Table 2. The best fitted models were obtained with AcFDI, calculated with FDIp threshold values of p = 95% (FDI95) from Table 1, using a non-linear expression, including autoregressive terms (Equation (10)), for all vegetation types.
The chosen percentile for the best fit percentile regression models ranged from 65 to 90, with most vegetation types having a best fit for percentile values of 70 to 80. As defined in the criteria for model selection, the bias of the selected models in Table 1 ranged from −5 to −15, which was chosen to represent a conservative overestimation for cautions risk decision making. The R2 values of the best fit models ranged from approximately 0.5 to 0.7 (Table 2), with the highest R2 values for temperate forests of the Northwest and Centre regions and for dry tropical forest of the Centre region. The lowest values for several tropical forests of the South and Northeast regions, and for the temperate forest of the arid North-Centre region. RMSE values ranged from approximately 20 to 80, with most vegetation types having RMSE values in the range 30–60, as shown in Table 2.
The highest values of the b coefficient were obtained for temperate forests of the South, North-Centre, Northwest, Centre, and Northeast regions; with b values ranging from approximately 2 to 4.7. This suggests that for these vegetation types, increases in accumulated FDI index resulted in strong increases in fire occurrence. In contrast, most of the tropical forests had lower b coefficients, ranging between 1 and 2, suggesting a less pronounced effect of AcFDI on FHD for these more humid regions.
The value of the c coefficient for autoregression of FHD was highest in the temperate and tropical forests of the Centre region, suggesting a larger effect of previously existing fires on fire occurrence in these regions.
Examples of the predicted FHD values against observed MODIS FHD with the selected models are shown in Figure 3 for several vegetation types.
The observed temporal evolution of FHD shown in Figure 3 varied by region. The Centre and South regions had earlier starts of the fire season, in the months of January and February, compared to a later start of the fire season in the Northwest region, where fire activity generally started in the months of March and April. (Figure 3).
Interestingly, for most vegetation types and years, predicted FHD showed a gradual increase from 0 (no risk) to levels of 50 (medium fire risk) in the first months of the year, prior to the start of the fire season (Figure 3). This might be useful as an early warning of the levels of fuel dryness accumulation before the start of the fire season, as will be briefly discussed below in Section 4.3.
For the temperate forests of the Northwest, years 2011, 2012, and 2013 had high-to-medium fire occurrence as shown in the observed FHD plots (Figure 3a), whereas years 2014 and 2015 had low and very low fire occurrence, respectively. This matches with the observed FDI values (Figure 2), where lower FDI values were reached in these latter years, and FDI remained above the FDI threshold for a shorter period compared to the first above-mentioned three years. In this region, the AcFDI index explained a substantial part of the variability in FHD, with R2 values of more than 0.7 for the models with only FDI (Table S1).
For the temperate forests of the Northeast, the highest FDI values (up to 80) were achieved in the years 2011 and 2013, together with large periods of FDI well above the threshold (Figure 2), corresponding to years of high and medium FHD, respectively (Figure 3b). The fires occurring in this region in the very dry year 2011 were the largest fires recorded in the country, according to CONAFOR records, cited in [54]. Years 2012 and 2014—when lower FDI values of up to 70 were observed (Figure 2)—corresponded to low fire activity (Figure 3b), and year 2015—where the period above the threshold was extremely reduced—had very low fire activity.
In the case of temperate forests from the Centre, both high FDI values and high fire occurrence were reached in the very dry year 2011. In contrast, 2014 was both a year with wetter fuel conditions as noted by lower FDI (Figure 2) and low fire activity as measured by FHD (Figure 3c). For the year 2015, in spite of wet fuel conditions as noted in the FDI plot, the observed fire FHD was higher than expected based on only fuel dryness. This seems to suggest a strong anthropogenic influence resulting in a large number of ignitions in spite of wet fuel conditions. In this region, the c coefficient for autoregression of FHD was higher than in the Northwest, and the increase in R2 was higher with the addition of the autoregressive term compared to modeling with only AcFDI (R2 of 0.7 for the model including autoregression of FHD (Equation (10), Table 2) compared to a value of 0.5 for the model with only AcFDI (Equation (9), Table S1).
For the wetlands of the South (Figure 3d), very high fire occurrence was recorded for the very dry year 2011 and high FHD was observed for the dry year 2013. Although the maximum FDI values reached (Figure 2) did not vary strongly between years, the period where the FDI remained above the threshold for fire occurrence was longer in those dry years with higher fire occurrence, resulting in higher AcFDI values. Those values were larger than the AcFDI values in 2014, when fuel dryness accumulated above the threshold for a short period, resulting in a year of low fire occurrence. For the year 2015, the FDI index and the associated FHD predicted from the AcFDI seems to capture both the decrease in month 06 (June) and the rapid increase in the following weeks.

4. Discussion

4.1. Observed Fuel Dryness Index (FDI) for Vegetation Type and Regions

The marked variation in observed FDI by vegetation type and region agrees with that reported from the works with the FPI index, which has a very similar structure to the FDI used here (e.g., [31]), and to previous works in Mexico that have reported distinct NDVI temporal cycles for different vegetation types (e.g., [50]).
The higher observed ranges of the FDI for the temperate forests of the Northwest, Northeast, and Centre regions (Figure 2), compared to the temperate and tropical forests of the South region (Figure 2), suggest that less-marked drying and wetting processes occurred in the wetter regions and vegetation types, such as the temperate forests of the south or in the evergreen wet tropical forests. This agrees with the observations of Huesca et al. [46] in northern Spain, who found more marked seasonal fluctuations in the FPI temporal trends in the drier ecoregions, compared to smaller seasonal fluctuations in wetter ecoregions.
The temporal evolution of FDI from this work matches with previous observation of the monthly MODIS NDVI fuel dryness dynamics in the country [60,61], where a similar gradient in the dates of fuel dryness decrease from Centre and South regions to the Northwest region was observed. This is possibly related to the different timing of precipitation occurrence between these regions (generally one month later in the Northwest) (Figure 2), which corresponds well with the timing of the observed FHD decreases (Figure 3).
Compared to the temporal monthly NDVI based fuel dryness temporal evolution data shown in previous works (Vega-Nieva et al. [60,61]), the observed evolution of the weekly FDI in the current work showed more sharp increases and decreases (Figure 2). This is not surprising: the NDVI temporal evolution are rather gradual, possibly reflecting accumulated dryness effects on the vegetation reflectance, which has been frequently associated with live vegetation dynamics in the literature (e.g., [33,41]). In contrast, the integration of the daily dead fuel moisture content ratio in the FDI index as proposed by Burgan et al. [28] implies a higher sensitivity to daily events of precipitation or raising temperature on the most rapidly changing dead vegetation moisture component of the index [42]. This sensitivity of the FDI to precipitation events could be advantageous compared to the monitoring of NDVI alone for establishing the predicted dates of end of the fire season based on the FDI thresholds, as illustrated in Figure 2 and Section 3.2.

4.2. Threshold FDI Values by Vegetation Type and Region

The thresholds obtained from the FDI distributions are similar to those observed in previous studies on the similar FPI index (e.g., [29,31,33]). The variation of FDI thresholds by region, with higher threshold values observed for drier regions and lower values for the wetter regions (Table 1), supports that reported by Sebastián-López et al. [31] in a study for a number of bioclimatic regions in Southern Europe, where the highest threshold values for fire occurrence were also observed for the drier regions.

4.3. Predicting Fire Hotspot Density (FHD) by Vegetation Type and Region

The observed temporal evolution of FHD showed differences by vegetation type and region, coinciding with previous monthly FHD observations [61]. The observation of a more anthropogenic influence of fire occurrence—possibly from agricultural burns—in the Centre and South regions supports observations from previous works (Pompa-Garcia et al. [54] and Vega-Nieva et al. [61]). In these two regions, agricultural activities account for 40–50% of fires suppressed, as opposed to less than 20% attributed to this cause in the Northwest and Northeast regions, according to CONAFOR’s fire suppression records for the study period.
The utilization of an accumulated fuel dryness index combined with percentile regression resulted in conservative estimates of the start of the fire season (Figure 2 and Figure 3). Whereas all the NLS models underestimated a large number of the FHD observations, the use of percentile regression was more conservative. It has been acknowledged that using regression analysis can be problematic for these types of phenomena, because models equally penalize over- and under-estimations, which might have different implications for decision making in fire suppression [33]. The use of percentile regression [72] seems to offer a potentially useful alternative for more conservative predictions.
As noted in Section 3.3., the observed gradual increases in accumulated fuel dryness and associated FHD predictions (Figure 2 and Figure 3) in the first months of the year—raising gradually from levels of 0 (no significant number of fires expected) to levels of 50 (medium fire risk) before the fire season starts—could be useful as indicators of the evolution of fuel dryness and potential fire risk early in the year. Because the effect of the autoregression on FHD before the start of the fire season is negligible, this gradual increase is entirely explained by the accumulated fuel dryness since the last rain event at the first months of the year. The monitoring of this early gradual increase in fuel dryness and associated fire occurrence risk might be useful for supporting operational decisions on fire suppression resources allocation with some advance prior to the start of the fire season. This predictive capability might be further enhanced in future works with the use of weather forecasts, similar to the works of Roads et al. [75,76], Chen et al. [77], or Preisler et al. [1,78], who developed monthly to seasonal estimates of fire danger from gridded weather forecasts.
The FDI index showed a reasonably good predictive capacity of observed fire occurrence, confirming previous findings relating the similar FPI index to fire occurrence in other ecosystems (e.g., [28,29,30,31,33,34,35,45,46,47,48]).
Our study corroborated the nonlinearity of the relationship between the similar index FPI and number of fires observed by Sebastián-López et al. [30,31], and the coincidence of months and years with highest FHD values with FPI peaks, including bimodal fire occurrence, observed by Huesca et al. [46].
The strategy of developing specific models for different vegetation types and regions addressed in this study is consistent with the approach used in other studies with the FPI index, where different models were constructed for dissimilar ecoregions [31], sub-geographic areas of similar climate, fuels and topography [34,35], or combinations of vegetation types and climatic ecoregions [47,48], because of the largely documented influence of vegetation types on fire occurrence risk (e.g., [79,80,81,82]).
Our results seem to confirm the hypothesis of FDI saturation in the warmer regions and seasons suggested by Sebastián-Lopez et al. [31] for the similar FPI index. This also agrees with the observations from Vega-Nieva et al. [60,61], who found that similar monthly NDVI-based fuel greenness values resulted in a higher number of fire hotpots as fire season advanced in Mexico, suggesting an accumulated dryness effect on fire occurrence. A possible effect of the propagation of existing fires (modeled in this study by autoregressive coefficients) or a “contagion effect” in anthropogenic fires might also contribute to that result.
All of the best fit models in our study included autoregressive coefficients for FHD. Similarly, Huesca et al. [47], comparing models for predicting number of fires with only autoregressive terms, with other models combining both FPI and autocorrelation for number of fires, concluded that both autoregressive terms and FPI significantly explained the observed number of fires.
Although compared to other studies, our approach considered an ample ensemble of data, referred to a varied spectrum of ecological and weather conditions, in future works it will be necessary to validate this initial modeling effort with additional information from other years.
On the other hand, new sensors for active fire hotspot detection at higher spatial resolutions such as the 375 m VIIRS hotspots from NPP satellite [83], which have been used operationally in the country by CONABIO since 2015, should be tested in future works, once the period is long enough and covers representative variations in fuel dryness and fire occurrence.
Another limitation of the current work is inherent to the use of number of fire hotspots as indicators of fire risk. Whereas active fire hotspot products are used on a daily and weekly basis for decision support of fire suppression planning by the National Forestry Commission CONAFOR in the country, the total number of active fire hotspots is not the only variable considered for fire suppression decision making and resource prioritization. Similar to some works that have explored both active fire hotspots and fire suppression records from forest agencies to compensate limitations inherent to both types of datasets (e.g., [27,84]), future works might explore relationships between fuel dryness, fire hotspots, and fire suppression records from CONAFOR to develop operational recommendations for fire suppression resource allocations. Furthermore, the consideration of spatial variables such as road or population distance or density, which have proven of great value for developing spatial [85,86,87,88] and spatio-temporal fire occurrence risk maps (e.g., [82]), should be explored in future works.

5. Conclusions

The work presents the first effort towards developing an operational model for the prediction of the expected number of fire hotspots expressed as a fire hotspot density index, using remotely sensed weather and NDVI information, at a national level in Mexico. The models used percentile regression to predict 10-day fire hotspot density from accumulated fuel dryness and autoregression with previously observed fire hotspots. The reasonably good accuracies for most of the vegetation types and regions obtained suggest the potential to be included in operational GIS tools to assist in fire management decision making in the country.
It would be desirable that future works address the modeling of spatial patterns of fire occurrence from fuel dryness together with the consideration of human factors. The models could be tested in combination with forecasted fuel dryness—based on weekly or seasonal weather forecasts—to orient fire suppression strategic planning.
The modeling strategy presented here for predicting the expected number of fire hotspots by vegetation types and ecoregions from accumulated fuel dryness and satellite observed fire hotspots of the previous days could be replicated for any fire danger index in any region, based on records of daily active fire hotspots and available fuel dryness indices.

Supplementary Materials

The following are available online at https://www.mdpi.com/1999-4907/9/4/190/s1, Table S1: Goodness of fit statistics for non-linear models for prediction of Fire Hotspots Density from FDI (Equation (8)) and from AcFDI (Equation (9)). Where: Veg_Reg: Vegetation type and region; R2: coefficient of determination; RMSE: Root Mean Square Error; FOR: temperate forest; DTROPF: Dry Tropical Forest; WTROPF: Wet Tropical Forest; SDTROPF: Seasonally Dry Tropical Forest; SWTROPF: Seasonally Wet Tropical Forest; WET: wetlands; AGR: agriculture; NPAS: natural pastureland; NW, NE, C, NC, S: Northwest, Northeast, Center, North-Center and South regions.

Acknowledgments

Funding for this work was provided by CONAFOR/CONACYT Project C0-3-2014 “Development of a Forest Fire Danger Prediction System for Mexico”. We want to thank CONABIO’s personnel for providing us access to the satellite daily data of fire hotspots, 10 day NDVI composites and daily dead fuel moisture images for Mexico for the period of study.

Author Contributions

D.J. Vega-Nieva, M.G. Nava-Miranda, E. Calleros-Flores, P.M. López-Serrano, J.J. Corral-Rivas, J.G. Álvarez-González and A.D. Ruiz-González performed the statistical analysis. J. Briseño-Reyes programmed the code for the daily Fuel Dryness Index automated calculation and for the extraction of FDI values to the daily fire hotspots. M.I. Cruz-López, M. Cuahutle and R. Ressl calculated daily H100 and 10-day NDVI composites from satellite information from CONABIO. D.J. Vega-Nieva, J.J. Corral-Rivas, E. Montiel-Antuna, E. Alvarado-Celestino, A. González-Cabán, E. Jiménez, R.E. Burgan and H.K. Preisler wrote and reviewed the manuscript. R.E. Burgan provided the Fire Potential Index algorithm, upon which much of this research is based.

Conflicts of Interest

The authors declare no conflict of interest. The founding sponsors had no role in the design of the study; in the collection, analyses, or interpretation of data; in the writing of the manuscript, and in the decision to publish the results.

References

  1. Preisler, H.K.; Westerling, A.L.; Gebert, K.M.; Munoz-Arriola, F.; Holmes, T.P. Spatially explicit forecasts of large wildland fire probability and suppression costs for California. Int. J. Wildland Fire 2011, 20, 508–517. [Google Scholar] [CrossRef]
  2. Mavsar, R.; González-Cabán, A.; Varela, E. The State of Development of Fire Management Decision Support Systems in America and Europe. For. Policy Econ. 2013, 29, 45–55. [Google Scholar] [CrossRef]
  3. Rodríguez y Silva, F.; Molina Martínez, J.R.; González-Cabán, A. A Methodology for Determining Operational Priorities for Prevention and Suppression of Wildland Fires. Int. J. Wildland Fire 2014, 243, 544–554. [Google Scholar] [CrossRef]
  4. Flannigan, M.D.; Amiro, B.D.; Logan, K.A. Forest fires and climate change in the 21st century. Mitig. Adapt. Strateg. Glob. Chang. 2006, 114, 847–859. [Google Scholar] [CrossRef]
  5. Flannigan, M.; Stocks, B.; Turetsky, M. Impacts of climate change on fire activity and fire management in the circumboreal forest. Glob. Chang. Biol. 2009, 153, 549–560. [Google Scholar] [CrossRef]
  6. Westerling, A.L.R. Increasing western US forest wildfire activity: Sensitivity to changes in the timing of spring. Phil. Trans. R. Soc. B. 2016, 371. [Google Scholar] [CrossRef] [PubMed]
  7. Westerling, A.L.; Hidalgo, H.G.; Cayan, D.R.; Swetnam, T.W. Warming and earlier spring increase western US forest wildfire activity. Science 2006, 313, 940–943. [Google Scholar] [CrossRef] [PubMed]
  8. Lee, B.S. The Canadian Wildland Fire Information System. In Proceedings of the 9th Annual Conference on Geographic Information Systems in Forestry, Environment and Natural Resources Management, Vancouver, BC, Canada, 27–30 March1995; GIS World Inc.: Fort Collins, CO, USA; pp. 639–646. [Google Scholar]
  9. Deeming, J.E.; Burgan, R.E.; Cohen, J.D. The National Fire-Danger Rating System—1978; Gen. Tech. Rep. INT-39; Department of Agriculture, Forest Service, Intermountain Forest and Range Experiment Station: Ogden, UT, USA, 1977; p. 63.
  10. Burgan, R.E. 1988 Revisions to the 1978 National Fire-Danger Rating System; Res. Pap. SE-273; Department of Agriculture, Forest Service, Southeastern Forest Experiment Station: Asheville, NC, USA, 1988; p. 39.
  11. Burgan, R.E.; Andrews, P.L.; Bradshaw, L.S.; Chase, C.H.; Hartford, R.A.; Latham, D.J. WFAS: Wildland fire assessment system. Fire Manag. Notes 1997, 572, 14–17. [Google Scholar]
  12. Camia, A.; Barbosa, P.; Amatulli, G.; San-Miguel-Ayanz, J. Fire danger rating in the European Forest Fire Information System EFFIS: Current developments. For. Ecol. Manag. 2006, 234, S20. [Google Scholar] [CrossRef]
  13. San-Miguel-Ayanz, J.; Schulte, E.; Schmuck, G.; Camia, A.; Strobl, P.; Liberta, G.; Giovando, C.; Roberto Boca, R.; Sedano, F.; Pieter Kempeneers, P.; et al. Comprehensive Monitoring of Wildfires in Europe: The European Forest Fire Information System (EFFIS). In Approaches to Managing Disaster—Assessing Hazards, Emergencies and Disaster Impacts; European Commission, Joint Research Centre: Rome, Italy, 2012. [Google Scholar] [CrossRef]
  14. Wotton, B.M.; Martell, D.L.; Logan, K.A. Climate change and people-caused forest fire occurrence in Ontario. Clim. Chang. 2003, 603, 275–295. [Google Scholar] [CrossRef]
  15. Wotton, B.M.; Nock, C.A.; Flannigan, M.D. Forest fire occurrence and climate change in Canada. Int. J. Wildland Fire 2010, 193, 253–271. [Google Scholar] [CrossRef]
  16. Woolford, D.G.; Cao, J.; Dean, C.B.; Martell, D.L. Characterizing temporal changes in forest fire ignitions: Looking for climate change signals in a region of the Canadian boreal forest. Environmetrics 2010, 21, 789–800. [Google Scholar] [CrossRef]
  17. Woolford, D.G.; Dean, C.B.; Martell, D.L.; Cao, J.; Wotton, B.M. Lightning-caused forest fire risk in Northwestern Ontario, Canada is increasing and associated with anomalies in fire-weather. Environmetrics 2014, 25, 406–416. [Google Scholar] [CrossRef]
  18. Andrews, P.L.; Loftsgaarden, D.O.; Bradshaw, L.S. Evaluation of fire danger rating indexes using logistic regression and percentile analysis. Int. J. Wildland Fire 2003, 12, 213–226. [Google Scholar] [CrossRef]
  19. Littell, J.S.; McKenzie, D.; Peterson, D.L.; Westerling, A.L. Climate and wildfire area burned in western U.S. ecoprovinces, 1916–2003. Ecol. Appl. 2009, 19, 1003–1021. [Google Scholar] [CrossRef] [PubMed]
  20. Trouet, V.; Taylor, A.H.; Carleton, A.M.; Skinner, C.N. Interannual variations in fire weather, fire extent, and synoptic-scale circulation patterns in northern California and Oregon. Theor. Appl. Climatol. 2009, 95, 349–360. [Google Scholar] [CrossRef]
  21. Martell, D.L.; Bevilacqua, E.B.J. Modelling seasonal variation in daily people-caused forest fire occurrence. Can. J. For. Res. 1989, 19, 1555–1563. [Google Scholar] [CrossRef]
  22. Vega-García, C.; Woodard, T.; Adamowicz, W.L.; Lee, B. A logit model for predicting the daily occurrence of human caused forest fires. Int. J. Wildland Fire 1995, 5, 101–111. [Google Scholar] [CrossRef]
  23. Preisler, H.K.; Brillinger, D.R.; Burgan, R.E.; Benoit, J.W. Probability based models for estimating wildfire risk. Int. J. Wildland Fire 2004, 13, 133–142. [Google Scholar] [CrossRef]
  24. Preisler, H.K.; Westerling, A.L. Statistical model for forecasting monthly large wildfire events in western United States. J. Appl. Meteorol. Clim. 2007, 46, 1020–1030. [Google Scholar] [CrossRef]
  25. Riley, K.L.; Abatzoglou, J.T.; Grenfell, I.C.; Klene, A.E.; Heinsch, F.A. The relationship of large fire occurrence with drought and fire danger indices in the western USA, 1984–2008, the role of temporal scale. Int. J. Wildland Fire 2013, 22, 894–909. [Google Scholar] [CrossRef]
  26. Urbieta, I.R.; Zavala, G.; Bedia, J.; Gutiérrez, J.M.; San Miguel-Ayanz, J.; Camia, A.; Keeley, J.E.; Moreno, J.M. Fire activity as a function of fire-weather seasonal severity and antecedent climate across spatial scales in southern Europe and Pacific western USA. Environ. Res. Lett. 2015, 10, 114013. [Google Scholar] [CrossRef]
  27. Riley, K.; Stonesifer, C.; Calkin, D.; Preisler, H.K. Assessing predictive services’ 7-day fire potential outlook. In Proceedings of the Large Wildland Fires Conference, Missoula, MT, USA, 19–23 May 2014; Keane, R.E., Jolly, M., Parsons, R., Riley, K., Eds.; Proc. RMRS-P-73. Department of Agriculture, Forest Service, Rocky Mountain Research Station: Fort Collins, CO, USA, 2015; pp. 188–195. [Google Scholar]
  28. Burgan, R.E.; Klaver, R.W.; Klaver, J.M. Fuel Models and Fire Potential from Satellite and Surface Observations. Int. J. Wildland Fire 1998, 83, 159–170. [Google Scholar] [CrossRef]
  29. Sebastián-López, A.; Burgan, R.E.; San Miguel-Ayanz, J. Assessment of Fire Potential in Southern Europe. In Forest Fire Research & Wildland Fire Safety; Millpress Science Publishers: Rotterdam, The Netherlands, 2002. [Google Scholar]
  30. Sebastián-Lopez, A.; San-Miguel-Ayanz, J.; Burgan, R.E. Integration of satellite sensor data, fuel type maps and meteorological observations for evaluation of forest fire risk at the pan-European scale. Int. J. Remote Sens. 2002, 23, 2713–2719. [Google Scholar] [CrossRef]
  31. Sebastián López, A.; Burgan, R.E.; Calle, A.; Palacios-Orueta, A. Calibration of the fire potential index in different seasons and bioclimatic regions of southern Europe. In Proceedings of the 4th Wildland Fire International Conference, Sevilla, Spain, 14–17 May 2007. [Google Scholar]
  32. Yunhao, C.; Li, J.; Guangxiong, P. Forest fire risk assessment combining remote sensing and meteorological information. N. Z. J. Agric. Res. 2007, 50, 1037–1044. [Google Scholar] [CrossRef]
  33. Schneider, P.; Roberts, D.A.; Kyriakidis, P.C. A VARI-based relative greenness from MODIS data for computing the fire potential index. Remote Sens. Environ. 2008, 112, 1151–1167. [Google Scholar] [CrossRef]
  34. Preisler, H.K.; Burgan, R.E.; Eidenshink, J.C.; Klaver, J.M.; Klaver, R.W. Forecasting Distributions of Large Federal-Lands Fires Utilizing Satellite And Gridded Weather Information. Int. J. Wildland Fire 2009, 18, 508–516. [Google Scholar] [CrossRef]
  35. Preisler, H.K.; Eidenshink, J.; Howard, S.; Burgan, R.E. Forecasting Distribution of Numbers of Large Fires. In Proceedings of the Large Wildland Fires Conference, Missoula, MT, USA, 19–23 May 2014; Proc. RMRS-P-73. Department of Agriculture, Forest Service, Rocky Mountain Research Station: Fort Collins, CO, USA; pp. 181–187. [Google Scholar]
  36. Burgan, R.E.; Hartford, R.A. Monitoring Vegetation Greenness with Satellite Data; General Technical Report INT-GTR-297; USDA Forest Service, Intermountain Research Station: Ogden, UT, USA, 1993.
  37. Burgan, R.E.; Hartford, R.A.; Eidenshink, J.C. Using NDVI to Assess Departure from Average Greenness and Its Relation to Fire Business; Gen. Tech. Rep. INT-GTR-333; Department of Agriculture, Forest Service, Intermountain Research Station: Ogden, UT, USA, 1996; p. 8.
  38. Illera, P.; Fernandez, A.; Calle, A.; Casanova, J.L. Temporal evolution of the NDVI as an indicator of forest fire danger. Int. J. Remote Sens. 1996, 17, 1093–1105. [Google Scholar] [CrossRef]
  39. Chuvieco, E.; Gonzalez, I.; Verdu, F.; Aguado, I.; Yebra, M. Prediction of fire occurrence from live fuel moisture content measurements in a Mediterranean ecosystem. Int. J. Wildland Fire 2009, 18, 430–441. [Google Scholar] [CrossRef]
  40. Leblon, B.; Bourgeau-Chavez, L.; San-Miguel-Ayanz, J. Use of Remote Sensing in Wildfire Management, Sustainable Development—Authoritative and Leading Edge Content for Environmental Management; Curkovic, S., Ed.; InTech: Rijeka, Croatia, 2012. [Google Scholar] [CrossRef]
  41. Yebra, D.P.; Chuvieco, E.; Riaño, D.; Zylstra, P.; Hunt, R.; Danson, F.M.; Qi, Y.; Jurdao, S. A global review of remote sensing of live fuel moisture content for fire danger assessment, Moving towards operational products. Remote Sens. Environ. 2013, 136, 455–468. [Google Scholar] [CrossRef]
  42. Fosberg, M.A. Moisture Content Calculations for the 100-Hour Timelag Fuel in Fire Danger Rating; Research Note RM-199; USDA Forest Service, Rocky Mountain Forest and Range Experimental Station: Fort Collins, CO, USA, 1971.
  43. Fosberg, M.A.; Deeming, J.E. Derivation of the 1- and 10-Hour Timelag Fuel Moisture Calculations for Fire-Danger Rating; Research Note RM-207; USDA Forest Service, Rocky Mountain Research Station: Fort Collins, CO, USA, 1971.
  44. Sudiana, D.; Kuze, H.; Takeuchi, N.; Burgan, R.E. Assessing forest fire potential in Kalimantan Island, Indonesia, using satellite and surface weather data. Int. J. Wildland Fire 2003, 12, 175–184. [Google Scholar] [CrossRef]
  45. Sebastián-López, A.; San-Miguel-Ayanz, J.; Libertà, G. An integrated forest fire risk index for Europe. In Remote Sensing in the 21st Century: A Decade of Trans-European Remote Sensing Cooperation; EARSeL: Dresden, Germany, 2000. [Google Scholar]
  46. Huesca, M.; Palacios-Orueta, A.; Montes, F.; Sebastián-López, A.; Escribano, P. Forest Fire Potential Index for Navarra Autonomic Community Spain. In Proceedings of the 4th Wildland Fire International Conference, Sevilla, Spain, 14–17 May 2007. [Google Scholar]
  47. Huesca, M.; Litago, J.; Palacios-Orueta, A.; Montes, F.; Sebastián-López, A.; Escribano, P. Assessment of forest fire seasonality using MODIS fire potential: A timeseries approach. Agric. Forest Meteorol. 2009, 149, 1946–1955. [Google Scholar] [CrossRef]
  48. Huesca, M.; Litago, J.; Merino-de-Miguel, S.; Cicuendez-López-Ocaña, V.; Palacios-Orueta, A. Modeling and forecasting MODIS-based Fire Potential Index on a pixel basis using time series models. Int. J. Appl. Earth Obs. Geoinf. 2014, 26, 363–376. [Google Scholar] [CrossRef]
  49. Manzo-Delgado, L.; Aguirre-Gómez, R.; Álvarez, R. Multitemporal analysis of land surface temperature using NOAA-AVHRR: Preliminary relationships between climatic anomalies and forest fires. Int. J. Remote Sens. 2004, 25, 4417–4423. [Google Scholar] [CrossRef]
  50. Manzo-Delgado, L.; Sánchez-Colón, S.; Álvarez, R. Assessment of seasonal forest fire risk using NOAA-AVHRR: A case study in central Mexico. Int. J. Remote Sens. 2009, 30, 4991–5013. [Google Scholar] [CrossRef]
  51. Avila-Flores, D.; Pompa-García, M.; Antonio-Nemiga, X.; Rodríguez-Trejo, D.A.; Vargas-Pérez, E.; Santillan-Pérez, J. Driving factors for forest fire occurrence in Durango State of México: A geospatial perspective. Chin. Geogr. Sci. 2010, 20, 491–497. [Google Scholar] [CrossRef]
  52. Pérez-Verdín, G.; Márquez-Linares, M.A.; Cortés-Ortiz, A.; Salmerón-Macías, M. Análisis espacio-temporal de la ocurrencia de incendios forestales en Durango, México. Spatio-temporal analysis of forest fire occurrence in Durango, Mexico. Madera Y Bosques 2013, 19, 37–58. [Google Scholar] [CrossRef]
  53. Antonio, X.; Ellis, E.A. Forest Fires and Climate Correlation in México State: A Report Based on MODIS. Adv. Remote Sens. 2015, 4, 280–286. [Google Scholar] [CrossRef]
  54. Pompa-García, M.; Camarero, J.J.; Rodríguez-Trejo, D.A.; Vega-Nieva, D.J. Drought and spatiotemporal variability of forest fires across Mexico. Chin. Geogr. Sci. 2017. [Google Scholar] [CrossRef]
  55. Sepúlveda, B.J.; Zúñiga, C.W.; Olguín, E.M.; Gomero, P.A. Implementación De Un Sistema De Información Geográfica Para La Prevención De Incendios forestales En Baja California, Folleto Científico No. 1; INIFAP, SAGAR: Baja California, Mexico, 1999. [Google Scholar]
  56. Sepúlveda, B.J.; Meza, R.; Zúñiga, C.W.; Solìs, G.; Olguín, E.M. SIG Para Determinar Riesgo De Incendios Forestales En El Noroeste De Mexico; INIFAP, SAGAR: Baja California, Mexico, 2001. [Google Scholar]
  57. Giglio, L.; Descloitres, J.; Justice, C.O.; Kaufman, Y.J. An enhanced contextual fire detection algorithm for MODIS. Remote Sens. Environ. 2003, 87, 273–282. [Google Scholar] [CrossRef]
  58. Cruz-Lopez, M.I.; Lopez-Saldaña, G.; Ressl, R.; Colditz, R. Sistema de alerta temprana para incendios forestales en México. In Mas, JF. Coord., Aplicaciones Del Sensor MODIS Para El Monitoreo Del Territorio; SEMARNAT, INE CIGA-UNAM: Mexico City, Mexico, 2011. [Google Scholar]
  59. Cruz-Lopez, M.I. The National System for Satellite based real-time wildfire monitoring. In Latin America Geospatial Forum; INEGI: México City, Mexico, 24 September 2014. [Google Scholar]
  60. Vega-Nieva, D.; Nava-Miranda, M.G.; Calleros-Flores, E.; Lopez-Serrano, P.M.; Briseño-Reyes, J.; Lopez-Sanchez, C.A.; Flores-Medina, F.; Corral-Rivas, J.J.; Gonzalez-Caban, A.; Alvarado-Celestino, E.; et al. Developing a Forest Fire Danger System for Mexico. In Proceedings of the V International Simposium on Fire Economics, Planning and Policy, Wildfires and Ecosystem Services, Tegucigalpa, Honduras, 14–18 November 2016. [Google Scholar]
  61. Vega-Nieva, D.J.; Nava-Miranda, M.G.; Calleros-Flores, E.; López-Serrano, P.M.; Briseño-Reyes, J.; López-Sánchez, C.A.; Corral-Rivas, J.J.; Montiel-Antuna, E.; Alvarado-Celestino, E.; González-Cabán, A.; et al. Temporal patterns of fire density by vegetation type and region in Mexico and its temporal relationships with a monthly satellite fuel greenness index. Fire Ecol. under review.
  62. Rodríguez-Trejo, D.A. Fire regimes, fire ecology and fire management in México. AMBIO A J. Hum. Environ. 2008, 377, 548–556. [Google Scholar] [CrossRef]
  63. Yocom, L.L.; Fulè, P.Z.; Brown, P.M.; Cerano-Paredes, J.; Villanueva, J.; Cornejo Oviedo, E.; Falk, D.A. El Nino–Southern Oscillation effect on a fire regime in northeastern Mexico has changed over time. Ecology 2010, 91, 1660–1671. [Google Scholar] [CrossRef] [PubMed]
  64. Yocom, L.L.; Fulè, P.Z. Human and climate influences on frequent fire in a high-elevation tropical forest. J. Appl. Ecol. 2012, 49, 1356–1364. [Google Scholar] [CrossRef]
  65. Jardel, E.J.; Alvarado, E.; Morfín-Ríos, J.E.; Castillo-Navarro, F.; Flores-Garnica, J.G. Regímenes de incendios en ecosistemas forestales de México. In Impacto Ambiental De Incendios Forestales; Flores-Garnica, J.G., Ed.; Mundi-Prensa, INIFAP y Colegio de Postgraduados: México City, Mexico, 2009. [Google Scholar]
  66. Rodríguez-Trejo, D.A.; Fulé, P.Z. Fire ecology of Mexican pines and fire management proposal. Int. J. Wildland Fire 2003, 12, 23–37. [Google Scholar] [CrossRef]
  67. Cruz-Lopez, M.I. Sistema de alerta temprana, monitoreo e impacto de los incendios forestales en México y Centroamérica. In Proceedings of the 4th Wildland Fire International Conference, Sevilla, Spain, 14–17 May 2007; Available online: http://www.fire.uni-freiburg.de/sevilla-2007/contributions/doc/REGIONALES/A_IBEROAMERICA/Cruz_MEJICO.pdf (accessed on 20 March 2017).
  68. He, L.; Li, Z. Enhancement of a fire-detection algorithm by eliminating solar contamination effects and atmospheric path radiance: Application to MODIS data. Int. J. Remote Sens. 2011, 32, 6273–6293. [Google Scholar] [CrossRef]
  69. Cervera-Taboada, A. Implementación de un modelo para estimar la humedad en el combustible muerto, basado en datos de sensores remotos. In Reporte De Investigación Grado De Licenciatura; UNAM: México City, Mexico, 2009. [Google Scholar]
  70. De Badts, E.; López, G.; Wickel, B.; Cruz, I.; Jiménez, R. A fire risk propagation map based on NDVI anomalies. In Proceedings of the 5th International Workshop on Remote Sensing and GIS Applications to Forest FIRE Management: FIRE Effects Assessment, Universidad de Zaragoza, Zaragoza, Spain, 16–18 June 2005. [Google Scholar]
  71. Setzer, A.W.; Sismanoglu, R.A. Risco De Fogo: Metodologia Do Cálculo—Descrição Sucinta Da Versão 9; INPE Report; INPE: São José dos Campos, Brazil, 2012. [Google Scholar]
  72. Koenker, R.; Park, B.J. An Interior Point Algorithm for Nonlinear Quantile Regression. J. Econom. 1994, 71, 265–283. [Google Scholar] [CrossRef]
  73. R Core Team. R: A Language and Environment for Statistical Computing; R Foundation for Statistical Computing: Vienna, Austria, 2017; Available online: https://www.R-project.org/ (accessed on 20 March 2017).
  74. Ryan, T.P. Modern Regression Methods. In Wiley Series in Probability and Statistics; John Wile and Sons: New York, NY, USA, 1997; 515p. [Google Scholar]
  75. Roads, J.; Fujioka, F.; Chen, S.; Burgan, R. Seasonal Fire Danger Forecasts for the USA. Int. J. Wildland Fire 2005, 19, 399–414. [Google Scholar] [CrossRef]
  76. Roads, J.; Tripp, P.; Juang, H.; Wang, J.; Fujioka, F.; Chen, S. Ncep-Ecpc Monthly To Seasonal Us Fire Danger Forecasts. Int. J. Wildland Fire 2010, 19, 399–414. [Google Scholar] [CrossRef]
  77. Chen, S.C.; Preisler, H.K.; Fujioka, F.; Benoit, J.W.; Roads, J.O. Seasonal Predictions for Wildland Fire Severity. In Proceedings of the Third International Symposium on Fire Economics, Planning, and Policy: Common Approaches and Problems, Carolina, Puerto Rico, 26–29 April 2009. [Google Scholar]
  78. Preisler, H.K.; Chen, S.C.; Fujioka, F.; Benoit, J.W.; Westerling, A.L. Wildland fire probabilities estimated from weather model-deduced monthly mean fire danger indices. Int. J. Wildland Fire 2008, 17, 305–316. [Google Scholar] [CrossRef]
  79. Díaz-Avalos, C.; Peterson, D.L.; Alvarado, E.; Ferguson, S.A.; Besag, J.E. Space–time modelling of lightning-caused ignitions in the Blue Mountains, Oregon. Can. J. For. Res. 2001, 31, 1579–1593. [Google Scholar]
  80. Botequim, B.; Garcia-Gonzalo, J.; Marques, S.; Ricardo, A.; Borges, J.G.; Tomé, M.; Oliveira, M.M. Developing wildfire risk probability models for Eucalyptus globulus stands in Portugal. iForest 2013, 6, 217–227. [Google Scholar] [CrossRef]
  81. Oliveira, S.; Moreira, F.; Boca, R.; San-Miguel-Ayanz, J.; Pereira, J.M.C. Assessment of fire selectivity in relation to land cover and topography: A comparison between Southern European countries. Int. J. Wildland Fire 2013, 23, 620–630. [Google Scholar] [CrossRef]
  82. Ager, A.A.; Preisler, H.K.; Arca, B.; Spano, D.; Salis, M. Wildfire risk estimation in the Mediterranean area. Environmetrics 2014, 25, 384–396. [Google Scholar] [CrossRef]
  83. Schroeder, W.; Oliva, P.; Giglio, L.; Csiszar, I. The new VIIRS 375 m active fire detection data product: Algorithm description and initial assessment. Remote Sens. Environ. 2014, 143, 85–96. [Google Scholar] [CrossRef]
  84. Vilar, L.; Camia, A.; San Miguel-Ayanz, J. A comparison of remote sensing products and forest fire statistics for improving fire information in Mediterranean Europe. Eur. J. Remote Sens. 2015, 48, 345–364. [Google Scholar] [CrossRef]
  85. Vasconcelos, M.J.P.; Silva, S.; Tome, M.; Alvim, M.; Pereira, J.M.C. Spatial prediction of fire ignition probabilities: Comparing logistic regression and neural networks. Photogramm. Eng. Rem. Sens. 2001, 67, 73–83. [Google Scholar]
  86. Sebastián-López, A.; Salvador-Civil, R.; Gonzalo-Jimenez, J.; San-Miguel Ayanz, J. Integration of socio-economic and environmental variables for modelling long-term fire danger in Southern Europe. Eur. J. For. Res. 2008, 127, 149–163. [Google Scholar] [CrossRef]
  87. Oliveira, S.; Oehler, F.; San-Miguel-Ayanz, J.; Camia, A.; Pereira, J.M.C. Modeling spatial patterns of fire occurrence in Mediterranean Europe using Multiple Regression and Random Forest. For. Ecol. Manag. 2012, 275, 117–129. [Google Scholar] [CrossRef]
  88. Oliveira, S.; Pereira, J.M.C.; San Miguel-Ayanz, J.; Lourenço, L. Exploring the spatial patterns of fire density in Southern Europe using geographically weighted regression. Appl. Geogr. 2014, 51, 143–157. [Google Scholar] [CrossRef]
Figure 1. Map of vegetation types and regions. Source: INEGI Land Use Map Series V (2011), 1:25,000. FOR: temperate forest; DTROPF: dry tropical forest; WTROPF: wet tropical forest; SDTROPF: seasonally dry tropical forest; SWTROPF: seasonally wet tropical forest; WET: wetlands; AGR: agricultural croplands; NPAS: natural pastureland; DSHR: desert shrubby vegetation; POPUL: major population centers; WATER: water bodies; NW, NE, C, NC, S: Northwest, Northeast, Centre, North-Centre, and South regions, respectively.
Forests 09 00190 g001
Figure 2. Observed Fuel Dryness Index (FDI) for temperate forest of the Northwest (NW), Northeast (NE), Centre (C), and South (S) regions and for dry and wet tropical forests and wetlands of the South (S) region. FDI: Fuel dryness Index; FOR: temperate forest; DTROPF: dry topical forest; WTROPF: wet topical forest; WET: wetlands. Dotted lines of the corresponding color represent the FDI95 threshold values for each vegetation type (Table 1).
Forests 09 00190 g002
Figure 3. Predicted and observed Fire Hotspot Density with the best fit mode for temperate forest of the NW region (a); Centre region (b); Northeas region (c) and wetlands of the South region (d). FOR: temperate forest, WET: wetlandst; NW, NE, S: Northwest, Northeast, and South regions, respectively. PREDpxx: predicted values with the xx best fit percentile; OBS: observed values. FHD: Fire Hotspot Density index (Equation (1) for observed values; Equation (10), with coefficients from Table 2 for predicted values).
Forests 09 00190 g003
Table 1. FDIp threshold values for p = 95%, 90%, 80%.
Veg_RegFDI95FDI90FDI85
FOR_NW596670
FOR_NE525559
FOR_C475357
FOR_S384245
FOR_NC596670
DTROPF_C465357
DTROPF_S485254
DTROPF_NE465153
DTROPF_NW596568
SWTROPF_S465053
SDTROPF_S485153
WTROPF_S414547
WET_S434648
AGR_C445155
AGR_NW576468
AGR_NE525458
AGR_S424750
NPAS_C505660
p: percentage of hotspots that occurred above the FDIp value; Veg_Reg: vegetation type and region; FOR: temperate forest; DTROPF: dry tropical forest; WTROPF: wet tropical forest; SDTROPF: seasonally dry tropical forest; SWTROPF: seasonally wet tropical forest; WET: wetlands; AGR: agricultural cropland; NPAS: natural pastureland; NW, NE, C, NC, S: Northwest, Northeast, Centre, North-Centre, and South regions, respectively.
Table 2. Coefficients and goodness of fit statistics of the best models for predicting fire hotspot density.
Veg_RegPercCoefficientsGoodness of Fit
abcR2RMSEBias
FOR_NW8013.73.140.760.70743.4−10.6
FOR_NE9022.82.200.800.61939.6−8.6
FOR_C8011.51.980.830.70341.6−9.5
FOR_S701.84.700.720.57557.4−5.9
FOR_NC955.63.490.610.46321.4−6.9
DTROPF_C809.61.980.840.72540.3−12.9
DTROPF_NW8541.90.880.700.52329.1−11.1
DTROPF_NE9035.70.950.590.46121.7−5.1
DTROPF_S8078.60.590.750.60160.3−13.5
WTROPF_S8038.61.950.740.58731.9−8.2
SWTROPF_S65100.81.350.700.62562.1−7.92
SDTROPF_S75129.40.770.710.49681.4−7.5
WET_S7016.92.490.670.51148.1−8.69
AGR_C909.91.830.800.71232.6−14.4
AGR_NW9024.40.820.610.45723.5−10.8
AGR_NE9025.80.610.780.61518.9−9.2
AGR_S6520.21.590.830.70842.2−8.7
NPAS_C8011.11.290.840.72724.1−7.7
Veg_Reg: vegetation type and region; Perc: percentile selected for the best fitted percentile non-linear regression model; a, b, and c are model coefficients for Equation (10), using the threshold values FDI95 for calculation of AcFDI; R2: coefficient of determination; RMSE: root mean square error (FHD units: Equation (1)); Bias: model bias (FHD units: Equation (1)); FOR: temperate forest; DTROPF: dry tropical forest; WTROPF: wet tropical forest; SDTROPF: seasonally dry tropical forest; SWTROPF: seasonally wet tropical forest; WET: wetlands; AGR: agriculture; NPAS: natural pastureland; NW, NE, C, NC, S: Northwest, Northeast, Centre, North-Centre, and South regions.

