Topoedaphic and Forest Controls on Post-Fire Vegetation Assemblies Are Modified by Fire History and Burn Severity in the Northwestern Canadian Boreal Forest


Abstract
:1. Introduction
2. Methods
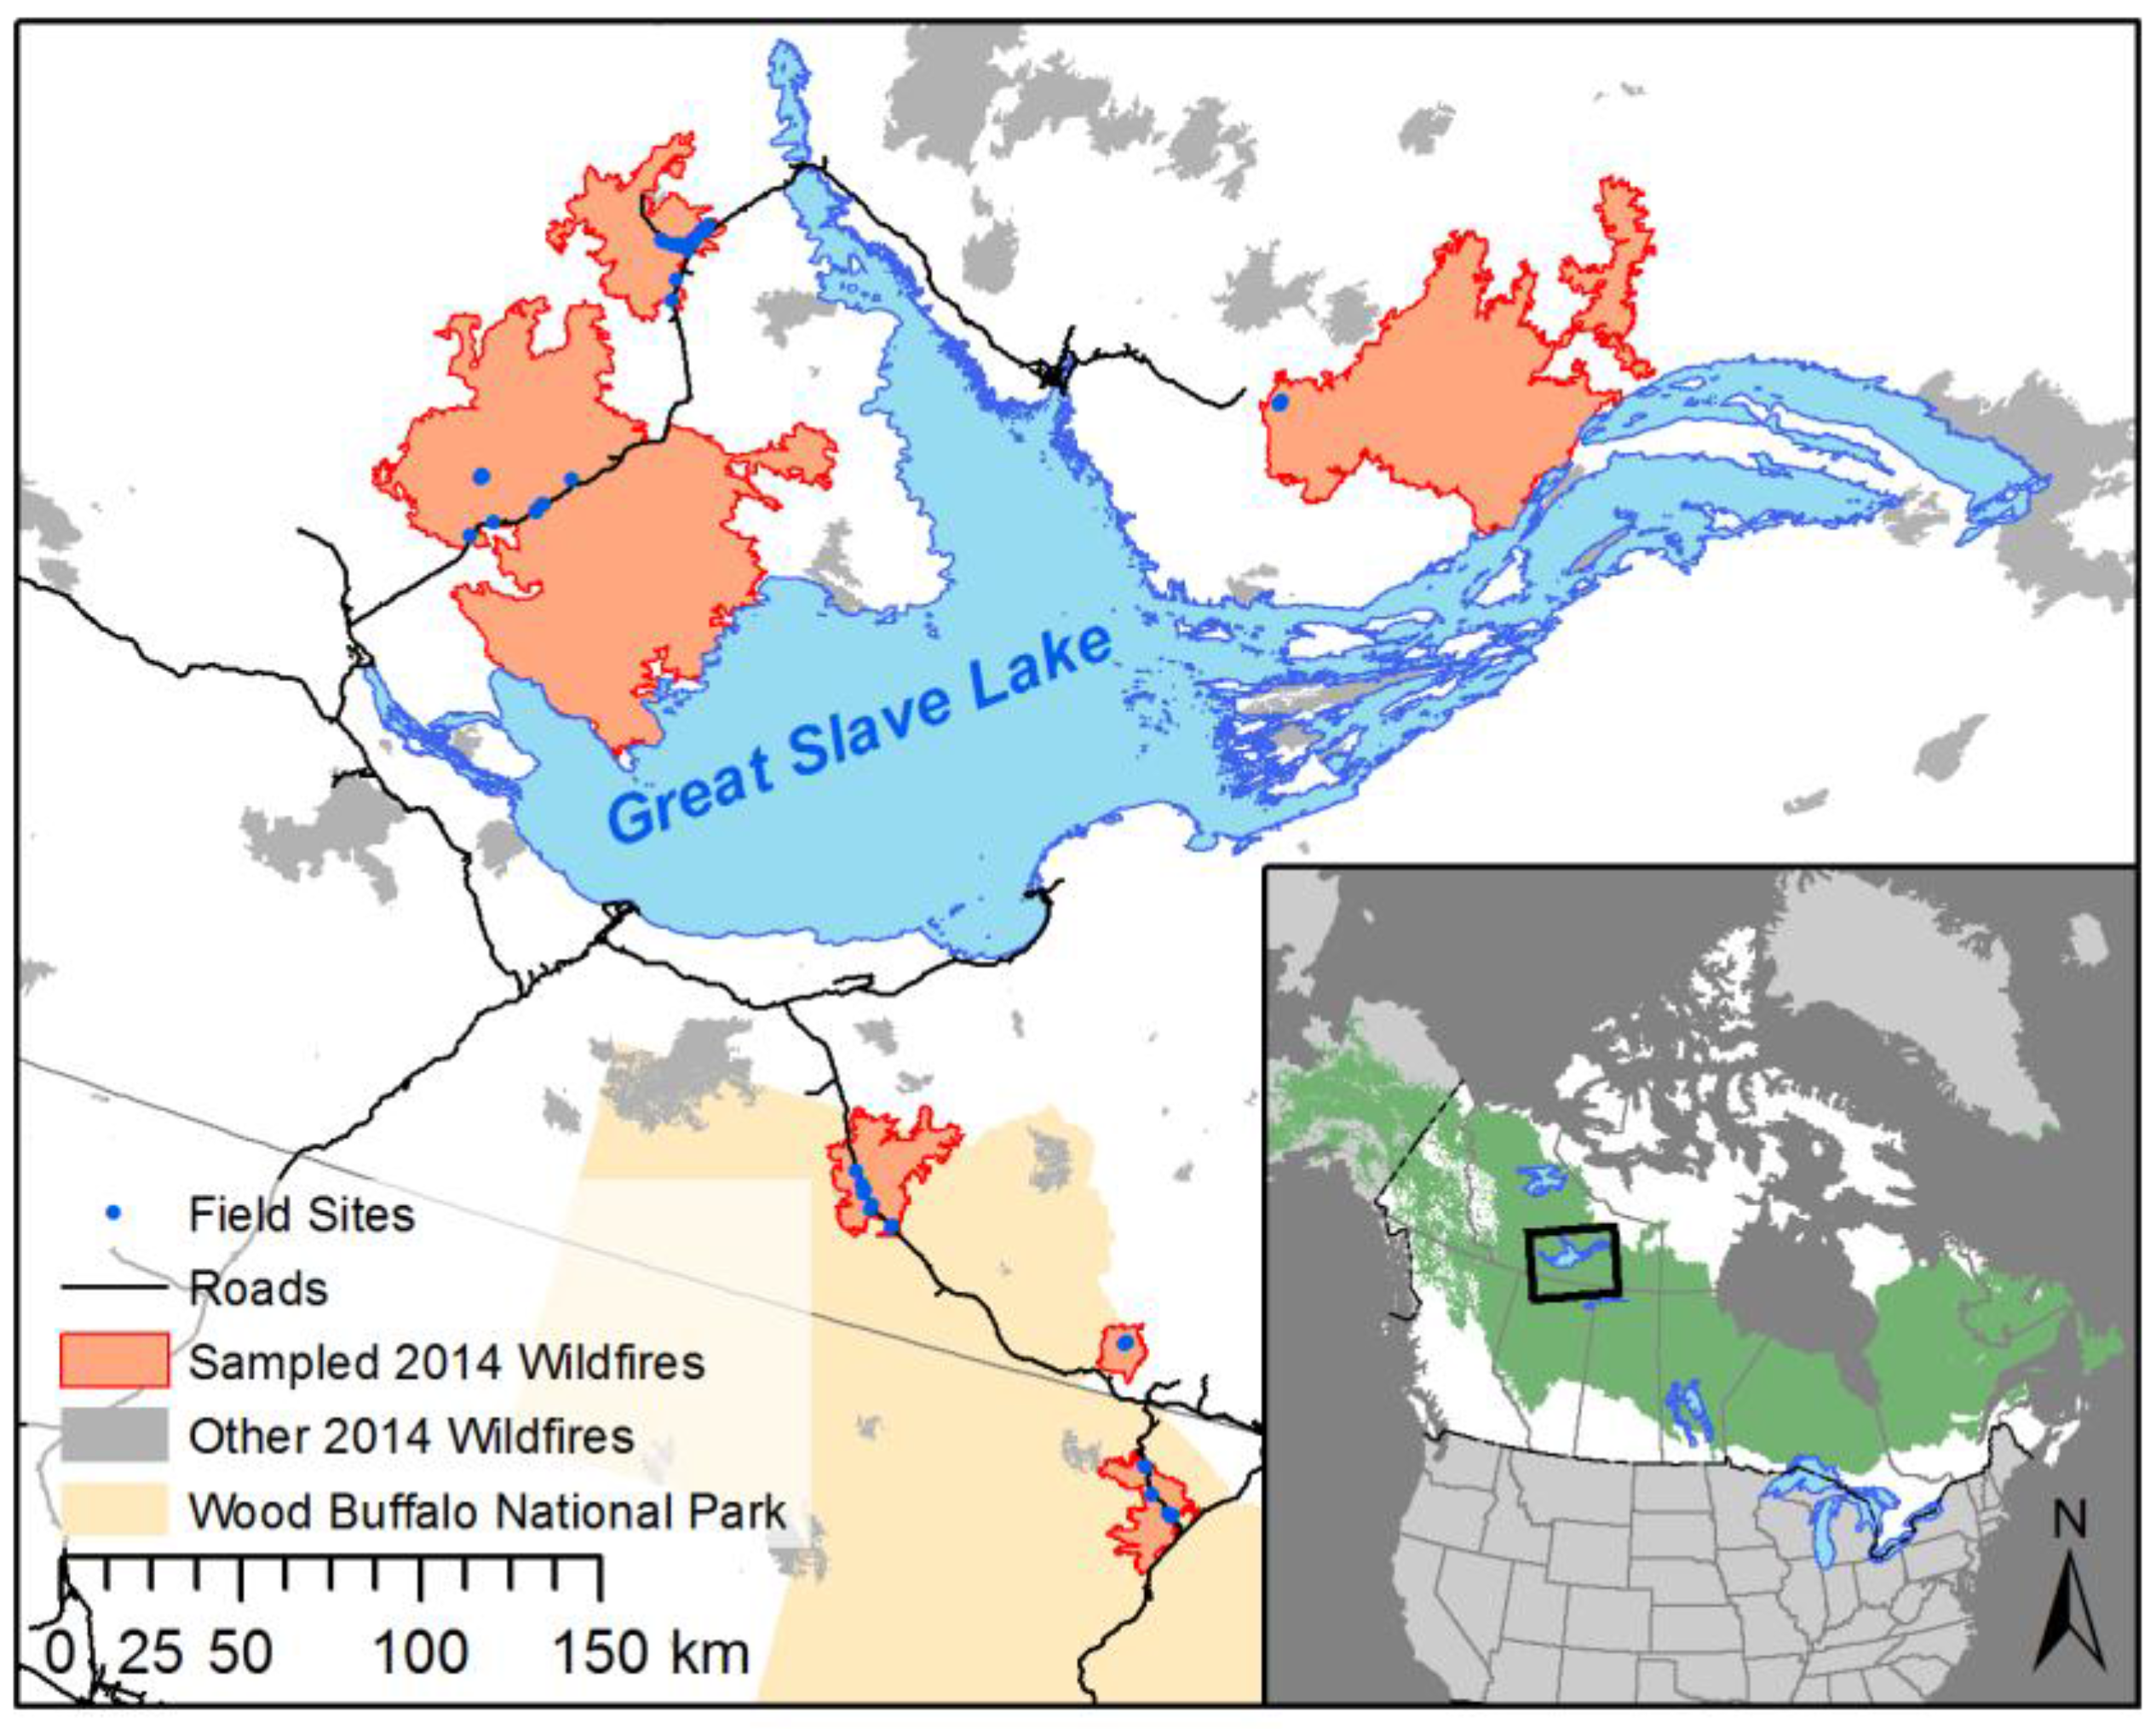
2.1. Study Area
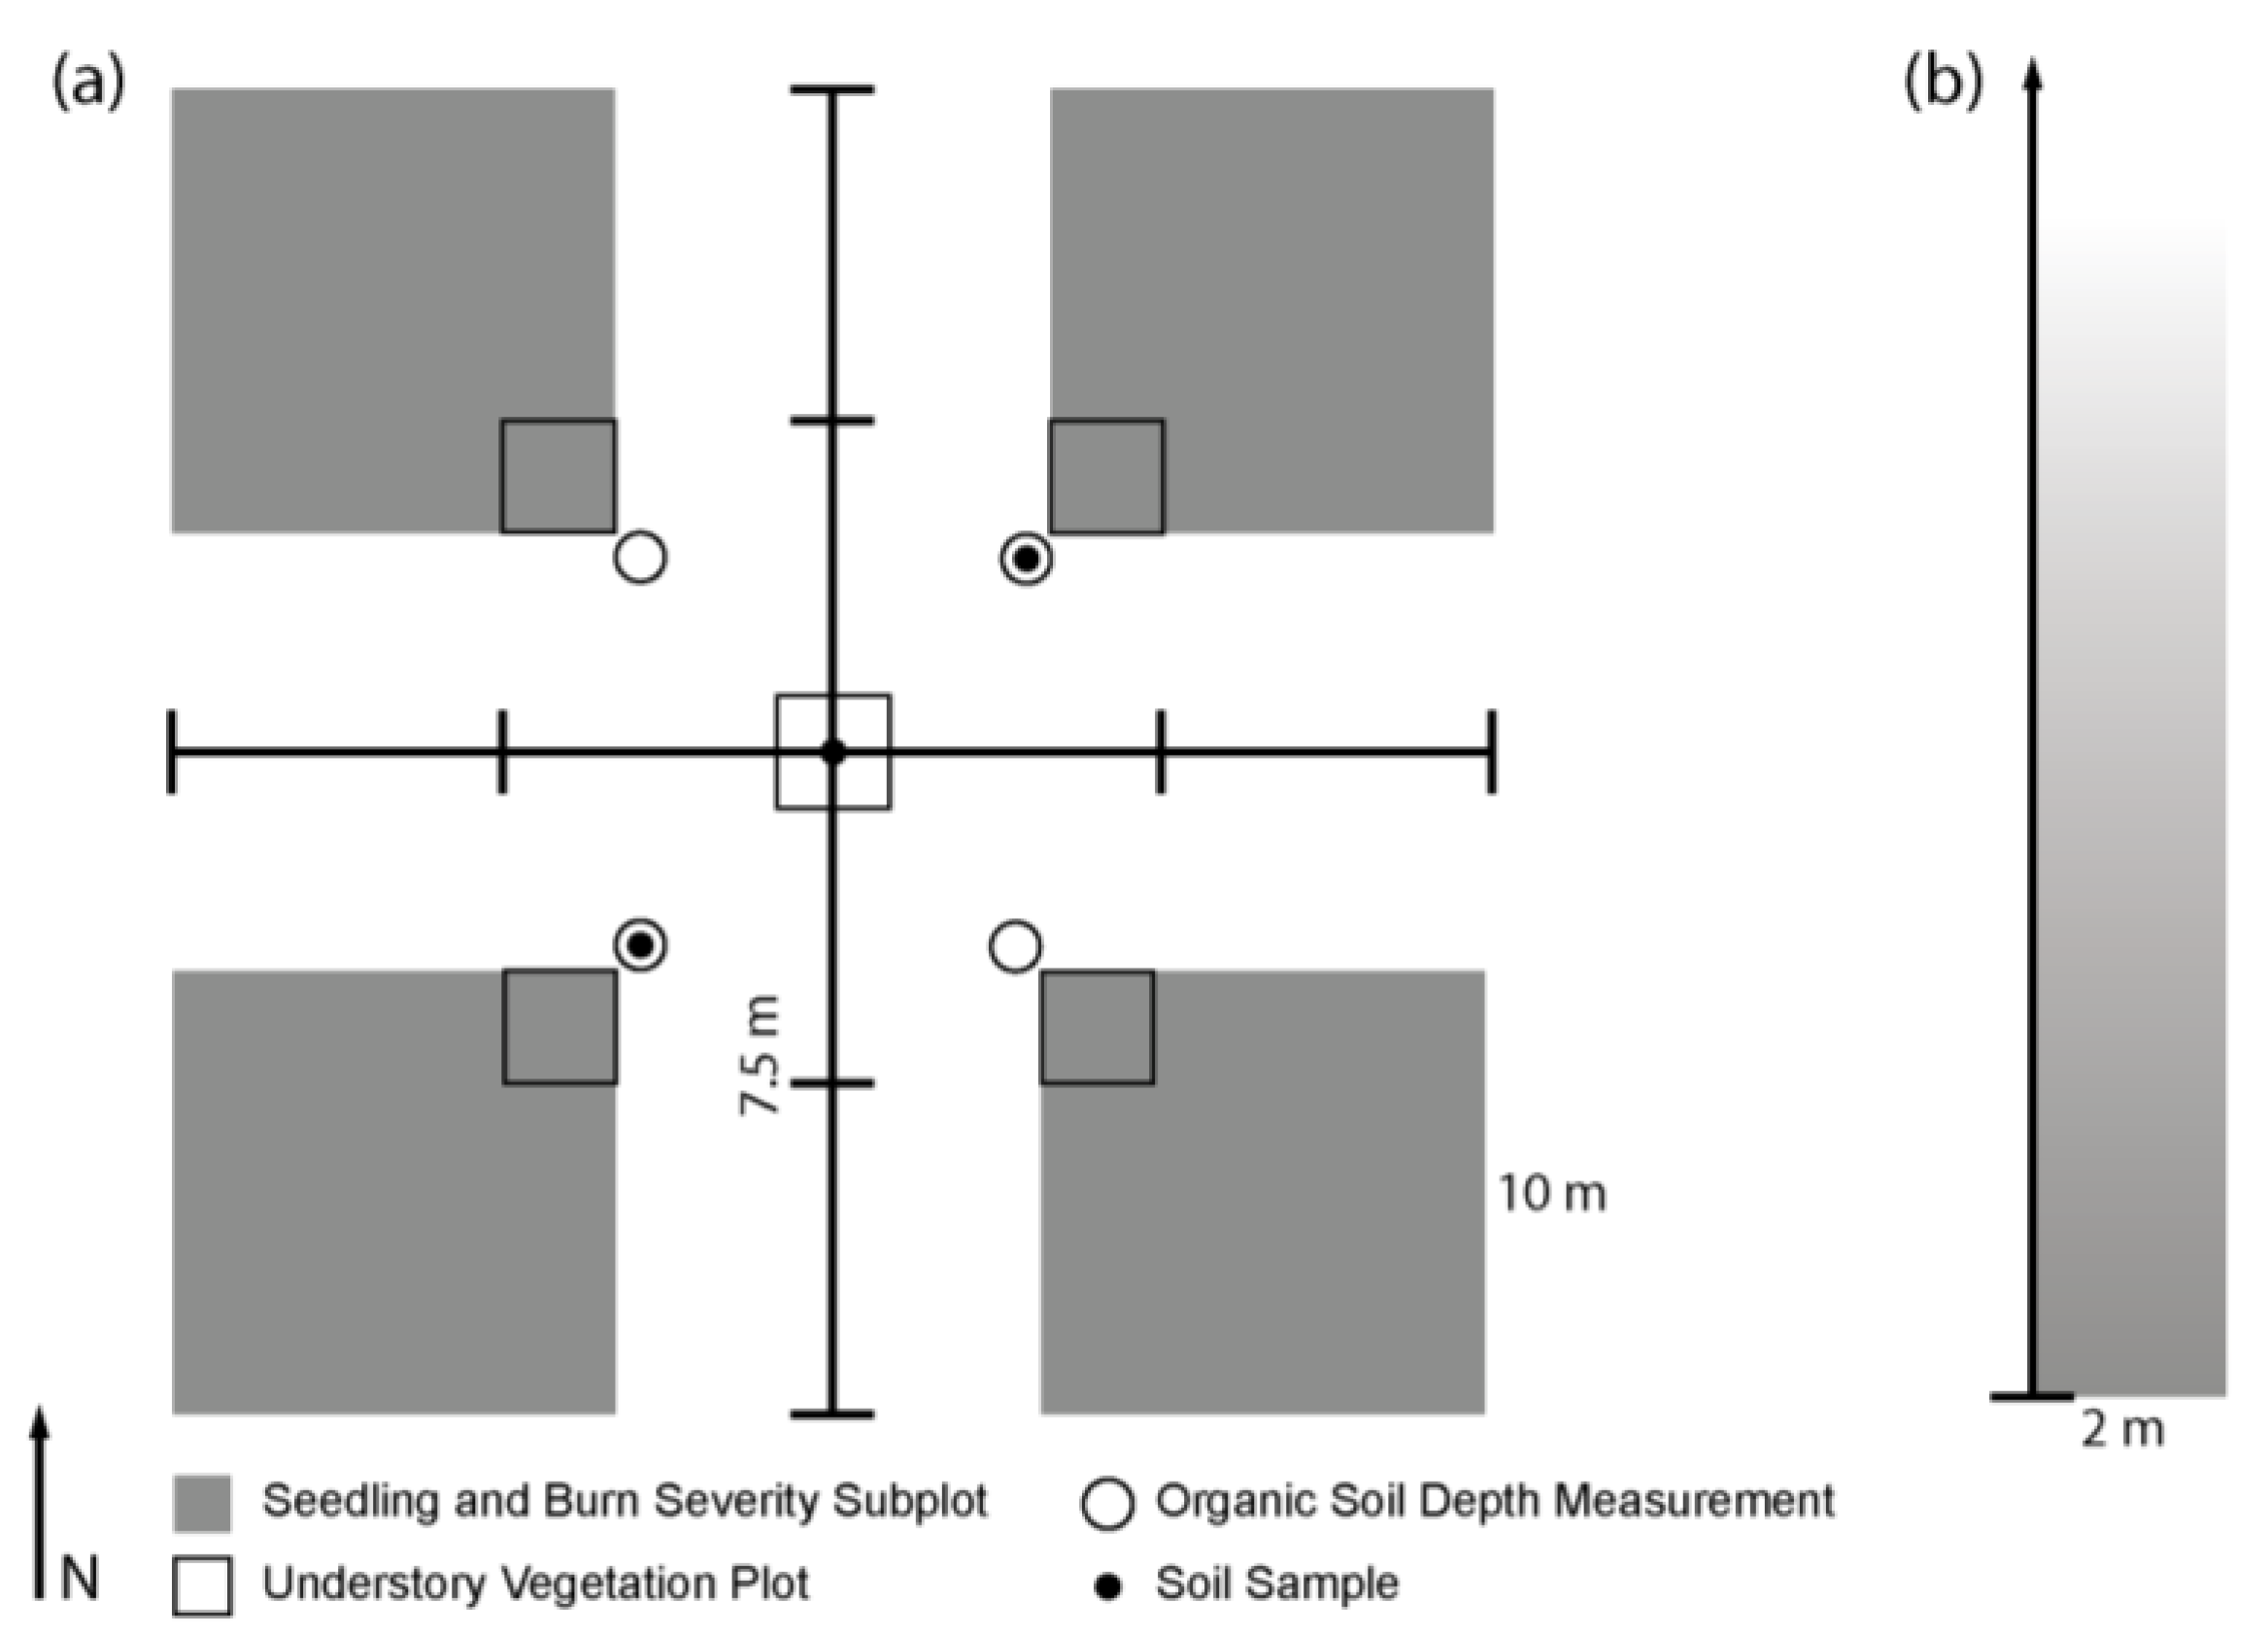
2.2. Field Methods
2.3. Analysis
3. Results
4. Discussion
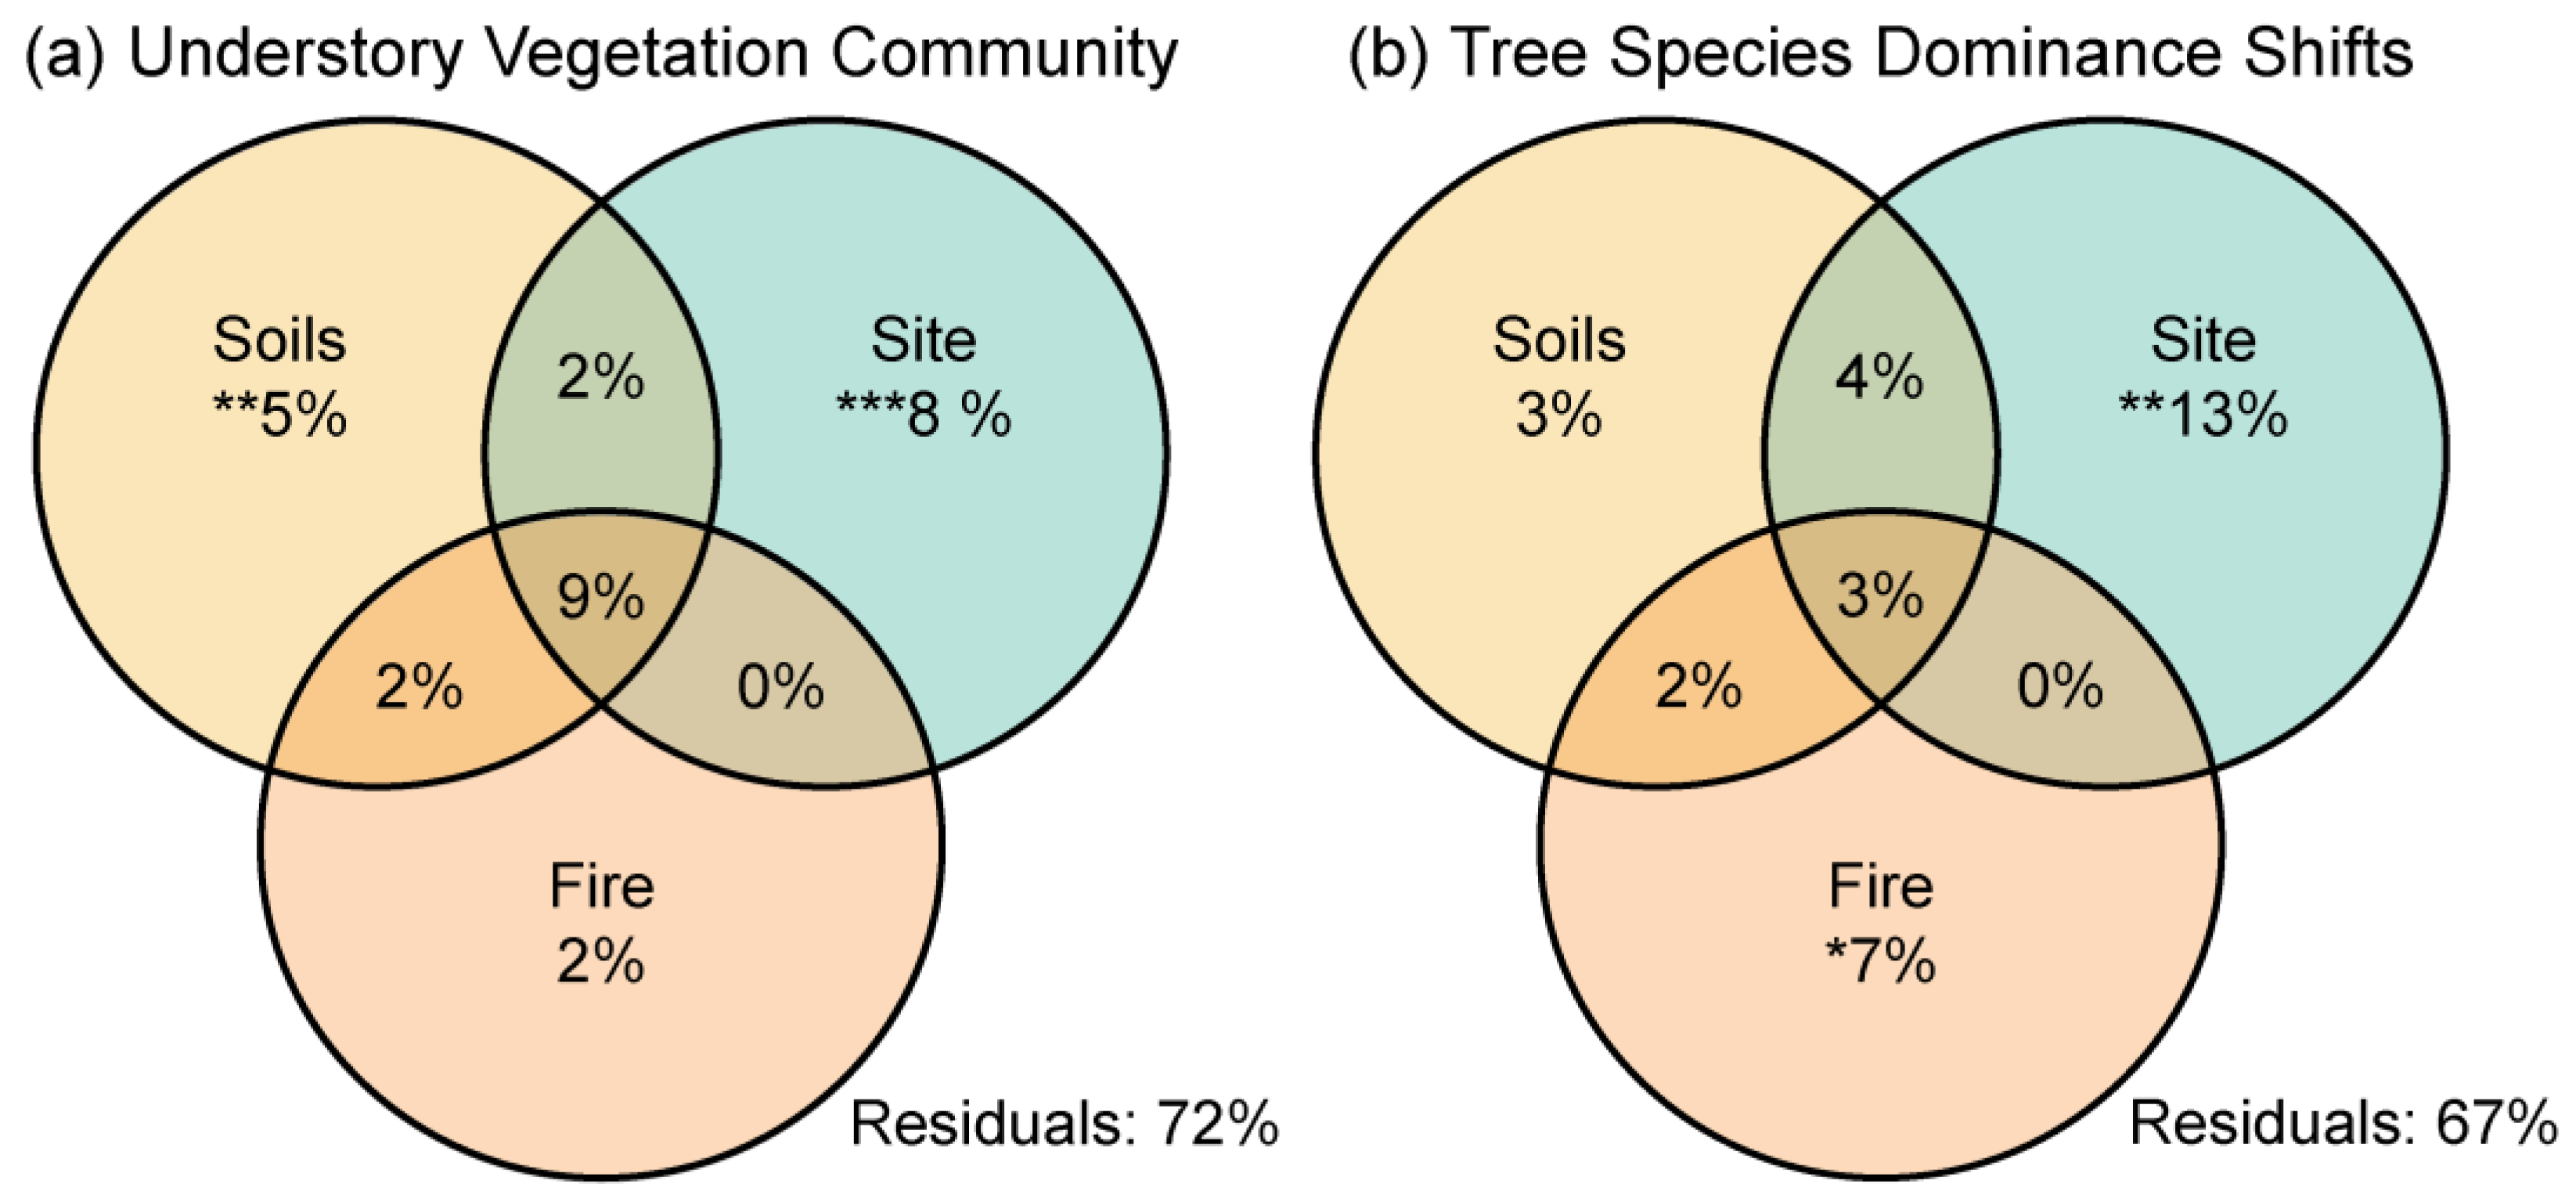
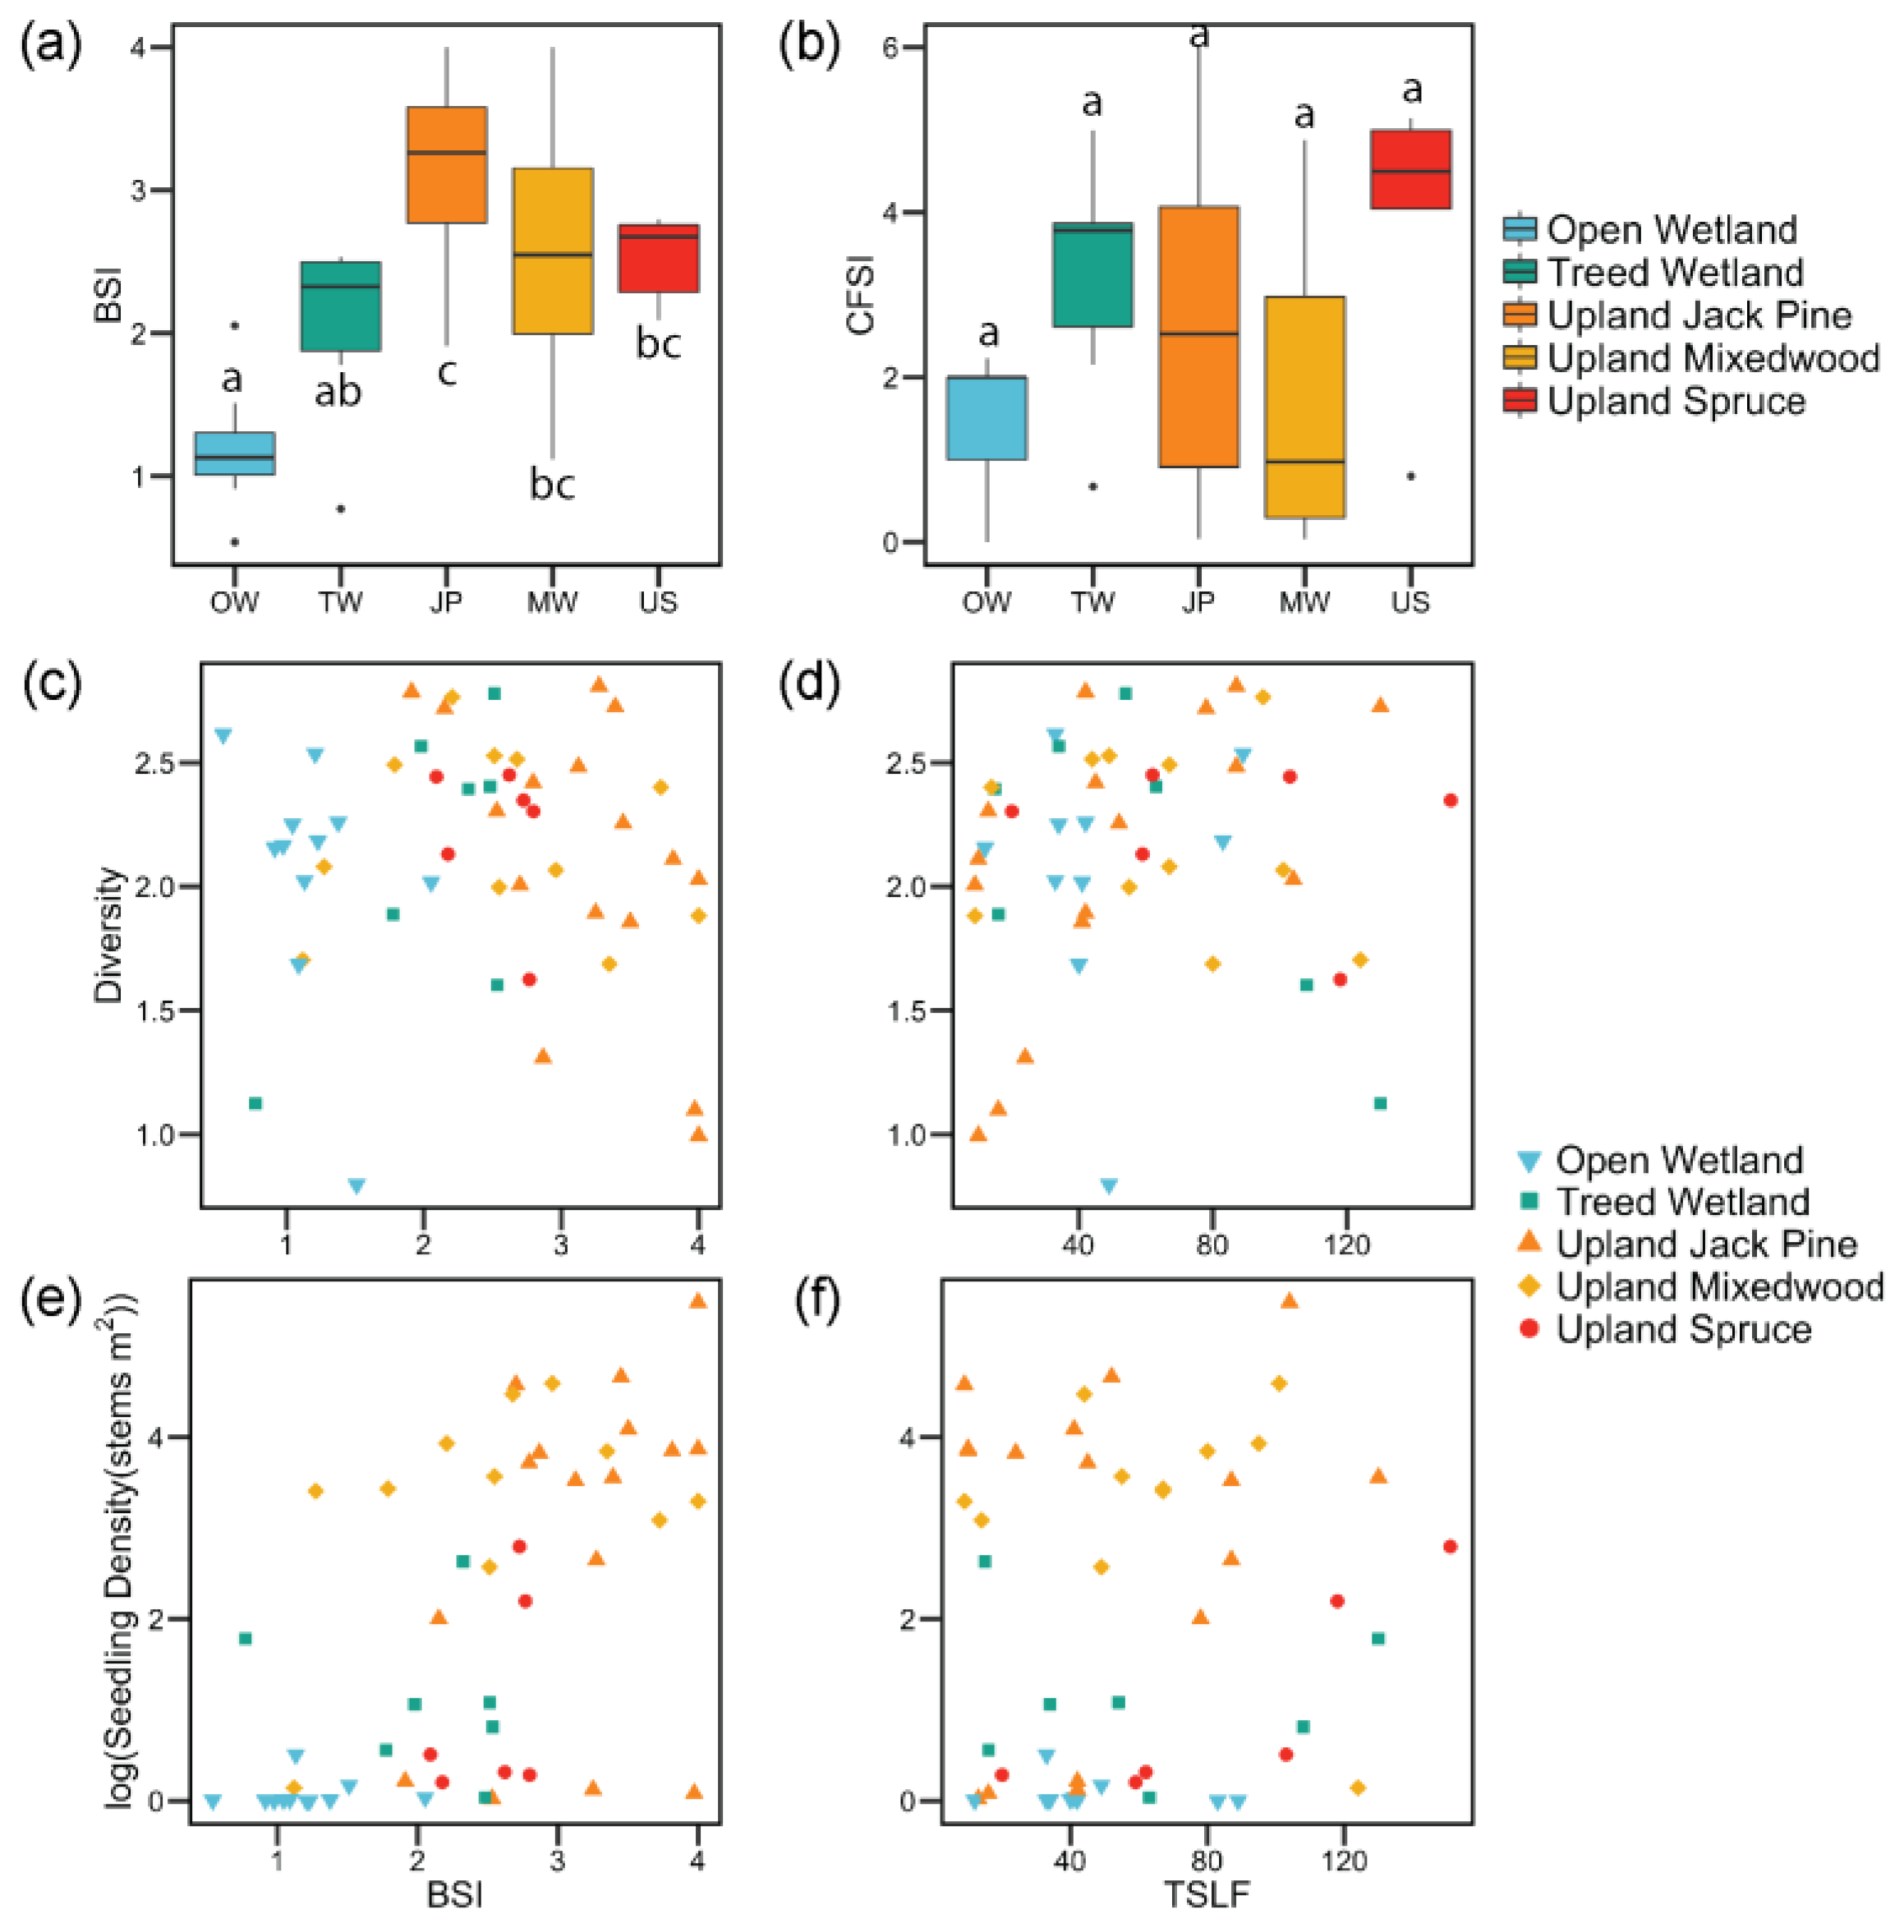
4.1. Post-Fire Vegetation Communities of Vascular Plants
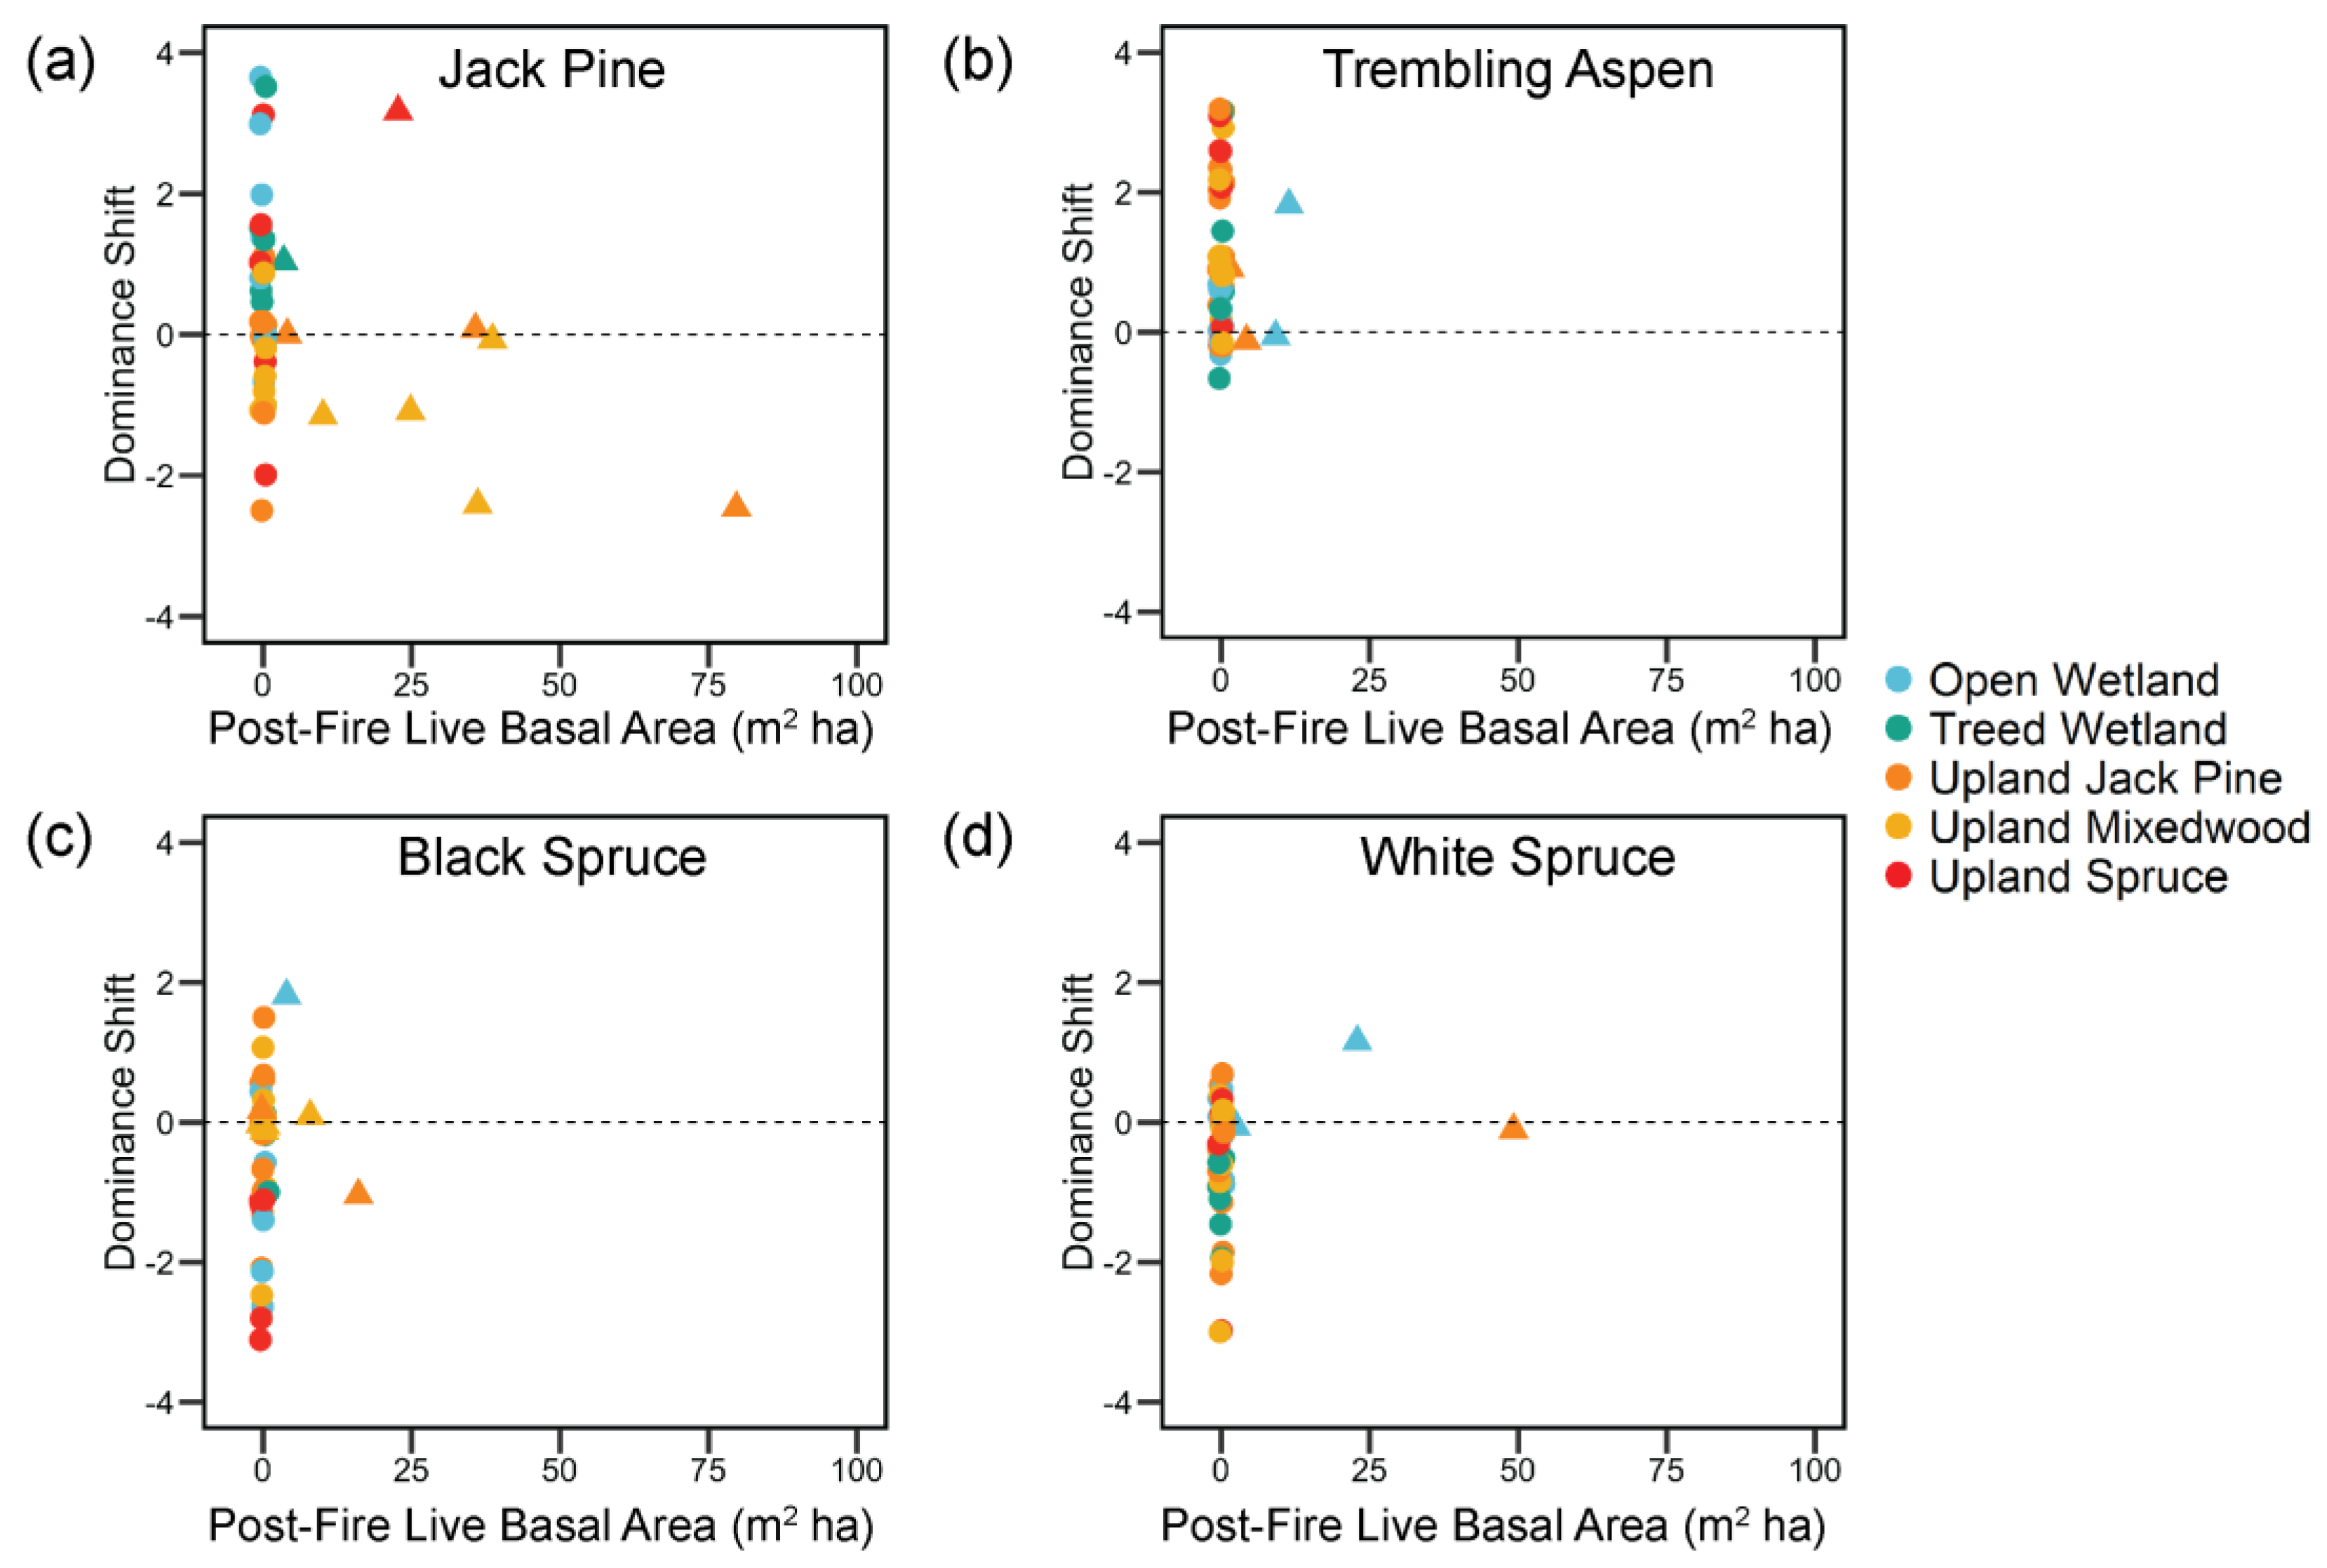
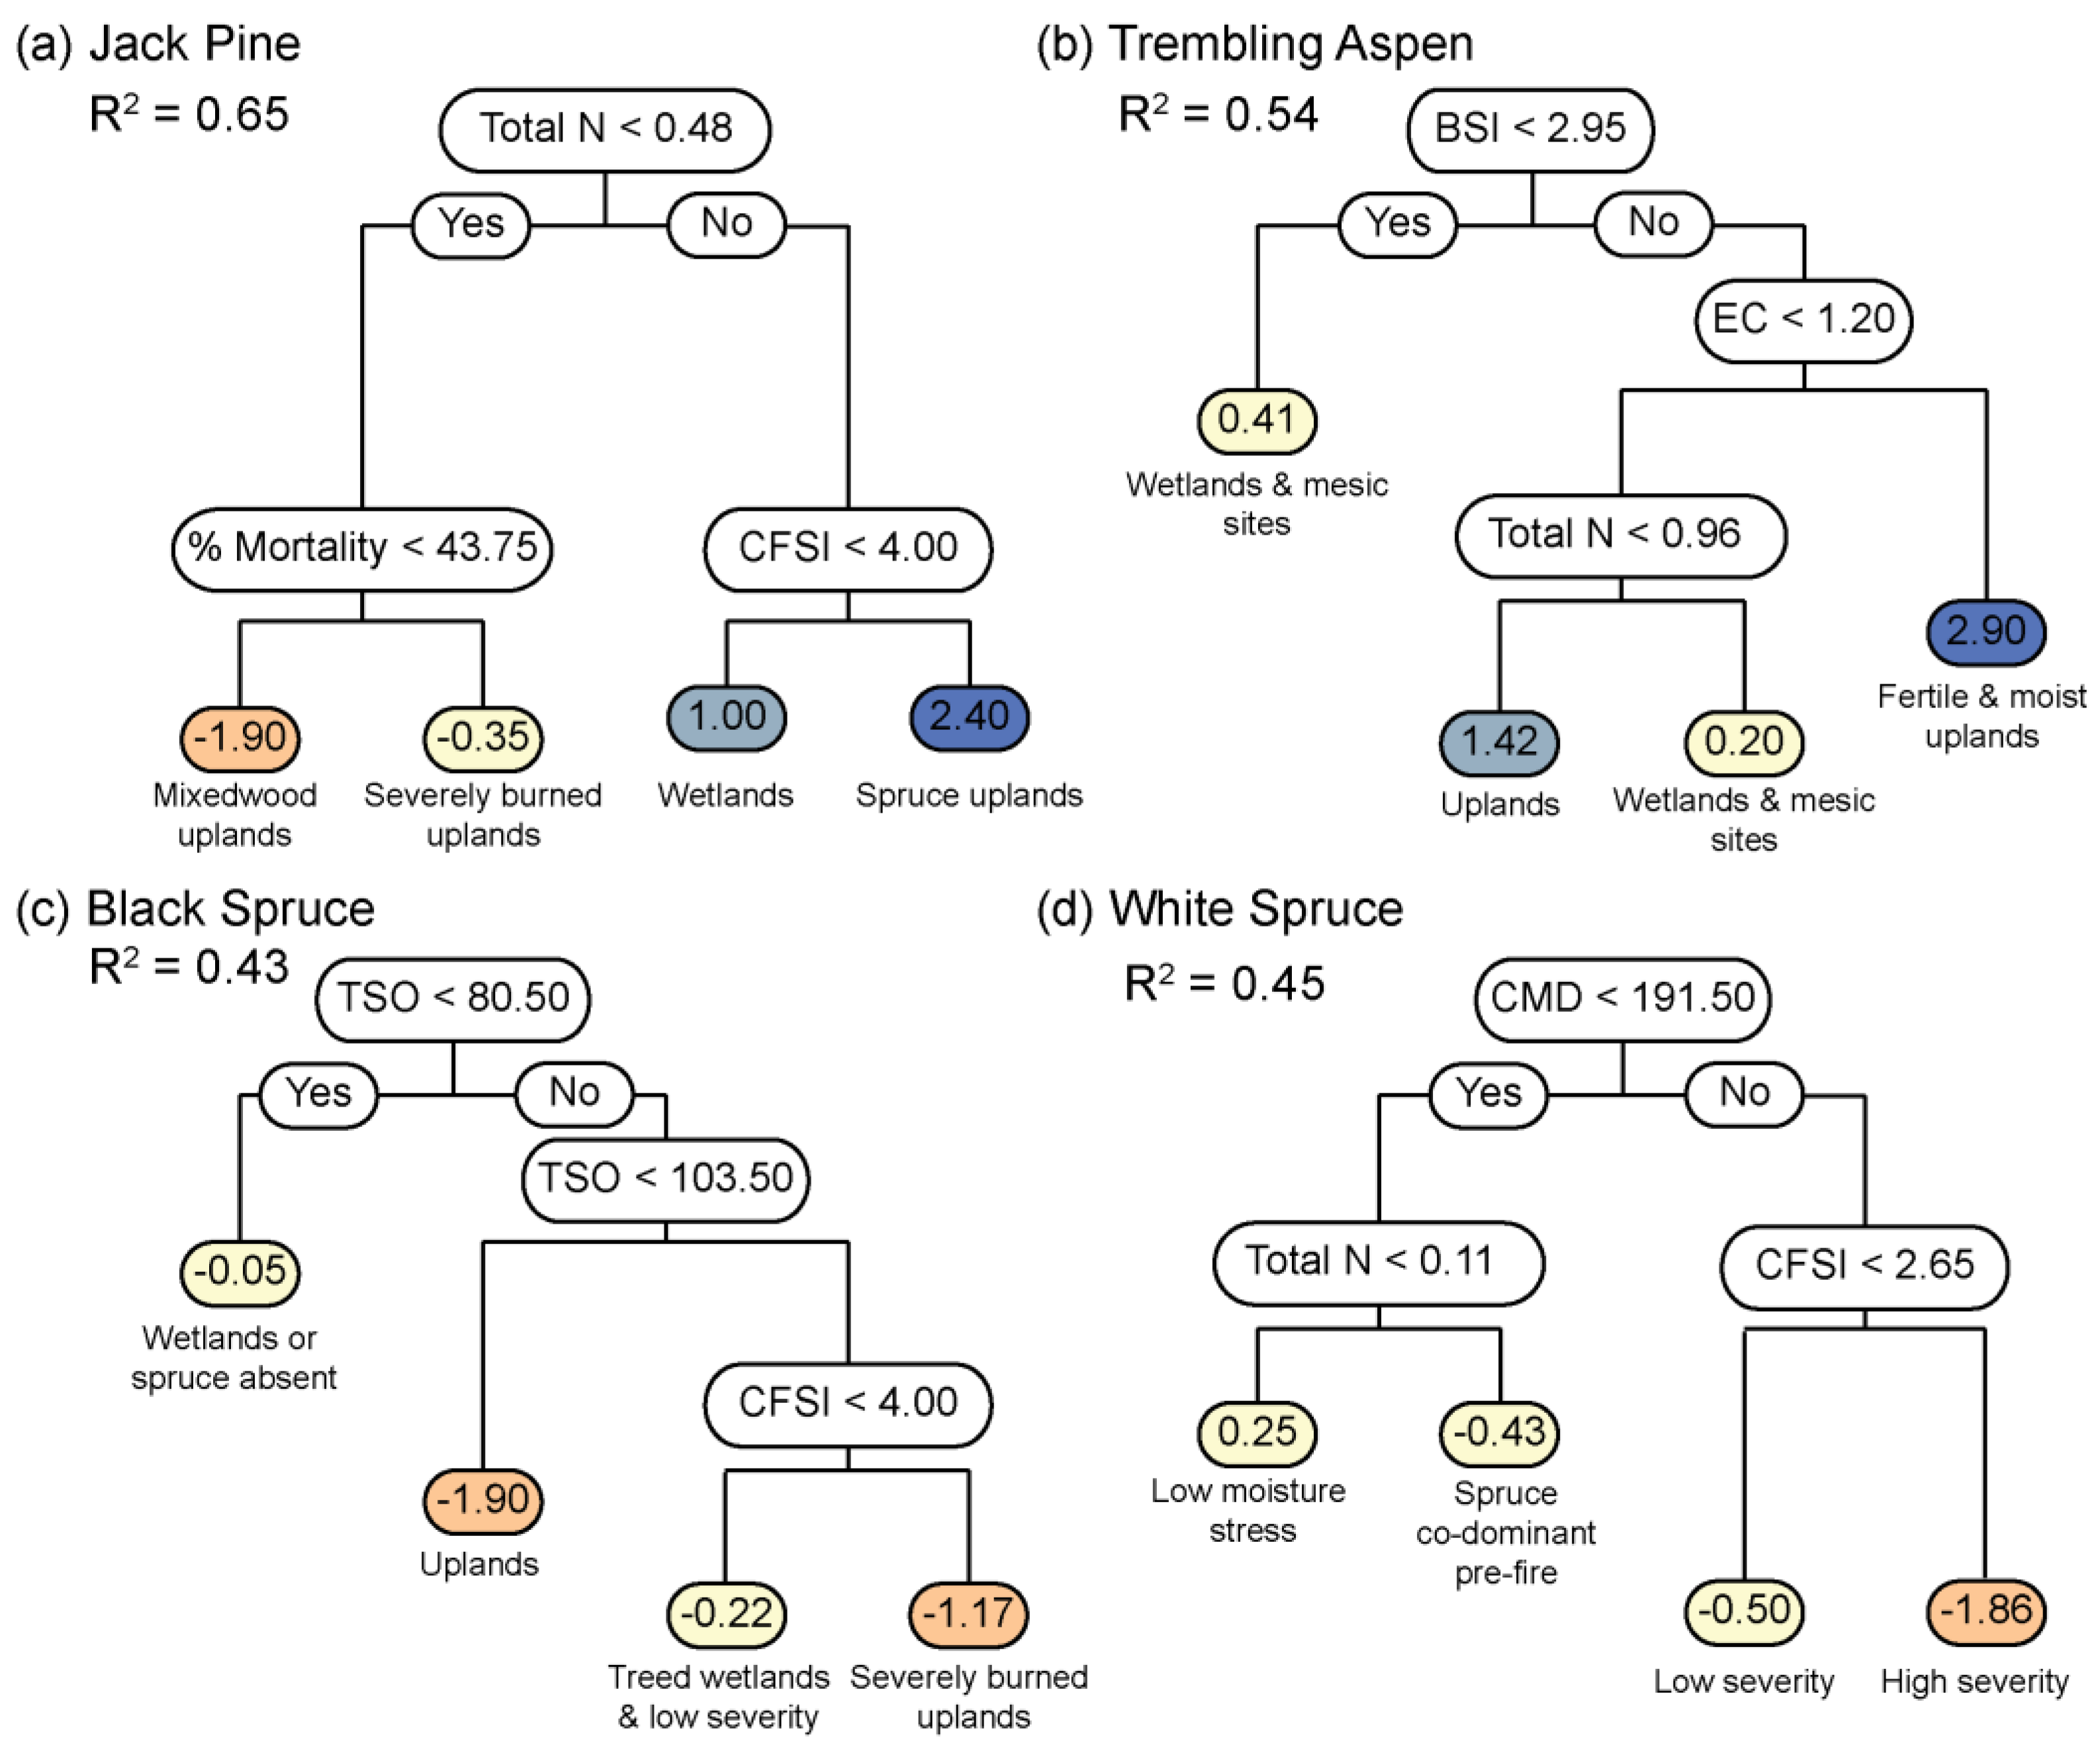
4.2. Post-Fire Shifts in Tree Species Dominance
4.3. Implications for Northwestern Boreal Forests
4.4. Limitations and Future Research
5. Conclusions
Acknowledgments
Author Contributions
Conflicts of Interest
Appendix A. Additional Analyses and Figures


| Soil Property | Multivariable Linear Mixed-Effects Model | Independent Variable | Degrees of Freedom | Sums of Squares | F | p |
|---|---|---|---|---|---|---|
| Organic Soil Depth (cm) | OSD = TVC + BSI + (TVC × BSI)|Fire Name | TVC | 4 | 91.50 | 10.10 | *** < 0.001 |
| BSI | 1 | 30.68 | 13.54 | *** < 0.001 | ||
| TVC × BSI | 4 | 8.80 | 0.97 | 0.43 | ||
| Total Nitrogen (%) | TN = TVC + BSI + (TVC × BSI)|Fire Name | TVC | 4 | 2.34 | 8.50 | *** < 0.001 |
| BSI | 1 | 0.81 | 11.77 | ** 0.001 | ||
| TVC × BSI | 4 | 0.26 | 0.96 | 0.44 | ||
| pH | pH = TVC + BSI + (TVC × BSI)|Fire Name | TVC | 4 | 0.21 | 0.06 | 0.99 |
| BSI | 1 | 002 | 0.02 | 0.88 | ||
| TVC × BSI | 4 | 0.85 | 0.25 | 0.91 | ||
| Electrical Conductivity | EC = TVC + BSI + (TVC × BSI)|Fire Name | TVC | 4 | 3.16 | 2.08 | 0.10 |
| BSI | 1 | 0.32 | 0.84 | 0.36 | ||
| TVC × BSI | 4 | 0.59 | 0.39 | 0.82 | ||
| Total Carbon (%) | TC = TVC + BSI + (TVC × BSI)|Fire Name | TVC | 4 | 1697.20 | 13.20 | *** < 0.001 |
| BSI | 1 | 382.75 | 11.90 | ** 0.001 | ||
| TVC × BSI | 4 | 91.91 | 0.71 | 0.59 | ||
| Sodium | Na = TVC + BSI + (TVC × BSI)|Fire Name | TVC | 4 | 121,344 | 6.20 | *** < 0.001 |
| BSI | 1 | 26,453 | 5.41 | * 0.02 | ||
| TVC × BSI | 4 | 41,222 | 2.11 | 0.09 | ||
| Potassium | K = TVC + BSI + (TVC × BSI)|Fire Name | TVC | 4 | 59,853 | 0.60 | 0.67 |
| BSI | 1 | 35,436 | 1.41 | 0.24 | ||
| TVC × BSI | 4 | 226,446 | 2.26 | 0.08 | ||
| Calcium † | Ca = TVC + BSI + (TVC × BSI)|Fire Name | TVC | 4 | 2,000,913,013 | 4.00 | ** 0.007 |
| BSI | 1 | 672,020,248 | 5.37 | * 0.02 | ||
| TVC × BSI | 4 | 656,747,510 | 1.31 | 0.28 | ||
| Magnesium | Mg = TVC + BSI + (TVC × BSI)|Fire Name | TVC | 4 | 23,579,801 | 5.54 | *** 0.001 |
| BSI | 1 | 5,452,454 | 5.13 | * 0.03 | ||
| TVC × BSI | 4 | 6,042,409 | 1.42 | 0.25 |
References
- Weber, M.G.; Stocks, B.J. Forest fires in the boreal forests of Canada. In Large Forest Fires; Moreno, J.M., Ed.; Backbuys Publishers: Leiden, The Netherlands, 1998; pp. 215–233. [Google Scholar]
- Heinselman, M.L. Fire and Succession in the Conifer Forests of Northern North America. In Forest Succession; West, D.C., Shugart, H.H., Botkin, D.B., Eds.; Springer: New York, NY, USA, 1981; pp. 374–405. [Google Scholar]
- Morgan, P.; Keane, R.E.; Dillon, G.K.; Jain, T.B.; Hudak, A.T.; Karau, E.C.; Sikkink, P.G.; Holden, Z.A.; Strand, E.K. Challenges of assessing fire and burn severity using field measures, remote sensing and modelling. Int. J. Wildland Fire 2014, 23, 1045–1060. [Google Scholar] [CrossRef]
- Keeley, J.E. Fire intensity, fire severity and burn severity: A brief review and suggested usage. Int. J. Wildland Fire 2009, 18, 116–126. [Google Scholar] [CrossRef]
- Whittle, C.A.; Duchesne, L.C.; Needham, T. The importance of buried seeds and vegetative propagation in the development of postfire plant communities. Environ. Rev. 1997, 5, 79–87. [Google Scholar] [CrossRef]
- Alexander, M.E.; Cruz, M.G. Modelling the impacts of surface and crown fire behaviour on serotinous cone opening in jack pine and lodgepole pine forests. Int. J. Wildland Fire 2012, 21, 709–721. [Google Scholar] [CrossRef]
- Knapp, A.K.; Anderson, J.E. Effect of Heat on Germination of Seeds from Serotinous Lodgepole Pine Cones. Am. Midl. Nat. 1980, 104, 370–372. [Google Scholar] [CrossRef]
- Greene, D.F.; Macdonald, S.E.; Cumming, S.; Swift, L. Seedbed variation from the interior through the edge of a large wildfire in Alberta. Can. J. For. Res. 2005, 35, 1640–1647. [Google Scholar] [CrossRef]
- Lee, P. The impact of burn intensity from wildfires on seed and vegetative banks, and emergent understory in aspen-dominated boreal forests. Can. J. Bot. 2004, 82, 1468–1480. [Google Scholar] [CrossRef]
- Schimmel, J.; Granstöm, A. Fire Severity and Vegetation Response in the Boreal Swedish Forest. Ecology 1996, 77, 1436–1450. [Google Scholar] [CrossRef]
- Turner, M.G.; Romme, W.H.; Gardner, R.H. Prefire heterogeneity, fire severity, and early postfire plant reestablishment in subalpine forests of Yellowstone National Park, Wyoming. Int. J. Wildland Fire 1999, 9, 21–36. [Google Scholar] [CrossRef]
- Lentile, L.B.; Morgan, P.; Hudak, A.T.; Bobbitt, M.J.; Lewis, S.A.; Smith, A.M.S.; Robichaud, P.R. Post-Fire Burn Severity and Vegetation Response Following Eight Large Wildfires Across the Western United States. Fire Ecol. 2007, 3, 91–108. [Google Scholar] [CrossRef]
- Chambers, M.E.; Fornwalt, P.J.; Malone, S.L.; Battaglia, M.A. Patterns of conifer regeneration following high severity wildfire in ponderosa pine–dominated forests of the Colorado Front Range. For. Ecol. Manag. 2016, 378, 57–67. [Google Scholar] [CrossRef]
- Shenoy, A.; Johnstone, J.F.; Kasischke, E.S.; Kielland, K. Persistent effects of fire severity on early successional forests in interior Alaska. For. Ecol. Manag. 2011, 261, 381–390. [Google Scholar] [CrossRef]
- Bartels, S.F.; Chen, H.Y.H.; Wulder, M.A.; White, J.C. Trends in post-disturbance recovery rates of Canada’s forests following wildfire and harvest. For. Ecol. Manag. 2016, 361, 194–207. [Google Scholar] [CrossRef]
- Jin, Y.; Randerson, J.T.; Goetz, S.J.; Beck, P.S.A.; Loranty, M.M.; Goulden, M.L. The influence of burn severity on postfire vegetation recovery and albedo change during early succession in North American boreal forests. J. Geophys. Res. Biogeosci. 2012, 117, 1–15. [Google Scholar] [CrossRef]
- Epting, J.; Verbyla, D. Landscape-level interactions of prefire vegetation, burn severity, and postfire vegetation over a 16-year period in interior Alaska. Can. J. For. Res. 2005, 35, 1367–1377. [Google Scholar] [CrossRef]
- Gibson, C.M.; Turetsky, M.R.; Cottenie, K.; Kane, E.S.; Houle, G.; Kasischke, E.S. Variation in plant community composition and vegetation carbon pools a decade following a severe fire season in interior Alaska. J. Veg. Sci. 2016, 27, 1187–1197. [Google Scholar] [CrossRef]
- Pinno, B.D.; Errington, R.C. Burn severity dominates understory plant community response to fire in xeric jack pine forests. Forests 2016, 7. [Google Scholar] [CrossRef]
- Wang, G.G.; Kemball, K.J. Effects of fire severity on early development of understory vegetation. Can. J. For. Res. 2005, 35, 254–262. [Google Scholar] [CrossRef]
- Arseneault, D. Impact of fire behavior on postfire forest development in a homogeneous boreal landscape. Can. J. For. Res. 2001, 31, 1367–1374. [Google Scholar] [CrossRef]
- Pinno, B.D.; Errington, R.C.; Thompson, D.K. Young jack pine and high severity fire combine to create potentially expansive areas of understocked forest. For. Ecol. Manag. 2013, 310, 517–522. [Google Scholar] [CrossRef]
- Johnstone, J.F.; Kasischke, E.S. Stand-level effects of soil burn severity on postfire regeneration in a recently burned black spruce forest. Can. J. For. Res. 2005, 35, 2151–2163. [Google Scholar] [CrossRef]
- Lavoie, L.; Sirois, L. Vegetation changes caused by recent fires in the northern boreal forest of eastern Canada. J. Veg. Sci. 1998, 9, 483–492. [Google Scholar] [CrossRef]
- Johnstone, J.F.; Chapin, F.S., III; Foote, J.; Kemmett, S.; Price, K.; Viereck, L. Decadal observations of tree regeneration following fire in boreal forests. Can. J. For. Res. 2004, 34, 267–273. [Google Scholar] [CrossRef]
- Collins, B.M.; Stephens, S.L. Stand-replacing patches within a “mixed severity” fire regime: Quantitative characterization using recent fires in a long-established natural fire area. Landsc. Ecol. 2010, 25, 927–939. [Google Scholar] [CrossRef]
- Lydersen, J.M.; Collins, B.M.; Brooks, M.L.; Matchett, J.R.; Shive, K.L.; Povak, N.A.; Kane, V.R.; Smith, D.F. Evidence of fuels management and fire weather influencing fire severity in an extreme fire event. Ecol. Appl. 2017, 27, 1–18. [Google Scholar] [CrossRef] [PubMed]
- Whitman, E.; Parisien, M.-A.; Thompson, D.K.; Hall, R.J.; Skakun, R.J.; Flannigan, M.D. Variability and drivers of burn severity in the northwestern Canadian boreal forest. Ecosphere 2018, 9, e02128. [Google Scholar] [CrossRef]
- Fourrier, A.; Bouchard, M.; Pothier, D. Effects of canopy composition and disturbance type on understorey plant assembly in boreal forests. J. Veg. Sci. 2015, 26, 1225–1237. [Google Scholar] [CrossRef]
- Turner, M.G.; Romme, W.H.; Gardner, R.H.; Hargrove, W.W. Effects of Fire Size and Pattern on Early Succession in Yellowstone National Park. Ecol. Monogr. 1997, 67, 411–433. [Google Scholar] [CrossRef]
- Day, N.J.; Carrière, S.; Baltzer, J.L. Annual dynamics and resilience in post-fire boreal understory vascular plant communities. For. Ecol. Manag. 2017, 401, 264–272. [Google Scholar] [CrossRef]
- Boiffin, J.; Aubin, I.; Munson, A.D. Ecological controls on post-fire vegetation assembly at multiple spatial scales in eastern North American boreal forests. J. Veg. Sci. 2015, 26, 360–372. [Google Scholar] [CrossRef]
- Erni, S.; Arseneault, D.; Parisien, M.-A.; Bégin, Y. Spatial and temporal dimensions of fire activity in the fire-prone eastern Canadian taiga. Glob. Chang. Biol. 2016, 1–15. [Google Scholar] [CrossRef] [PubMed]
- Turner, M.G.; Romme, W.H. Landscape dynamics in crown fire ecosystems. Landsc. Ecol. 1994, 9, 59–77. [Google Scholar] [CrossRef]
- Stocks, B.J.; Mason, J.A.; Todd, J.B.; Bosch, E.M.; Wotton, B.M.; Amiro, B.D.; Flannigan, M.D.; Hirsch, K.G.; Logan, K.A.; Martell, D.L.; et al. Large forest fires in Canada, 1959–1997. J. Geophys. Res. 2002, 108, FFR 5-1–FFR 5-12. [Google Scholar] [CrossRef]
- Johnstone, J.F.; Chapin, F.S., III. Fire interval effects on successional trajectory in boreal forests of northwest Canada. Ecosystems 2006, 9, 268–277. [Google Scholar] [CrossRef]
- Brown, C.D.; Johnstone, J.F. Once burned, twice shy: Repeat fires reduce seed availability and alter substrate constraints on Picea mariana regeneration. For. Ecol. Manag. 2012, 266, 34–41. [Google Scholar] [CrossRef]
- Johnstone, J.F.; Allen, C.D.; Franklin, J.F.; Frelich, L.E.; Harvey, B.J.; Higuera, P.E.; Mack, M.C.; Meentemeyer, R.K.; Metz, M.R.; Perry, G.L.W.; et al. Changing disturbance regimes, ecological memory, and forest resilience. Front. Ecol. Environ. 2016, in press. [Google Scholar] [CrossRef]
- Coop, J.D.; Parks, S.A.; McClernan, S.R.; Holsinger, L.M. Influences of Prior Wildfires on Vegetation Response to Subsequent Fire in a Reburned Southwestern Landscape. Ecol. Appl. 2016, 26, 346–354. [Google Scholar] [CrossRef] [PubMed]
- Wotton, B.M.; Flannigan, M.D.; Marshall, G.A. Potential climate change impacts on fire intensity and key wildfire suppression thresholds in Canada. Environ. Res. Lett. 2017, 12, 95003. [Google Scholar] [CrossRef]
- Wotton, B.M.; Nock, C.A.; Flannigan, M.D. Forest fire occurrence and climate change in Canada. Int. J. Wildland Fire 2010, 19, 253–271. [Google Scholar] [CrossRef]
- Wang, X.; Parisien, M.-A.; Taylor, S.W.; Candau, J.N.; Stralberg, D.; Marshall, G.A.; Little, J.M.; Flannigan, M.D. Projected changes in daily fire spread across Canada over the next century. Environ. Res. Lett. 2017, 12. [Google Scholar] [CrossRef]
- Wang, X.; Thompson, D.K.; Marshall, G.A.; Tymstra, C.; Carr, R.; Flannigan, M.D. Increasing frequency of extreme fire weather in Canada with climate change. Clim. Chang. 2015, 130, 573–586. [Google Scholar] [CrossRef]
- Northwest Territories Environment and Natural Resources. 2014 NWT Fire Season: Review Report; Government of the Northwest Territories: Yellowknife, NT, Canada, 2015.
- Boulanger, Y.; Gauthier, S.; Burton, P.J.; Vaillancourt, M.A. An alternative fire regime zonation for Canada. Int. J. Wildland Fire 2012, 21, 1052–1064. [Google Scholar] [CrossRef]
- Johnson, E.A. Fire and Vegetation Dynamics: Studies from the North American Boreal Forest; Cambridge University Press: Cambridge, UK, 1992; ISBN 0521341515. [Google Scholar]
- Brandt, J.P. The extent of the North American boreal zone. Environ. Rev. 2009, 17, 101–161. [Google Scholar] [CrossRef]
- Ecological Stratification Working Group (ESWG). A National Ecological Framework for Canada; Agriculture and Agri-Food Canada and Environment Canada: Ottawa, ON, Canada, 1995; ISBN 066224107X. [Google Scholar]
- Wang, T.; Hamann, A.; Spittlehouse, D.L.; Murdock, T.Q. ClimateWNA—High-resolution spatial climate data for western North America. J. Appl. Meteorol. Climatol. 2012, 51, 16–29. [Google Scholar] [CrossRef]
- Tarnocai, C.; Kettles, I.M.; Lacelle, B. Peatlands of Canada; Open File 6561; Geological Survey of Canada, Natural Resources Canada: Ottawa, ON, Canada, 2011. [Google Scholar]
- Natural Resources Canada Canada-Permafrost. National Atlas of Canada; Geological Survey of Canada, Natural Resources Canada: Ottawa, ON, Canada, 1993. [Google Scholar]
- Key, C.H.; Benson, N.C. Landscape Assessment (LA): Sampling and Analysis Methods; Tech. Rep. RMRS-GTR-164-CD; SDA Forest Service: Fort Collins, CO, USA, 2006; pp. LA-1–LA-51. [Google Scholar]
- Hall, R.J.; Freeburn, J.T.; De Groot, W.J.; Pritchard, J.M.; Lynham, T.J.; Landry, R. Remote sensing of burn severity: Experience from western Canada boreal fires. Int. J. Wildland Fire 2008, 17, 476–489. [Google Scholar] [CrossRef]
- Beckingham, J.D.; Archibald, J.H. Field Guide to Ecosites of Northern Alberta; Natural Resources Canada, Canadian Forest Service, Northern Forestry Centre: Edmonton, AB, Canada, 1996. [Google Scholar]
- Mitchell, K. Quantitative Analysis by the Point-Centered Quarter Method; Department of Mathematics and Computer Science, Hobart and William Smith Colleges: Geneva, NY, USA, 2015; pp. 1–56. [Google Scholar]
- Cottam, G.; Curtis, J.T.; Hale, B.W. Some sampling characteristics of a population of randomly dispersed individuals. Ecology 1953, 34, 741–757. [Google Scholar] [CrossRef]
- Cybis Elektronik & Data AB. CooRecorder v.9.1. 2013. Available online: http://www.cybis.se/forfun/dendro/index.htm (accessed on 10 February 2018).
- Loboda, T.V.; French, N.H.F.; Hight-Harf, C.; Jenkins, L.; Miller, M.E. Mapping fire extent and burn severity in Alaskan tussock tundra: An analysis of the spectral response of tundra vegetation to wildland fire. Remote Sens. Environ. 2013, 134, 194–209. [Google Scholar] [CrossRef]
- Dyrness, C.T.; Norum, R.A. The effects of experimental fires on black spruce forest floors in interior Alaska. Can. J. For. Res. 1983, 17, 1207–1212. [Google Scholar] [CrossRef]
- Kasischke, E.S.; O’Neill, K.P.; French, N.H.F.; Bourgeau-Chavez, L.L. Controls on Patterns of Biomass Burning in Alaskan Boreal Forests. In Fire, Climate Change, and Carbon Cycling in the Boreal Forest; Kasischke, E.S., Stocks, B.J., Eds.; Springer: New York, NY, USA, 2000; pp. 173–196. [Google Scholar]
- Moss, E.H. Flora of Alberta, 2nd ed.; Packer, J.G., Ed.; University of Toronto Press Inc.: Buffalo, NY, USA, 1994; ISBN 0-8020-2508-0. [Google Scholar]
- Cody, W.J. Flora of the Yukon Territory, 2nd ed.; NRC Research Press: Ottawa, ON, Canada, 2000; ISBN 978-0-660-18110-3. [Google Scholar]
- Daly, C.; Gibson, W.P.; Taylor, G.H.; Johnson, G.L.; Pasteris, P. A knowledge-based approach to the statistical mapping of climate. Clim. Res. 2002, 22, 99–113. [Google Scholar] [CrossRef]
- Natural Resources Canada. Canadian Digital Elevation Model; Natural Resources Canada: Ottawa, ON, Canada, 2016; Available online: https://open.canada.ca/data/en/dataset/7f245e4d-76c2-4caa-951a-45d1d2051333/ (accessed on 03 September 2017).
- R Core Team R: A Language and Environment for Statistical Computing. v 3.4.3. 2017. Available online: https://www.R-project.org/ (accessed on 20 December 2017).
- Bates, D.; Mächler, M.; Bolker, B.; Walker, S. Fitting Linear Mixed-Effects Models Using lme4. J. Stat. Softw. 2015, 67, 1–48. [Google Scholar] [CrossRef]
- Kuznetsova, A.; Brockhoff, P.B.; Christensen, R.H.B. lmerTest Package: Tests in Linear Mixed Effects Models. J. Stat. Softw. 2017, 82, 1–26. [Google Scholar] [CrossRef]
- Luke, S.G. Evaluating significance in linear mixed-effects models in R. Behav. Res. Methods 2017, 49, 1494–1502. [Google Scholar] [CrossRef] [PubMed]
- Lenth, R.V. Least-Squares Means: The R Package lsmeans. J. Stat. Softw. 2016, 69, 1–33. [Google Scholar] [CrossRef]
- Oksanen, J.; Blanchet, G.; Friendly, M.; Kindt, R.; Legendre, P.; McGlinn, D.; Minchin, P.R.; O’Hara, R.B.; Simpson, G.L.; Solymos, P.; et al. Vegan: Community Ecology Package R Package v.2.4-4. 2017. Available online: https://CRAN-R-project.org/package=vegan (accessed on 20 December 2017).
- De Caceres, M.; Legendre, P. Associations between species and groups of sites: Indices and statistical inference. Ecology 2009, 90, 3566–3574. [Google Scholar] [CrossRef] [PubMed]
- Van den Boogaart, K.G.; Tolosana, R.; Bren, M. compositions R package v.1.40-1. 2014. Available online: https://CRAN.R-project.org/package=compositions (accessed on 2 February 2018).
- Ripley, B. Tree: Classification and Regression Trees R Package v.1.0-37. 2016. Available online: https://CRAN.R-project.org/package=tree (accessed on 30 January 2018).
- Andrews, J.T. Present and postglacial rates of uplift for glaciated northern and eastern North America derived from postglacial uplift curves. Can. J. Earth Sci. 1970, 7, 703–715. [Google Scholar] [CrossRef]
- Portenga, E.W.; Bierman, P.R. Understanding earth’s eroding surface with 10Be. GSA Today 2011, 21, 4–10. [Google Scholar] [CrossRef]
- Loarie, S.R.; Duffy, P.B.; Hamilton, H.; Asner, G.P.; Field, C.B.; Ackerly, D.D. The velocity of climate change. Nature 2009, 462, 1052–1055. [Google Scholar] [CrossRef] [PubMed]
- Waddington, J.M.; Morris, P.J.; Kettridge, N.; Granath, G.; Thompson, D.K.; Moore, P.A. Hydrological feedbacks in northern peatlands. Ecohydrology 2015, 8, 113–127. [Google Scholar] [CrossRef]
- Schneider, R.R.; Devito, K.; Kettridge, N.; Bayne, E. Moving beyond bioclimatic envelope models: Integrating upland forest and peatland processes to predict ecosystem transitions under climate change in the western Canadian boreal plain. Ecohydrology 2016, 9, 899–908. [Google Scholar] [CrossRef]
- Messier, C.; Parent, S.; Bergeron, Y. Effects of Overstory and Understory Vegetation on the Understory Light Environment in Mixed Boreal Forests. J. Veg. Sci. 1998, 9, 511–520. [Google Scholar] [CrossRef]
- Nilsson, M.; Wardle, D. Understory vegetation as a forest ecosystem driver: Evidence from the northern Swedish boreal forest. Front. Ecol. Environ. 2005, 3, 421–428. [Google Scholar] [CrossRef]
- Tsuyuzaki, S.; Narita, K.; Sawada, Y.; Kushida, K. The establishment patterns of tree seedlings are determined immediately after wildfire in a black spruce (Picea mariana) forest. Plant Ecol. 2014, 215, 327–337. [Google Scholar] [CrossRef]
- Grosse, G.; Harden, J.; Turetsky, M.; McGuire, A.D.; Camill, P.; Tarnocai, C.; Frolking, S.; Schuur, E.A.G.; Jorgenson, T.; Marchenko, S.; et al. Vulnerability of high-latitude soil organic carbon in North America to disturbance. J. Geophys. Res. Biogeosci. 2011, 116, 1–23. [Google Scholar] [CrossRef]
- Neff, J.C.; Harden, J.W.; Gleixner, G. Fire effects on soil organic matter content, composition, and nutrients in boreal interior Alaska. Can. J. For. Res. 2005, 35, 2178–2187. [Google Scholar] [CrossRef]
- Devito, K.; Creed, I.; Gan, T.; Mendoza, C.; Petrone, R.; Silins, U.; Smerdon, B. A framework for broad-scale classification of hydrologic response units on the Boreal Plain: Is topography the last thing to consider? Hydrol. Process. 2005, 19, 1705–1714. [Google Scholar] [CrossRef]
- Walker, X.; Baltzer, J.; Cumming, S.; Day, N.; Johnstone, J.; Rogers, B.; Solvik, K.; Turetsky, M.; Mack, M. Soil organic layer combustion in black spruce and jack pine stands of the Northwest Territories, Canada. Int. J. Wildland Fire 2018, 27, 125–134. [Google Scholar] [CrossRef]
- Peters, V.S.; Macdonald, S.E.; Dale, M.R.T. The Interaction Between Masting and Fire is Key to White Spruce Regeneration. Ecology 2005, 86, 1744–1750. [Google Scholar] [CrossRef]
- Peters, V.S.; Macdonald, S.E.; Dale, M.R.T. Patterns of initial versus delayed regeneration of white spruce in boreal mixedwood succession. Can. J. For. Res. 2006, 36, 1597–1609. [Google Scholar] [CrossRef]
- Searle, E.B.; Chen, H.Y.H. Persistent and pervasive compositional shifts of western boreal forest plots in Canada. Glob. Chang. Biol. 2017, 23, 857–866. [Google Scholar] [CrossRef] [PubMed]
- Greene, D.F.; Zasada, J.C.; Sirois, L.; Kneeshaw, D.; Morin, H.; Charron, I.; Simard, M.J. A review of the regeneration dynamics of North American boreal forest tree species. Can. J. Bot. 1999, 29, 824–839. [Google Scholar] [CrossRef]
- Bergeron, Y.; Chen, H.Y.H.; Kenkel, N.C.; Leduc, A.L.; Macdonald, S.E. Boreal mixedwood stand dynamics: Ecological processes underlying multiple pathways. For. Chron. 2014, 90, 202–213. [Google Scholar] [CrossRef]
- Ilisson, T.; Chen, H.Y.H. The direct regeneration hypothesis in northern forests. J. Veg. Sci. 2009, 20, 735–744. [Google Scholar] [CrossRef]
- Walker, X.J.; Mack, M.C.; Johnstone, J.F. Predicting Ecosystem Resilience to Fire from Tree Ring Analysis in Black Spruce Forests. Ecosystems 2017, 20, 1137–1150. [Google Scholar] [CrossRef]
- Johnstone, J.F.; Hollingsworth, T.N.; Chapin, F.S., III; Mack, M.C. Changes in fire regime break the legacy lock on successional trajectories in Alaskan boreal forest. Glob. Chang. Biol. 2010, 16, 1281–1295. [Google Scholar] [CrossRef]
- White, J.C.; Wulder, M.A.; Hermosilla, T.; Coops, N.C.; Hobart, G.W. A nationwide annual characterization of 25 years of forest disturbance and recovery for Canada using Landsat time series. Remote Sens. Environ. 2017, 194, 303–321. [Google Scholar] [CrossRef]
- Hogg, E.H.; Wein, R.W. Impacts of drought on forest growth and regeneration following fire in southwestern Yukon, Canada. Can. J. For. Res. 2005, 35, 2141–2150. [Google Scholar] [CrossRef]
- Barber, V.A.; Juday, G.P.; Finney, B.P. Reduced growth of Alaskan white spruce in the 20th century from temperature-induced drought stress. Nature 2000, 405, 668–673. [Google Scholar] [CrossRef] [PubMed]
- Michaelian, M.; Hogg, E.H.; Hall, R.J.; Arsenault, E. Massive mortality of aspen following severe drought along the southern edge of the Canadian boreal forest. Glob. Chang. Biol. 2011, 17, 2084–2094. [Google Scholar] [CrossRef]
- Stralberg, D.; Wang, X.; Parisien, M.-A.; Robinne, F.-N.; Sólymos, P.; Mahon, L.C.; Nielsen, S.E.; Bayne, E.M. Wildfire-mediated vegetation change in boreal forests of Alberta, Canada. Ecosphere 2018, in press. [Google Scholar]
- Forestry Canada Fire Danger Group. Development of the Canadian Forest Fire Behavior Prediction System; Information Report ST-X-3; Forestry Canada: Ottawa, ON, Canada, 1992; pp. 1–63. Available online: https://cfs.nrcan.gc.ca/publications?id=10068/ (accessed on 01 September 2018).
- Cumming, S.G. Forest type and wildfire in the Alberta Boreal Mixedwood: What do fires burn? Ecol. Appl. 2001, 11, 97–110. [Google Scholar] [CrossRef]
- Euskirchen, E.S.; Bennett, A.P.; Breen, A.L.; Genet, H.; Lindgren, M.A.; Kurkowski, T.A.; McGuire, A.D.; Rupp, T.S. Consequences of changes in vegetation and snow cover for climate feedbacks in Alaska and northwest Canada. Environ. Res. Lett. 2016, 11. [Google Scholar] [CrossRef]
- Terrier, A.; Girardin, M.P.; Périé, C.; Legendre, P.; Bergeron, Y. Potential changes in forest composition could reduce impacts of climate change on boreal wildfires. Ecol. Appl. 2013, 23, 21–35. [Google Scholar] [CrossRef] [PubMed]
- Dai, A. Increasing drought under global warming in observations and models. Nat. Clim. Chang. 2013, 3, 52–58. [Google Scholar] [CrossRef]
- Hogg, E.H.; Bernier, P.Y. Climate change impacts on drought-prone forests in western Canada. For. Chron. 2005, 81, 675–682. [Google Scholar] [CrossRef]
- Way, D.A.; Crawley, C.; Sage, R.F. A hot and dry future: Warming effects on boreal tree drought tolerance. Tree Physiol. 2013, 33, 1003–1005. [Google Scholar] [CrossRef] [PubMed]
- Darlington, A.B.; Halinska, A.; Dat, J.F.; Blake, T.J. Effects of increasing saturation vapour pressure deficit on growth and ABA levels in black spruce and jack pine. Trees 1997, 11, 223–228. [Google Scholar] [CrossRef]
- Parks, S.A.; Parisien, M.-A.; Miller, C.; Holsinger, L.M.; Baggett, L.S. Fine-scale spatial climate variation and drought mediate the likelihood of reburning. Ecol. Appl. 2017, 28, 573–586. [Google Scholar] [CrossRef] [PubMed]
- Greene, D.F.; Noël, J.; Bergeron, Y.; Rousseau, M.; Gauthier, S. Recruitment of Picea mariana, Pinus banksiana, and Populus tremuloides across a burn severity gradient following wildfire in the southern boreal forest of Quebec. Can. J. For. Res. 2004, 34, 1845–1857. [Google Scholar] [CrossRef]
- Greene, D.F.; Macdonald, S.E.; Haeussler, S.; Domenicano, S.; Noël, J.; Jayen, K.; Charron, I.; Gauthier, S.; Hunt, S.; Gielau, E.T.; et al. The reduction of organic-layer depth by wildfire in the North American boreal forest and its effect on tree recruitment by seed. Can. J. For. Res. 2007, 37, 1012–1023. [Google Scholar] [CrossRef]
- Barrett, K.; McGuire, A.D.; Hoy, E.E.; Kasischke, E.S. Potential shifts in dominant forest cover in interior Alaska driven by variations in fire severity. Ecol. Appl. 2011, 21, 2380–2396. [Google Scholar] [CrossRef] [PubMed]
- Kemball, K.J.; Wang, G.G.; Westwood, A.R. Are mineral soils exposed by severe wildfire better seedbeds for conifer regeneration? Can. J. For. Res. 2006, 36, 1943–1950. [Google Scholar] [CrossRef]
- Barrett, K.; Kasischke, E.S.; McGuire, A.D.; Turetsky, M.R.; Kane, E.S. Modeling fire severity in black spruce stands in the Alaskan boreal forest using spectral and non-spectral geospatial data. Remote Sens. Environ. 2010, 114, 1494–1503. [Google Scholar] [CrossRef]


| Environmental Variable | Abbreviation | Units | Mean | Range |
|---|---|---|---|---|
| Basal Area | BA | m2 ha−1 | 10.8 | 0.00–53.39 |
| Burn Severity Index | BSI | - | 2.39 | 0.54–4.00 |
| Electrical conductivity of soil | EC | mS cm−1 | 0.73 | 0.05–3.53 |
| Organic soil depth | OSD | cm | 4.7 | 0–10 |
| Percentage sand in mineral soil | % Sand | % | 43.9 | 0–95 |
| pH | pH | - | 6.29 | 3.21–8.12 |
| Potassium | K | mg kg−1 | 411.1 | 74.1–1148.4 |
| Site moisture | Moisture | - | - | Xeric–Hydric |
| Sodium | Na | mg kg−1 | 137.8 | 38.52–494.48 |
| Time since last fire | TSLF | year−1 | 58 | 9–151 |
| Total carbon | Total C | % mass | 21.9 | 0.61–52.8 |
| Total nitrogen | Total N | % mass | 0.81 | 0.18–2.66 |
| Total stem density of overstory and understory trees | Density | stems ha−1 | 5822 | 0–29,012 |
| Environmental Variable | Units | Mean | Range | Variance Partitioning Category |
|---|---|---|---|---|
| Calcium † | mg kg−1 | 13,648.6 | 217.1–60,815.4 | Soils |
| Electrical conductivity † | mS cm−1 | 0.73 | 0.05–3.53 | Soils |
| Magnesium † | mg kg−1 | 1461.9 | 22.0–5191.3 | Soils |
| Percentage sand in mineral soil | % mass | 44 | 0–95 | Soils |
| Percentage silt in mineral soil | % mass | 14 | 0–51 | Soils |
| pH | - | 6.29 | 3.21–8.12 | Soils |
| Potassium † | mg kg−1 | 411.1 | 74.1–1148.4 | Soils |
| Sodium † | mg kg−1 | 137.8 | 38.5–494.5 | Soils |
| Total carbon † | % mass | 21.9 | 0.61–52.8 | Soils |
| Total nitrogen † | % mass | 0.81 | 0.02–2.66 | Soils |
| Absolute stem density of overstory and understory trees | stems ha−1 | 5822 | 0–29,012 | Site |
| Annual Heat-Moisture Index | - | 20.32 | 16.5–23.6 | Site |
| Black spruce basal area | m2 ha−1 | 2.37 | 0–29.07 | Site |
| Climatic Moisture Deficit | mm | 191 | 171–214 | Site |
| Jack pine basal area | m2 ha−1 | 5.61 | 0–51.38 | Site |
| Site moisture | - | - | Xeric–Hydric | Site |
| Trembling aspen basal area | m2 ha−1 | 0.87 | 0–6.22 | Site |
| Total overstory basal area | m2 ha−1 | 10.8 | 0–53.4 | Site |
| White spruce basal area | m2 ha−1 | 1.55 | 0–36.53 | Site |
| Burn Severity Index | - | 2.38 | 0.54–4 | Fire |
| Percentage overstory mortality | % | 89 | 6–100 | Fire |
| Post-fire organic soil depth | cm | 4.7 | 0–10 | Fire |
| Time since last fire | year−1 | 58 | 9–151 | Fire |
| Time since stand origin | year−1 | 104 | 9–237 | Fire |
| Variable | Units | Mean | Range |
|---|---|---|---|
| Annual Heat-Moisture Index | - | 20.3 | 16.5–23.6 |
| Burn Severity Index | - | 2.38 | 0.54–4 |
| Canopy Fire Severity Index | - | 2.5 | 0–6 |
| Climatic Moisture Deficit | mm | 191 | 171–214 |
| Electrical conductivity | mS cm−1 | 0.73 | 0.05–3.53 |
| Percentage overstory mortality | % | 89 | 6–100 |
| Percentage sand in mineral soil | % | 44 | 0–95 |
| pH | - | 6.29 | 3.21–8.12 |
| Post-fire organic soil depth | cm | 4.7 | 0–10 |
| Total nitrogen | % | 0.81 | 0.02–2.66 |
| Time since last fire | year−1 | 58 | 9–151 |
| Time since stand origin | year−1 | 104 | 9–237 |
| Wetland | - | - | Upland or Wetland |
| Multivariable Linear Mixed-Effects Model | ANOVA Sums of Squares | Degrees of Freedom | Independent Variable | Sums of Squares | F | p |
|---|---|---|---|---|---|---|
| BSI = TVC + (1|Fire Name) | II | 4 | TVC | 20.39 | 14.94 | *** < 0.001 |
| CFSI = TVC + (1|Fire Name) | II | 4 | TVC | 33.40 | 3.36 | * 0.02 |
| Diversity = TVC × BSI + (1|Fire Name) | III | 4 | TVC | 2.51 | 3.09 | * 0.03 |
| 1 | BSI | 0.15 | 0.72 | 0.40 | ||
| 4 | TVC × BSI | 2.64 | 3.26 | * 0.02 | ||
| Diversity = TVC × TSLF + (1|Fire Name) | III | 4 | TVC | 2.08 | 2.52 | 0.06 |
| 1 | TSLF | 0.00 | 0.01 | 0.91 | ||
| 4 | TVC × TSLF | 2.89 | 3.51 | * 0.02 | ||
| Density = TVC + BSI + (1|Fire Name) | II | 4 | TVC | 18.01 | 3.49 | * 0.02 |
| 1 | BSI | 5.62 | 4.35 | * 0.04 | ||
| Density = TVC + TSLF + (1|Fire Name) | II | 4 | TVC | 43.94 | 7.84 | *** < 0.001 |
| 1 | TSLF | 0.59 | 1.14 | 0.29 |
| Vegetation Group | ||||
|---|---|---|---|---|
| Open Wetland | Treed Wetland | Upland Mixedwood | Upland Jack Pine | Upland Spruce |
| Potentilla palustris (L.) Scop. † | Rubus chamaemorus L. † | Viburnum edule (Michx.) Raf. † | Cornus canadensis L. | Vaccinium uliginosum L. † |
| Betula glandulosa Michx. † | Vaccinium caespitosum Michx. † | Cornus canadensis L. | Geranium bicknellii Britt. | Geocaulon lividum (Richards.) Fern. † |
| Epilobium palustre L. † | Vaccinium oxycoccos L. † | Geranium bicknellii Britt. | Rosa acicularis Lindl. | Ledum groenlandicum Oeder |
| Myrica gale L. † | Rubus arcticus L. | Rosa acicularis Lindl. | Linnaea borealis L. | Equisetum scirpoides Michx. |
| Rubus arcticus L. | Ledum groenlandicum Oeder | Linnaea borealis L. | Elymus innovatus Beal | Arctostaphylos rubra (Rehder & Wils.) |
| Carex L. spp. | Equisetum scirpoides Michx. | Elymus innovatus Beal | Rosa acicularis Lindl. | |
| Salix L. spp | Arctostaphylos rubra (Rehder & Wils.) Fern. | Linnaea borealis L. | ||
| Carex L. spp. | Elymus innovatus Beal | |||
| Salix L. spp. | Carex L. spp. | |||
| Salix L. spp. | ||||
© 2018 by the authors. Licensee MDPI, Basel, Switzerland. This article is an open access article distributed under the terms and conditions of the Creative Commons Attribution (CC BY) license (http://creativecommons.org/licenses/by/4.0/).
Share and Cite
Whitman, E.; Parisien, M.-A.; Thompson, D.K.; Flannigan, M.D. Topoedaphic and Forest Controls on Post-Fire Vegetation Assemblies Are Modified by Fire History and Burn Severity in the Northwestern Canadian Boreal Forest. Forests 2018, 9, 151. https://doi.org/10.3390/f9030151
Whitman E, Parisien M-A, Thompson DK, Flannigan MD. Topoedaphic and Forest Controls on Post-Fire Vegetation Assemblies Are Modified by Fire History and Burn Severity in the Northwestern Canadian Boreal Forest. Forests. 2018; 9(3):151. https://doi.org/10.3390/f9030151
Chicago/Turabian StyleWhitman, Ellen, Marc-André Parisien, Dan K. Thompson, and Mike D. Flannigan. 2018. "Topoedaphic and Forest Controls on Post-Fire Vegetation Assemblies Are Modified by Fire History and Burn Severity in the Northwestern Canadian Boreal Forest" Forests 9, no. 3: 151. https://doi.org/10.3390/f9030151
APA StyleWhitman, E., Parisien, M.-A., Thompson, D. K., & Flannigan, M. D. (2018). Topoedaphic and Forest Controls on Post-Fire Vegetation Assemblies Are Modified by Fire History and Burn Severity in the Northwestern Canadian Boreal Forest. Forests, 9(3), 151. https://doi.org/10.3390/f9030151