Article

Automatic Segmentation of Mauritia flexuosa in Unmanned Aerial Vehicle (UAV) Imagery Using Deep Learning

National Institute of Research and Training in Telecommunications (INICTEL-UNI), National University of Engineering, Lima 15021, Peru
*
Author to whom correspondence should be addressed.
Forests 2018, 9(12), 736; https://doi.org/10.3390/f9120736
Submission received: 30 October 2018 / Revised: 22 November 2018 / Accepted: 23 November 2018 / Published: 26 November 2018
(This article belongs to the Special Issue Forestry Applications of Unmanned Aerial Vehicles (UAVs) 2019)

Abstract

:
One of the most important ecosystems in the Amazon rainforest is the Mauritia flexuosa swamp or “aguajal”. However, deforestation of its dominant species, the Mauritia flexuosa palm, also known as “aguaje”, is a common issue, and conservation is poorly monitored because of the difficult access to these swamps. The contribution of this paper is twofold: the presentation of a dataset called MauFlex, and the proposal of a segmentation and measurement method for areas covered in Mauritia flexuosa palms using high-resolution aerial images acquired by UAVs. The method performs a semantic segmentation of Mauritia flexuosa using an end-to-end trainable Convolutional Neural Network (CNN) based on the Deeplab v3+ architecture. Images were acquired under different environment and light conditions using three different RGB cameras. The MauFlex dataset was created from these images and it consists of 25,248 image patches of 512 × 512 pixels and their respective ground truth masks. The results over the test set achieved an accuracy of 98.143%, specificity of 96.599%, and sensitivity of 95.556%. It is shown that our method is able not only to detect full-grown isolated Mauritia flexuosa palms, but also young palms or palms partially covered by other types of vegetation.

1. Introduction

The Mauritia flexuosa L. palm is the main species of one of the most remarkable ecosystems of the Amazon rainforest: the Mauritia flexuosa swamp, also known as “aguajal” [1,2,3]. Its importance is not only ecological but also social and economic. It is the ecosystem with the greatest carbon dioxide absorption capacity in the Amazon [4,5] and it is habitat of a wide range of fauna [1]. In addition, due to high demand of Mauritia flexuosa fruit and derivatives, this species is a key economic engine for the indigenous populations and contributes to their economic and social development [3,6]. Unfortunately, in spite of the stringent government efforts to control deforestation, cutting down M. Flexuosa palm trees to harvest their fruits is a common activity [1]. For trees that are harvested, the proportion that is cut versus climbed is unknown, which is why carrying out multidisciplinary studies regarding species population assessment and extraction locations would help to target conservation and management efforts in communities that are hot-spots for extraction [7,8].
Recently, there has been a drastic increase in the use of Unmanned Aerial Vehicles (UAVs) for forest applications due to their low cost, automation capabilities, and the fact that they can support different types of payloads, e.g., RGB or multispectral cameras, LiDAR (Light detection and Ranging), radar, etc. For instance, UAV photogrammetric data is used to rapidly detect tree stumps or coniferous seedlings in replanted forest harvest areas using basic image processing and machine learning techniques [9,10]. Similarly, UAVs have been used to tackle the problem of tree detection from many perspectives. For example, LiDAR-based methods model the 3D-shape of trees for detection with accuracy values ranging from 86% to 98% [11,12]; however, the high cost of LiDAR for UAVs represents an important limitation. The same limitation occurs with hyperspectral-based methods, such as [13], which uses a hyperspectral frame format camera and an RGB camera along with 3D modelling and Multilayer Perceptron (MLP) neural networks, and obtains accuracy values ranging from 40% to 95% depending on the conditions of the area. Following the idea of exploiting the 3D-shape of trees, some methods perform tree detection from RGB images using generated Digital Surface Models (DSMs), Structure-from-Motion (SfM) or local-maxima based algorithms on UAV-derived Canopy Height Models (CHMs) [14,15]. Nevertheless, the aforementioned methods are likely to show poor performance for trees with irregular canopy, trees in mixed-species forests, or trees that are partially occluded by taller trees.
There exist tree detection methods that use multispectral or RGB cameras and specific descriptors such as crown size, crown contour, foliage cover, foliage color and texture [16]; while others rely on pixel-based classification techniques, such as calculating the Normalized Difference Vegetation Index (NDVI), Circular Hough Transform (CHT) and morphological operators to segment palm trees with an accuracy of 95% [17]. Other methods depend on object-based classification techniques; for example, they use the Random Forest algorithm on multispectral data with an accuracy value of 78% [18], or a naive Bayesian network on high-resolution aerial ortophotos and ancillary data (Digital Elevation Models and forest maps) with an accuracy value of 87% [19].
In recent years, the availability of large datasets and optimal computational resources has allowed for the development of different deep learning techniques, which have now become a benchmark for tackling computer vision problems such as object detection or segmentation. Nevertheless, to the best of our knowledge, few deep learning-based techniques have been proposed to solve the problem of tree detection in aerial images. For instance, the method in [20] used the AlexNet CNN (Convolutional Neural Network) architecture with a sliding window for palm tree detection and counting, obtaining an overall accuracy of 95% over QuickBird images with a spatial resolution of 2.4 m. Similarly, the method in [21] used a pre-trained CNN in combination with the YOLOv2 algorithm to detect Cohune palm trees (Attalea cohune C.), with an average precision of 79.5%, and deciduous trees, with an average precision of 67.3%. Furthermore, the method in [22] used Google’s CNN Inception v3 with transfer learning and sliding windows to detect coconut trees with a precision of 71% and a recall of 93%. Finally, the method in [23] first segmented aerial forest images into individual tree crowns using the eCognition software and then trained the GoogLeNet model to classify seven tree types with an accuracy of 89%. It is worth mentioning that all of these methods are trained to classify visible tree crowns in the images but do not attempt to delineate or segment the tree crowns; as a consequence, if most of a tree crown is covered by taller trees, trained CNNs are not likely to detect it.
In this work, we present a new efficient method to semantically segment Mauritia flexuosa palm trees in aerial images acquired with RGB cameras mounted on Unmanned Aerial Vehicles (UAV). Our aerial images of a Mauritia flexuosa swamp located south of the Peruvian city of Iquitos were obtained with three different cameras under different climate conditions. By doing so, we created a publicly available dataset of 25,248 image patches of 512 × 512 pixels, each of them with their respective hand-drawn ground truth. With this dataset, we trained five state-of-the-art segmentation deep learning models and decided to use a model based on the Deeplab v3+ architecture [24], as it showed the best performance. The model was trained to detect and segment Mauritia flexuosa crowns at different growing stages and scales, even when only a small part of the crown was visible.

2. Materials and Methods

2.1. Mauritia flexuosa

The Mauritia flexuosa swamp, also known as “aguajal”, is a swamp (humid forest ecosystem) in permanently flooded depressions. Although it is home to more than 500 flora species and 12 fauna species, its dominant species is the Mauritia flexuosa palm, also known as “aguaje”, which is a palm tree that belongs to the family Arecaceae. In the adult stage, aguajes can grow up to 40 meters (131 feet) in height and 50 centimeters (1.6 feet) in trunk diameter; their leaves are large and form a rounded crown (Figure 1). Each palm tree has an average of eight clusters of fruit, and each cluster produces more than 700 oval-shaped drupes covered in dark red scales [1].
The extent of Mauritia flexuosa swamps in the Peruvian Amazon rainforest is quite significant. An example is the Ucamara depression between the Ucayali and Marañón rivers, in the region of Loreto, whose capital is the Iquitos City. There, the extent of these swamps reaches about four million hectares (10% of the region surface) [3].
In addition to the economic (Iquitos City alone consumes up to 50 metric tons of aguaje a day) [1], social [3] and nutritional value [25] of this palm tree, its environmental importance is also to be highlighted: in 2010, the FAO Forestry Department stated that, for the evaluation period 2002–2008 in an area of 1,415,100 hectares of aguajales, 146,462,850 metric tons of carbon were stored in vegetation (103.5 t/ha) and 141,510,000 metric tons of carbon in soil (100 t/ha), which represents the greatest carbon absorption capacity of all ecosystems in the Amazonian rainforest [5].
Worryingly, cutting down these trees to harvest the fruit of aguaje is affecting several populations of Mauritia flexuosa female palms. It is estimated that 17 million of these palms are cut down in the surroundings of Iquitos to meet the demand of the city [1]. This has resulted in the disappearance of female individuals in accessible Mauritia flexuosa populations, thus affecting the food chains of such regions (due to their key importance in the diet of the Amazonian fauna) and causing genetic erosion (since the best and more productive palms are cut down). For such reasons, these ecosystems should be properly and continuously monitored so that preventive measures can be taken in order to prevent illegal logging and the disappearance of this important palm tree.

2.2. Image Acquisition

2.2.1. Study Area

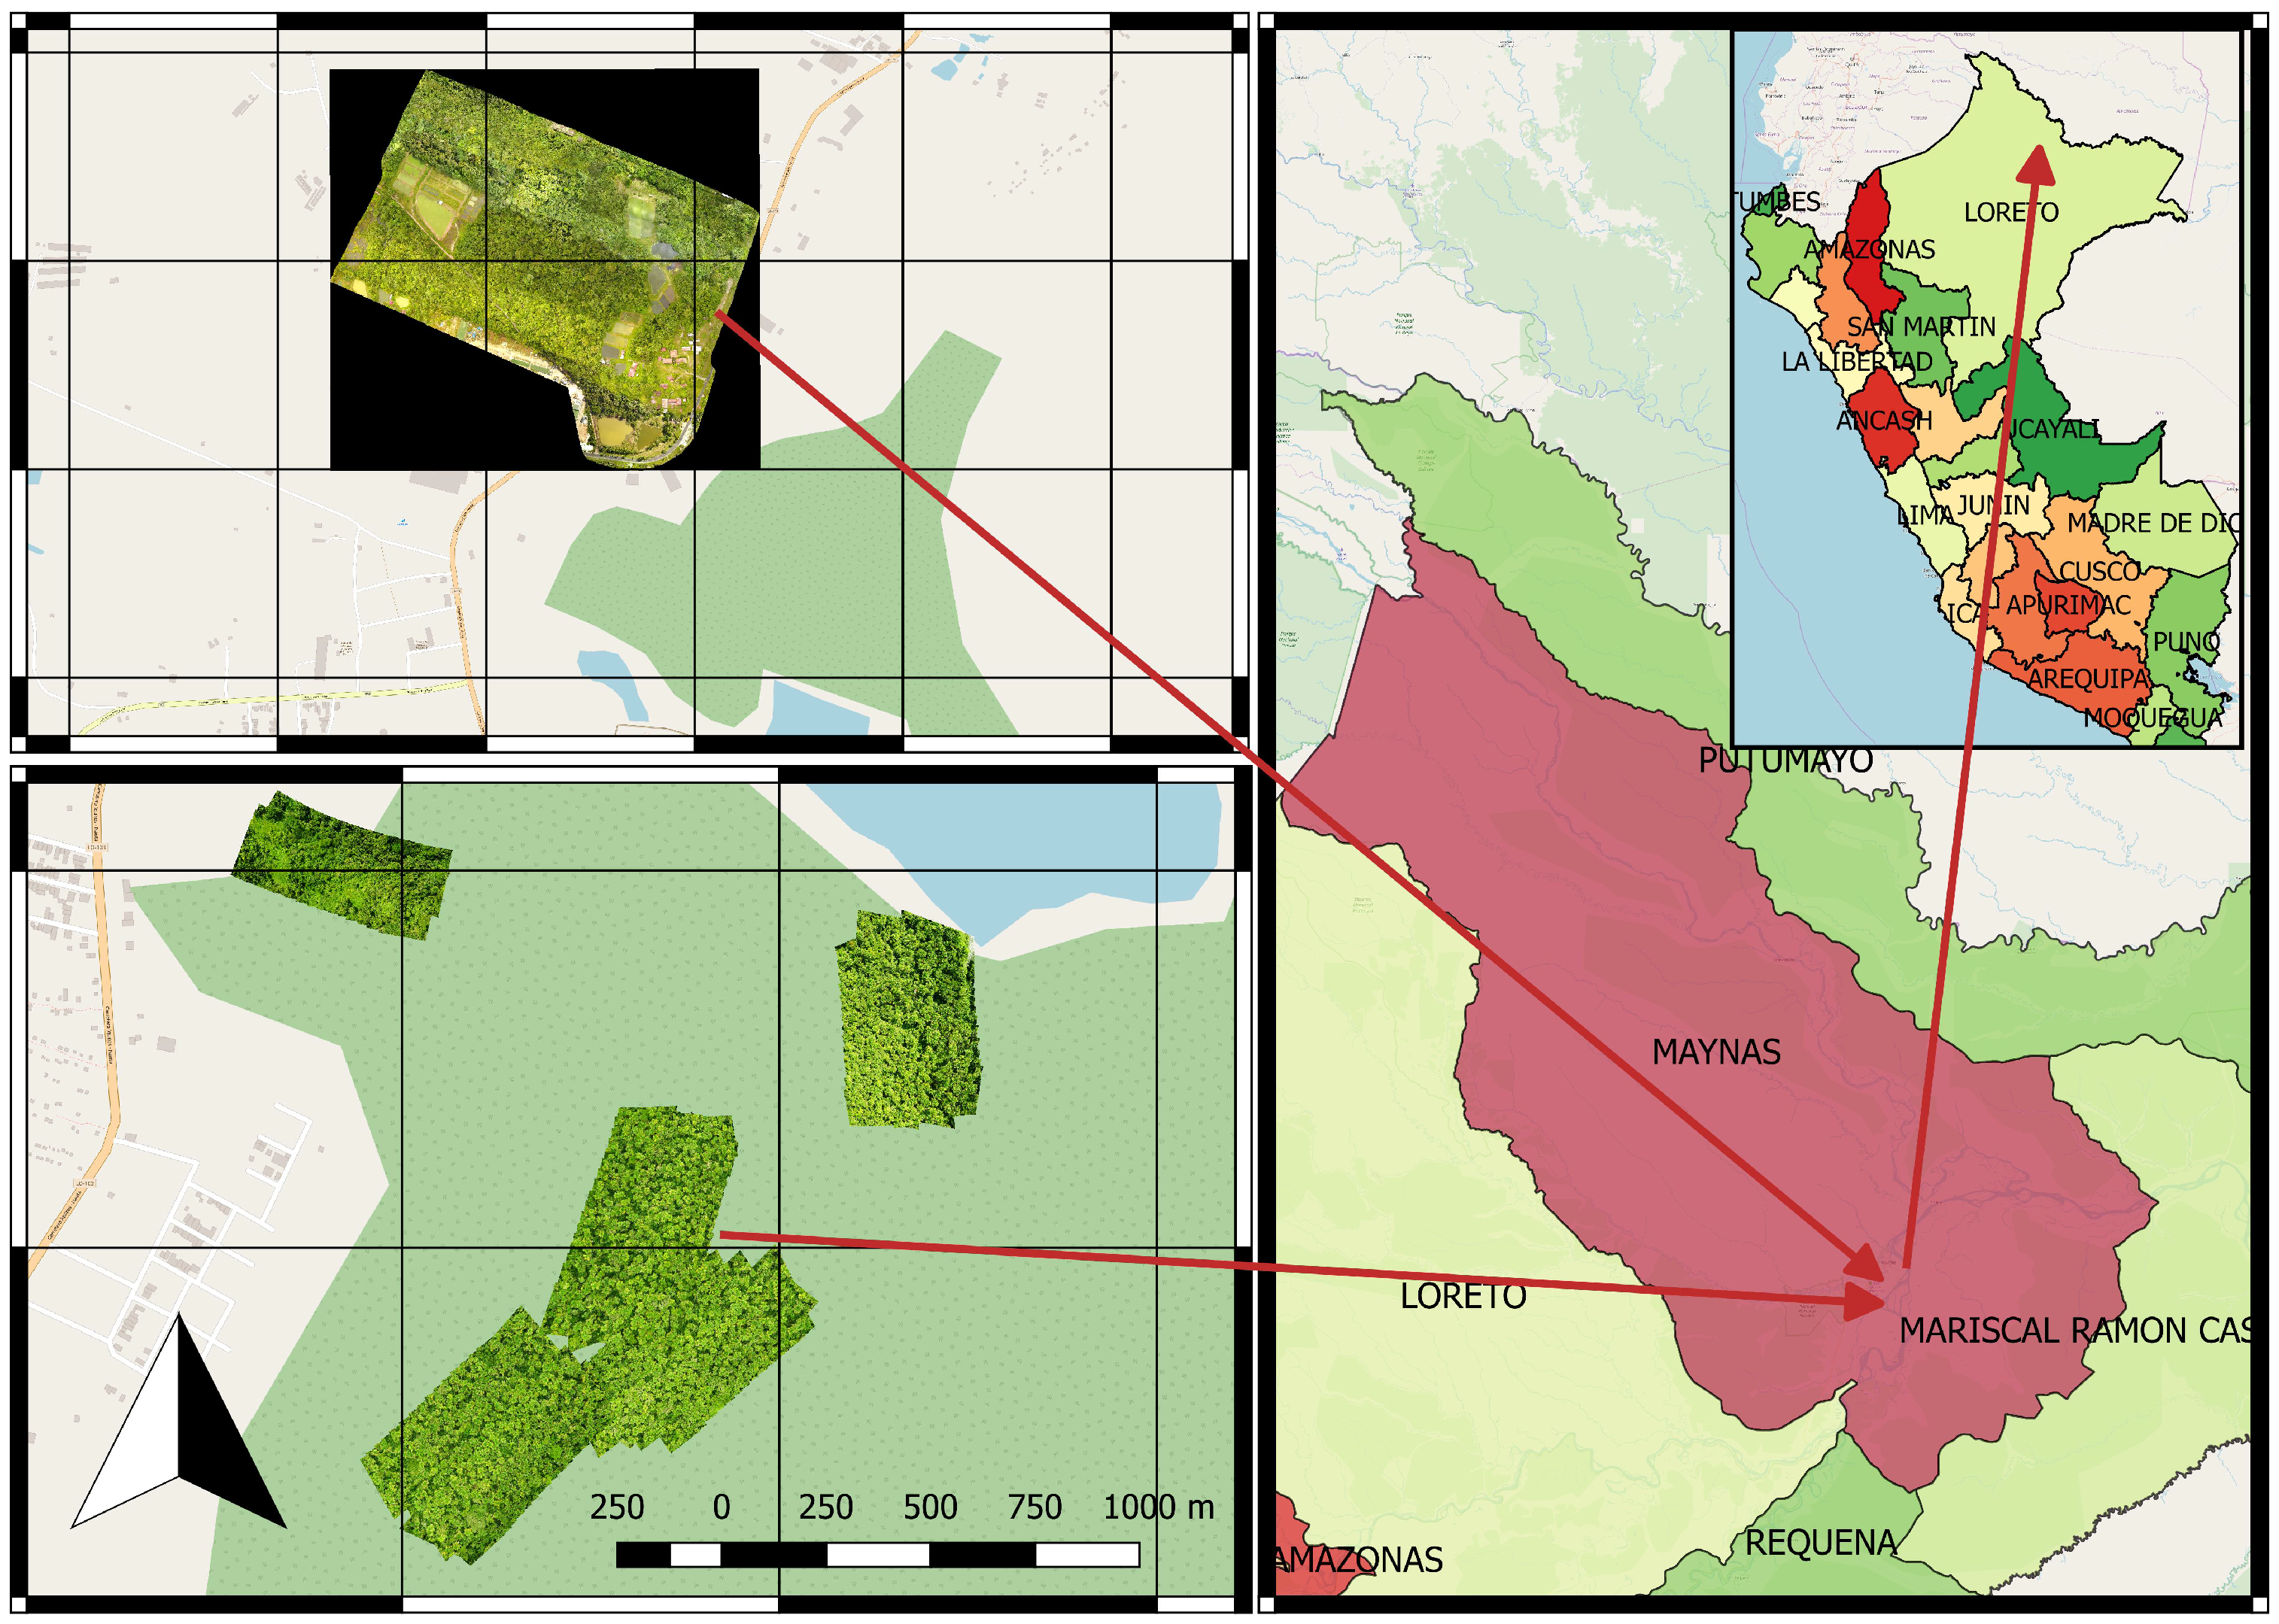
The study area consisted of two regions with different densities of Mauritia flexuosa. The one with the higher density was located in the surroundings of Lake Quistococha, south of Iquitos City. The other region was located next to the facilities of the Peruvian Amazon Research Institute (IIAP). Both areas are in Iquitos City, in Maynas Province. Figure 2 shows six orthomosaics corresponding to the regions above.

2.2.2. UAV Imagery

UAV imagery was collected over the years (2015, 2016, 2017 and 2018) under different atmospheric conditions. The flight crew consisted of two pilots and one spotter. We used three UAVs with different camera models; and so, we acquired images with different features. Further details are summarized in Table 1.
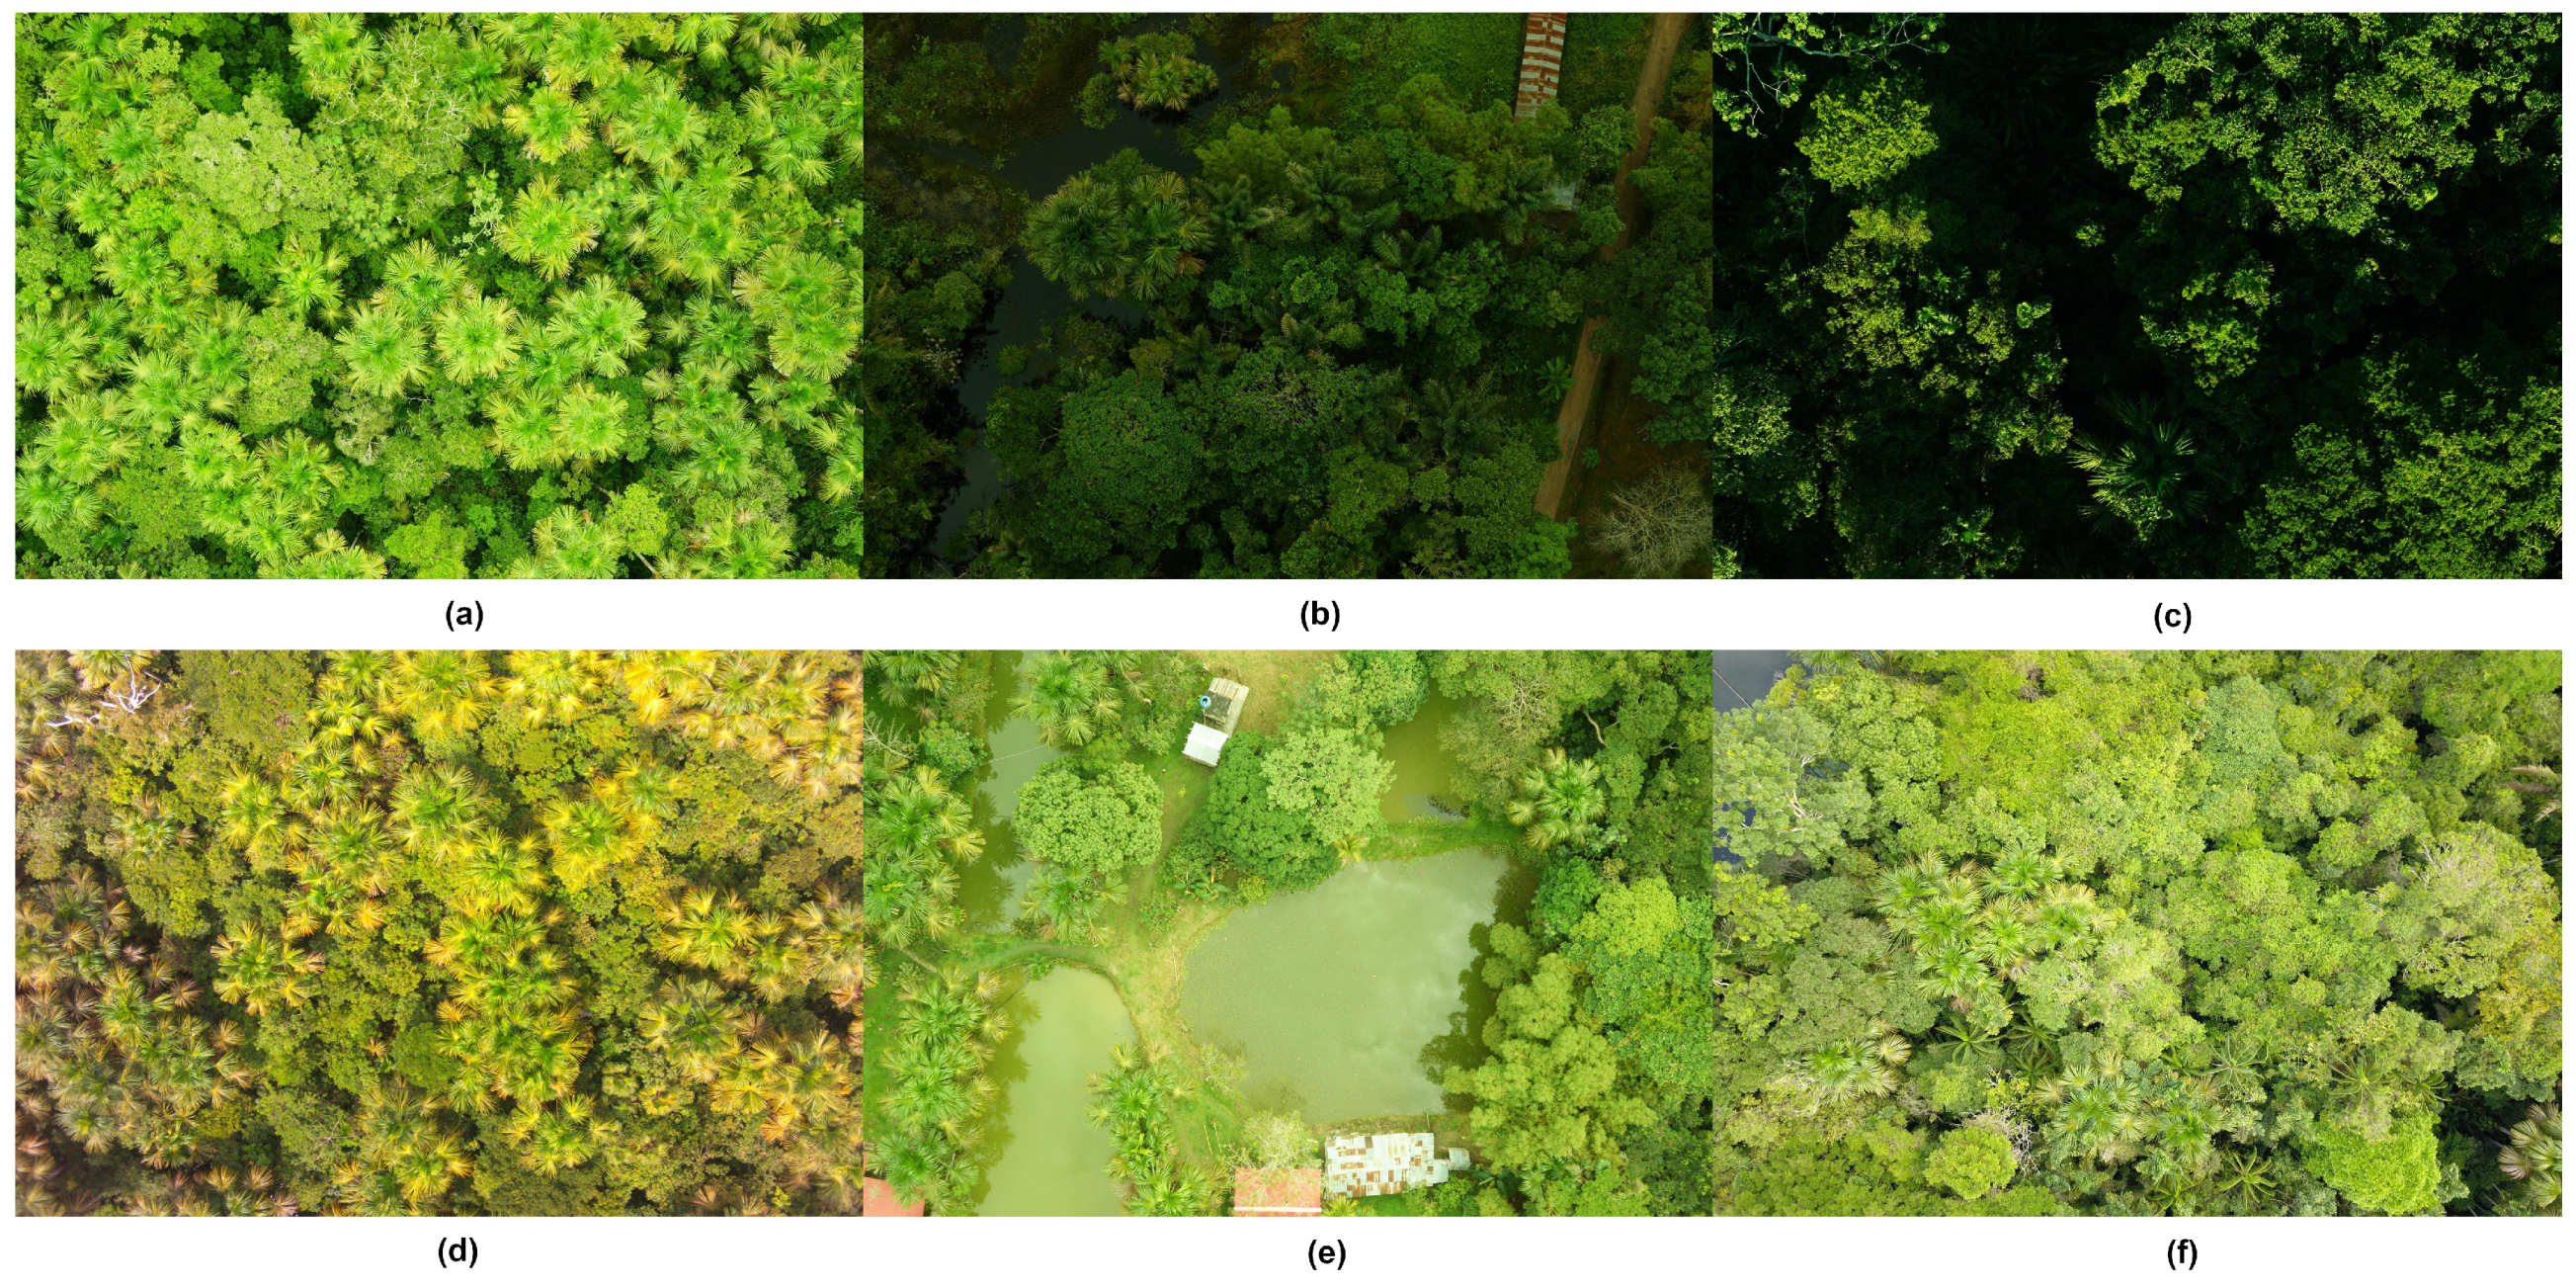
The Sony Nex-7 camera mounted in the Matrix-E UAV was manually configured: the ISO value was 200; the maximum aperture was f/8; and the shutter speed was 1 / 320 . The settings of the SkyRanger and the Mavic Pro cameras were set to automatic. Many of the images were acquired near midday with cloud-free conditions (Figure 3a); however, Iquitos is normally covered in big clouds, and that is why we obtained some dark images of forest under shadows (Figure 3b). Some images were also acquired in the afternoon, and due to the angle of incidence of the sun’s rays, there were many shadows cast by tall trees (Figure 3c). Moreover, the images acquired with the SkyRanger camera showed a defect around the corners known as vignetting (Figure 3d). Finally, because we flew at different altitudes, we achieved Ground Sample Distances (GSD) from 1.4 to 2.5 cm/pixel. In summary, we acquired images with different resolutions, white balance settings, light conditions and others defects; nevertheless, Mauritia flexuosa palms can still be recognized by any trained human.

2.2.3. MauFlex Dataset

Among all the aerial images acquired over the last four years, we selected 96 of the most representative to create the dataset: 47 were acquired by the TurboAce UAV; 28, by the Mavic Pro UAV; and 21, by the SkyRanger UAV. Each image has a binary hand-drawn mask indicating the presence of Mauritia flexuosa palms in white. From these images, we extracted image patches of 512 × 512 pixels.
To analyze the images at different scales, the images captured by the TurboAce UAV were resized to 50% and 25% of their original size due to their high level of detail. In addition, we used data augmentation to increase the dataset size and to prevent overfitting issues; thus, each patch was rotated 90°, 180° and 270° [26]. This is how we created the MauFlex dataset (See Supplementary Materials) [27], which is made up of 25,248 image patches, each one with its respective binary mask, as shown in Figure 4. We split 95% of the data to create the training set, 2.5% to create the validation set and 2.5% to create the test set. These three sets are independent among them.

2.3. Proposed CNN for Segmentation

We propose a semantic level segmentation of Mauritia flexuosa using a Convolutional Neural Network (CNN). The architecture of our network is based on the Deeplab v3+ architecture [24], which integrates an encoder, a spatial pyramid pooling module, and a decoder. Those modules use inverted residual units, atrous convolutions and atrous separable convolutions, which are briefly described below:
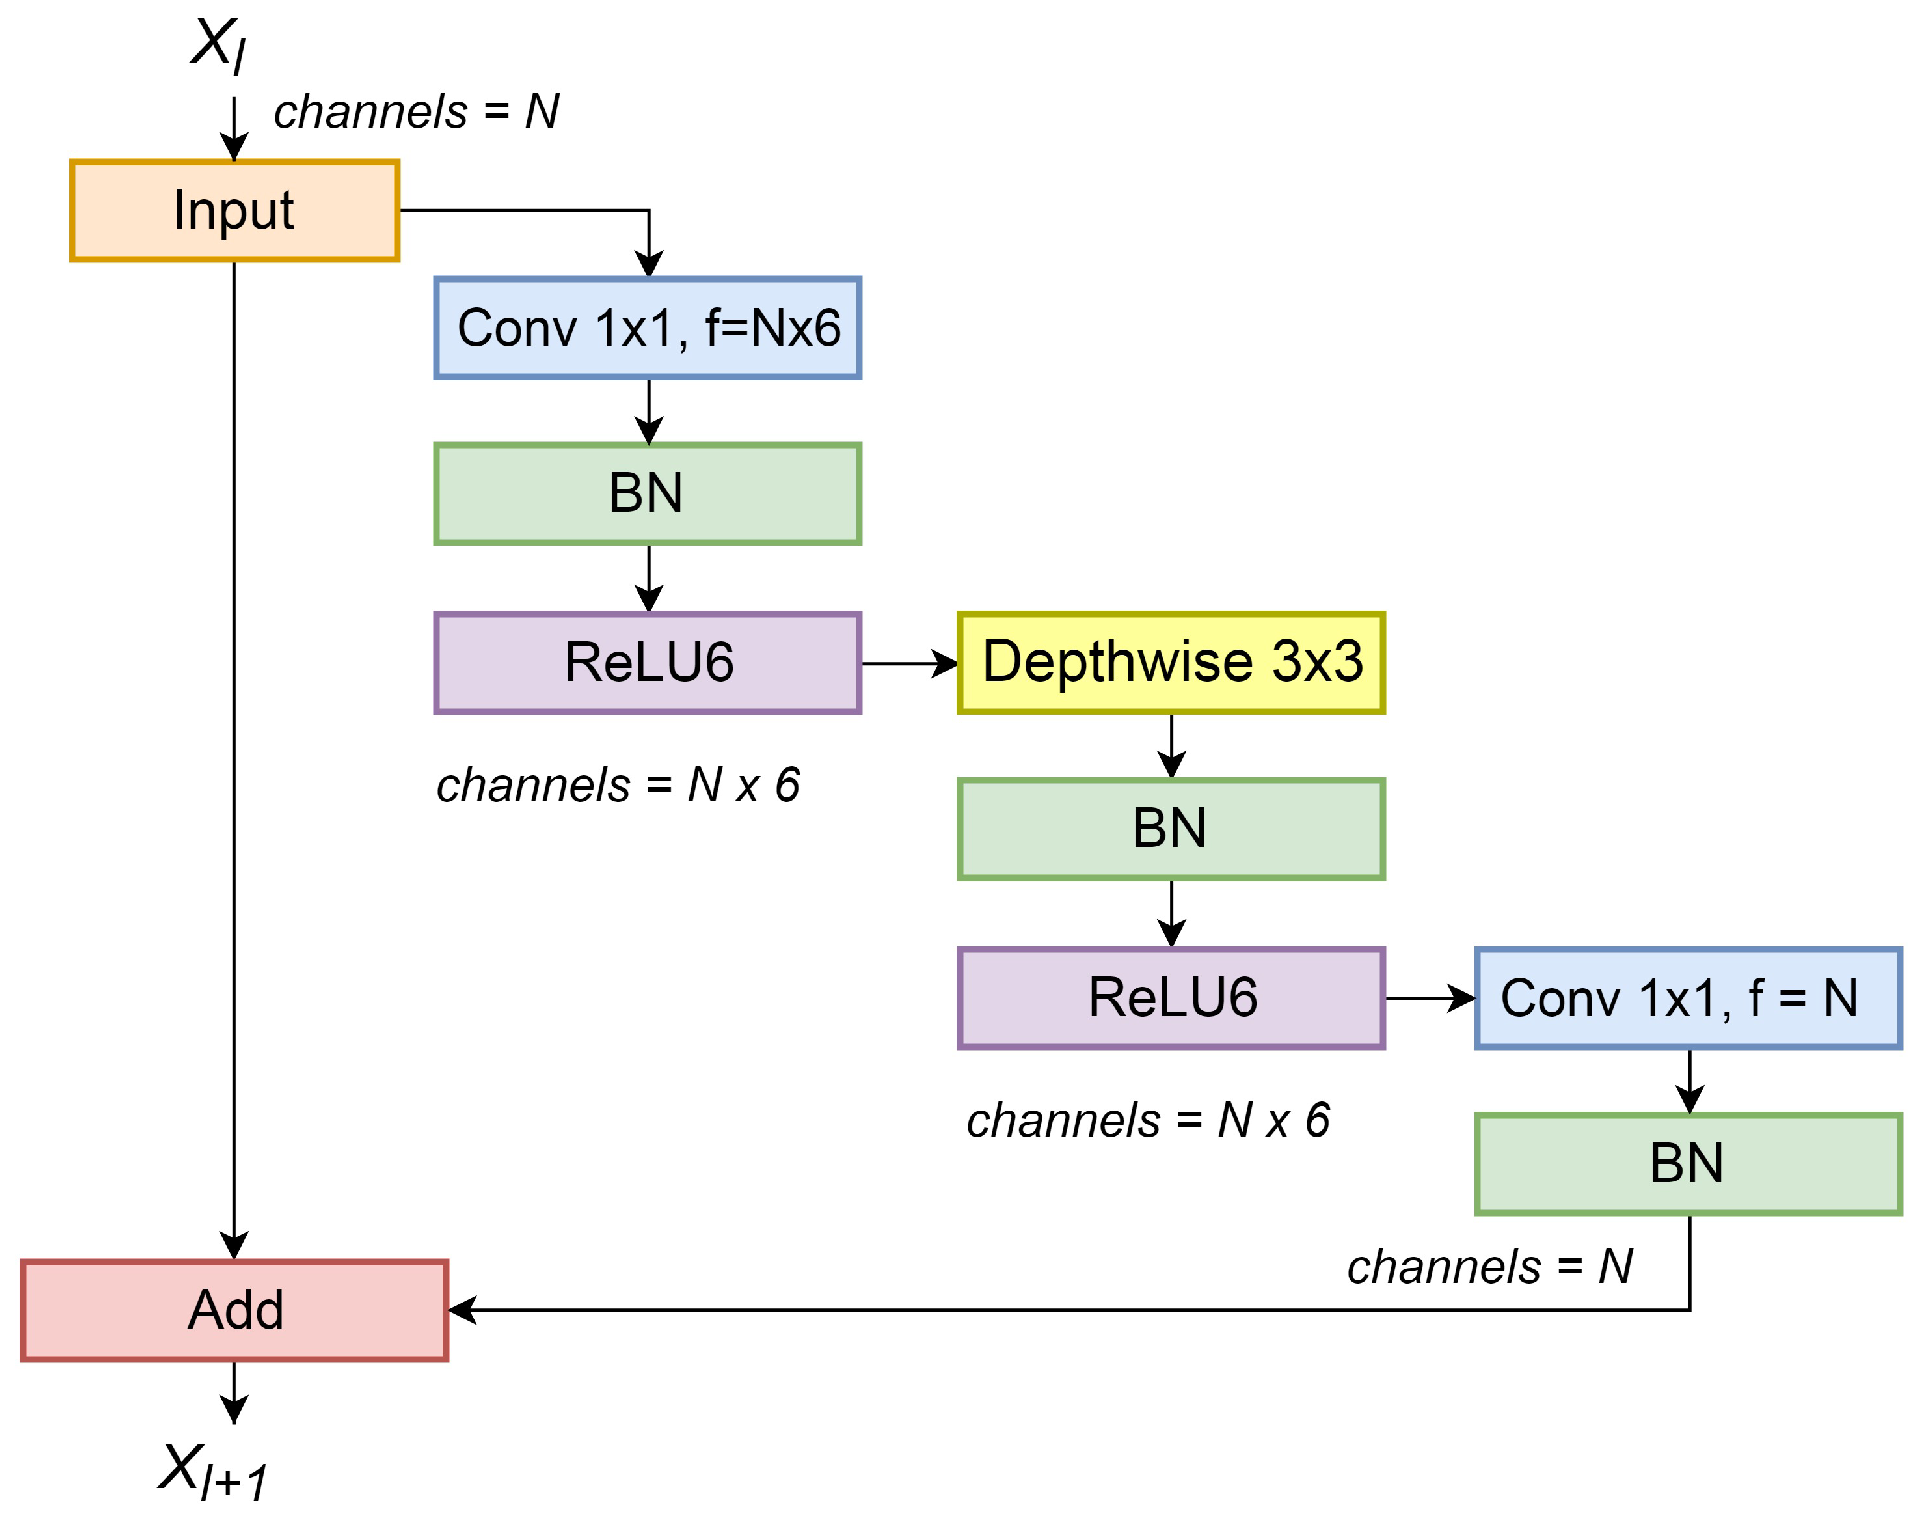
  • Inverted residual unit: The main feature of a residual unit is the skip/shortcut between input and output, which allows the network to access earlier activations that were not modified by the convolution blocks, thus preventing network degradation problems such as gradient vanishing or exploding when it is too deep [28]. Inverted residuals units were first introduced in [29]; the main difference is that instead of expanding the number of input channels and then shrinking them, inverted residual units (IRUs) expand the input number of channels using a 1 × 1 convolution, then apply a 3 × 3 depthwise convolution (the number of channels remains the same), and, finally, apply another 1 × 1 convolution that reduces the number of channels, as shown in Figure 5. The IRU shown in Figure 5 uses a batch normalization layer (“BN”) and a Rectified-Linear unit layer with a maximum possible value of 6 (“ReLU6”) after each convolution layer.
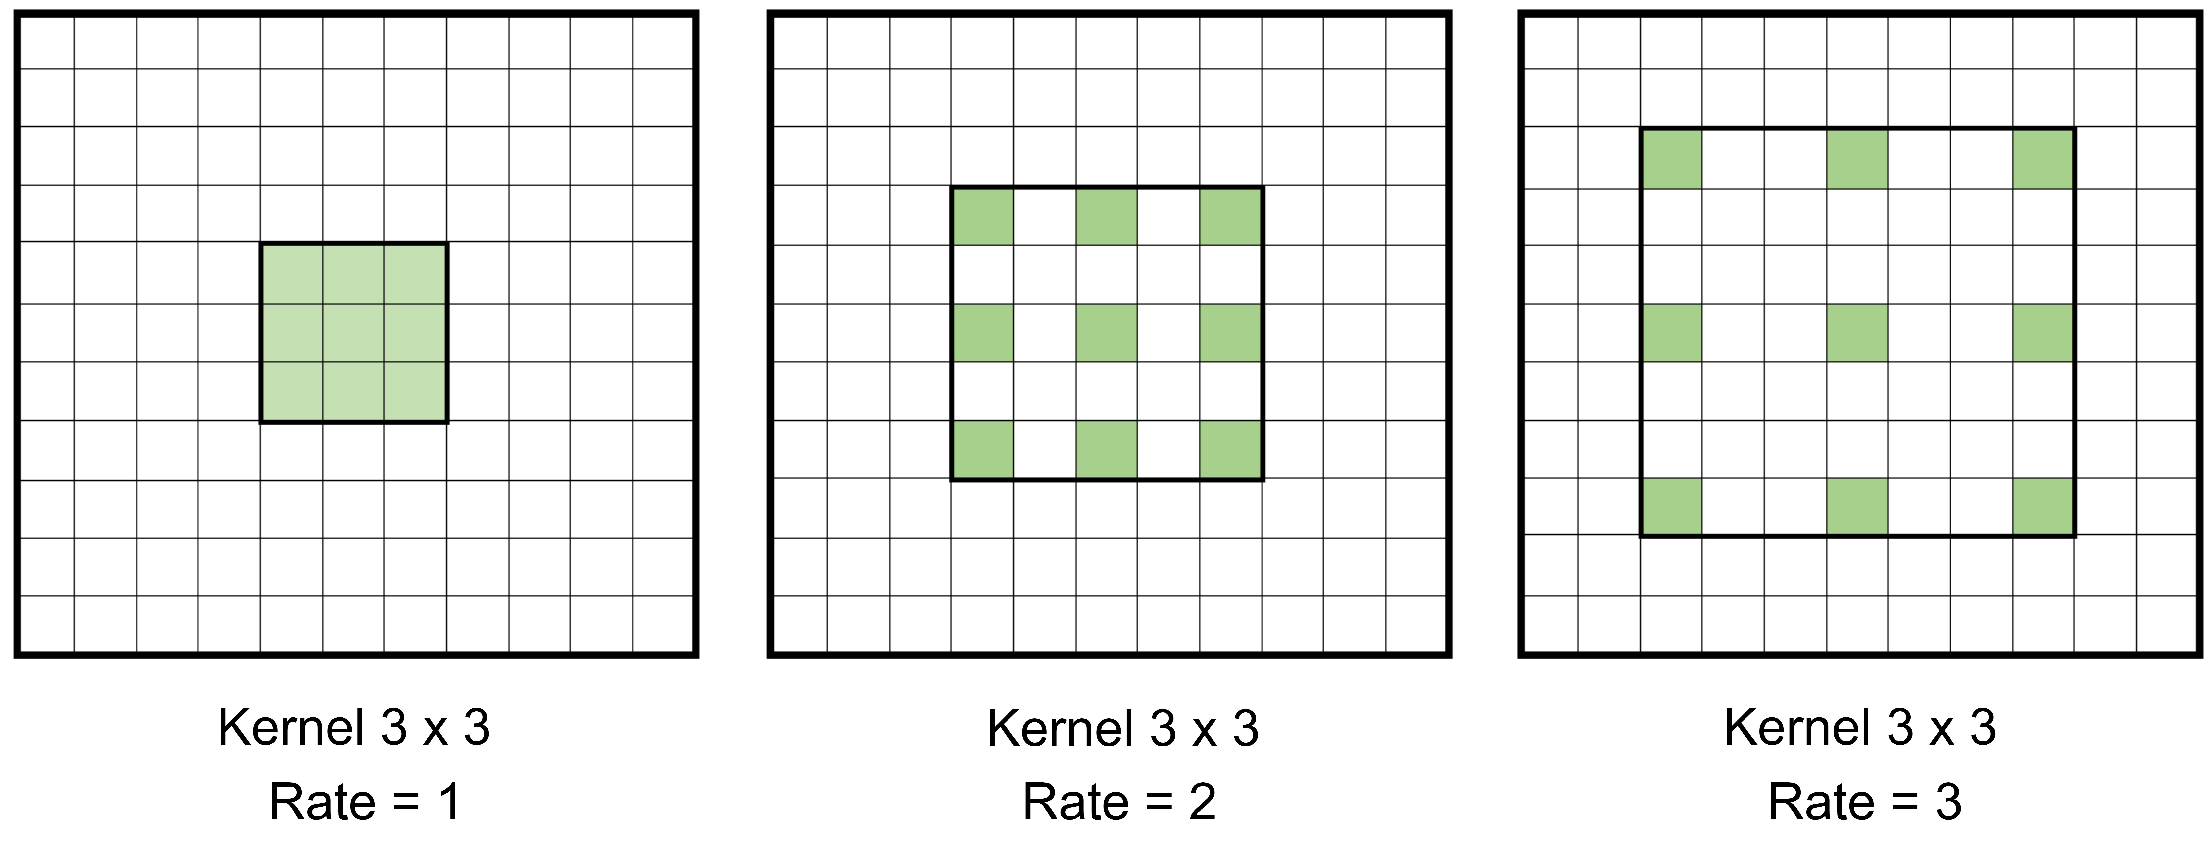
  • Atrous convolution: Also known as dilated convolution, it is basically a convolution with upsampled filters [30]. Its advantage over convolutions with larger filters, is that it allows enlarging the field of view of filters without increasing the number of parameters [31]. Figure 6 shows how a convolution kernel with different dilation rates is applied to a channel. This allows for multi-scale aggregation.
  • Atrous separable convolution: It is a depthwise convolution with atrous convolutions followed by a pointwise convolution [24]. The former performs an independent spatial atrous convolution over each channel of an input; and the latter combines the output of the previous operation using 1 × 1 convolutions. This arrangement effectively reduces the number of parameters and mathematical operations needed in comparison with a normal convolution.

2.4. CNN Architecture

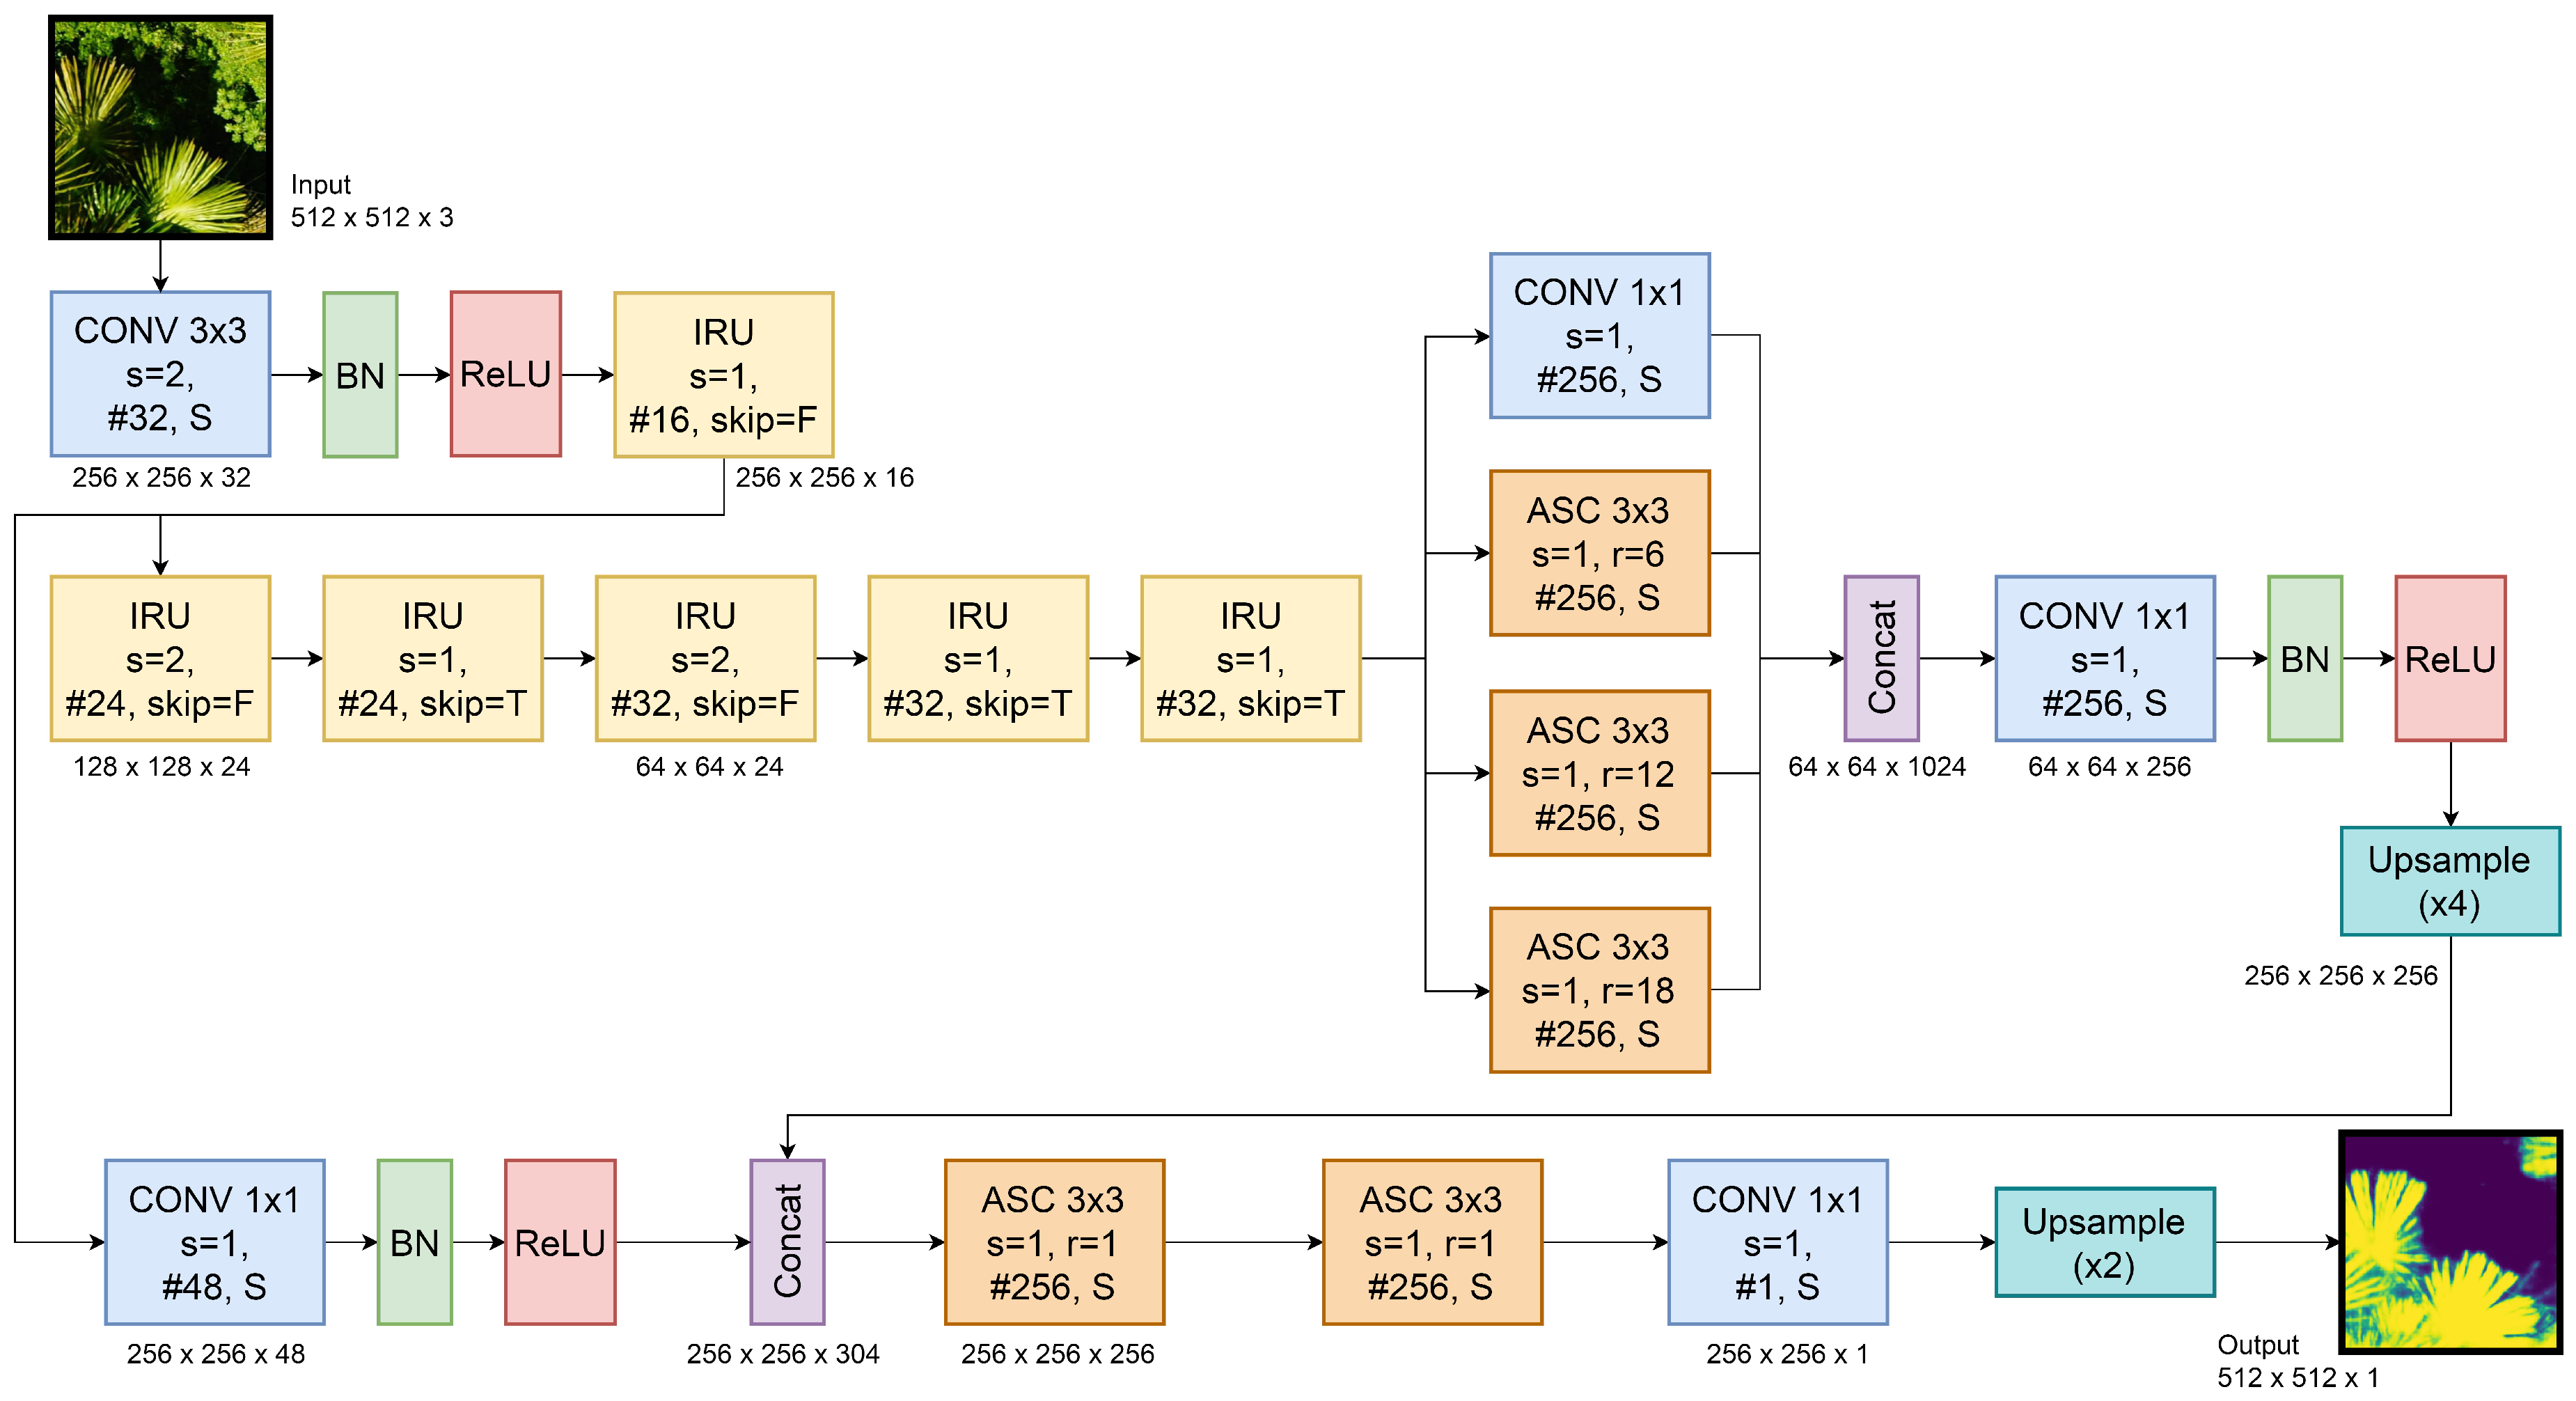
As we stated before, our proposed architecture is similar to the Deeplab v3+ architecture [24]. Figure 7 shows our architecture and its three main modules: an encoder, an Atrous Spatial Pyramid Pooling (ASPP) module, and a decoder. The main difference from the original Deeplab v3+ network is the number of layers used.
The encoder is a feature extractor that uses several inverted residual units as a backbone and reduces the original size of the image by a factor of eight ( o u t p u t s t r i d e = 8 ). The ASPP module applies four parallel atrous separable convolutions with different dilation rates; this allows analyzing the extracted features at different scales. These outputs are concatenated and passed through a 1 × 1 convolution in order to reduce the number of channels. This result is upsampled by a factor of four and concatenated with low-level features of the same dimension. The motivation for doing so is that the structure in the input should be aligned with the structure in the output, so it is convenient to share information from low levels of the network, such as edges or shapes, to the higher ones. Then, we apply two more 3 × 3 separable convolutions and finally, a 1 × 1 convolution with one channel and sigmoid activation, so that a binary mask is obtained. This result is upsampled by a factor of two to recover the original size of the image.
In Figure 7, convolution blocks are denoted as : “CONV;” inverted residual units, as “IRU;” and atrous separable convolution blocks, as “ASC.” The output number of filters of each block is reported using the hash symbol (“#”). The stride of all convolutions is denoted as “s.” Blocks marked with “S” are “same padded,” which means that the output is the same size as the input. “ReLU” represents a standard rectified linear unit activation layer and “BN” a batch normalization layer. If an IRU block is strided, there cannot be a skip between its input and its output; in such cases the “skip” option is set to “False”.

3. Results and Discussion

3.1. CNN Training

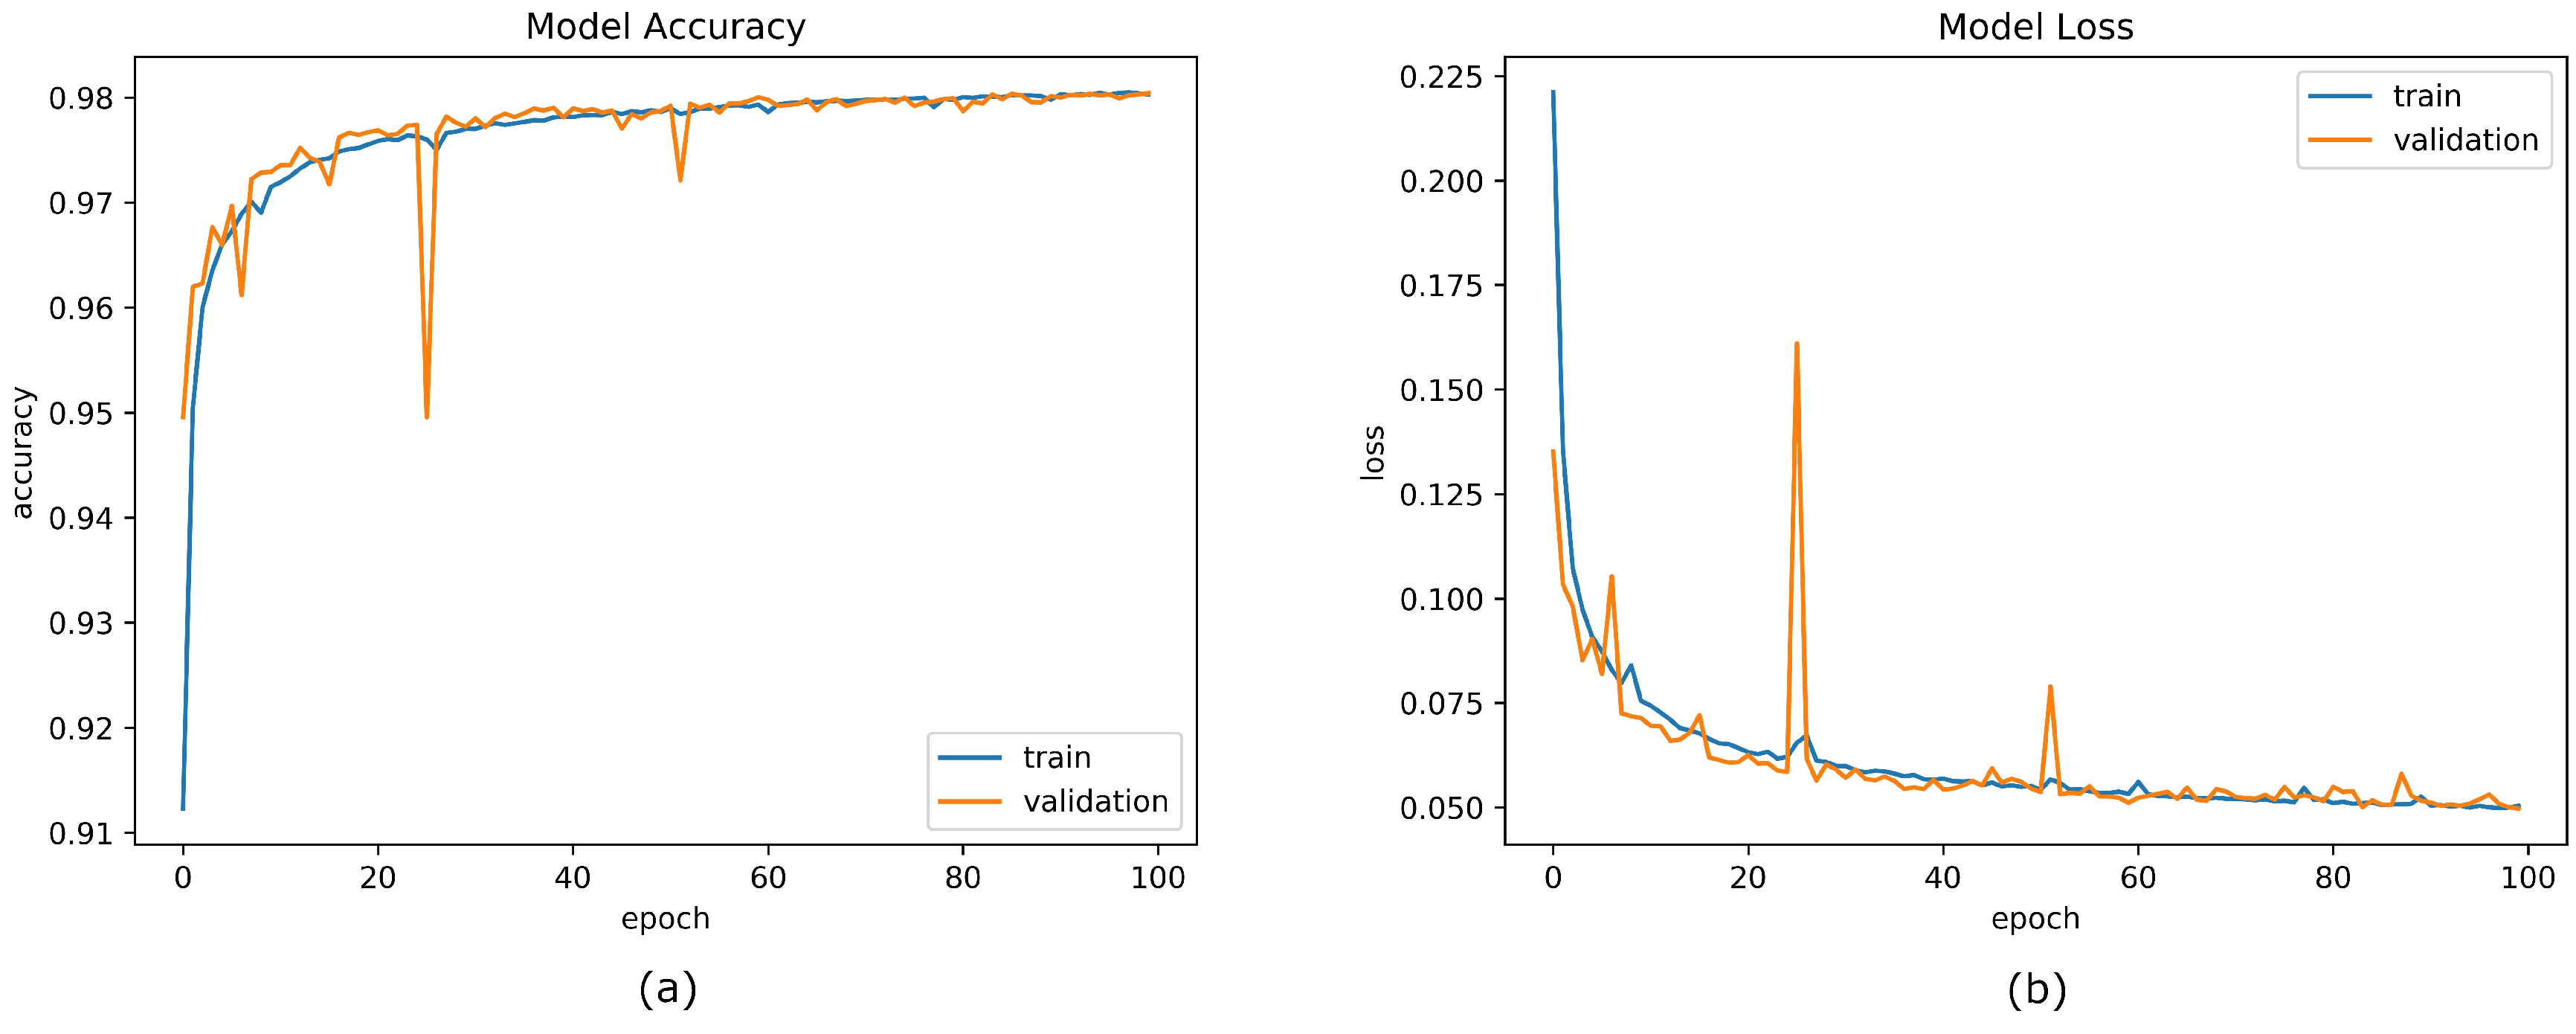
The training algorithm was implemented using Python 3.6 on a PC with Intel i7-8700 at 3.7 GHz CPU, 64GB RAM and a NVIDIA GeForce GTX 1080 Ti GPU. The proposed CNN was trained using an Adam optimizer [32] with a learning rate of 0.003, a momentum term β 1 of 0.9, a momentum term β 2 of 0.999 and a mini-batch size of 16. The binary cross-entropy function was chosen as our loss function given the fact that it is commonly used for binary segmentation problems and that there is a balance between the amount of pixels of both training classes; thus, it was not necessary to implement specialized loss functions, such as weighted binary cross-entropy function. Figure 8 shows the evolution of network accuracy and loss over training time. After each training epoch, the accuracy and the loss are calculated on the validation set to monitor its ability to generalize and avoid overfitting. The spikes shown in validation loss in epochs 30 and 50, approximately, correspond to a decrease in performance in the training set. This is an expected behaviour during the first training epochs, since the model is still unstable and it is not able to generalize well; however, when the model stabilizes, the validation loss fluctuates with small spikes close to the training loss.
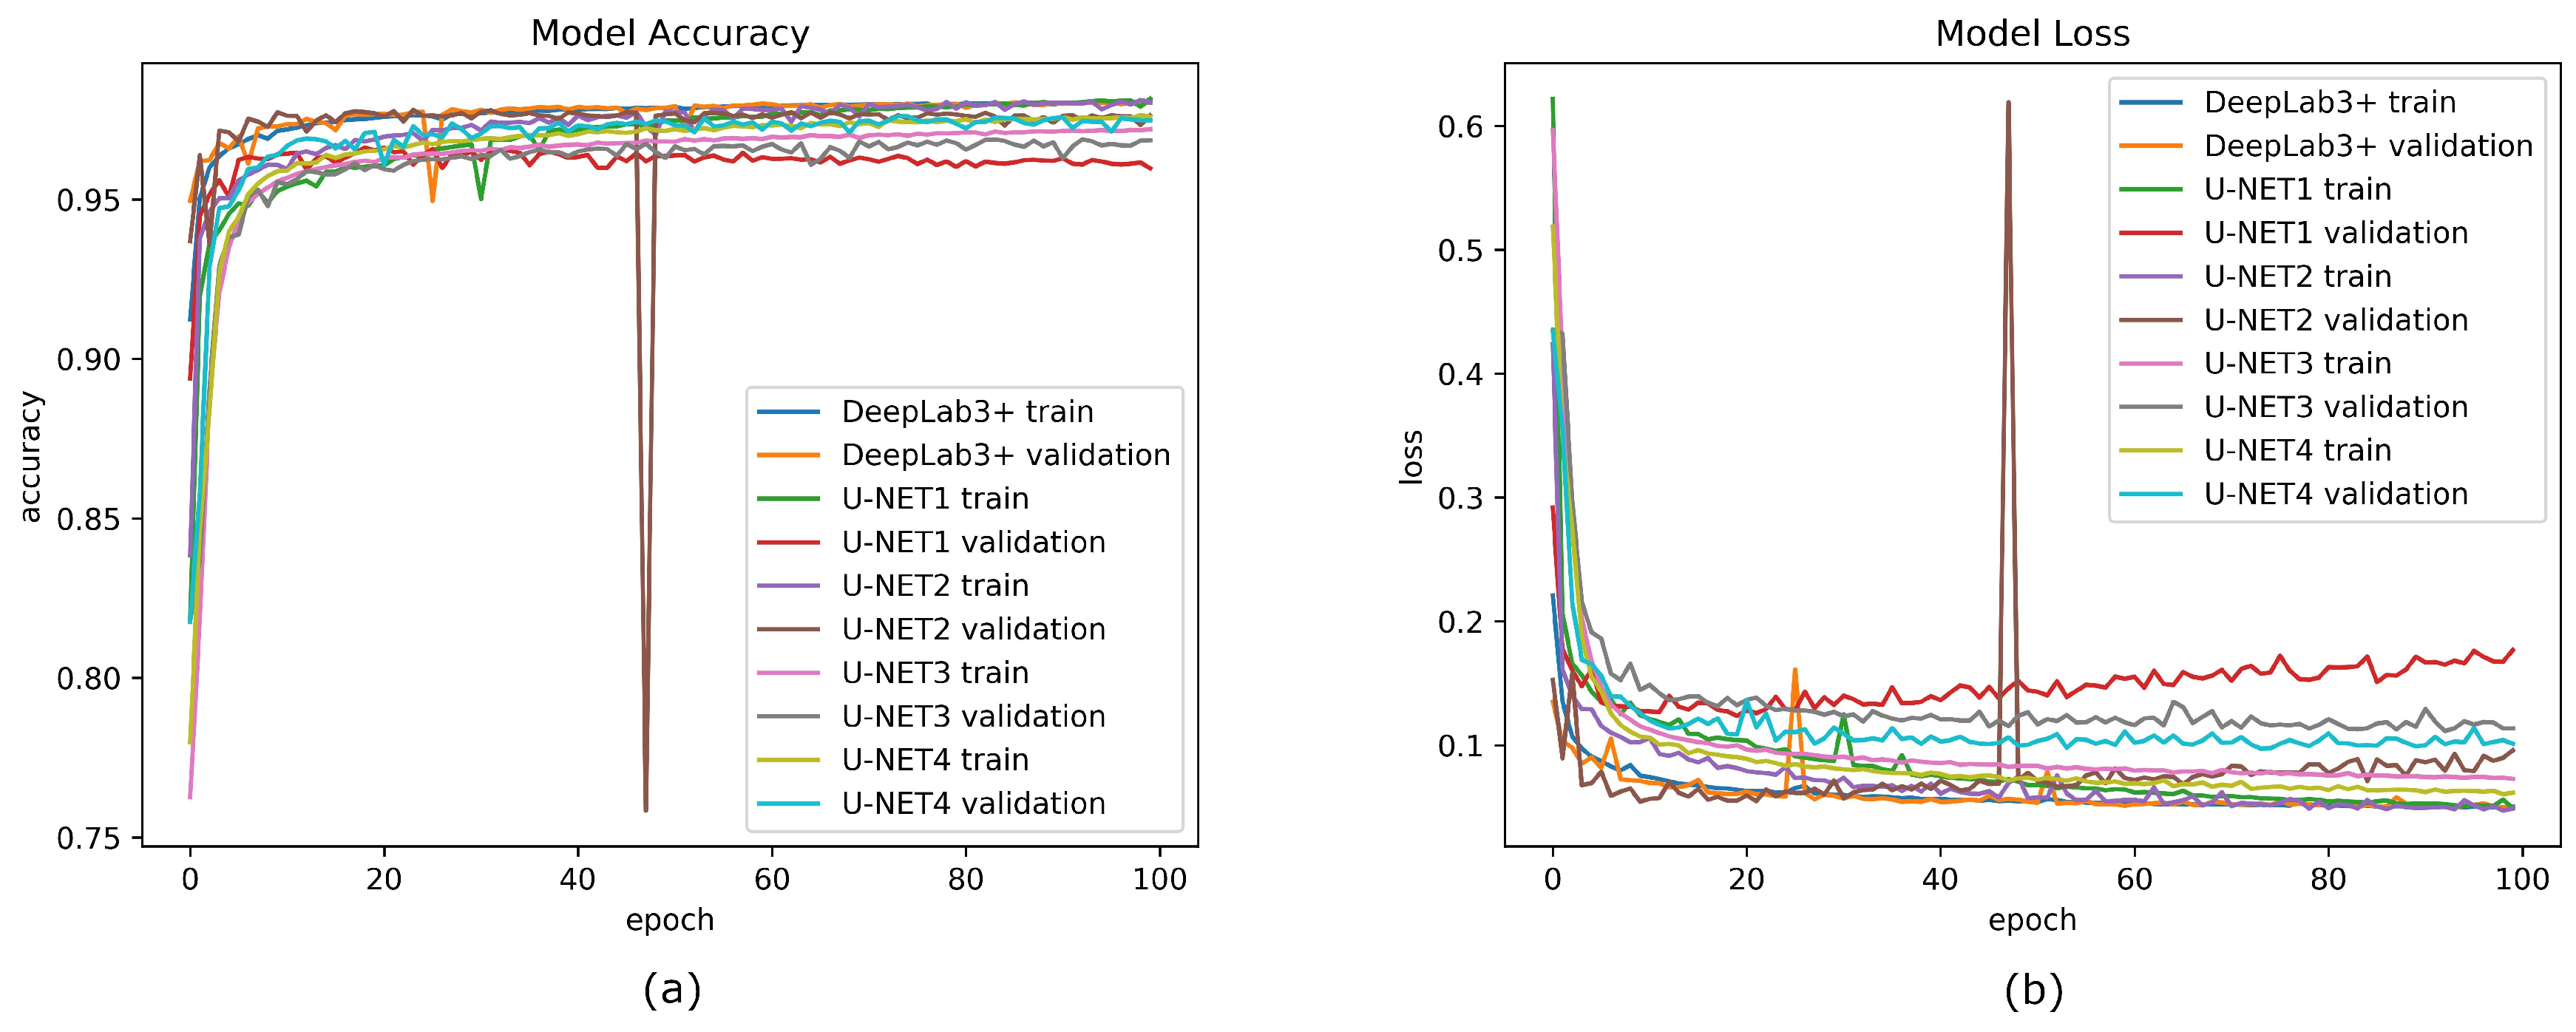
In order to compare the performance of our proposed network with a different segmentation approach, we trained four other networks based on the U-NET structure [33] to compare the results and choose the best one. A U-NET is a network composed of an encoder and a decoder with skip connections that has been widely used for solving segmentation problems. The encoder-decoder structure of the U-NET tends to extract global features of the inputs and generate new representations from this overall information. Because we experienced a sudden drop in the accuracy metric during training, we decided to strengthen our networks by implementing skips between the input and output of each layer with 1 × 1 convolutions in order to equalize the number of channels before the addition operation, thus converting our U-NETs to ResU-NETs [34]. The first implemented network (U-NET1) has three layers in the encoder and three in the decoder; each layer has a 3 × 3 convolution block followed by a batch normalization block and a ReLU activation. Furthermore, we added a 10% dropout rate in the decoder layers to prevent overfitting. The second network (U-NET2) is similar to the previous one but has four layers in the encoder and four in the decoder. The third (U-NET3) and fourth (U-NET4) networks have the same structure as the first and the second networks, respectively, but they apply atrous separable convolutions with dilation rates of two instead of regular convolutions. Figure 9 shows the evolution of accuracy and loss of all networks over training time.
To statistically analyze the behavior of our network against the other networks, we calculated four metrics from the validation set: accuracy (ACC), precision (PREC), recall/sensitivity (SN), and specificity (SP), as shown in Table 2. The ACC ratio indicates correctly predicted observations against total observations; the PREC ratio indicates correctly predicted positive observations against total predicted positive observations; the SN ratio indicates correctly predicted positive observations against total actual positive observations, and the SP ratio indicates correctly predicted negative observations against total actual negative observations. Additionally, the number of trainable parameters of each network is added in Table 2.
In Table 2 we observe that our method has achieved the highest metric values. Our method is nearly 0.5% more accurate, sensitive and specific when compared to the second best accuracy, sensitivity and specificity values; and nearly 1.5% more precise when compared to the second best precision value. That means that our proposed network is particularly better than the others are at avoiding false positives. Although these differences may not seem significant, we observe in Figure 8 and Figure 9 that only our method shows a little difference between the training and validation values over the training time, meaning that it prevents overfitting problems and has better performance than the other networks when it comes to predicting new samples outside the training set. Furthermore, we notice a huge difference between the number of trainable parameters of U-NET1 and U-NET3, and U-NET2 and U-NET4, although they have similar architectures, proving that using atrous separable convolutions instead of regular convolutions significantly reduces the amount of computation. Finally, another advantage of our method is that it has 34,731 less parameters than U-NET4; thus, it is faster because it has less operations to perform. When evaluating on the test set, the proposed network showed an accuracy of 98.143%, a specificity of 96.599%, and a sensitivity of 95.556%. This represents an unbiased evaluation of the final selected network.

3.2. Mauritia flexuosa Segmentation

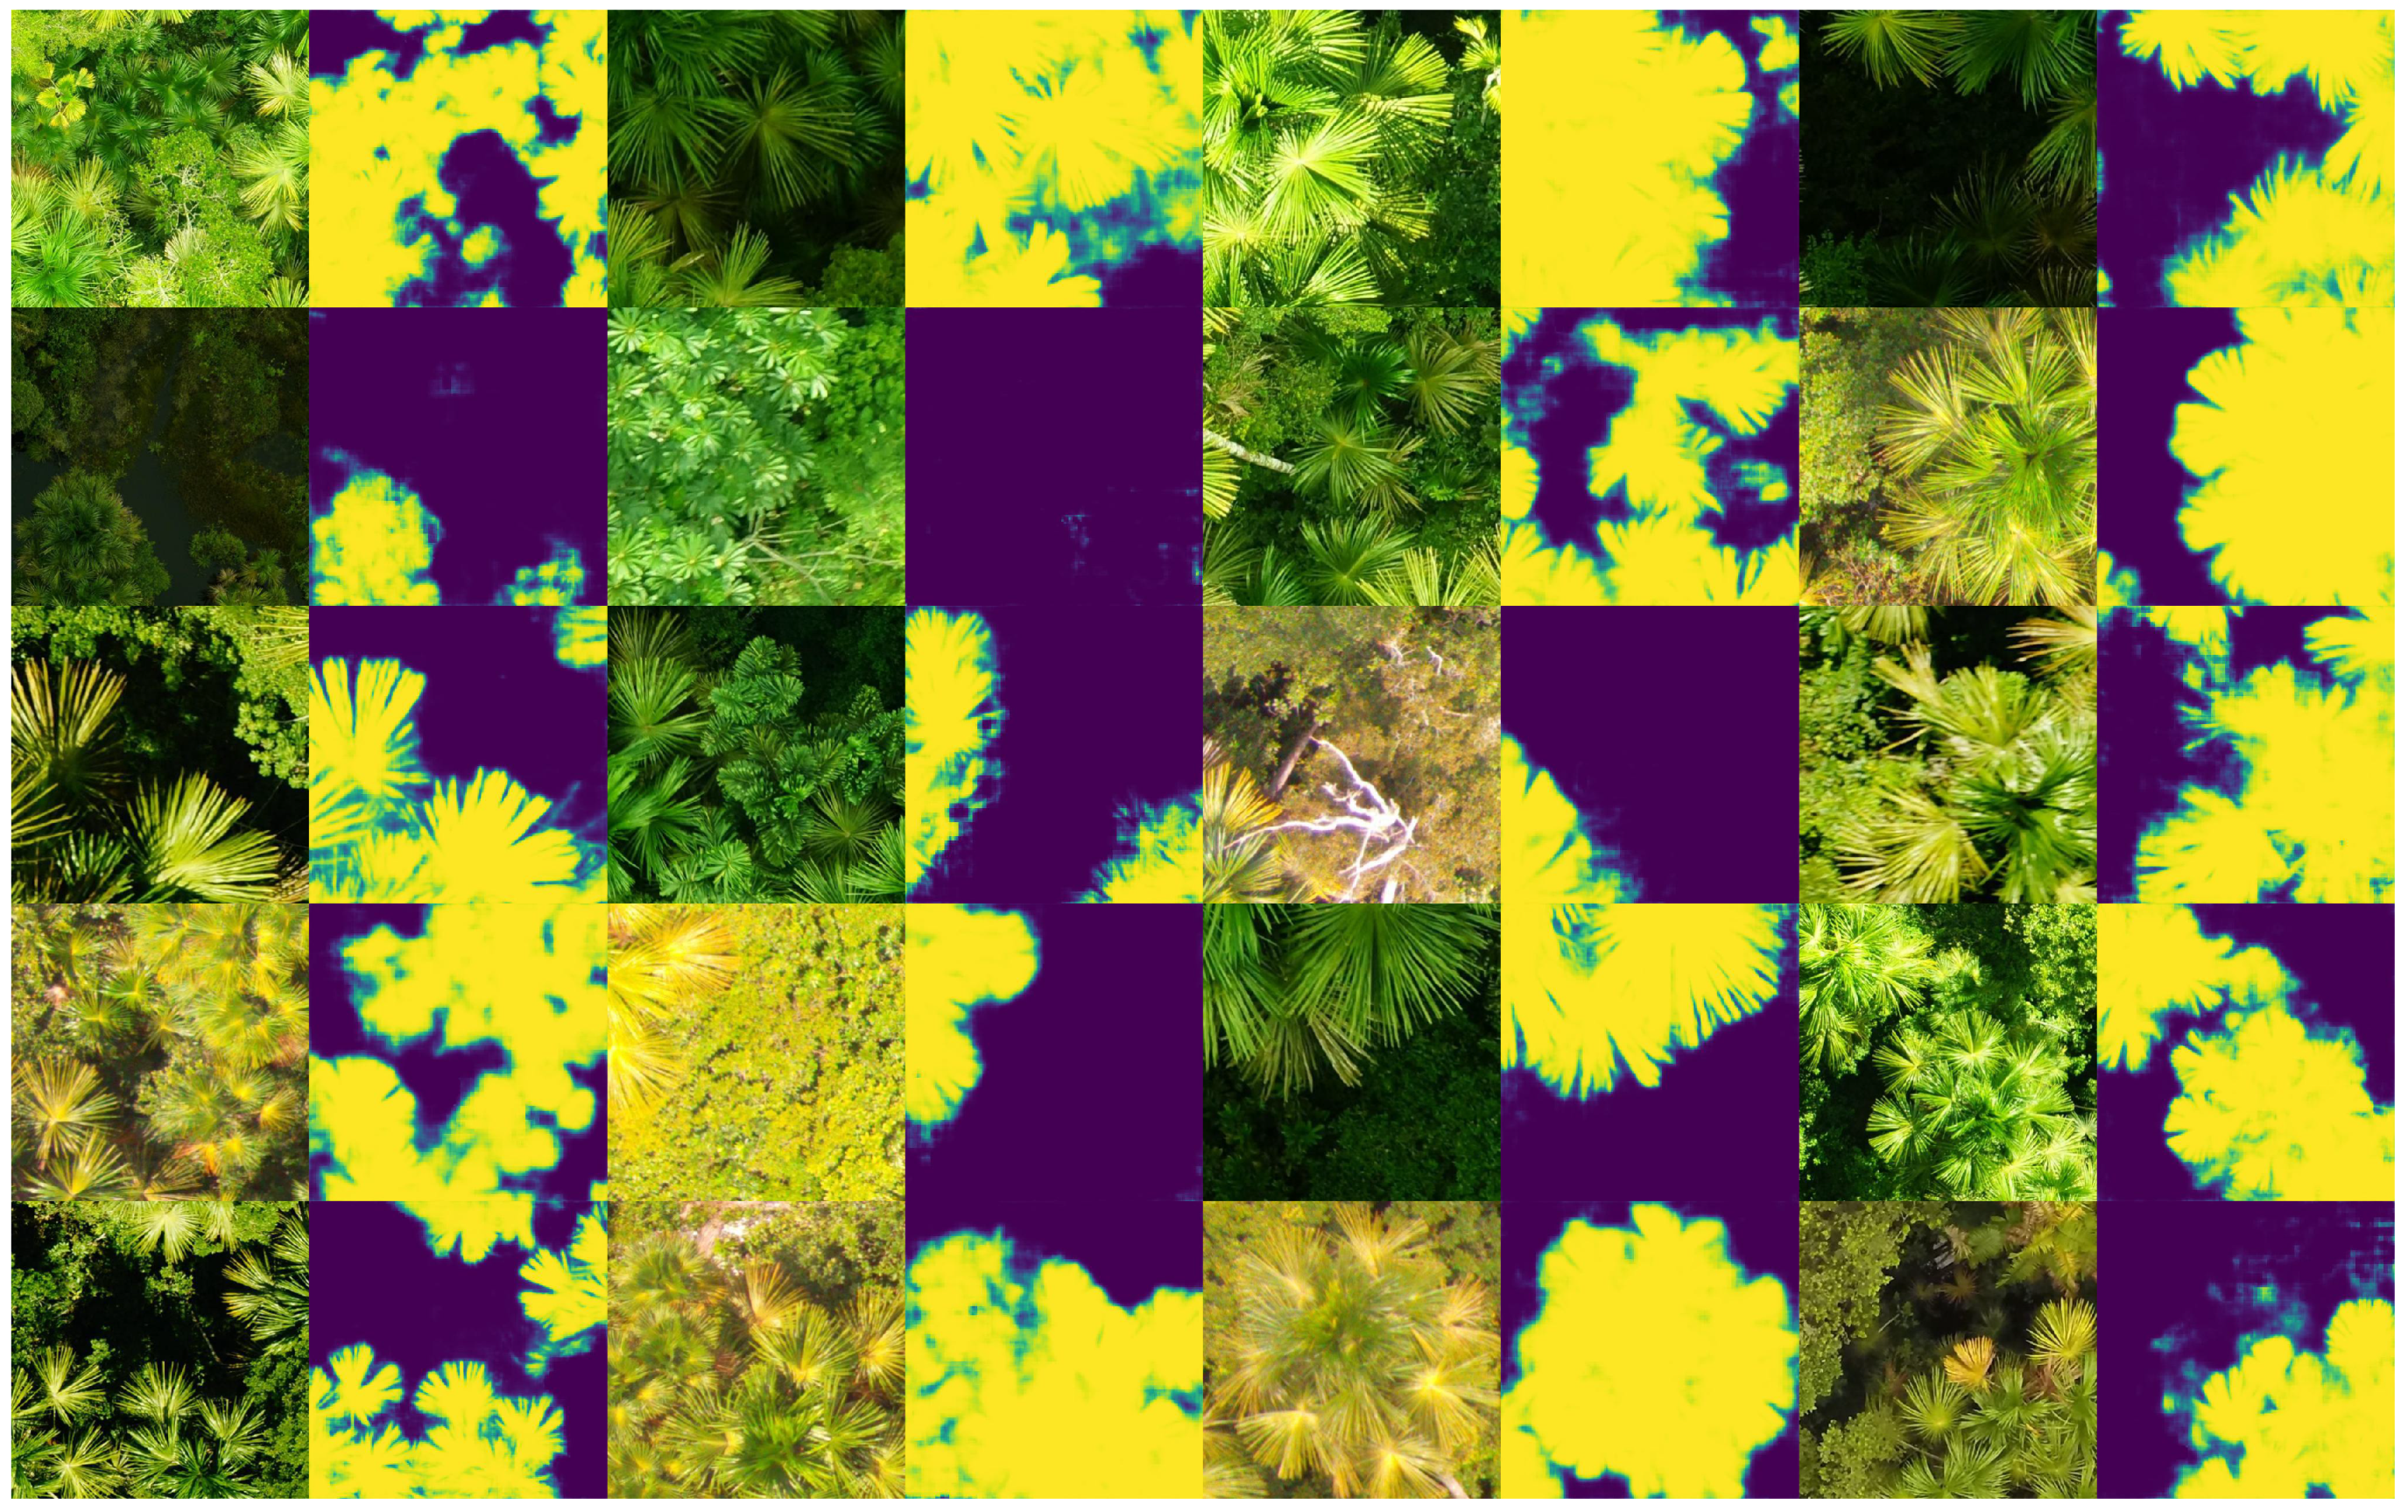
Figure 10 shows the segmentation results of 512 × 512 patches; however, one aerial photograph contains several of these small patches, as its dimensions are much larger (Table 1). Thus, to perform the Mauritia flexuosa segmentation of a whole image, we apply a 512 × 512 sliding window across the image in both horizontal and vertical direction with a 50-pixel overlap. This sliding window is processed by the trained CNN in each position. Then, the image is reconstructed with the segmentation results, as shown in Figure 11. In order to avoid discontinuities or discrepancies in the overlapping pixels captured by the moving pixels, we always considered the maximum pixel values. Furthermore, a threshold of 0.5 is applied over the probability map (Figure 11b) to obtain a binary mask as shown in Figure 11c.

3.3. Mauritia flexuosa Monitoring

The proposed algorithm is designed to be used as a tool by experts from the Peruvian Amazon Research Institute (IIAP). They will acquire aerial images of areas of interest to monitor periodically the approximate amount of Mauritia flexuosa palms on a regular basis.
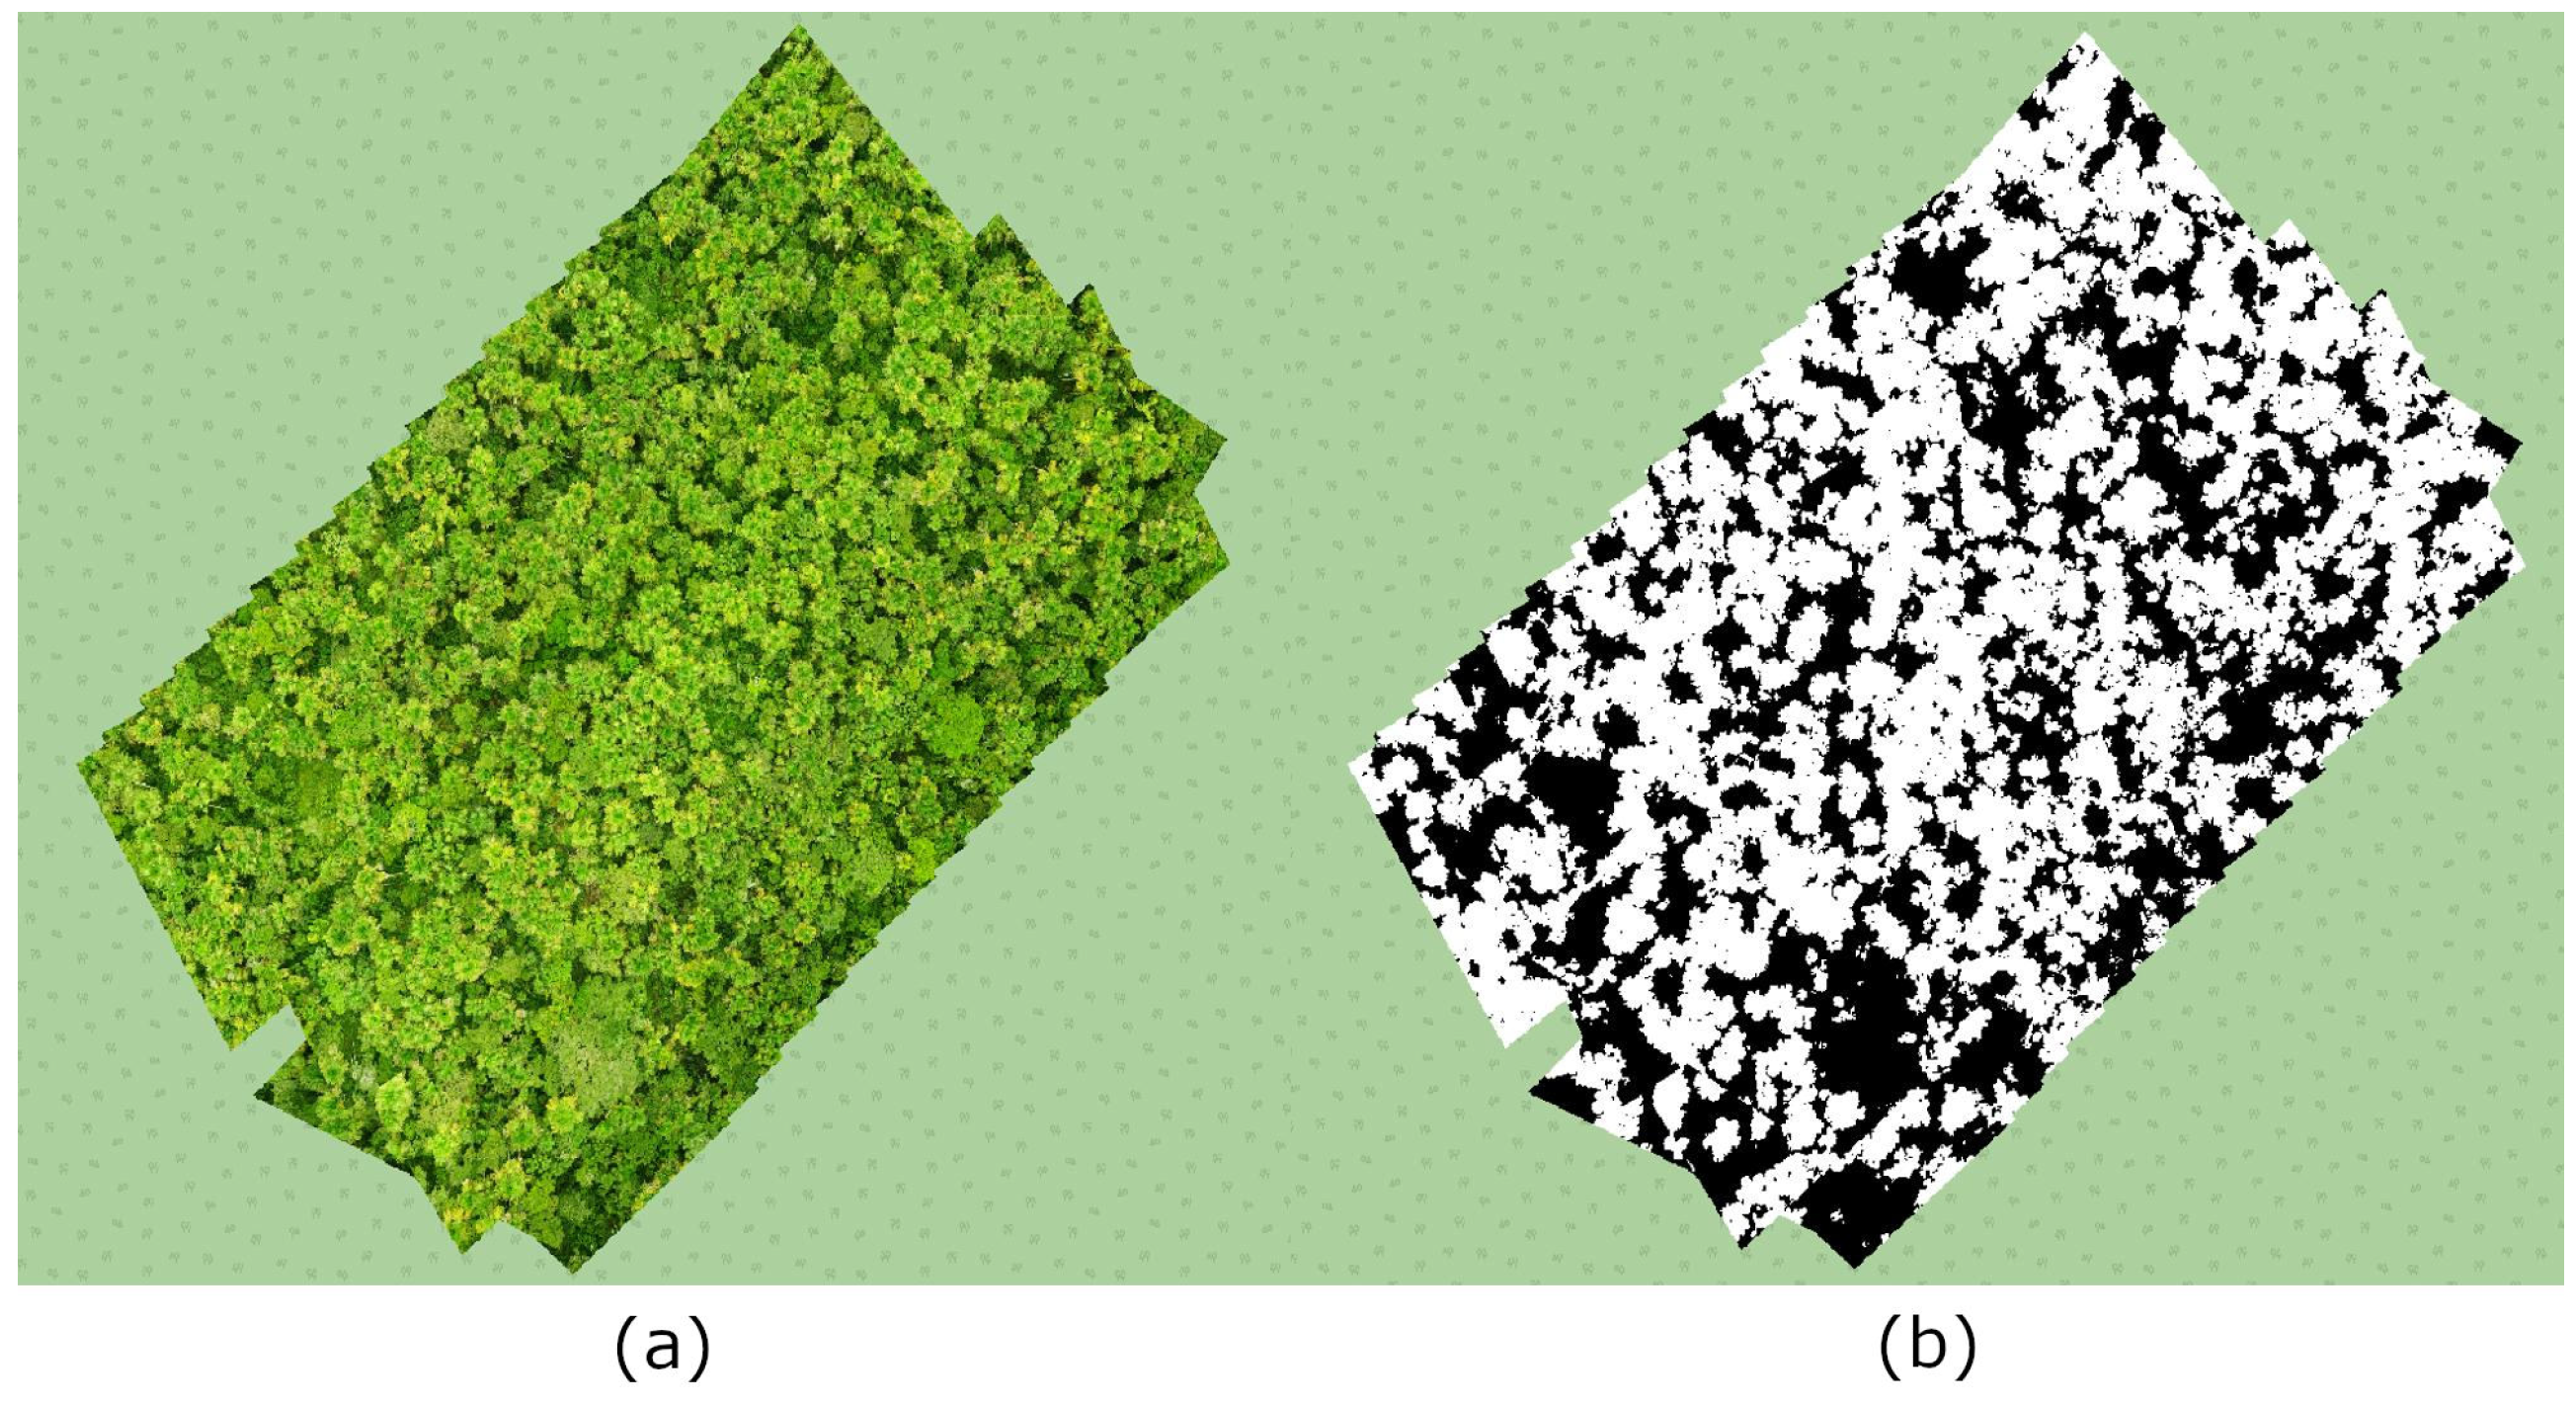
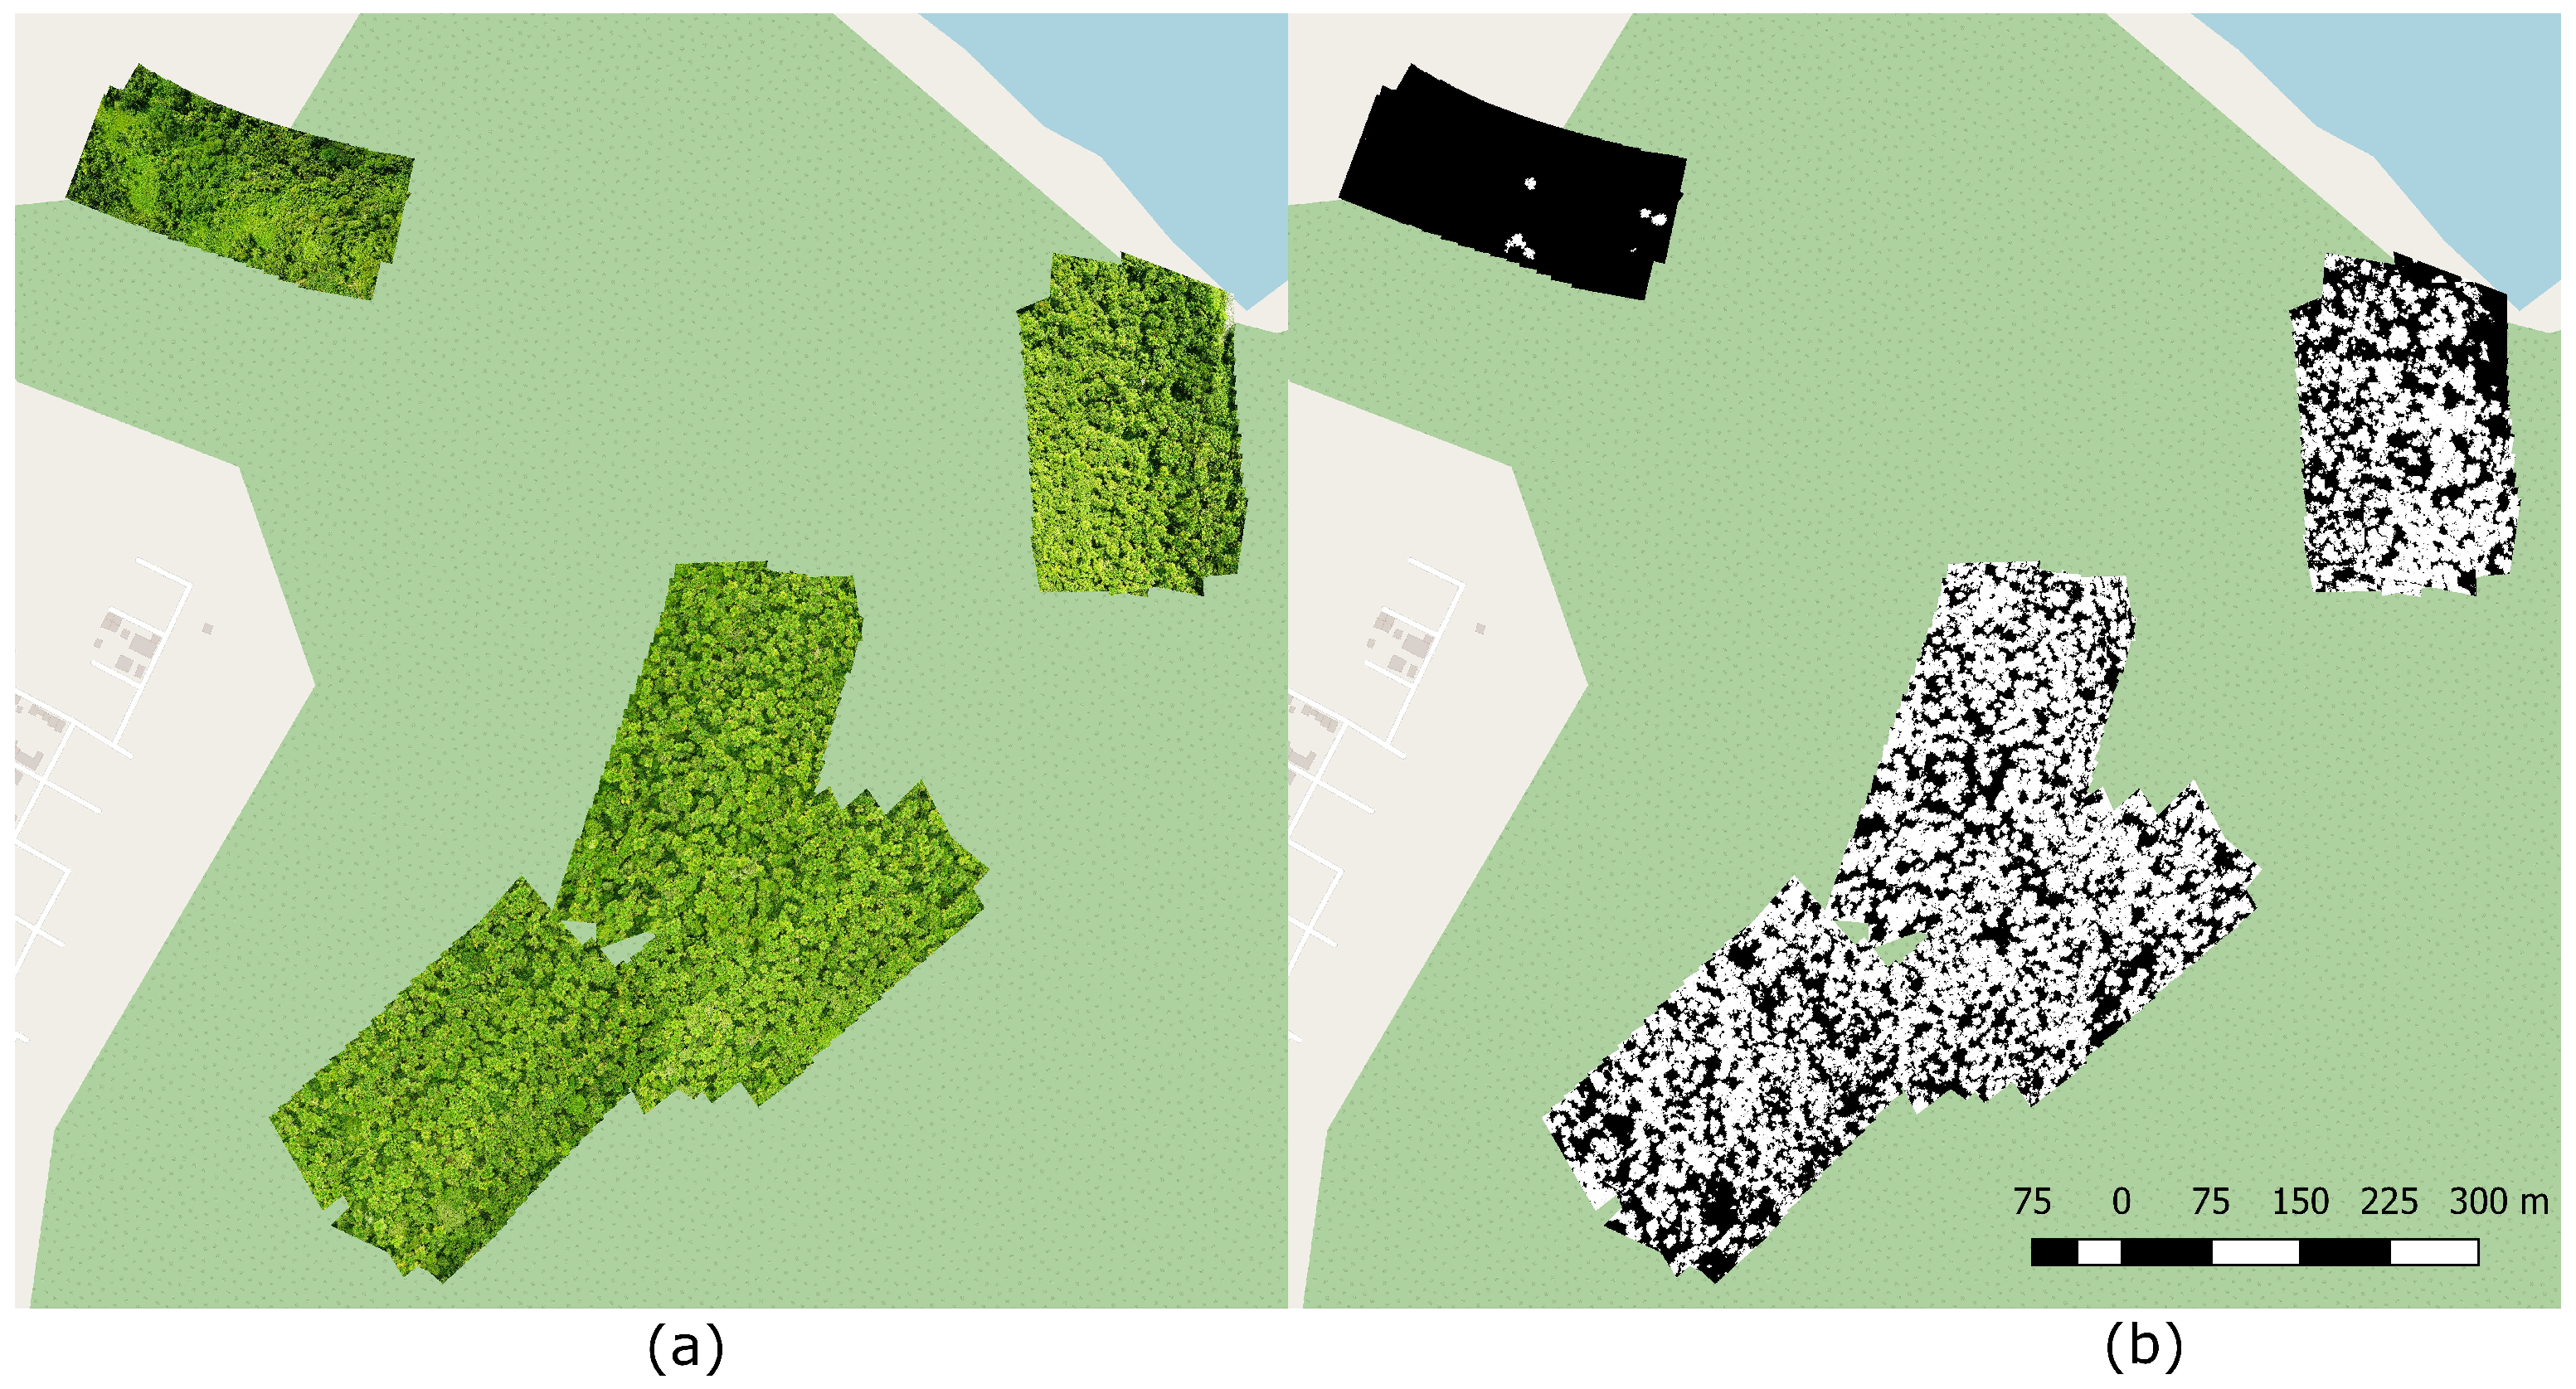
Hundreds of images can be taken in one single flight; using only one of them is not representative enough to analyze a big area, which is why it is necessary to create a georeferenced image mosaic using the GPS information of each image. The elaboration of a mosaic consists of reconstructing a scene in two dimensions from the combination of images acquired with a certain overlap. To carry out this operation, a series of geometric transformations between pairs of images must be estimated, so that when warping one image on another, they can be blended with the least possible error. For this, we use an algorithm that was specifically developed as part of this project to work on areas with abundant vegetation [35]. Figure 12 illustrates two types of mosaics: one made up of RGB images and the other of binary Mauritia flexuosa masks. Figure 13 shows five mosaics of areas with different concentration of Mauritia flexuosa palms. By doing this, we can analyze large areas and fly periodically to monitor this kind of natural resources.

4. Conclusions

In this paper, we have presented a new end-to-end trainable deep neural network to tackle the problem of Mauritia flexuosa palm trees segmentation in aerial images acquired by Unmanned Aerial Vehicles (UAVs).
The proposed model is based on Google’s Deeplab v3+ network and has achieved better performance than those of other Convolutional Neural Networks used for performance comparison. With an accuracy of 98.036%, the segmentation results prove to be quite similar to the hand-drawn ground truth masks. What is more, after learning the particular features of Mauritia flexuosa and its leaves (e.g. shape, texture, color, etc.), our model , our model is able to detect the presence of Mauritia flexuosa palms and segment them even when partially covered by taller trees. Further work will be focused on both segmenting and counting the approximate amount of Mauritia flexuosa palms in high-resolution aerial photographs.

Supplementary Materials

The dataset are available at http://didt.inictel-uni.edu.pe/dataset/MauFlex_Dataset.rar, dataset license: CC-BY-NC-SA 4.0.

Author Contributions

Conceptualization, G.M.; Methodology, G.M.; Software, G.M.; Investigation, G.M., G.S., D.A., and I.O.; UAV Data Acquisition, D.A., I.O., and G.M.; Writing—original draft preparation, G.M.; Writing—review and editing, G.M., G.K. and J.T.; Supervision, G.K.; Project administration, J.T.

Acknowledgments

This research was funded by Programa Nacional de Innovación para la Competitividad y Productividad (Innóvate Perú) grant number 393-PNICP-PIAP-2014. The authors acknowledge the Peruvian Amazon Research Institute (IIAP) for its support during the image acquisition process in the Amazon rainforest.

Conflicts of Interest

The authors declare no conflict of interest. The founding sponsors had no role in the design of the study; in the collection, analyses, or interpretation of data; in the writing of the manuscript, or in the decision to publish the results.

References

  1. Del Castillo, D.; Otárola, E.; Freitas, L. Aguaje: The Amazing Palm Tree of the Amazon; IIAP: Iquitos, Perú, 2006; ISBN 9972-667-34-0. [Google Scholar]
  2. Freitas, L.; Pinedo, M.; Linares, C.; Del Castillo, D. Descriptores Para el Aguaje (Mauritia flexuosa L.F.); IIAP: Iquitos, Perú, 2006; ISBN 978-9972-667-39-8. [Google Scholar]
  3. Levistre-Ruiz, J.; Ruiz-Murrieta, J. “El Aguajal”: El bosque de la vida en la Amazonía peruana. Cienc. Amaz. 2011, 1, 31–40. [Google Scholar] [CrossRef]
  4. Draper, F.C.; Roucoux, K.H.; Lawson, I.T.; Mitchard, E.T.; Honorio, E.N.; Lähteenoja, O.; Torres, L.; Valderrama, E.; Zaráte, R.; Baker, T.R. The distribution and amount of carbon in the largest peatland complex in Amazonia. Environ. Res. Lett. 2014, 9, 124017. [Google Scholar] [CrossRef] [Green Version]
  5. Malleux, R.; Dapozzo, B. Evaluación de los recursos forestales mundiales 2010—Informe Nacional Perú. Available online: http://www.fao.org/docrep/013/al598S/al598S.pdf (accessed on 22 October 2018).
  6. Mesa, L.; Galeano, G. Palms uses in the Colombian Amazon. Caldasia 2013, 35, 351–369. [Google Scholar]
  7. Virapongse, A.; Endress, B.A.; Gilmore, M.P.; Horn, C.; Romulo, C. Ecology, livelihoods, and management of the Mauritia flexuosa palm in South America. Glob. Ecol. Conserv. 2017, 10, 70–92. [Google Scholar] [CrossRef]
  8. Ticktin, T. The ecological implications of harvesting non-timber forest products. J. Appl. Ecol. 2004, 41, 11–21. [Google Scholar] [CrossRef] [Green Version]
  9. Puliti, S.; Talbot, B.; Astrup, R. Tree-Stump detection, segmentation, classification, and measurement using Unmanned Aerial Vehicle (UAV) imagery. Forests 2018, 9, 102. [Google Scholar] [CrossRef]
  10. Feduck, C.; McDermid, G.J.; Castilla, G. Detection of coniferous seedlings in UAV imagery. Forests 2018, 9, 432. [Google Scholar] [CrossRef]
  11. Balsi, M.; Esposito, S.; Fallavollita, P.; Nardinocchi, C. Single-tree detection in high-density LiDAR data from UAV-based survey. Eur. J. Remote Sens. 2018, 51, 679–692. [Google Scholar] [CrossRef]
  12. Wallace, L.; Lucieer, A.; Watson, C.S. Evaluating tree detection and segmentation routines on very high resolution UAV LiDAR data. IEEE Trans. Geosci. Remote Sens. 2014, 52, 7619–7628. [Google Scholar] [CrossRef]
  13. Nevalainen, O.; Honkavaara, E.; Tuominen, S.; Viljanen, N.; Hakala, T.; Yu, X.; Hyyppä, J.; Saari, H.; Pölönen, I.; Imai, N.N.; et al. Individual tree detection and classification with UAV-Based photogrammetric point clouds and hyperspectral imaging. Remote Sens. 2017, 9, 185. [Google Scholar] [CrossRef]
  14. Klein, A.M.; Dalla, A.P.; Péllico, S.; Strager, M.P.; Schoeninger, E.R. Treedetection: Automatic tree detection using UAV-based data. Floresta 2018, 48, 393–402. [Google Scholar] [CrossRef]
  15. Mohan, M.; Silva, C.A.; Klauberg, C.; Jat, P.; Catts, G.; Cardil, A.; Hudak, A.T.; Dia, M. Individual tree detection from unmanned aerial vehicle (UAV) derived canopy height model in an open canopy mixed conifer forest. Forests 2017, 8, 340. [Google Scholar] [CrossRef]
  16. Trichon, V. Crown typology and the identification of rain forest trees on large-scale aerial photographs. Plant Ecol. 2001, 153, 301–312. [Google Scholar] [CrossRef]
  17. Al Mansoori, S.; Kunhu, A.; Al Ahmad, H. Automatic palm trees detection from multispectral UAV data using normalized difference vegetation index and circular Hough transform. In Proceedings of the SPIE Remote Sensing Conference 10792, Berlin, Germany, 10–13 September 2018. [Google Scholar]
  18. Franklin, S.E.; Ahmed, O.S. Deciduous tree species classification using object-based analysis and machine learning with unmanned aerial vehicle multispectral data. Int. J. Remote Sens. 2018, 39, 5236–5245. [Google Scholar] [CrossRef]
  19. Mukashema, A.; Veldkamp, A.; Vrieling, A. Automated high resolution mapping of coffee in Rwanda using an expert Bayesian network. Int. J. Appl. Earth Obs. Geoinf. 2014, 33, 331–340. [Google Scholar] [CrossRef] [Green Version]
  20. Li, W.; Fu, H.; Yu, L.; Cracknell, A. Deep learning based oil palm tree detection and counting for high-resolution remote sensing images. Remote Sens. 2017, 9, 22. [Google Scholar] [CrossRef]
  21. Epperson, M. Empowering Conservation through Deep Convolutional Neural Networks and Unmanned Aerial Systems. Master’s Thesis, University of California, Oakland, CA, USA, 2018. [Google Scholar]
  22. Zakharova, M. Automated Coconut Tree Detection in Aerial Imagery Using Deep Learning. Master’s Thesis, The Katholieke Universiteit Leuven, Löwen, Belgium, 2017. [Google Scholar]
  23. Onishi, M.; Ise, T. Automatic classification of trees using a UAV onboard camera and deep learning. arXiv, 2018; arXiv:1804.10390. [Google Scholar]
  24. Chen, L.-C.; Zhu, Y.; Papandreou, G.; Schroff, F.; Adam, H. Encoder-Decoder with Atrous Separable Convolution for Semantic Image Segmentation. In Proceedings of the European Conference on Computer Vision (ECCV 2018), Munich, Germany, 8–14 September 2018. [Google Scholar]
  25. Ministry of Health of Peru, 2009. Tablas Peruanas de Composición de Alimentos. Available online: http://www.ins.gob.pe/insvirtual/images/otrpubs/pdf/Tabla%20de%20Alimentos.pdf (accessed on 22 October 2018).
  26. Wang, J.; Perez, L. The Effectiveness of Data Augmentation in Image Classification using Deep Learning. arXiv, 2018; arXiv:1712.04621. [Google Scholar]
  27. National Institute of Research and Training in Telecommunications (INICTEL-UNI), 2018. MauFlex Dataset. Available online: http://didt.inictel-uni.edu.pe/dataset/MauFlex_Dataset.rar (accessed on 22 October 2018).
  28. He, K.; Zhang, X.; Ren, S.; Sun, J. Deep residual learning for image recognition. In Proceeding of the IEEE Conference on Computer Vision and Pattern Recognition (CVPR), Las Vegas, NV, USA, 27–30 June 2016; pp. 770–778. [Google Scholar]
  29. Sandler, M.; Howard, A.; Zhu, M.; Zhmoginov, A.; Chen, L.-C. MobileNetV2: Inverted Residuals and Linear Bottlenecks. arXiv, 2018; arXiv:1801.04381. [Google Scholar]
  30. Yu, F.; Koltun, V. Multi-scale context aggregation by dilated convolutions. In Proceedings of the International Conference on Learning Representations (ICLR 2016), San Juan, PR, USA, 2–4 May 2016. [Google Scholar]
  31. Chen, L.-C.; Papandreou, G.; Kokkinos, I.; Murphy, K.; Yuille, A.L. DeepLab: Semantic Image Segmentation with Deep Convolutional Nets, Atrous Convolution, and Fully Connected CRFs. IEEE Trans. Pattern Anal. Mach. Intell. 2018, 40, 834–848. [Google Scholar] [CrossRef] [PubMed] [Green Version]
  32. Kingma, D.; Ba, J. Adam: A method for stochastic optimization. In Proceedings of the International Conference on Learning Representations (ICLR 2015), San Diego, CA, USA, 7–9 May 2015. [Google Scholar]
  33. Ronneberger, O.; Fischer, P.; Brox, T. U-net: Convolutional networks for biomedical image segmentation. In Proceedings of the Medical Image Computing and Computer-Assisted Intervention (MICCAI 2015), Munich, Germany, 5–9 October 2015; Volume 9351, pp. 234–241. [Google Scholar]
  34. Zhang, Z.; Liu, Q.; Wang, Y. Road Extraction by Deep Residual UNet. IEEE Geosci. Remote Sens. Lett. 2018, 15, 749–753. [Google Scholar] [CrossRef]
  35. Arteaga, D. Desarrollo de un Aplicativo de Software Basado en Algoritmos de Procesamiento Digital de Imágenes y Visión Computacional, Orientado a la Construcción y Georreferenciación de Mosaicos de Imágenes Aéreas Adquiridas vía UAV. Bachelor’s Thesis, Universidad Nacional de Ingeniería, Rímac, Peru, 2018. [Google Scholar]
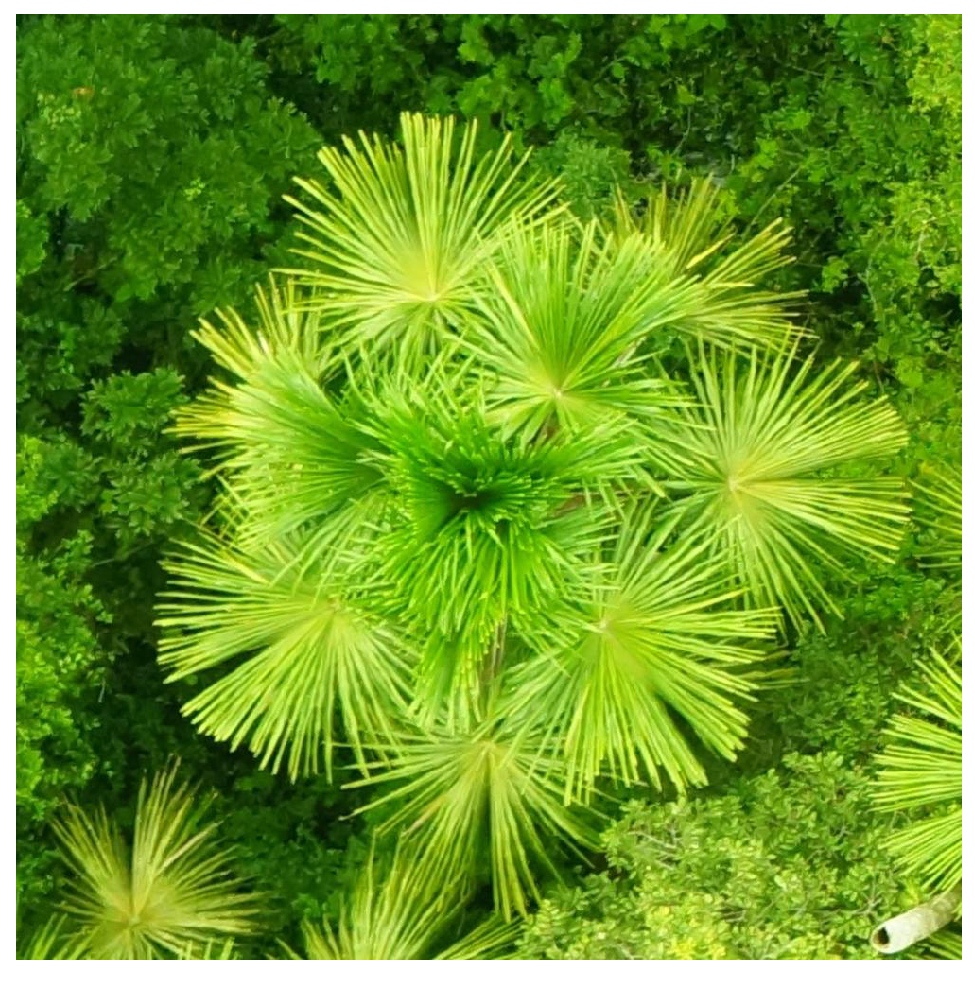
Figure 1. Aerial view of a Mauritia flexuosa palm.
Forests 09 00736 g001
Figure 2. Study area in Iquitos City, Maynas Province, north of Peru.
Forests 09 00736 g002
Figure 3. Aerial images acquired by different UAVs. (a) Cloud-free region captured with a Sony Nex-7. (b) Shadowed region captured with a Sony Nex-7. (c) Aerial image acquired in the afternoon with a Sony Nex-7. (d) Aerial image captured by the Skyranger UAV with vignetting. (e) and (f) Aerial images captured by the Mavic Pro UAV.
Forests 09 00736 g003
Figure 4. Samples of original images and shadow masks from the MauFlex dataset.
Forests 09 00736 g004
Figure 5. Inverted residual unit (IRU) used in our proposed network. It uses regular 1 × 1 convolutions (“Conv”), 3 × 3 depthwise convolutions, batch normalization (“BN”) and Rectified Linear Unit activation with a maximum possible value of 6 (“ReLU6”).
Forests 09 00736 g005
Figure 6. Atrous convolution kernel (green) dilated with different rates.
Forests 09 00736 g006
Figure 7. The proposed network architecture. It uses regular convolutions (“CONV”), inverted residual units (“IRU”) and atrous separable convolutions (“ASC”).
Forests 09 00736 g007
Figure 8. Metrics evolution over training time of our proposed network. (a) Epochs vs. Accuracy. (b) Epochs vs. Loss.
Forests 09 00736 g008
Figure 9. Comparison of metrics evolution over training time of all networks. (a) Epochs vs. Accuracy. (b) Epochs vs. Loss.
Forests 09 00736 g009
Figure 10. Mauritia flexuosa segmentation results.
Forests 09 00736 g010
Figure 11. Mauritia flexuosa segmentation result for a whole image. (a) Original image. (b) Mauritia flexuosa probability map. (c) Mauritia flexuosa binary mask.
Forests 09 00736 g011
Figure 12. Aerial image mosaic composed of 168 photographs. (a) Mosaic of RGB images. (b) Mosaic of Mauritia flexuosa masks.
Forests 09 00736 g012
Figure 13. Aerial image mosaics acquired near Lake Quistococha. (a) Mosaics of RGB images. (b) Mosaics of Mauritia flexuosa masks.
Forests 09 00736 g013
Table 1. Unmanned aerial vehicles (UAVs) and cameras specifications.
UAV Specifications
DescriptionQuadcopterQuadcopterQuadcopter
BrandAeryonDJITurboAce
ModelSkyRanger sUASMavic ProMatrix-E
Vehicle Dimensions 1020 × 1020 × 240 mm 485 × 430 × 83 mm 1160 × 840 × 250 mm
Vehicle Weight (kg)2.40.7344
Camera Specifications
Camera ModelAeryon MT9F002DJI FC220Sony Nex-7
Image Size (megapixels)14 MP12 MP24 MP
Ground Sampling Distance1.4 cm/pixel2.5 cm/pixel1.4 cm/pixel
Flight Altitude80 m70 m100 m
Image Dimensions (pixels) 4608 × 3288 4000 × 3000 4000 × 6000
Bit Depth242424
Table 2. Metrics Comparison of Different Shadow Detection Methods.
MetricACC (%)PREC (%)SN (%)SP (%)Parameters
Method
U-NET195.97391.38192.63297.0873,736,321
U-NET297.68294.85895.95398.2613,910,641
U-NET396.84392.53494.88697.486503,100
U-NET497.51295.16695.02898.358542,460
Proposed network98.03696.68895.61698.871507,729