Abstract
In Boreal North America, management approaches inspired by the variability in natural disturbances are expected to produce more resilient forests. Wind storms are recurrent within Boreal Ontario. The objective of this study was to simulate wind damage for common Boreal forest types for regular as well as extreme wind speeds. The ForestGALES_BC windthrow prediction model was used for these simulations. Input tree-level data were derived from permanent sample plot (PSP) data provided by the Ontario Ministry of Natural Resources. PSPs were assigned to one of nine stand types: Balsam fir-, Jack pine-, Black spruce-, and hardwood-dominated stands, and, Jack pine-, spruce-, conifer-, hardwood-, and Red and White pine-mixed species stands. Morphological and biomechanical parameters for the major tree species were obtained from the literature. At 5 m/s, predicted windthrow ranged from 0 to 20%, with damage increasing to 2 to 90% for winds of 20 m/s and to 10 to 100% for winds of 40 m/s. Windthrow varied by forest stand type, with lower vulnerability within hardwoods. This is the first study to provide such broad simulations of windthrow vulnerability data for Boreal North America, and we believe this will benefit policy decisions regarding risk management and forest planning.
1. Introduction
Concepts like natural disturbance typing [1], the range of natural variability [2], and disturbance process domains [3] help researchers and managers consider and compare natural and human-induced disturbance regimes across landscapes. This is pertinent because across North America, forest management approaches inspired by natural disturbance dynamics are expected to lead to a more resilient landscape [4,5]. Implementing such an approach requires an understanding of disturbance processes and regimes at the tree, stand, and landscape scales [6,7]. Wind storms are a major disturbance process in North American forests [8].
Wind storm events in Boreal North America are driven by two major processes. First, extra-tropical cyclones produce moderate to high speed winds, over wide areas, primarily during the fall, winter, and early spring. These low pressure systems intensify over the Pacific and Atlantic oceans during winter months, and are driven by gradients in temperature between the tropical and polar oceans and resultant wind speeds can reach 30 m/s [9,10]. Inland Boreal regions with more continental climates experience intense thunderstorms in the late spring, summer, and early fall. These convective storms develop as a result of high surface heating and vertical temperature and pressure differentials. The resulting localized wind speeds are sometimes in excess of 40 m/s [11,12]. While wind speed is the main determinant of the severity of wind damage [13], other factors such as soil [14], stand demography [15,16], and management [17] could modify the impact.
Because wind storms are largely random, empirical studies are often only initiated after a windthrow event occurs. There are also approaches where hybrid-mechanistic windthrow prediction models have been developed for forest regions within windy climates [18,19]. Some of these models predict landscape-level susceptibility to windthrow [17], while others [18,19] simulate windthrow at the tree level. By simulating windthrow at the tree level, one is able to incorporate tree-specific traits and spatial arrangements [18], in addition to producing higher resolution characterization of post-storm stand conditions [19]. This is especially recommendable for regions with limited documentation of windthrow—as is the case for many inland Boreal regions in North America. However, by simulating at the tree scale, it becomes challenging to simulate a large number of stands across a broad and heterogeneous landscape. To circumvent this, one way would be to simulate a limited number of stand conditions and then develop relationships that could be applied at the landscape scale, thus, incorporating the local tree-level attributes.
In this study, ForestGALES_BC [19], a tree-level windthrow model was applied to study windthrow dynamics across a broad forest landscape in Boreal Ontario, a region that experiences recurrent thunderstorms. The goal of this work was to simulate windthrow for forest stands that are typical of Boreal Ontario. The key questions were (a) how does windthrow vulnerability vary across typical inland Boreal stand types, including hardwood, conifer, and mixed-species stands, and under regular as well as extreme wind speed scenarios [20] and; (b) how does this change with increasing stand development.
2. Methodology
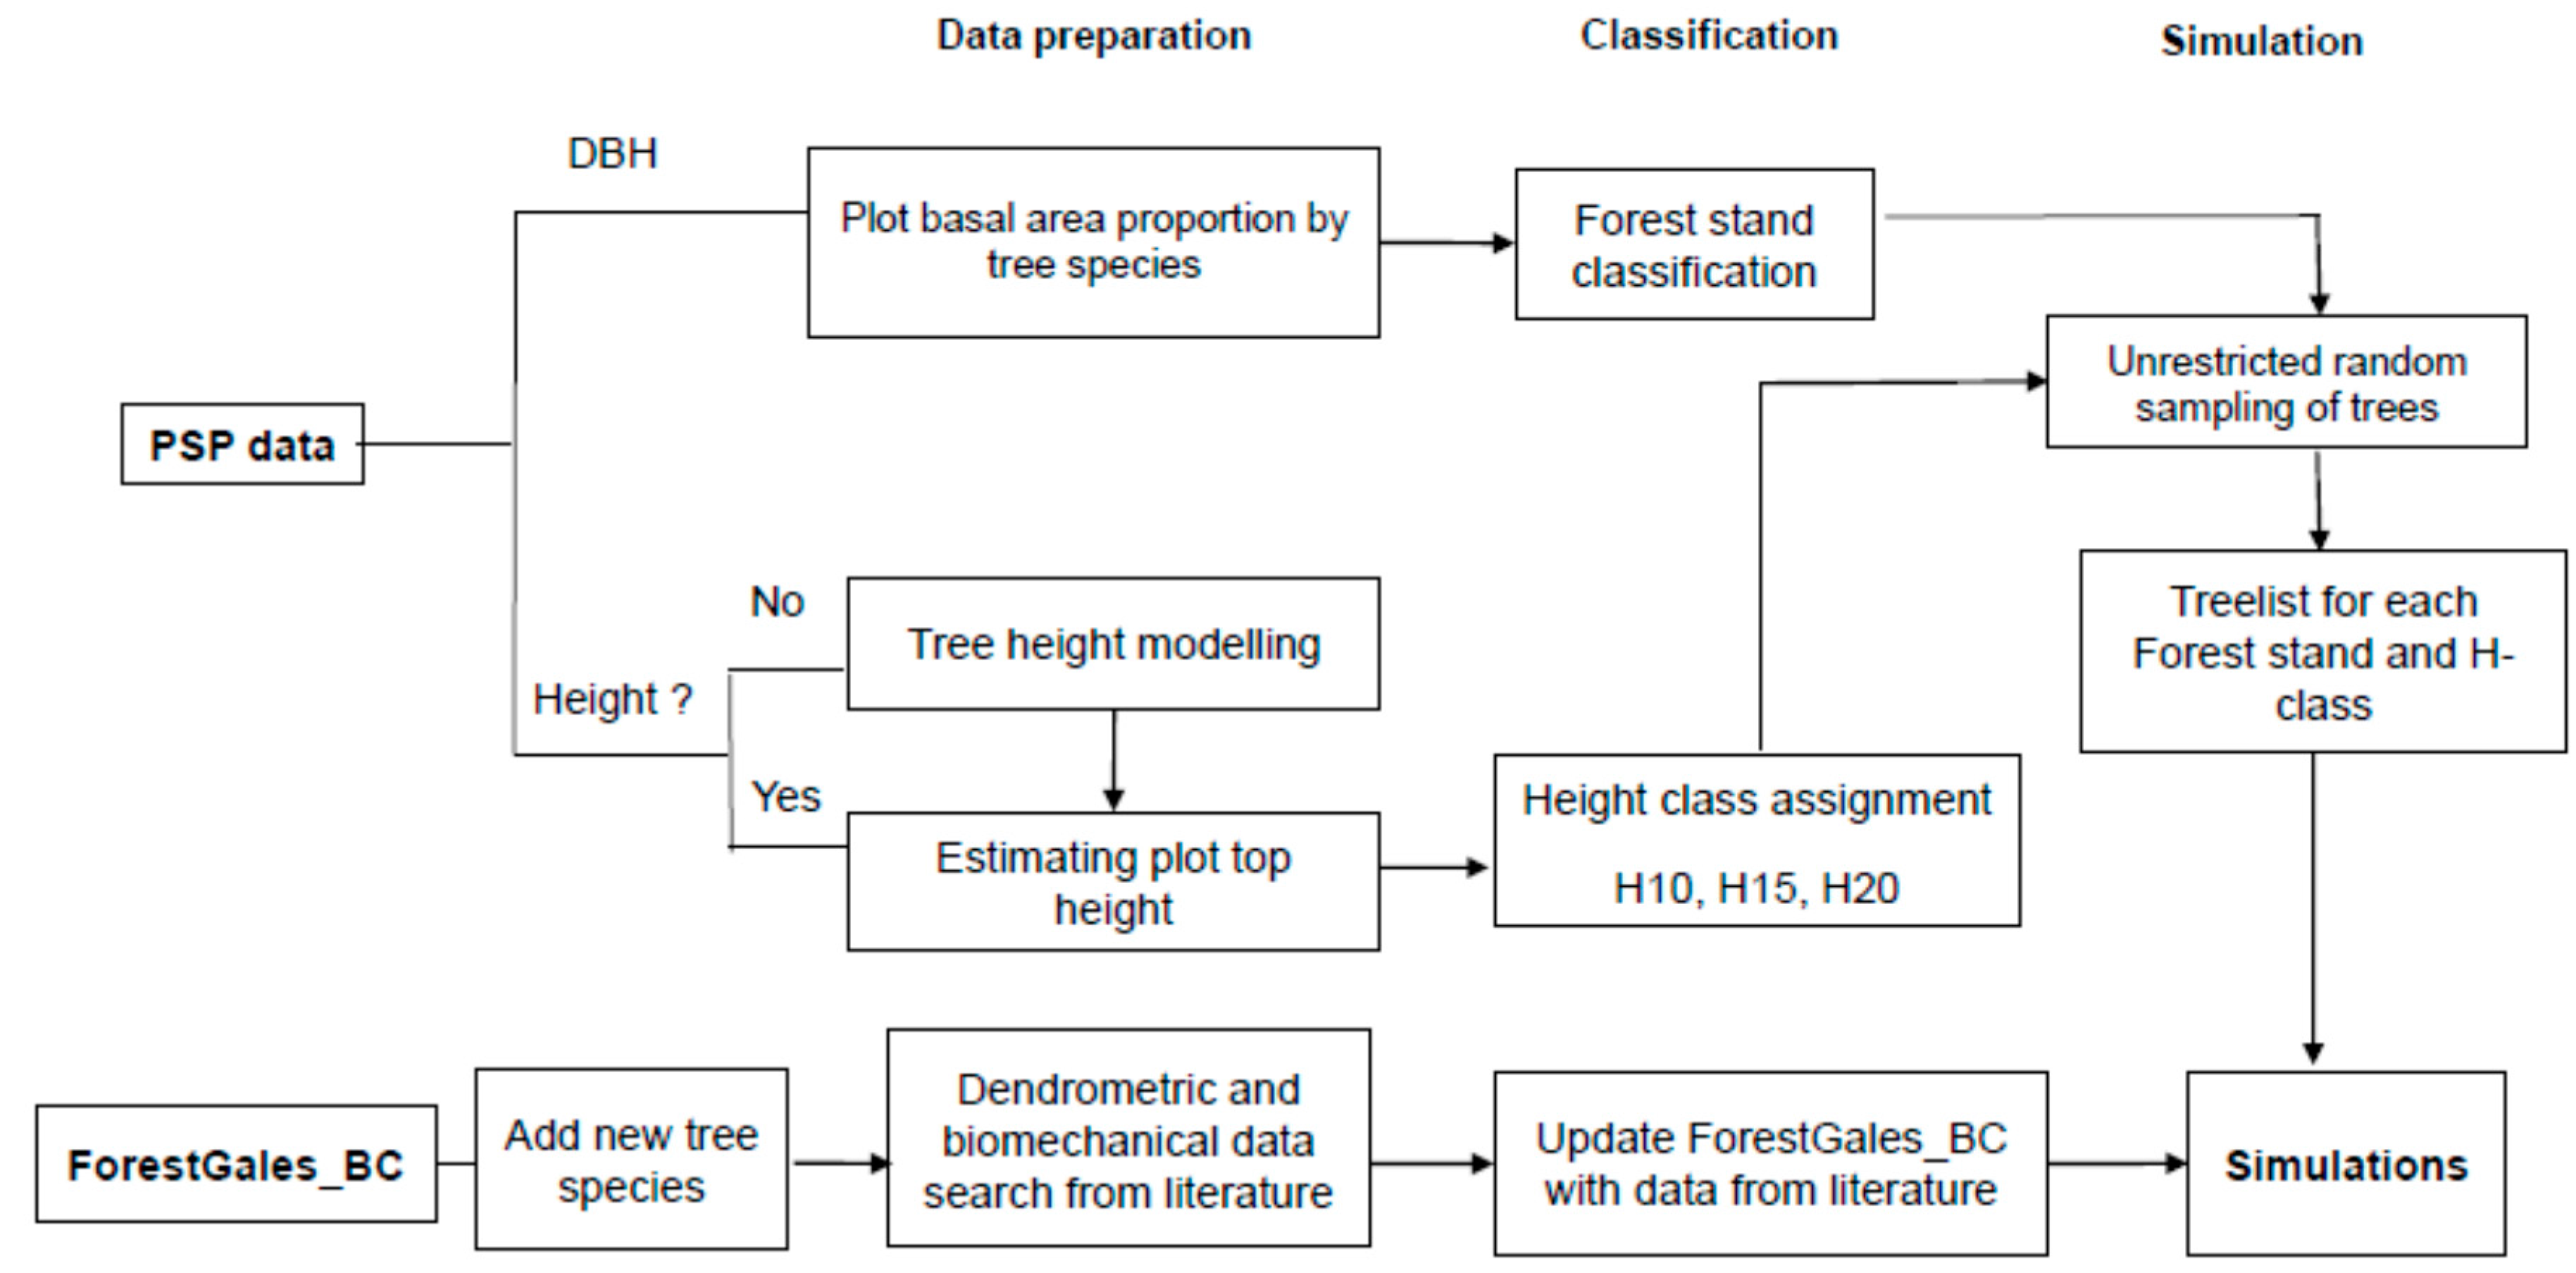
2.1. Overview of Modelling and Simulation Steps
We commenced by acquiring tree-level data for forest types in the study region from a permanent sample plot (PSP) network. Basal area proportion by tree species was calculated and used to sort plots into forest stand types. Tree height modelling was carried out for trees with diameter at breast height (DBH) but missing height data. Based on the average tree height, plots were then assigned to height classes. Each forest stand type and height class is considered a simulation unit (space) to be run independently. A simulation space with several spatially-explicit set of individual trees belonging to a forest stand type and height class is hereafter called a ‘treelist’. Treelists representative of each forest stand type and height class were loaded into the ForestGALES_BC model for simulation. For simulations to run smoothly, we needed to update ForestGALES_BC to include dendrometric and biomechanical equations for local species. Literature was reviewed for this purpose, and 17 published studies (Table S1) were retained which had the relevant data. With the treelists and the updated ForestGALES_BC, simulations were run for a series of increasing above-canopy wind speeds. Figure 1 illustrates the phases of this work.
Figure 1.
A schematic framework of the study methodological stages. H10, H15, H20 corresponds to height classes 10 m, 15 m, 20 m, respectively. PSP, permanent sample plot; DBH, diameter at breast height.
2.2. Data Acquisition
Tree and plot data for the study area was provided by the Ontario Ministry of Natural Resources (OMNR) from a PSP network [21] covering the Boreal forest region of western Ontario. These PSPs had been repeatedly measured between 1992 and 2005. For a given plot, only the most recent measurements were considered, yielding a database of 734 plots of 400 m2 and composed of 13 tree species (Figure 2). A total of 731 plots were retained for further modelling work, as they represent the most common forest stand types of the study region.
Figure 2.
Study area map showing the distribution of the studied plots.
2.3. Data Preparation
In order to allow windthrow simulations for the range of stand compositions that occur within the study region, basal area proportion was computed by species for each plot, with the resulting information used in identifying plots by stand type in the next phase.
Windthrow vulnerability typically increases with increasing stand height [19], and stand height is a surrogate of stand development and succession [22] and an important variable in growth and yield modelling. Also for predictive purposes, it is important to quantify the role of tree size (i.e., height and DBH) on windthrow [23]. Accordingly, each plot was assigned to one of three height classes. Across all species, there were trees in the database with DBH measurements but without height variable (Table S1), necessitating the development of predictive height models. In predicting tree heights, the modifier approach from [24] was followed, where the global average height () across stand type and height classes is modified by DBH () and tree species ().
where has a quadratic structure of the form:
and refer to the linear and quadratic correlates of DBH to the height variable. refers to the tree-level DBH, is the global average DBH across stand type and height class.
has a linear additive structure where the model variables are essentially binary:
are binary variables corresponding to Balsam fir (Abies balsamea), Black spruce (Picea mariana), White spruce (Picea glauca), Norway spruce (Picea abies), White cedar (Thuja occidentalis), Jack pine (Pinus banskiana), White pine (Pinus strobus), Red pine (Pinus resinosa), larch (Larix laricina), White birch (Betula papyrifera), trembling aspen (Populus tremuloides), large tooth aspen (Populus grandidentata), balsam poplar (Populus balsamifera), and Red maple (Acer rubrum), respectively.
are coefficients accounting for the differences in H = f(DBH) relationships by species, in the same order as above.
2.4. Data Classification
2.4.1. Stand Type Grouping
Stand categorizations conform to the ‘Forest Units’ used in Ontario forest management planning [23] and were based on the computed percent basal area contributed by each tree species to the total plot basal area (Table 1).
Table 1.
Definition of stand types.
2.4.2. Stand Height Classification
The average height of dominant trees within a plot corresponding to 100 top height trees/ha was calculated; for 400 m2 plots, this means the average of four top height trees. Because we wanted to assign plots (not individual trees) to height classes, we used this plot-level metric, i.e., average of top height trees. Plots with top height < 13 m were placed in the ‘10 m’ height class (H10). Plots with top height from 13 m to 18 m were placed in the ’15 m’ height class (H15), while stands with top height > 18 m were categorized as height class ‘20 m’ (H20). The count of plots by stand type and height class can be found in Table 2.
Table 2.
Plot distribution by stand type and height class.
2.5. Simulation and Analysis
2.5.1. Model Framework
ForestGALES_BC was used for this modelling exercise [13,19]. This model includes five major components (i) an input dataset (treelist) and configuration; (ii) objects that calculate species-level dendrometrics (stem taper and tree characteristics objects); (iii) objects that model wind loading; (iv) a component that estimates tree resistance; and, (v) an output component (Flag tree object) where decisions are made as to whether a tree fails or stands. These objects are described in detail in Anyomi et al. [13].
First, dendrometric and drag data were added for tree species in the Ontario study area. Where there were no published critical turning moment or drag equations for a particular species, equations for surrogate species were used (Table S1). Surrogate species were selected in order of preference, first using data from the same species in the Boreal, or from elsewhere, then similar genus if available, and, if unavailable, a species whose properties would be comparable.
2.5.2. Simulation Space
To evaluate outcomes, a simulation space made up of five hundred 20 m × 20 m cells was created for each stand type and height class combination. Using 20 m × 20 m cells matches the 400 m2 plot size of the OMNR sample plots. With 500 cells in the simulation space, wind fetch and damage propagation effects can be evaluated. Given that there are far fewer than 500 PSPs for each stand type and height class combination, we created additional plots for each combination in order to populate the simulation space. Starting with the treelist of all trees in the OMNR PSPs for a given stand type and height class, we applied unrestricted random sampling using the PROC SURVEYSELECT procedure (SAS v9.4, SAS Institute, Cary, NC, USA) to obtain a sufficient number of trees to populate additional individual cells, and then assembled these cells to make up a simulation space. The range of stand density of the underlying PSP plots in each of the stand types and height classes was the guiding rule, thus, only cells whose stems per hectare were within the range observed in the PSP plots were retained. These new cells were then randomly assigned to locations within the simulation space along with the original PSP plots. Figure S2 shows example simulation spaces for selected stand type and height class scenarios.
2.5.3. Estimating Resistive and Applied Moments
Dendrometric equations were used to convert DBH and height to stem shape, volume and mass, and tree crown breadth (width), depth (length), and mass for each tree in the treelist. These tree attributes were then used to estimate loading and resistance. Parameters for these dendrometric equations, along with modulus of rupture, stem density, drag, and critical turning moment equations were obtained from the literature (Table S1). For a given tree in the simulation space, when the applied moment due to the force of the wind is higher than the resistive moment of the tree to breakage or uprooting, the tree fails. Failed trees are marked as such in the treelist and are dropped from subsequent calculations of stand canopy density and within-canopy wind speed profiles. The model runs iteratively until such time when at the specified above-canopy wind speed, the resistive moment is higher than the applied moment for all surviving trees, or when the specified maximum number of iterations is reached.
2.5.4. Synthesizing Damage Outcomes
The wind damage level for a given cell within the simulation space was computed as the percentage of cell initial basal area that was uprooted or broken. Windthrow percentage was averaged for all cells within the simulation space to yield overall percent windthrow for a simulation run. Simulations for each stand type and height class were run for above-canopy wind speeds from 5 to 40 m/s in increments of 5 m/s. Smoothened curves were obtained from the raw simulated values and the smoothened data was then used in further analysis. Smoothing removes some of the variability introduced by using different groups of PSPs to create the input treelists for different height classes of the same stand type. Logistic equations were fit to produce families of curves. Examining the parameter values of the single global equation also facilitates comparison of species and height effects on vulnerability. When subsequently used in landscape-level simulations of wind disturbance patterns, these equations allow for interpolation of windthrow outcomes for stand heights and above-canopy wind speeds between those tested in our simulations:
where refers to the basal area proportion windthrown per plot, is the above-canopy wind speed in m/s, and are the asymptote and rate parameters respectively. adjusts the curve along the wind speed axis as a function of the stand height class. This model form was selected due to its sigmoid shape, providing a suitable fit for the shape of the windthrow vs. wind speed results. The fit statistics including the Akaike Information Criterion (AIC), the Root Mean Square Error (RMSE), and adjusted R-square were examined for goodness-of-fit. The logistic model predictions are hereafter called ‘predicted estimates’, while the ForestGALES_BC model simulations are called the ‘simulated estimates’.
2.5.5. Evaluating Damage Outcomes
The ForestGALES_BC model was validated [19] and a similar adaptation in Quebec provided reasonable results [13]. For a complete validation of model simulations, windthrow data for different storms of known intensity and for a range of stand types would be required. In this study, we reviewed literature for published windthrow data from natural forests at known wind speeds. Model bias was computed as the difference between the expected or average prediction of our model and the observed or the average reported in literature.
3. Results
3.1. Windthrow Damage Outcomes
The level of windthrow varies with stand type, height class, and above-canopy wind speed. Curves are sigmoidal, with substantial increases in windthrow for above-canopy wind speeds over 15 m/s, reaching maximum levels of damage for winds over 25 m/s particularly for the tallest stands (Figure 3). In most cases, complete canopy failure occurs at wind speeds of 40 m/s.
Figure 3.
(a) Windthrow response to above-canopy wind speed across height classes. H10, H15, H20 correspond to 10 m, 15 m, and 20 m height classes, respectively. (b) Change in percent windthrow with increasing above-canopy wind speed across all stand types.
Percent windthrow varies by stand type (Figure 4 and Figure 5, Table S4). Across a range of stand height classes, mixed stands of Red and White pine (Figure 4e) were more vulnerable to winds than other stand types. For the H10 height class and below 20 m/s, Balsam fir dominated stands (Bfir) were the most easily windthrown of all stand type and height class combinations. Hardwood dominated stands (Figure 4f) and mixed conifer-hardwood stands appear to be most resistant to windthrow across the range of wind speeds studied (Figure 4h). Among the taller stands (height class 20 m), Jack pine mixed stands (Figure 4c) and hardwood-mixed stands (Figure 4g) are the most resistant to windthrow.
Figure 4.
Proportion of plot total basal area windthrown at specific above-canopy wind speeds for the forest types: (a) spruce dominant; (b) spruce mixed stands; (c) Jack pine dominant; (d) Jack pine mixed; (e) Red and White pine mixed stands; (f) hardwood dominant stand type; (g) hardwood-mixed species stands; (h) Conifer mixed species stands, and by height class groups: 10 m, 15 m, and 20 m.
Figure 5.
Scatter graph showing the fit between the simulated and predicted percent windthrow estimates.
3.2. Generalizing Windthrow Simulations
Our analysis shows that wind speed explains most of the variability in the windthrow levels (Table 3). The logistic modelling to obtain a global model produces reasonable fits (Adjusted R-square = 0.75, RMSE = 0.10, AIC = −310.5; Figure 5).
Table 3.
Variability in windthrow explained by wind speed, stand height class, and stand type.
Examining the parameters of the equations provides additional insights into stand type vulnerabilities. Based on the rate of change of windthrow with above-canopy wind speed, there appears to be two stand type clusters. The first cluster (β parameter) includes Balsam fir dominated stands, hardwood dominated stands, and hardwood-mixed species stands. A second cluster (α parameter) is made up of conifer mixed species stands, Jack pine dominated stands, Jack pine mixed species stands, Red and White pine mixed stands, Black spruce dominated stands, and spruce mixed stands. Hardwood dominant stand type and hardwood-mixed species stands have the lowest asymptote, while Jack pine mixed species stands, Red and White pine mixed species stands, and Black spruce dominated stands had the highest asymptote, albeit with similar values. The asymptote relates directly to the level of windthrow—the higher the asymptote the higher the overall level of windthrow for a given wind speed (Table 4, Table S4).
Table 4.
Smoothed windthrow vs. windspeed model parameter estimates.
3.3. Evaluating Model Simulation Outcomes
Table 5 presents data on windthrow damage levels observed following storm events, and the corresponding simulated windthrow, showing that, overall, the model did better within the coniferous (Bias = +10%) stands relative to the hardwoods (+27%).
Table 5.
Windthrow damage levels reported in literature by species.
4. Discussion
This is the first attempt at developing hybrid-empirical-mechanistic models for a region with a widely varying range of forest types and height classes, including conifer and hardwood species, and examining stand vulnerability across a wide range of wind speeds. A major challenge to windthrow model validation is that, often when there is field windthrow data, damage comes from a suite of storms of different intensities, and wind speed is rarely recorded. Also, topography and cutblock configuration could induce major variations in local wind speed, thus, the data from literature represent approximations of likely damage levels for the stand types and wind speed. The simulated windthrow compares well with published results for post-storm studies where wind speeds have been documented or estimated. Our results show three things: (a) the above-canopy wind speed is the primary determinant of the level of windthrow for any stand type; (b) the average stand height (stand development) is directly correlated with windthrow; and (c) that species composition affects the vulnerability to windthrow. These are consistent with earlier work that reported that 60% of the variability in windthrow damage is due to the wind speed, with species type and tree height explaining 9% and 6%, respectively, of the total variability [23]. Our simulations for Canadian Boreal forest types indicate that, on average, 30% of the forest canopy would be lost at above-canopy wind speeds of 72 km/h (20 m/s), similar to selection cut removals in the regions [13,24].
Our simulations suggested that hardwood dominated stand types and mixed conifer-hardwood stands are more resistant to windthrow for a given wind speed, supporting observations from North American forest systems [32]. Models have predicted hardwood expansion driven by climate change [33] and, given the lower susceptibility of hardwoods to wind storms, there could be a positive feedback into the disturbance regime such that windthrow damage would decline within hardwoods [34].
Stand types which experience high windthrow damage at relatively low wind speeds—in our case, Red and White pine mixed species stands and Balsam fir stands—are more likely to experience stand-replacing events. If these stands regenerate to the original species, in similar proportions, then cycles of recurrent damage and replacement are expected [35]. The duration of each cycle will depend upon species growth rates and site productivity. Stand types that experience partial damage (in our study, the mixed conifer-hardwood stands), even at high wind speeds are more likely to persist as multi-aged and mixed species stands, promoting structural diversity [36].
In Boreal North America, forest carbon stocks are simulated for both aboveground and belowground processes [37], as required under the Kyoto Protocol. However, owing to the non-availability of data on windthrow, windthrow related changes in carbon dynamics has yet to be incorporated into terrestrial ecosystem carbon budgeting for Boreal North America. In a similar work done in Europe, Fortin et al. [38] reported an 8% overestimation of ecosystem carbon as a result of not accounting for windstorm impacts on managed European beech stands. We believe our windthrow tables provide a starting point for integrating windthrow into ecosystem carbon simulation.
Our results represent stand-level simulations that could be incorporated into landscape-level simulators in studying forest landscape dynamics [39,40]. Wind-driven disturbances could be simulated concurrently and interactively with other landscape-scale disturbances such as wildfire. For example, our windthrow simulations can be integrated with the OMNR’s BFOLDS (Boreal Forest Landscape Dynamics Simulator) fire disturbance and succession model [41]. Tree height as a class variable would impact the results of this integration, however, the fitted smoothed curves could be used for interpolating damage between height classes.
There are a number of ways of improving on our work. There is no winching or drag data for some local species and the relationship between their actual properties and those of the surrogate species we used is unknown. However, using winching data from other regions is standard within the global set of hybrid-mechanistic windthrow prediction models [42], and where these models have been validated, has been shown to be reasonable [43]. We also believe the use of surrogate species is reasonable since often species from the same genus show similar relationships [15,43,44,45,46,47,48,49,50,51,52,53] between stem mass and critical turning moment. However, as local data on windthrow outcomes become available, in particular data from thunderstorms (summer wind storms), simulated outcomes can be checked, parameter values updated, and the simulations re-run. By studying forest landscape by forest stand type and height classes, we believe site related variability in the resistance to windthrow was indirectly accounted for, however, we recommend that future work should verify the impact of soil on windthrow vulnerability.
5. Conclusions
ForestGALES is one of the most validated windthrow models [42]; the windthrow processes appear adequately represented and as demonstrated in this work, with the appropriate species parameters the model could be exported successfully. This simulation is the first study to explore windthrow vulnerability for a broad range of inland Boreal forest stands of North America and shows that irrespective of the forest cover type, the intensity of wind primarily drives windthrow severity, with lower and upper wind speed limits for partial and complete damage. Vulnerability to windthrow increases with stand development (height), and varies between stand types, with implications for forest management and succession in these recurrently wind disturbed landscapes. The simulation approach we have demonstrated could be integrated with fire disturbance modelling and incorporated into landscape succession models to examine long-term landscape dynamics under current and future climates.
Supplementary Materials
The following are available online at www.mdpi.com/1999-4907/8/7/233/s1, Figure S1: Observed vs. predicted heights and the distribution of the residuals; Figure S2: Simulation space for selected stand types (a) Conifer mixed stands, (b) Hardwood-mixed stands, (c) Hardwood dominant stand, (d) Spruce mixed stands; Table S1: Sources of data in adapting ForestGales_BC to Boreal Ontario; Table S2: Characteristics of trees with and without height variable prior to tree height modelling; Table S3: Model [1] parameter estimates; Table S4: Variability in windthrow by stand type, height class, and above-canopy wind speed. Height_Model.csv; Tree-level data used in developing predictive height model. Stand_Type.xls; Plot-level data used in assigning stand type and height classes.
Acknowledgments
The authors are grateful to the Ontario Ministry of Natural Resources (OMNR) for funding this study. The authors are also grateful to Marc Ouellette who facilitated the acquisition of PSP data and Tim Shannon, an independent consultant and programmer for assisting with model debugging issues. We wish to thank the editor and two anonymous reviewers for their comments which led to an improvement in this manuscript.
Author Contributions
All authors worked on the research proposal. A.H.P. supplied PSP data. K.A.A., S.J.M. and J.-C.R worked on model adaptation. K.A.A. ran model simulations and statistical analysis. All authors were involved in the discussion of results.
Conflicts of Interest
The authors declare no conflict of interest.
References
- Wong, C.; Dorner, B.; Sandmann, H. Estimating Historical Variability of Natural Disturbances in British Columbia; British Columbia Ministry Sustainable Resource Management: Victoria, BC, Canada, 2003; p. 141.
- Landres, P.B.; Morgan, P.; Swanson, F.J. Overview of the use of natural variability concepts in managing ecological systems. Ecol. Appl. 1999, 9, 1179–1188. [Google Scholar]
- Montgomery, D.R. Process domains and the river continuum. J. Am. Water Res. Assoc. 1999, 35, 397–410. [Google Scholar] [CrossRef]
- Drever, C.R.; Peterson, G.; Messier, C.; Bergeron, Y.; Flannigan, M. Can forest management based on natural disturbances maintain ecological resilience? Can. J. For. Res. 2005, 36, 2285–2299. [Google Scholar] [CrossRef]
- Crow, T.R.; Perera, P.H. Emulating natural landscape disturbance in forest management—An introduction. In Emulating Natural Forest Landscape Disturbances: Concepts and Applications; Columbia University Press: New York, NY, USA, 2004; pp. 43–54. [Google Scholar]
- Franklin, J.F.; Spies, T.A.; Van Pelt, R.; Carey, A.B.; Thornburgh, D.A.; Berg, D.R.; Lindenmayer, D.B.; Harmon, M.E.; Keeton, W.S.; Shaw, D.C.; et al. Disturbances and structural development of natural forest ecosystems with silvicultural implications, using Douglas-fir forests as an example. For. Ecol. Manag. 2002, 155, 399–423. [Google Scholar] [CrossRef]
- Lindenmayer, D.B.; Franklin, J.F.; Fischer, J. General management principles and a checklist of strategies to guide forest biodiversity conservation. Biol. Conserv. 2006, 131, 433–445. [Google Scholar] [CrossRef]
- Dale, V.H.; Joyce, L.A.; McNulty, S.; Neilson, R.P.; Ayres, M.P.; Flannigan, M.D.; Hanson, P.J.; Irland, L.C.; Lugo, A.E.; Peterson, C.J.; et al. Climate change and forest disturbances: Climate change can affect forests by altering the frequency, intensity, duration, and timing of fire, drought, introduced species, insect and pathogen outbreaks, hurricanes, windstorms, ice storms, or landslides. BioScience 2001, 51, 723–734. [Google Scholar] [CrossRef]
- Pielke, R.A.; Pielke, R.A. Hurricanes, Their Nature and Impacts on Society; John Wiley and Sons: West Sussex, UK, 2007; p. 301. [Google Scholar]
- Blake, E.S.; Kimberlain, T.B.; Berg, R.J.; Cangialosi, J.P.; Beven, J.L., II. Tropical Cyclone Report: Hurricane Sandy; Nat Hurricane Center: Miami, FL, USA, 2013; Volume 12, pp. 1–10.
- Doswell, C.A., III. Severe Convective Storms; American Meteorological Society: Washington, DC, USA, 2001; p. 561. [Google Scholar]
- Mitchell, S.J. Wind as a natural disturbance agent in forests: A synthesis. Forestry 2013, 86, 147–157. [Google Scholar] [CrossRef]
- Anyomi, K.A.; Mitchell, S.J.; Ruel, J.-C. Windthrow modelling in old-growth and multi-layered boreal forests. Ecol. Mod. 2016, 327, 105–114. [Google Scholar] [CrossRef]
- Waldron, K.; Ruel, J.C.; Gauthier, S. The effects of site characteristics on the landscape-level windthrow regime in the North Shore region of Quebec, Canada. Forestry 2013, 86, 159–171. [Google Scholar] [CrossRef]
- Achim, A.; Ruel, J.-C.; Gardiner, B.A.; Laflamme, G.; Meunier, S. Modelling the vulnerability of balsam fir forests to wind damage. For. Ecol. Manag. 2005, 204, 35–50. [Google Scholar] [CrossRef]
- Peterson, C.J. Consistent influence of tree diameter and species on damage in nine eastern North America tornado blowdowns. For. Ecol. Manag. 2007, 250, 96–108. [Google Scholar] [CrossRef]
- Zeng, H.; Peltola, H.; Talkkari, A.; Strandman, H.; Venäläinen, A.; Wang, K.; Kellomäki, S. Simulations of the influence of clear-cutting on the risk of wind damage on a regional scale over a 20-year period. Can. J. For. Res. 2006, 36, 2247–2258. [Google Scholar] [CrossRef]
- Seidl, R.; Rammer, W.; Blennow, K. Simulating wind disturbance impacts on forest landscapes: Tree-level heterogeneity matters. Env. Mod. Softw. 2014, 51, 1–11. [Google Scholar] [CrossRef]
- Byrne, K.E.; Mitchell, S.J. Testing of WindFIRM/ForestGALES_BC: A hybrid-mechanistic model for predicting windthrow in partially harvested stands. Forestry 2013, 86, 185–199. [Google Scholar] [CrossRef]
- Hong, H.P.; Ye, W. Estimating extreme wind speed based on regional frequency analysis. Struct. Saf. 2013, 47, 67–77. [Google Scholar] [CrossRef]
- Sharma, M.; Parton, J.; Woods, M.; Newton, P.; Penner, M.; Wang, J.; Stinson, A.; Bell, F.W. Ontario’s forest growth and yield modelling program: Advances resulting from the Forestry Research Partnership. For. Chron. 2008, 84, 694–703. [Google Scholar] [CrossRef]
- Boucher, D.; Gauthier, S.; De Grandpré, L. Structural changes in coniferous stands along a chronosequence and a productivity gradient in the northeastern boreal forest of Québec. Ecoscience 2006, 13, 172–180. [Google Scholar] [CrossRef]
- Xi, W.; Peet, R.K.; Decoster, J.K.; Urban, D.L. Tree damage risk factors associated with large, infrequent wind disturbances of Carolina forests. Forestry 2008, 81, 317–334. [Google Scholar] [CrossRef]
- Anyomi, K. A.; Ruel, J.-C. A multi-scale analysis of the effects of alternative silvicultural treatments on windthrow within balsam fir dominated stands. Can. J. For. Res. 2015, 45, 1739–1747. [Google Scholar] [CrossRef]
- Rich, R.L.; Frelich, L.E.; Reich, P.B. Wind-throw mortality in the southern Boreal forest: Effects of species, diameter and stand age. J. Ecol. 2007, 95, 1261–1273. [Google Scholar] [CrossRef]
- Ulanova, N.G. The effects of windthrow on forests at different spatial scales: A review. For. Ecol. Manag. 2000, 135, 155–167. [Google Scholar] [CrossRef]
- Canham, C.D.; Papaik, M.J.; Latty, E.F. Interspecific variation in susceptibility to windthrow as a function of tree size and storm severity for northern temperate tree species. Can. J. For. Res. 2001, 31, 1–10. [Google Scholar] [CrossRef]
- Nolet, P.; Doyon, F.; Bouffard, D. Predicting stem windthrow probability in a northern hardwood forest using a wind intensity bio-indicator approach. Open J. For. 2012, 2, 77. [Google Scholar] [CrossRef]
- Kamimura, K.; Gardiner, B.; Dupont, S.; Guyon, D.; Meredieu, C. Mechanistic and statistical approaches to predicting wind damage to individual maritime pine (Pinus pinaster) trees in forests. Can. J. For. Res. 2015, 46, 88–100. [Google Scholar] [CrossRef]
- Hale, S.E.; Gardiner, B.; Peace, A.; Nicoll, B.; Taylor, P.; Pizzirani, S. Comparison and validation of three versions of a forest wind risk model. Environ. Mod. Softw. 2015, 68, 27–41. [Google Scholar] [CrossRef]
- Kamimura, K.; Gardiner, B.A.; Koga, S. Observations and predictions of wind damage to Larix kaempferi trees following thinning at an early growth stage. For. Int. J. For. Res. 2017, 201, 1–11. [Google Scholar]
- Kulakowski, D.; Matthews, C.; Jarvis, D.; Veblen, T.T. Compounded disturbances in sub-alpine forests in western Colorado favour future dominance by quaking aspen (Populus tremuloides). J. Veg. Sci. 2013, 24, 168–176. [Google Scholar] [CrossRef]
- Tang, G.; Beckage, B.; Smith, B. The potential transient dynamics of forests in New England under historical and projected future climate change. Clim. Chang. 2012, 114, 357–377. [Google Scholar] [CrossRef]
- Seidl, R.; Thom, D.; Kautz, M.; Martin-Benito, D.; Peltoniemi, M.; Vacchiano, G.; Wild, J.; Ascoli, D.; Petr, M.; Honkaniemi, J.; et al. Forest disturbances under climate change. Nat. Clim. Chang. 2017, 7, 395–402. [Google Scholar] [CrossRef]
- Ruel, J.-C.; Pineau, M. Windthrow as an important process for white spruce regeneration. For. Chang. 2002, 78, 732–738. [Google Scholar] [CrossRef]
- Plotkin, A.B.; Foster, D.; Carlson, J.; Magill, A. Survivors, not invaders, control forest development following simulated hurricane. Ecology 2013, 94, 414–423. [Google Scholar] [CrossRef] [PubMed]
- Kull, S.J.; Rampley, G.J.; Morken, S.; Metsaranta, J.M.; Neilson, E.T.; Kurz, W.A. Operational-Scale Carbon Budget Model of the Canadian Forest Sector (CBM-CFS3) Version 1.2: User’s Guide; Natural Resources Canada; Canadian Forest Service, Northern Forestry Centre: Edmonton, AB, Canada, 2014. [Google Scholar]
- Fortin, M.; Albrecht, A.; Kohnle, U.; Ningre, F. The impact of windstorm damage in the assessment of the carbon balance in even-aged Fagus sylvatica L. stands. Forests 2014, 5, 784–801. [Google Scholar] [CrossRef]
- Blennow, K.; Andersson, M.; Bergh, J.; Sallnäs, O.; Olofsson, E. Potential climate change impacts on the probability of wind damage in a south Swedish forest. Clim. Chang. 2010, 99, 261–278. [Google Scholar] [CrossRef]
- Peltola, H.; Ikonen, V-P.; Gregow, H.; Strandman, H.; Kilpeläinen, A.; Venäläinen, A.; Kellomäki, S. Impacts of climate change on timber production and regional risks of wind-induced damage to forests in Finland. For. Ecol. Manag. 2010, 260, 833–845. [Google Scholar] [CrossRef]
- Perera, A.H.; Dalziel, B.D.; Buse, L.J.; Routledge, R.G. Spatial variability of stand-scale residuals in Ontario’s boreal forest fires. Can. J. For. Res. 2009, 39, 945–961. [Google Scholar] [CrossRef]
- Gardiner, B.; Byrne, K.; Hale, S.; Kamimura, K.; Mitchell, S.J.; Peltola, H.; Ruel, J.C. A review of mechanistic modelling of wind damage risk to forests. Forestry 2008, 81, 447–463. [Google Scholar] [CrossRef]
- Bergeron, C.; Ruel, J.C.; Élie, J.G.; Mitchell, S.J. Root anchorage and stem strength of black spruce (Picea mariana) trees in regular and irregular stands. Forestry 2009, 82, 29–41. [Google Scholar] [CrossRef]
- Luther, J.E.; Skinner, R.; Fournier, R.A.; van Lier, O.R.; Bowers, W.W.; Coté, J.F.; Hopkinson, C.; Moulton, T. Predicting wood quantity and quality attributes of balsam fir and black spruce using airborne laser scanner data. Forestry 2013, 87, 313–326. [Google Scholar] [CrossRef]
- Ruel, J.-C.; Quine, C.P.; Meunier, S.; Suarez, J. Estimating windthrow risk in balsam fir stands with the ForestGales model. For. Chron. 2000, 76, 329–337. [Google Scholar] [CrossRef]
- Ter-Mikaelian, M.T.; Korzukhin, M.D. Biomass equations for sixty-five North American tree species. For. Ecol. Manag. 1997, 97, 1–24. [Google Scholar] [CrossRef]
- Seely, O. Physical Properties of Common Woods. 2007. Available online: http://www.csudh.edu/oliver/chemdata/woods.htm (accessed on 25 October 2016).
- Russell, M.B.; Weiskittel, A.R. Maximum and Largest Crown Width Equations for 15 Tree Species in Maine. North J. Appl. For. 2011, 28, 84–91. [Google Scholar]
- Elie, J.-G.; Ruel, J.-C. Windthrow hazard modelling in boreal forests of black spruce and Jack pine. Can. J. For. Res. 2005, 35, 2655–2663. [Google Scholar] [CrossRef]
- Pinno, B.D.; Lieffers, V.J.; Stadt, K.J. Measuring and modelling the crown and light transmission characteristics of juvenile aspen. Can. J. For. Res. 2001, 31, 1930–1939. [Google Scholar] [CrossRef]
- Manitoba Conservation and Water Stewardship (MCWS). Wood Supply Analysis Report for FMU 24. 105p. Available online: http://www.manitoba.ca/conservation/forestry/pdf/wood-supply/pineland_wood_supply_analysis_report_2013.pdf. (accessed on 8 January 2015).
- Vollsinger, S.; Mitchell, S.J.; Byrne, K.E.; Novak, M.D.; Rudnicki, M. Wind tunnel measurements of crown streamlining and drag relationships for several hardwood species. Can. J. For. Res. 2005, 35, 1238–1249. [Google Scholar] [CrossRef]
- Nicoll, B.C.; Gardiner, B.A.; Rayner, B.; Peace, A.J. Anchorage of coniferous trees in relation to species, soil type, and rooting depth. Can. J. For. Res. 2006, 36, 1871–1883. [Google Scholar] [CrossRef]
© 2017 by the authors. Licensee MDPI, Basel, Switzerland. This article is an open access article distributed under the terms and conditions of the Creative Commons Attribution (CC BY) license (http://creativecommons.org/licenses/by/4.0/).