Article

De Novo Transcriptome Characterization, Gene Expression Profiling and Ionic Responses of Nitraria sibirica Pall. under Salt Stress

Research Center of Saline and Alkali Land of State Forestry Administration; State Key Laboratory of Tree Genetics and Breeding, Beijing 100091, China
*
Authors to whom correspondence should be addressed.
H.Z. and X.Y. contributed equally to this study.
Forests 2017, 8(6), 211; https://doi.org/10.3390/f8060211
Submission received: 20 April 2017 / Revised: 7 June 2017 / Accepted: 10 June 2017 / Published: 15 June 2017

Abstract

:
Nitraria sibirica Pall., a typical halophyte of great ecological value, is widely distributed in desert, saline, and coastal saline-alkali environments. Consequently, researching the salt tolerance mechanism of N. sibirica Pall. has great significance to the cultivation and utilization of salt-tolerant plants. In this research, RNA-seq, digital gene expression (DGE), and high flux element analysis technologies were used to investigate the molecular and physiological mechanisms related to salt tolerance of N. sibirica Pall. Integrative analysis and de novo transcriptome assembly generated 137,421 unigenes. In total, 58,340 and 34,033 unigenes were annotated with gene ontology (GO) terms and mapped in Kyoto Encyclopedia of Genes and Genomes (KEGG) pathways, respectively. Three differentially expressed genes (DEGs) libraries were subsequently constructed from the leaves of N. sibirica Pall. seedlings under different treatments: control (CK), light short-term salt stress (CL2), and heavy long-term salt stress (CL6). Eight hundred and twenty-six, and 224 differentially expressed genes were identified in CL2 and CL6 compared to CK, respectively. Finally, ionomic analysis of N. sibirica Pall. seedlings treated with 0, 100, 200 or 300 mM concentrations of NaCl for one day showed that the uptake and distribution of Ca, Cu, Fe, Mg and K in different organs of N. sibirica Pall. were significantly affected by salt stress. Our findings have identified potential genes involved in salt tolerance and in the reference transcriptome and have revealed the salt tolerance mechanism in N. sibirica Pall. These findings will provide further insight into the molecular and physiological mechanisms related to salt stress in N. sibirica Pall. and in other halophytes.

1. Introduction

Soil salinization has become an important global resource and an environmental problem. Salt stress is one of the most important abiotic stresses that not only affects plant physiology and metabolism and the distribution of plants in nature, but also decreases plant productivity and crop yields [1,2,3]. Based on the statistics of the Food and Agriculture Organization of United Nations (FAO) that the area of saline-alkaline land is more than 8.0 × 10⁸ hm2 [4], this area occupies approximately 6% of total area globally [5]. Vast saline soils are important land resources, whose reasonable development and utilization is of great significance to agricultural production and sustainable ecological development.
The effects of salt stress on plant growth are mainly caused by ion toxicity, osmotic stress and secondary oxidative stress [6,7]. Therefore, studying the mechanism of salt tolerance is becoming increasingly important. Many researchers have studied the salinity-tolerance mechanisms of plants, such as ion balance, osmotic adjustment, antioxidant protection, and transcript profiling [8,9,10,11]. Salinity tolerance is a multiple gene-associated mechanism that is controlled by many genes involved in different processes, such as ion compartmentalization, extrusion and selectivity; the synthesis of metabolites; and the scavenging of reactive oxygen species (ROS) [12,13]. Consequently, next-generation Illumina sequencing technology offers an effective method to investigate the transcriptome and to conduct comparisons of digital gene expression profiles to identify salinity tolerance genes to explain the molecular mechanism of salinity tolerance of plants [14].
Hundreds of plant species have been experimentally investigated for their salt tolerance to understand the molecular aspects of vegetative salt tolerance in halophytes and glycophytes, including barley, soybean, paddy, cotton, and alfalfa [15,16,17,18,19]. Many genes of these plants are induced that either directly protect the plant from salt stress or regulate the expression of other target genes upon exposure to salt stress [18]. Genes related to proline synthetase and chlorophyll binding protein are up-regulated in barley under salt stress [20]. Also, the genes PtSOS2, NHXs and HKTs have been observed to play an important role in improving plant salt tolerance by controlling ion balance through ion transport [10,21,22]. Comparative genomics regarding salt tolerance between Arabidopsis and salt cress were analysed using cDNA microarrays, and the results showed that the stronger salt tolerance of salt cress may be due to a large number of known abiotic and biotic stress-inducible genes, including Fe-SOD, P5CS, PDF1.2, AtNCED, and SOS1, and those of P-protein and beta-glucosidase, which were expressed at high levels [23]. Consequently, studying the transcriptome and exploiting different salt tolerance genes are important for understanding the mechanisms of plant salinity tolerance.
Ionomics research mainly involves high flux element analysis technology to clarify ion distribution in plants upon changes in external stimuli or different growth stages [24]. The content of sodium (Na) is higher in saline soil than in other soils. Absorption of too much Na can lead to osmotic stress and ion toxicity in plants when they grow in saline environments [5,13,25]. Salt stress will not only limit the absorption of macroelements, such as potassium (K), calcium (Ca), magnesium (Mg) and phosphorus (P), but will also affect the assimilation of microelements, including copper (Cu), iron (Fe), and zinc (Zn). A reduction of mineral elements in plants will lead to nutritional deficiencies and metabolic disorders [26,27]. Therefore, understanding the mechanisms of ionic detoxification and balance is indispensable for improving the salt tolerance of plants. A great number of studies have focused on researching the change in ion concentrations under salt stress; however, most of those studies only involved one or a few elements, e.g., Na, K, Fe, and S [28,29,30]. There are interactions between different elements, so research on various elements is becoming increasingly necessary. Ionomics is the area of research that studies the mechanisms among the concentration, distribution, and metabolism of various elements in plants and the environment, and different development stages and external stimuli where they are growing [24]. Ionomics has been applied to study the mechanism of salt tolerance in many species. Lotfi et al. [31] studied iron characteristic of pecan plants under salt stress. With increasing salt concentrations, resistant species accumulated K and Ca, especially in the shoots; in semi-tolerant cultivars, only K amassed in the roots. Salt tolerance mechanisms of different genotypes of Arabidopsis thaliana have been studied using ionomics and metabolomics. The content of K, P, S and Mn increased more than in other genotypes under salt stress, in A. thaliana plants that contained the AtHKT1;1 gene, while Na concentration decreased significantly [32]. Wu et al. [33] and Shen et al. [34] studied ionome differences of cultivated and wild-type barley under salt stress; their results showed that the distribution of the elements in the shoots and roots was affected by salt stress. Previous studies have mainly focused on glycophytes and less on halophytes. Thus, it is imperative to study the ionomics of halophytes to characterize the mechanism of salt tolerance.
Nitraria sibirica Pall. (N. sibirica Pall.) is a shrub that grows in desert, saline and coastal saline-alkali land. It is a typical woody salt-diluting halophyte, with strong salt tolerance and environmental adaptability [35,36,37]. Few studies have been conducted to investigate the physiological mechanisms of N. sibirica Pall. to salt stress, which mainly involve the osmotic adjustment of substances, the distribution of Na and K, and the changes of oxidase activity, among others [38,39,40,41]. Studies of the molecular mechanism of N. sibirica Pall. salt tolerance have only involved a single gene cloning and expression analysis of NsNHX1 and NtNHX1 [42,43,44].
To better understand the molecular mechanism of plant salinity tolerance and the interaction between salinity stress and ion homeostasis, we performed a transcriptome analysis of N. sibirica Pall. challenged with salinity stress using Illumina (San Diego, CA, USA) sequencing and high flux element analysis technologies.

2. Materials and Methods

2.1. Nitraria sibirica Pall. Materials and Hydroponic Culture

Nitraria sibirica Pall. seeds were collected from Keluke beach saline-alkali land, Qaidam basin, Qinghai province, China. The seeds were stored in sand at low temperature. Then, the seeds were germinated and selected for sowing into containers filled with vermiculite:perlite (3:1) in March of the following year. Two-month-old seedlings were transplanted into rectangular plastic containers (10 L) with aerated hydroponic solution for 24 h. Tap water was used in the first stage until seedlings generated new roots, and half-strength Hoagland nutrient solution was supplied on the following days. The hydroponic solution was renewed every 4 days, and the pH was maintained at 6.0. Seedlings were grown in the greenhouse at 25–30 °C, 14 h days/20–25 °C, 10 h nights.

2.2. Salt Treatment and Sampling

Salt treatment began seven days after seedlings were transplanted, by adding NaCl at a concentration of 50 mM per day; all treatments reached final sampling at the same time. A hydroponic solution without NaCl was regarded as the control. The final concentration and treatment time of each treatment are shown in Table 1 [45,46,47]. The roots, stems and leaves of all treatments were selected for transcriptome analysis, and the leaves of CK, CL2 and CL6 were chosen for digital gene expression profiling tests. At the same time, the roots, stems and leaves of CK, CL2, CL3 and CL4 were selected for ionomics tests. All materials were thoroughly rinsed with deionized water and then wiped dry. The roots, stems and leaves were sampled, frozen immediately in liquid nitrogen, and then stored at −80 °C for use in transcriptome and digital gene expression profiling extractions. For ionomics analysis, three biological replicates of the treatment and control were sampled for ion concentration extraction. The sampled materials were dried at 105 °C for 15 min and then maintained at 75 °C until constant weight. The dry weight of the materials was measured, and then the materials were ground into a powder.

2.3. RNA Extraction and Library Preparation for Transcriptome Sequencing

Total RNA was isolated from N. sibirica Pall. materials using TRIzol Reagent (Invitrogen, Carlsbad, CA, USA) in accordance with the manufacturer’s protocol. The integrity of RNA was assessed using an RNA Nano 6000 Assay Kit of the Agilent Bioanalyzer 2100 system (Agilent Technologies, Santa Clara, CA, USA). mRNA was purified from 3 μg of total RNA per sample using poly-T oligo-attached magnetic beads. Fragmentation was carried out using divalent cations under elevated temperature in NEBNext First Strand Synthesis Reaction Buffer (5X) (NEB, Ipswich, MA, USA). First-strand cDNA was synthesized using random hexamer primers and M-MuLV Reverse Transcriptase (RNaseH). Second-strand cDNA synthesis was subsequently performed using DNA Polymerase I and RNase H. After adenylation of the 3’ ends of DNA fragments, NEBNext adaptors with a hairpin loop structure were ligated to prepare for hybridization. The library fragments were purified using an AMPure XP system (Beckman Coulter, Brea, California, USA) to select 150–200 bp cDNA fragments. Then, 3 μL of USER Enzyme (NEB, Ipswich, MA, USA) was used with size-selected, adaptor-ligated cDNA at 37 °C for 15 min, followed by 5 min at 95 °C before PCR. Finally, PCR products were purified (AMPure XP system), and the library quality was assessed using the Agilent Bioanalyzer 2100 system (Agilent Technologies, Santa Clara, CA, USA). The clustering of the index-coded samples was performed on a cBot Cluster Generation System using a TruSeq PE Cluster Kit v3-cBot-HS (Illumina, San Diego, CA, USA) according to the manufacturer’s instructions. After cluster generation, the library preparations were sequenced on an Illumina HiSeq 2500 platform, and paired-end reads were generated.

2.4. Analysis of Illumina Sequencing Data

Clean data were obtained by removing reads containing adaptors, reads containing poly-N and reads of low quality from the raw data. At the same time, the percentage of phred values greater than 20 or 30 bases in the overall bases (Q20, Q30), the percentage of the bases of G and C number in the total bases number (GC content) and sequence duplication level of the clean data were calculated. Transcriptome assembly was accomplished based on the left.fq and right.fq using Trinity [48] with min_kmer_cov set to 2 by default, and all other parameters were set to default. Core Eukaryotic Genes Mapping Approach (CEGMA) was used to assess subset of 248 highly conserved core eukaryotic genes (CEGs) in the resulting unigenes assembly and to estimate the completeness of the core gene assembly [49,50]. After assembly, unigenes were queried against the databases of non-redundant protein sequences (Nr, https://www.ncbi.nlm.nih.gov/), nucleotide sequences (Nt, https://www.ncbi.nlm.nih.gov/), Protein family (Pfam, http://pfam.sanger.ac.uk/), A manually annotated and reviewed protein sequence database (Swiss-Prot, http://www.ebi.ac.uk/uniprot/), euKaryotic Ortholog Groups (KOG, http://www.ncbi.nlm.nih.gov/COG/), KEGG (http://www.genome.jp/kegg), and GO (http://www.geneontology.org/). Basic Local Alignment Search Tool (BLAST) algorithms were borrowed for Nr, Nt, Swiss-Prot, KOG and KO alignment algorithms [51]; the algorithms thresholds were set to E-values of 1 × 10⁻¹⁰, 1 × 10⁻⁵, 1 × 10⁻⁵, 1 × 10⁻³ and 1 × 10⁻⁵, respectively. Blast2GO was adopted for GO annotation according to the results of Nr and Pfam annotations [52]. Finally, the KEGG pathway annotation was performed according to the databases [53].

2.5. Digital Gene Expression Library Preparation and Sequencing

Total RNA of each sample was extracted for construction of the library. Library construction and sequencing steps were the same as those in transcriptome sequencing.

2.6. Analysis and Mapping of Digital Gene Expression Tags

All downstream analyses of digital gene expression were based on clean data of high quality. Gene expression levels were estimated by RSEM (a software package for estimating gene and isoform expression levels from RNA-Seq data) for each sample [54]. The read counts were adjusted using the edge R program package with one scaling normalized factor. Differential expression analysis of two samples was performed using the DEGseq R package. The p value was adjusted using the q value. q value < 0.005 and log2 (fold change) > 1 were set as the thresholds for significant differential expression. GO enrichment analysis of the differentially expressed genes (DEGs) was implemented using the GOseq R package-based Wallenius non-central hypergeometric distribution [55]. The GO enrichment was analysed using the BiNGO plugin [56] in Cytoscape [57], using hypergeometric tests for statistical analysis. For pathway enrichment analysis, the statistical enrichment of differentially expressed genes in KEGG pathways was tested using KO-Based Annotation System (KOBAS) software [58], and these genes were mapped to KEGG pathways to identify the different expression in the whole genome background.

2.7. Quantitative PCR (qPCR) Analysis

The expression levels of the digital gene expression results were confirmed by quantitative PCR (qPCR) for nine DEGs. Three biological replications of each sample were used for qPCR analysis. The isolation of RNA was performed using an RNAprep Pure Plant Kit (TIANGEN, Beijing, China) according to the manufacturer’s instructions. TransScript All-in-One First-Strand cDNA Synthesis SuperMix for qPCR (One-Step gDNA Removal) was used, and then cDNA was stored at −20 °C. After BLAST comparison of the gene sequences of interest, PCR primers were designed using Primer Premier 6 software (Premier Biosoft, Palo Alto, CA, USA), which are shown in Table S5. The Actin gene was used as an internal control. The three cDNA samples were diluted 10 times to a final concentration of 10–15 ng/µL to be templates for the qPCR experiments. Then, approximately 1 µL of cDNA for each sample were used for qPCR tests. qPCR was carried out with TransStart Top Green qPCR SuperMix (TransGen Biotech, Beijing, China) on a Bioer 96plus platform (Bioer, Hangzhou, China). Three independent biological replicates were analysed for each sample and data were indicated as mean ± standard error (SE) (n = 3). The results and FPKM (Fragments Per Kilobase of transcript per Million fragments mapped) values for each gene were analysed and mapped used Microsoft Excel 2016.

2.8. Element Profiling Analysis

Dried and ground samples were digested with 5 mL of HNO3 and 1 mL of H2O2 in a microwave digestion instrument (CEM, Matthews, NC, USA). The digested samples were transferred to PET bottles. The concentrations of Na, K, Ca, Mg, Fe, Mn, Cu and Zn were determined using an inductive coupling plasma emission spectrograph (iCAP 6300 ICP-OES Spectrometer, Thermo Scientific, Waltham, MA, USA ), according to the equipment operation manual. The data were analysed using SPSS 19.0 (Chicago, IL, USA) and Metaboanalyst 2.0 (http://www.metaboanalyst.ca/) [33].

3. Results

3.1. Sequencing Data Quality and Assembly of Reads

Hybrid RNA samples of all treatments were used to construct libraries for sequencing. As a result, approximately 109,605,726 raw reads were obtained, and 103,965,286 clean reads were obtained after trimming of adaptors and low-quality reads. There were 13 G of total clean bases, and the Q20 occupied 95.59% of the overall bases. The GC content was approximately 45.71%, on average. Finally, a total of 137,421 unigenes were obtained. The length of the unigenes ranged from 201 bp to 15,714 bp, and the mean length of the unigenes was 555 bp (N50 = 846 bp) (Table 2). The number of unigenes whose length ranged greater than 301 bp was 47,714; the length distributions of spliced unigenes were given in Figure S1. Several conserved core eukaryotic genes (CEGs), representing an unbiased set of proteins that are conserved in diverse eukaryotes, were identified in our transcriptome assembly. Using CEGMA, 568 complete-length homologs of 242 (97.58%) out of 248 CEGs and 750 partial-length homologs of 247 (99.60%) out of 248 CEGs were identified in our assembly (Table S4). Altogether, Illumina sequencing technology could effectively capture most of the transcriptome information of N. sibirica Pall. under salt stress. Raw sequencing data has been submitted to the SRA database of NCBI with the ID SRP108455.

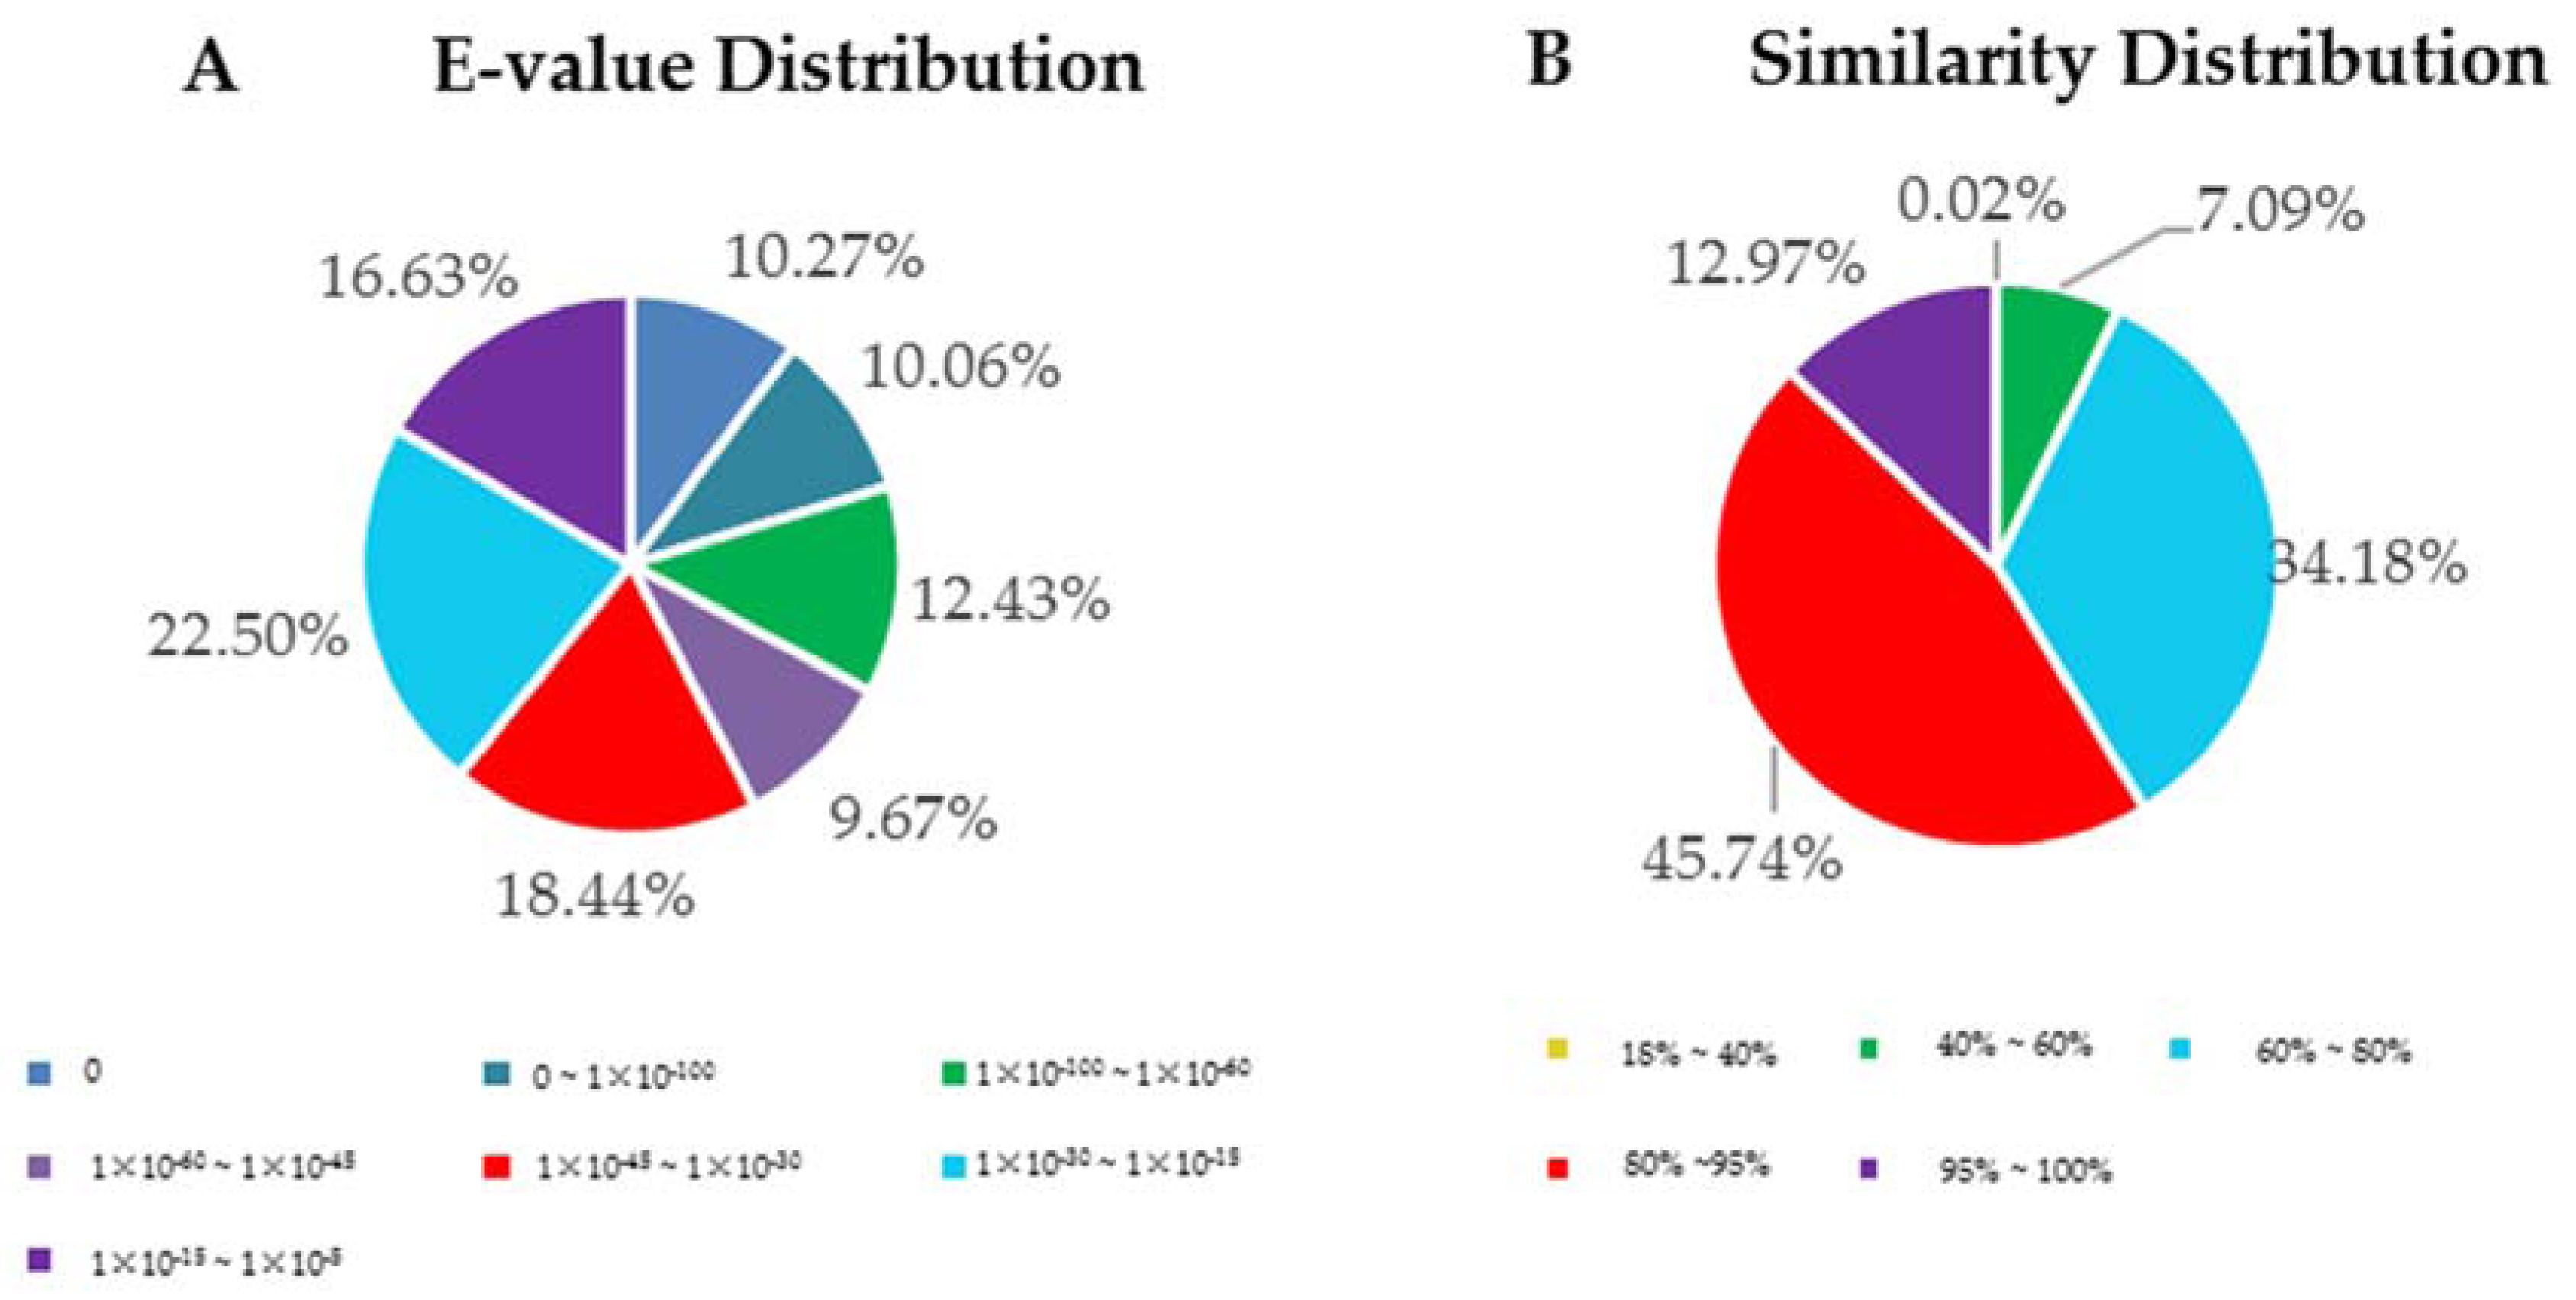
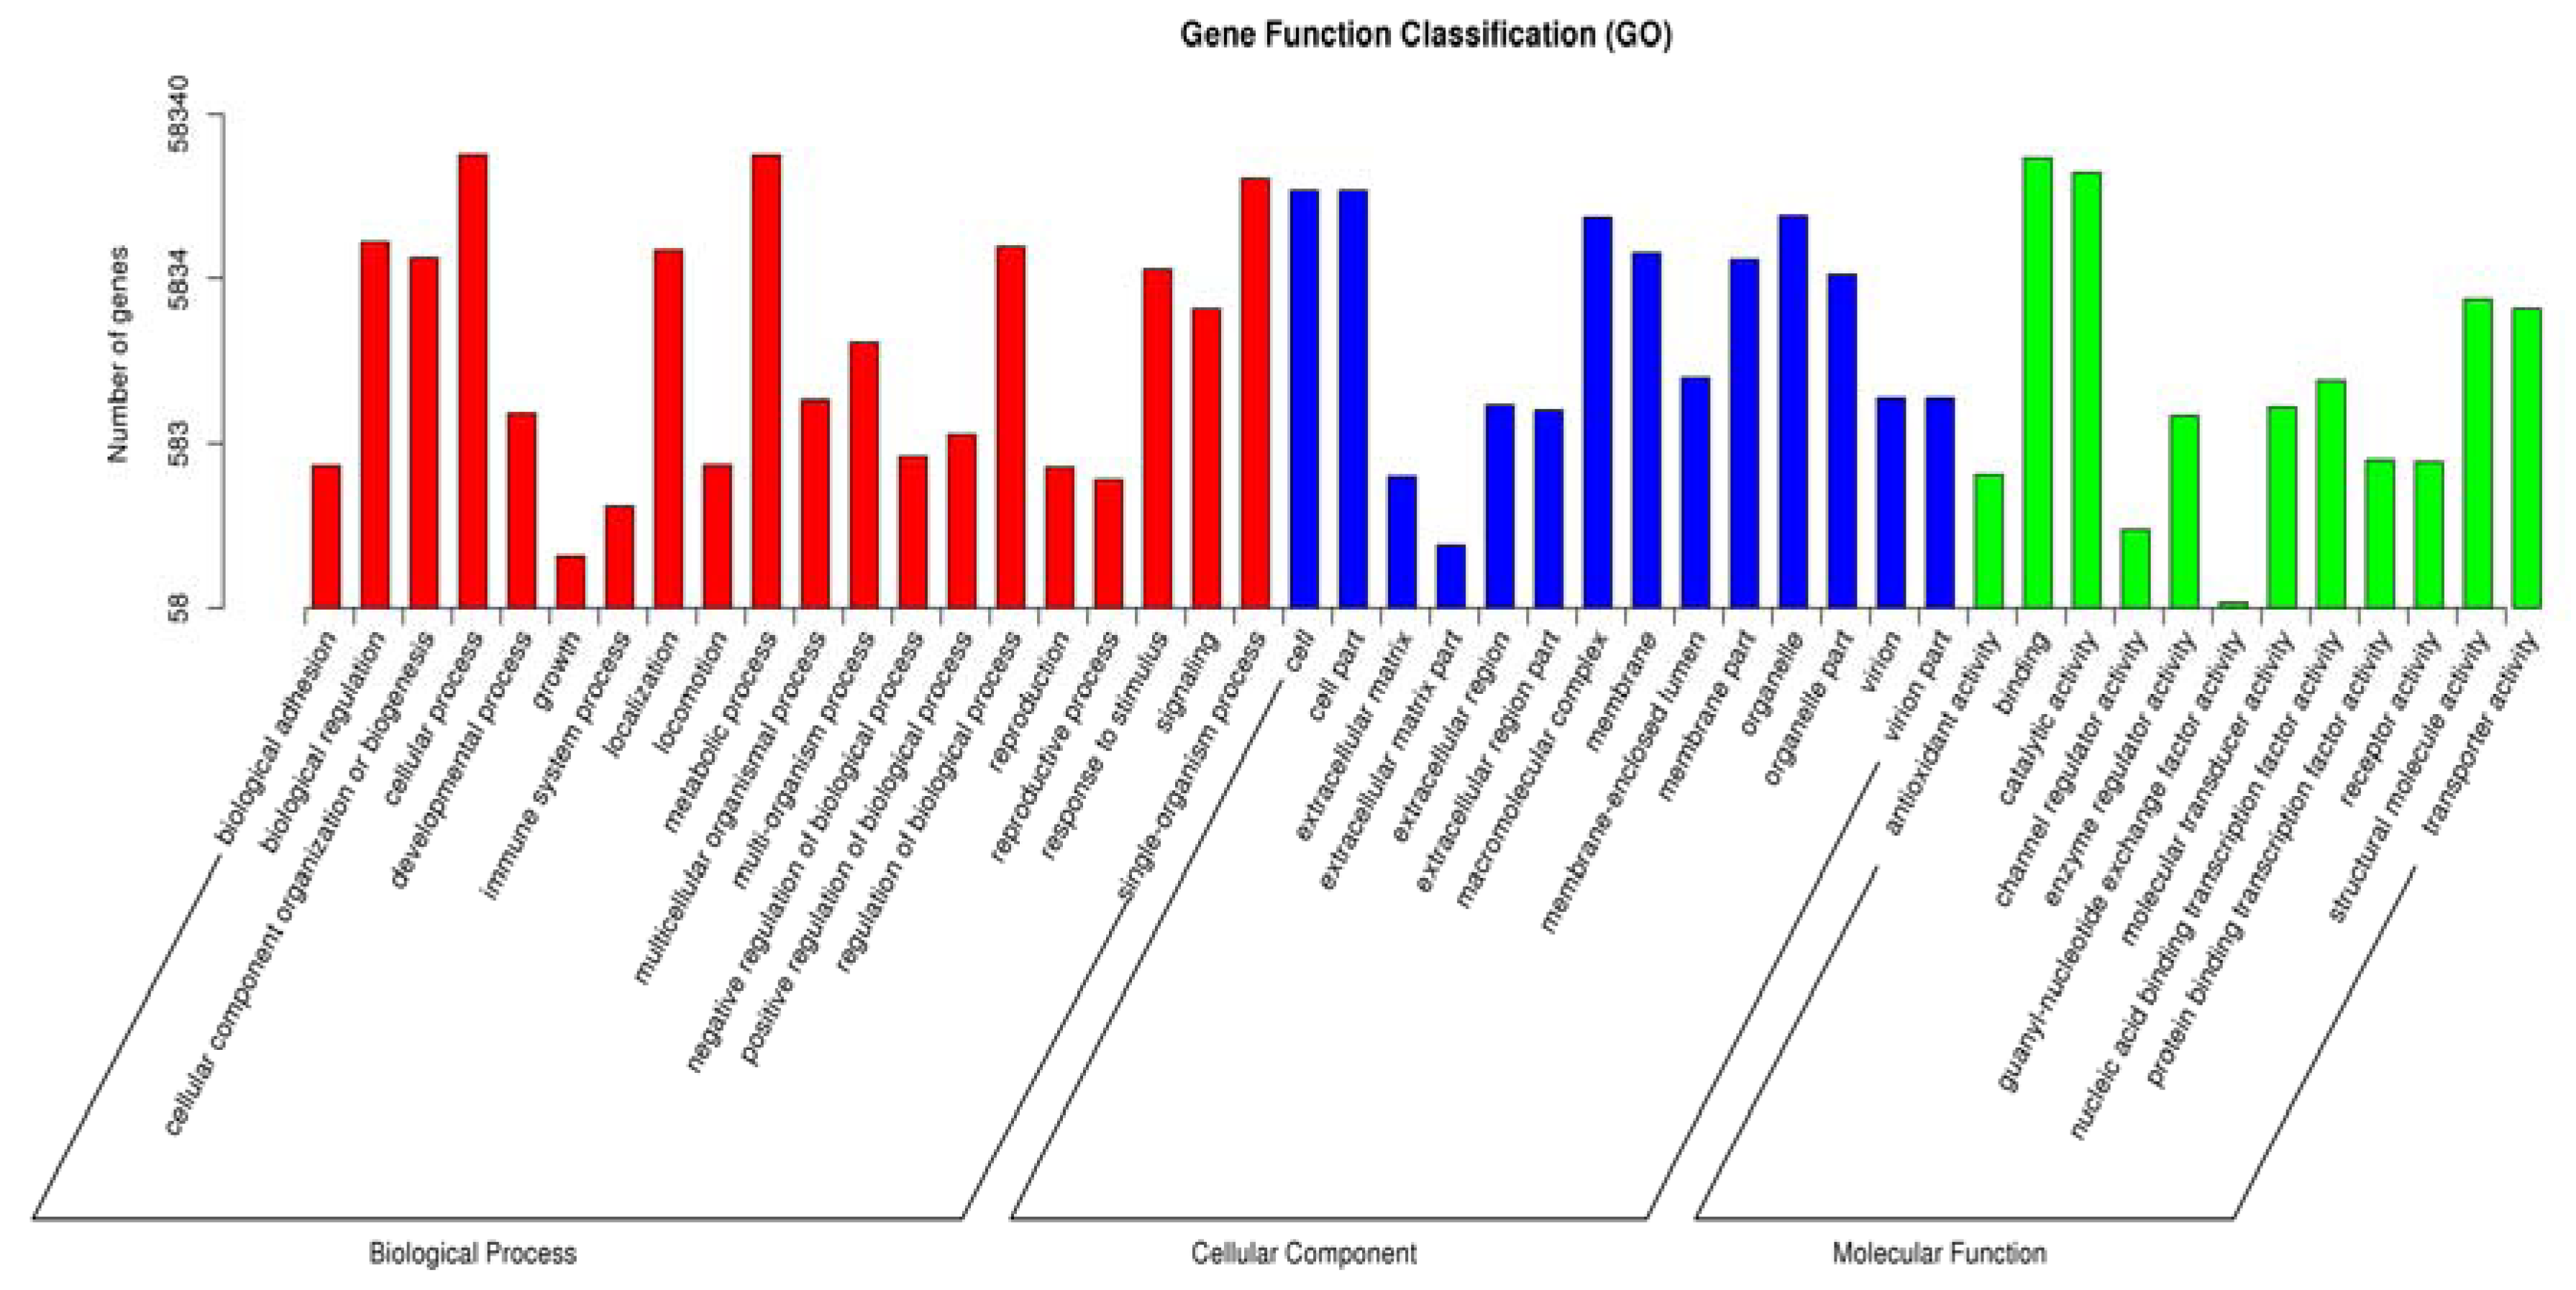
3.2. Functional Annotation

The assembled unigenes were annotated using the databases of Nr (non-redundant protein sequences), Nt (nucleotide sequences), and KO (KEGG orthology), among others. The functional annotation statistics of the N. sibirica Pall. transcriptome are shown in Table S1. The results indicate that a total of 79,373 unigenes (57.75%) were homologous to known proteins within the Nr database. Approximately 29,499 unigenes (21.46%) were matched with sequences in the Nt database. In addition, 57,723 unigenes (42.00%) were annotated in the Swiss-Prot database (Table S1). However, many unigenes could not be matched to a protein sequence in any database.
The unigene sequence similarity between N. sibirica Pall. and its relatives and the gene functions of N. sibirica Pall. were obtained by annotation with the Nr database. For further analysis of the distribution of protein BLAST E-values, 16.63% of homologous sequences ranged from 1 × 10⁻⁵ to 1 × 10⁻¹⁵; approximately 20% of sequences had an E-value of less than 10−100 and the other unigene E-values ranged from 10−100–10−15 (Figure 1A). From the similarity of BLASTx, the similarity of unigenes of more than 80% nearly accounted for 60%, while the similarity of unigenes less than 60% accounted for only 7% (Figure 1B). The species distribution of BLAST with the Nr database shows that Citrus sinensis, Citrus clementina, Theobroma cacao, Vitis vinifera, Coffea canephora, Nicotiana tomentosiformis, Populus trichocarpa, Acremonium chrysogenum, Jatropha curcas and Ricinus communis were the top 10 matches. The species that provided the best BLASTx matches was Citrus sinensis, and there were 8596 genes (6.26%) with the highest homology (Table S2).
Furthermore, we obtained GO functional annotation using the Nr annotation. The GO annotation information and functional classification of unigenes were performed by Blast2GO (Avenida Peris y Valero, Valencia, ES-Spain) [59] and The Web Gene Ontology Annotation Plot (WEGO) [60] software, respectively, according to the Nr annotation. In total, we submitted 308,896 functional terms that were categorized into 59 functional groups associated with 58,340 unigenes. The 59 functional groups were divided into three main categories: biological process (142,607, 46.2%), cellular component (96,167, 31.1%) and molecular function (70,122, 22.7%). We also found 6614 genes associated with a response to stimuli (GO: 0050896) (Figure 2).
The Kyoto Encyclopaedia of Genes and Genomes provides a platform for the systematic analysis of gene function according to the metabolic networks of gene products [53]. The network of biological molecule functions and interactions was constructed based on the KEGG database. A total of 34,033 unigenes were mapped to annotation pathways, and these unigenes were functionally assigned to 285 KEGG pathways. The most representative pathways were related to metabolism (16,713, 36.43%), which includes carbohydrate metabolism (3155), energy metabolism (2442), and amino acid metabolism (2277), among others. The translation (6152) of genetic information processing contributed the greatest portion. Detailed pathway classifications are shown in Figure S2.

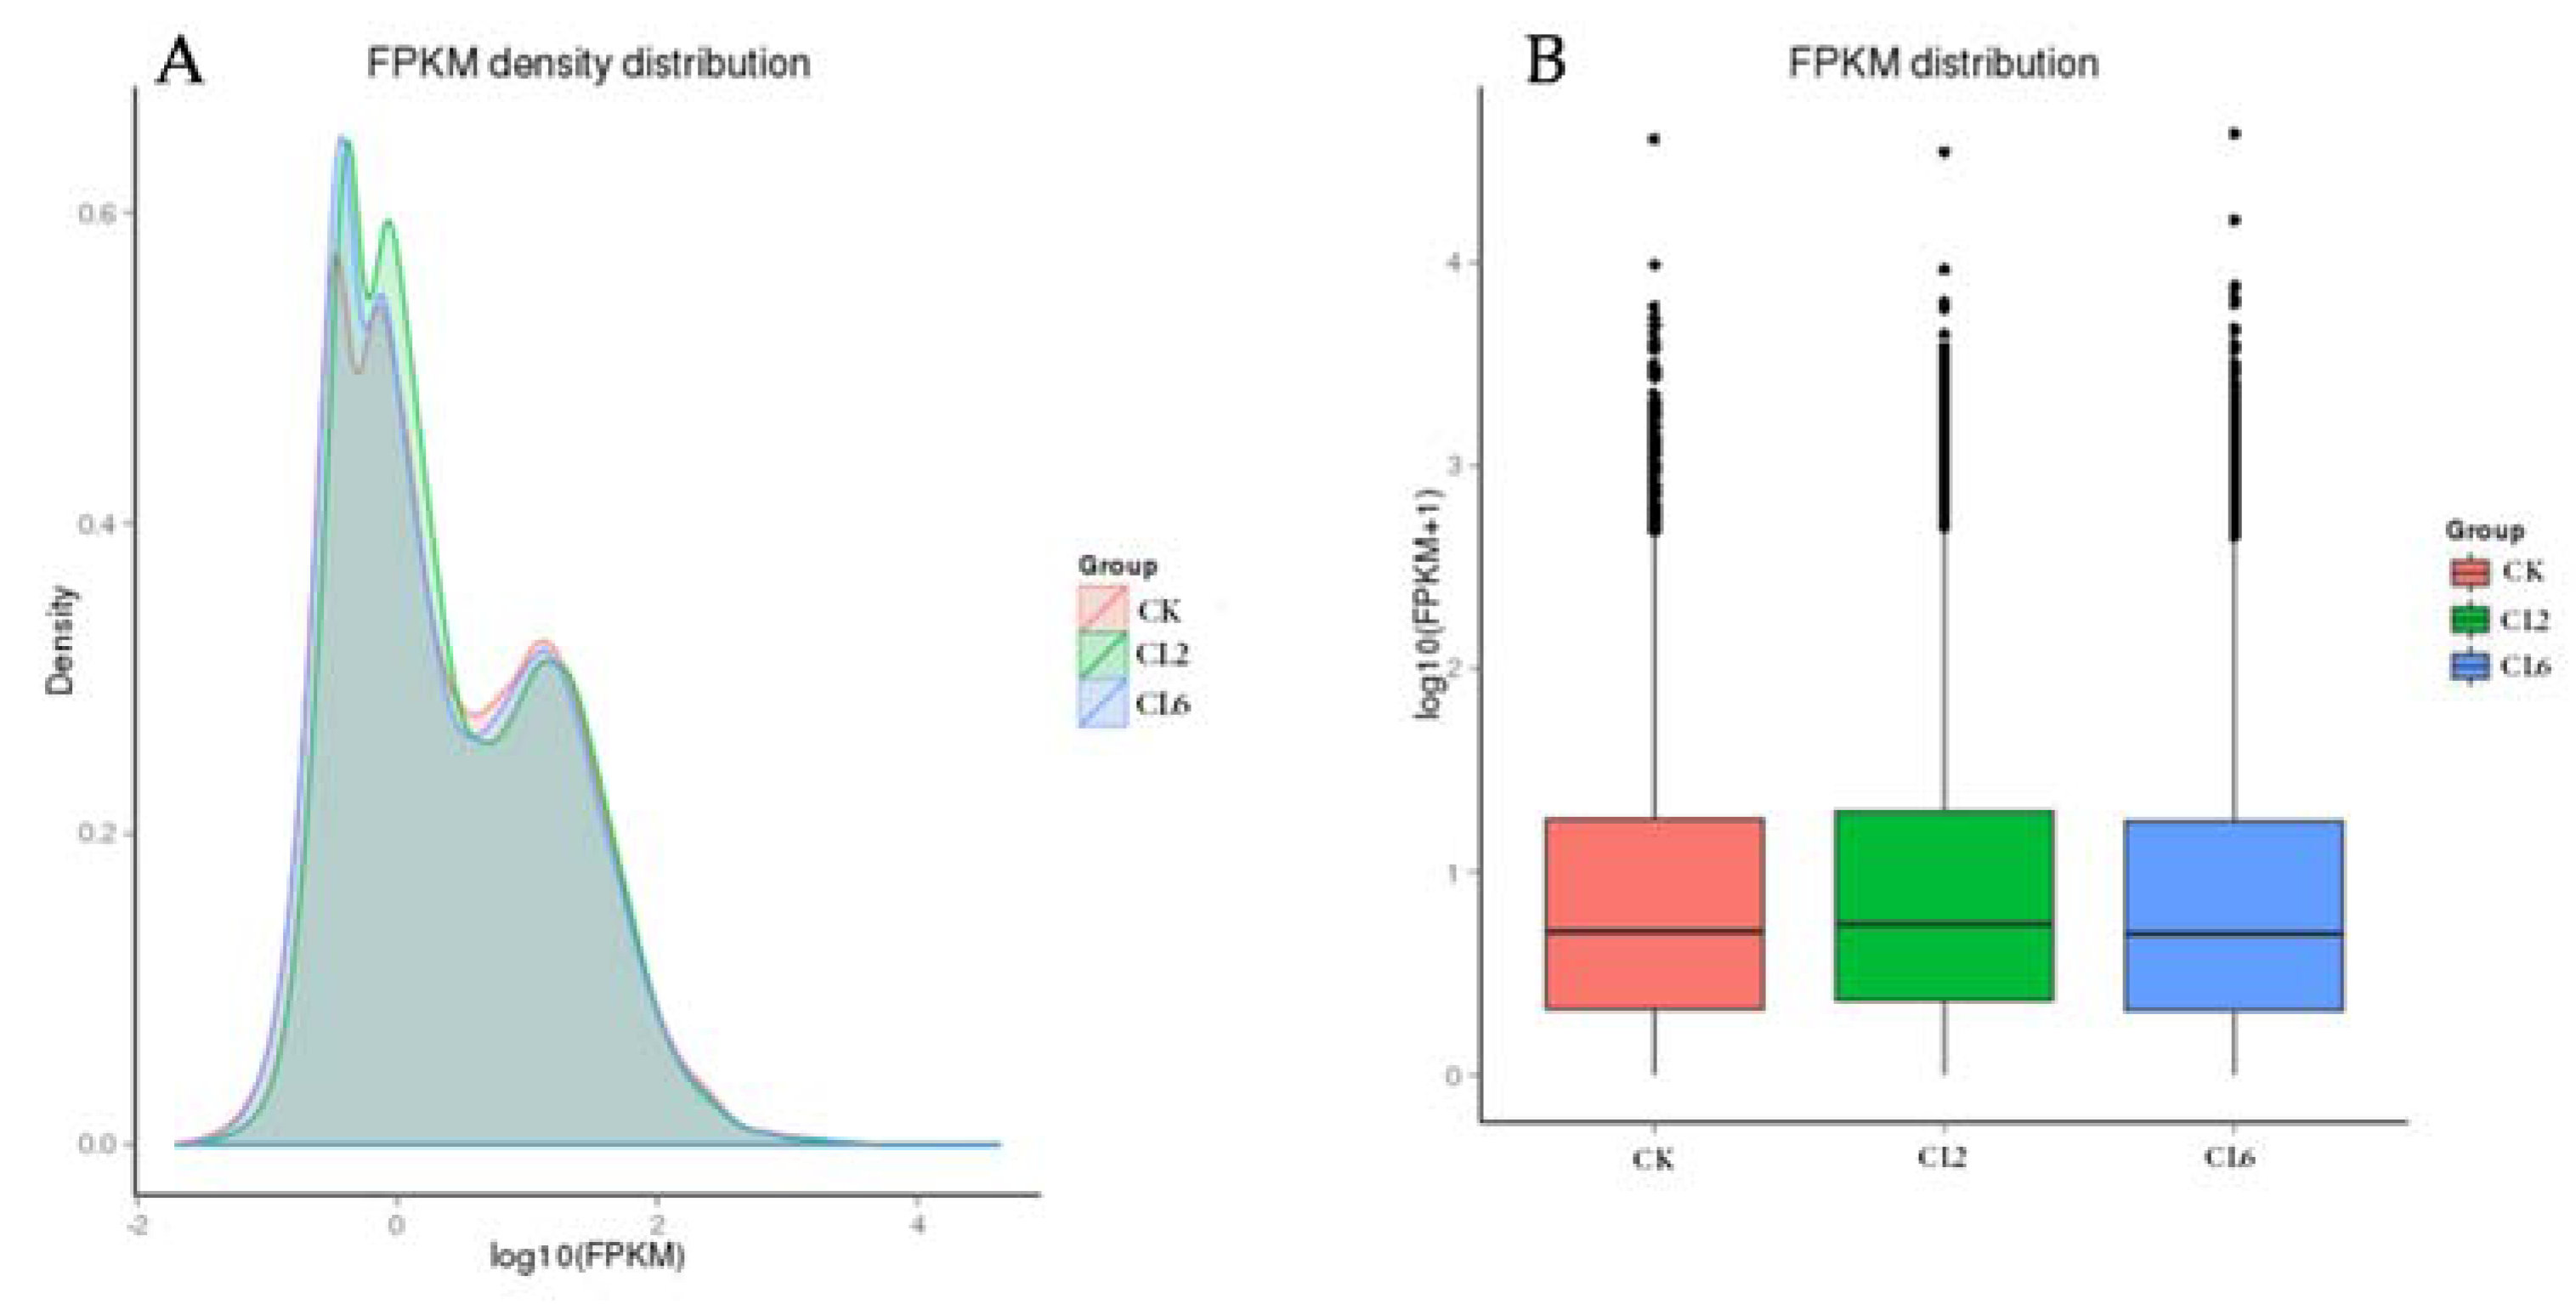
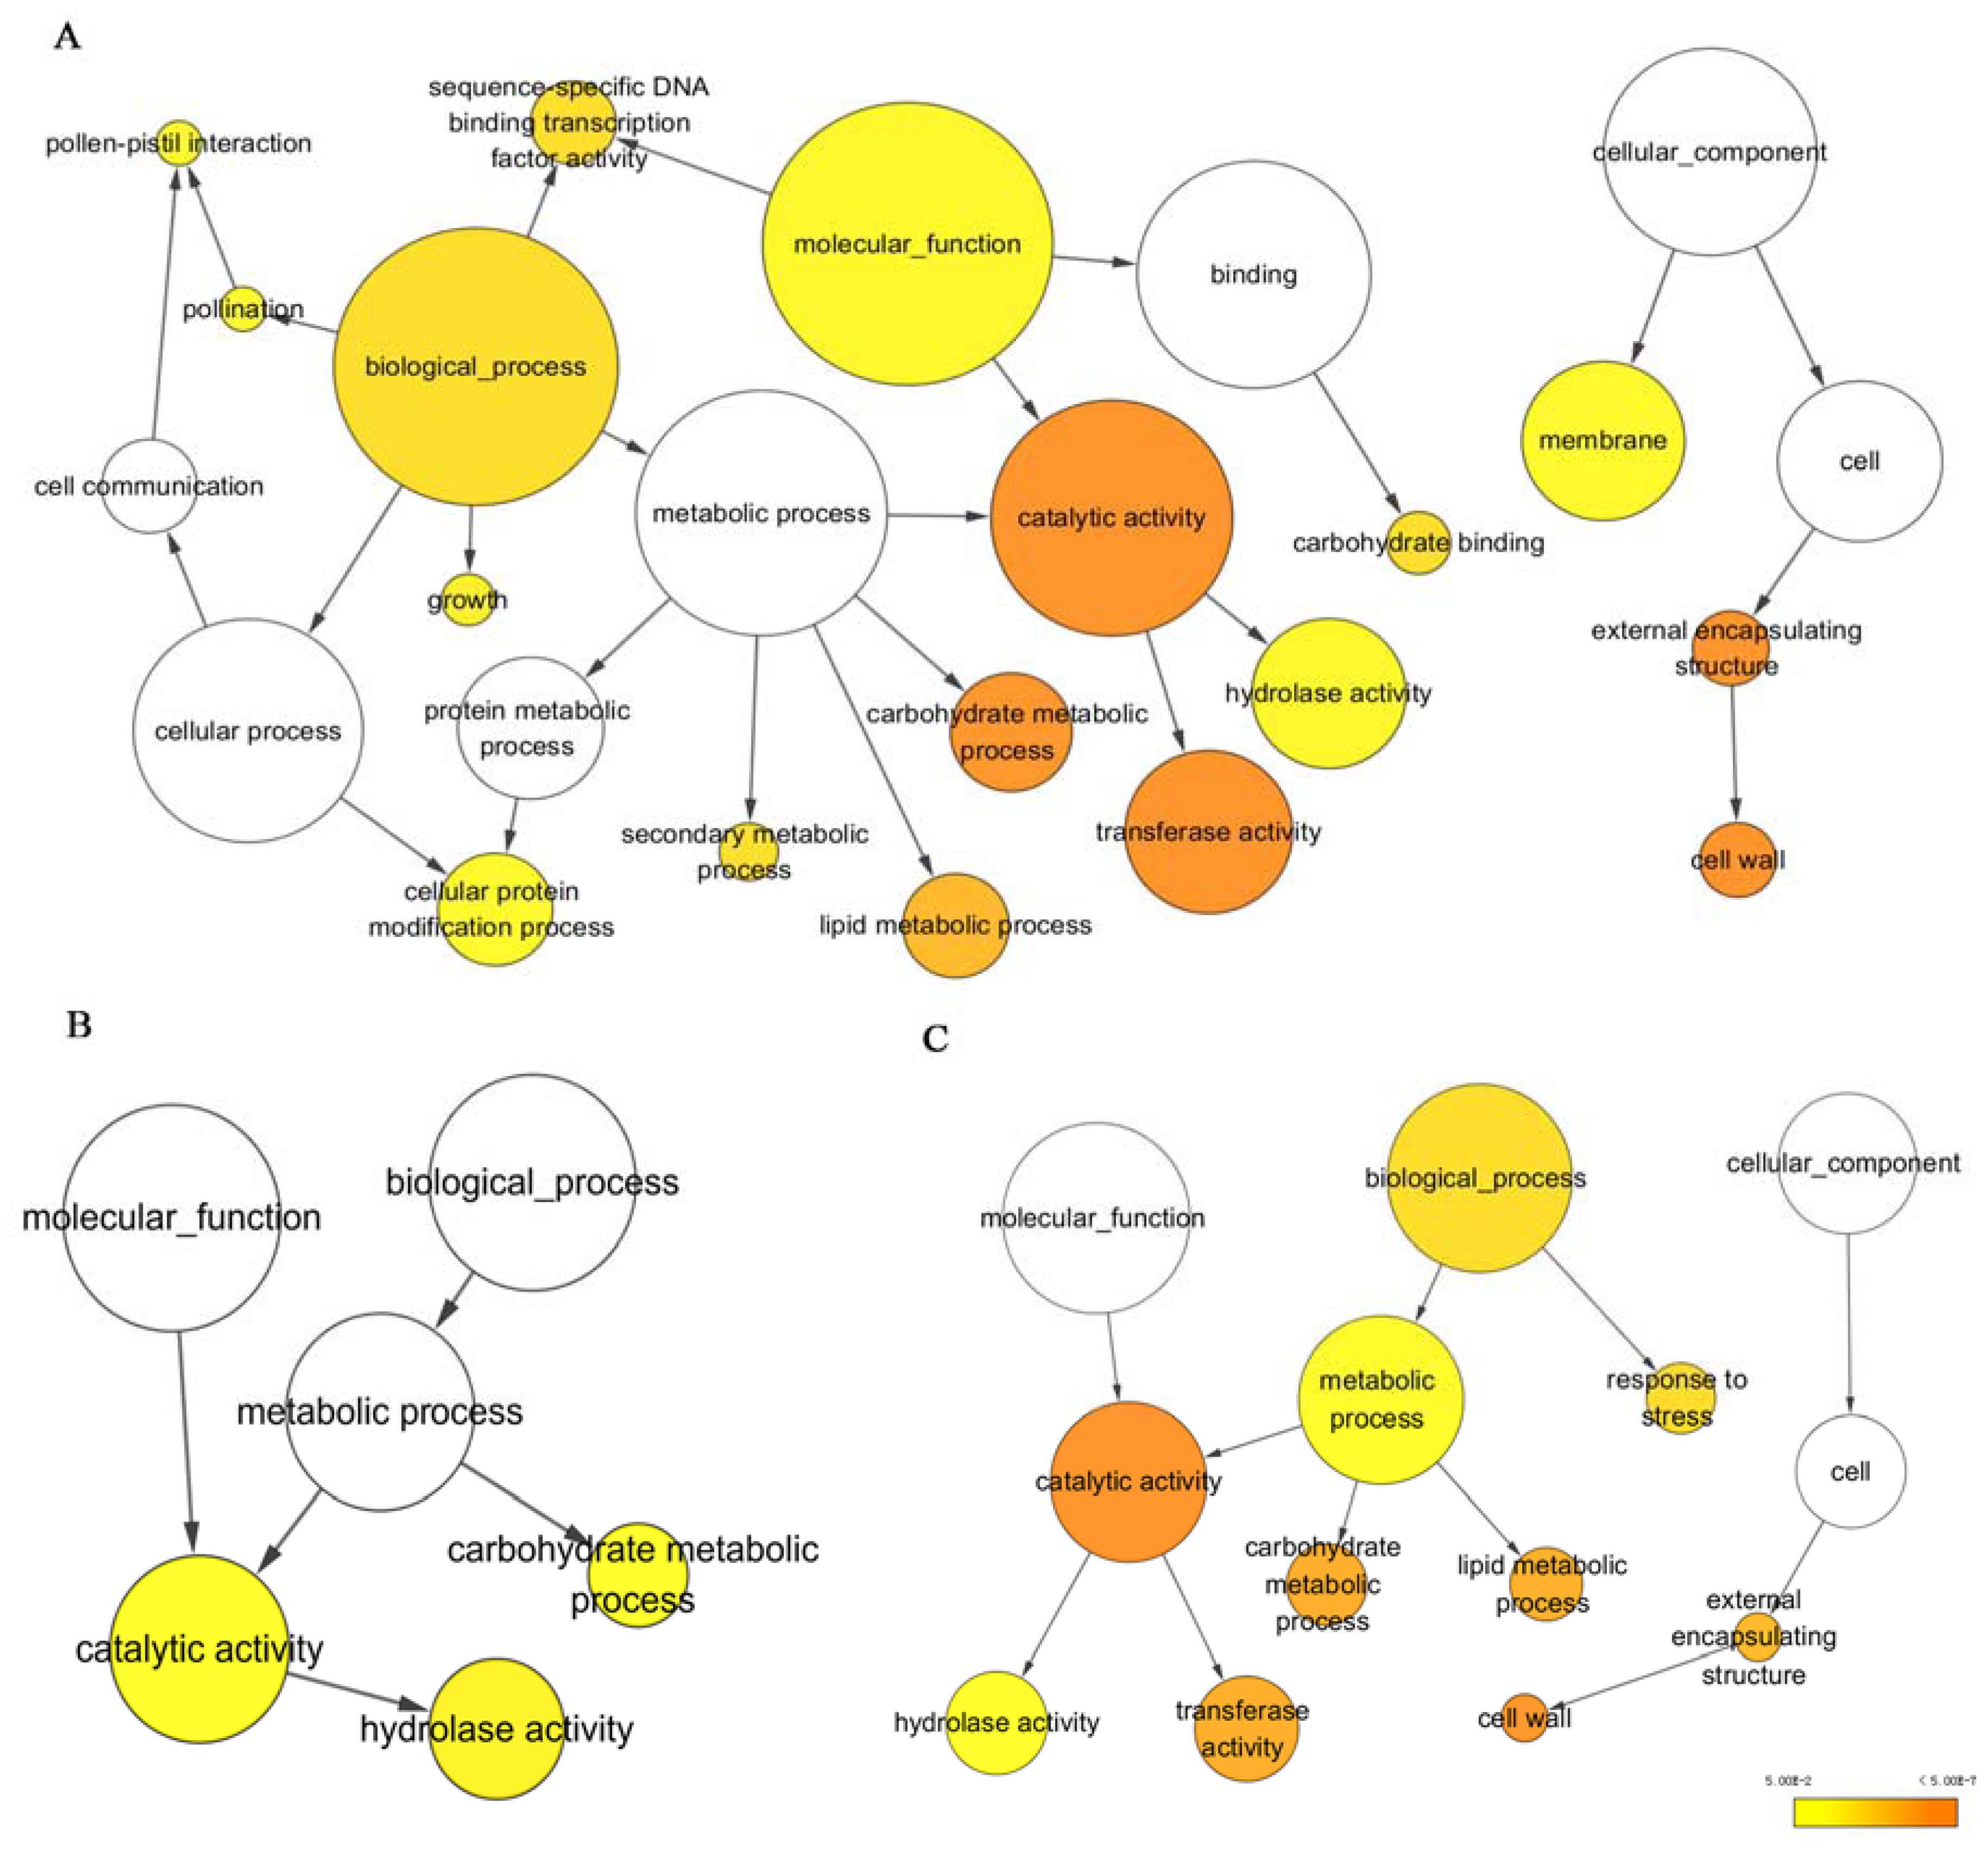
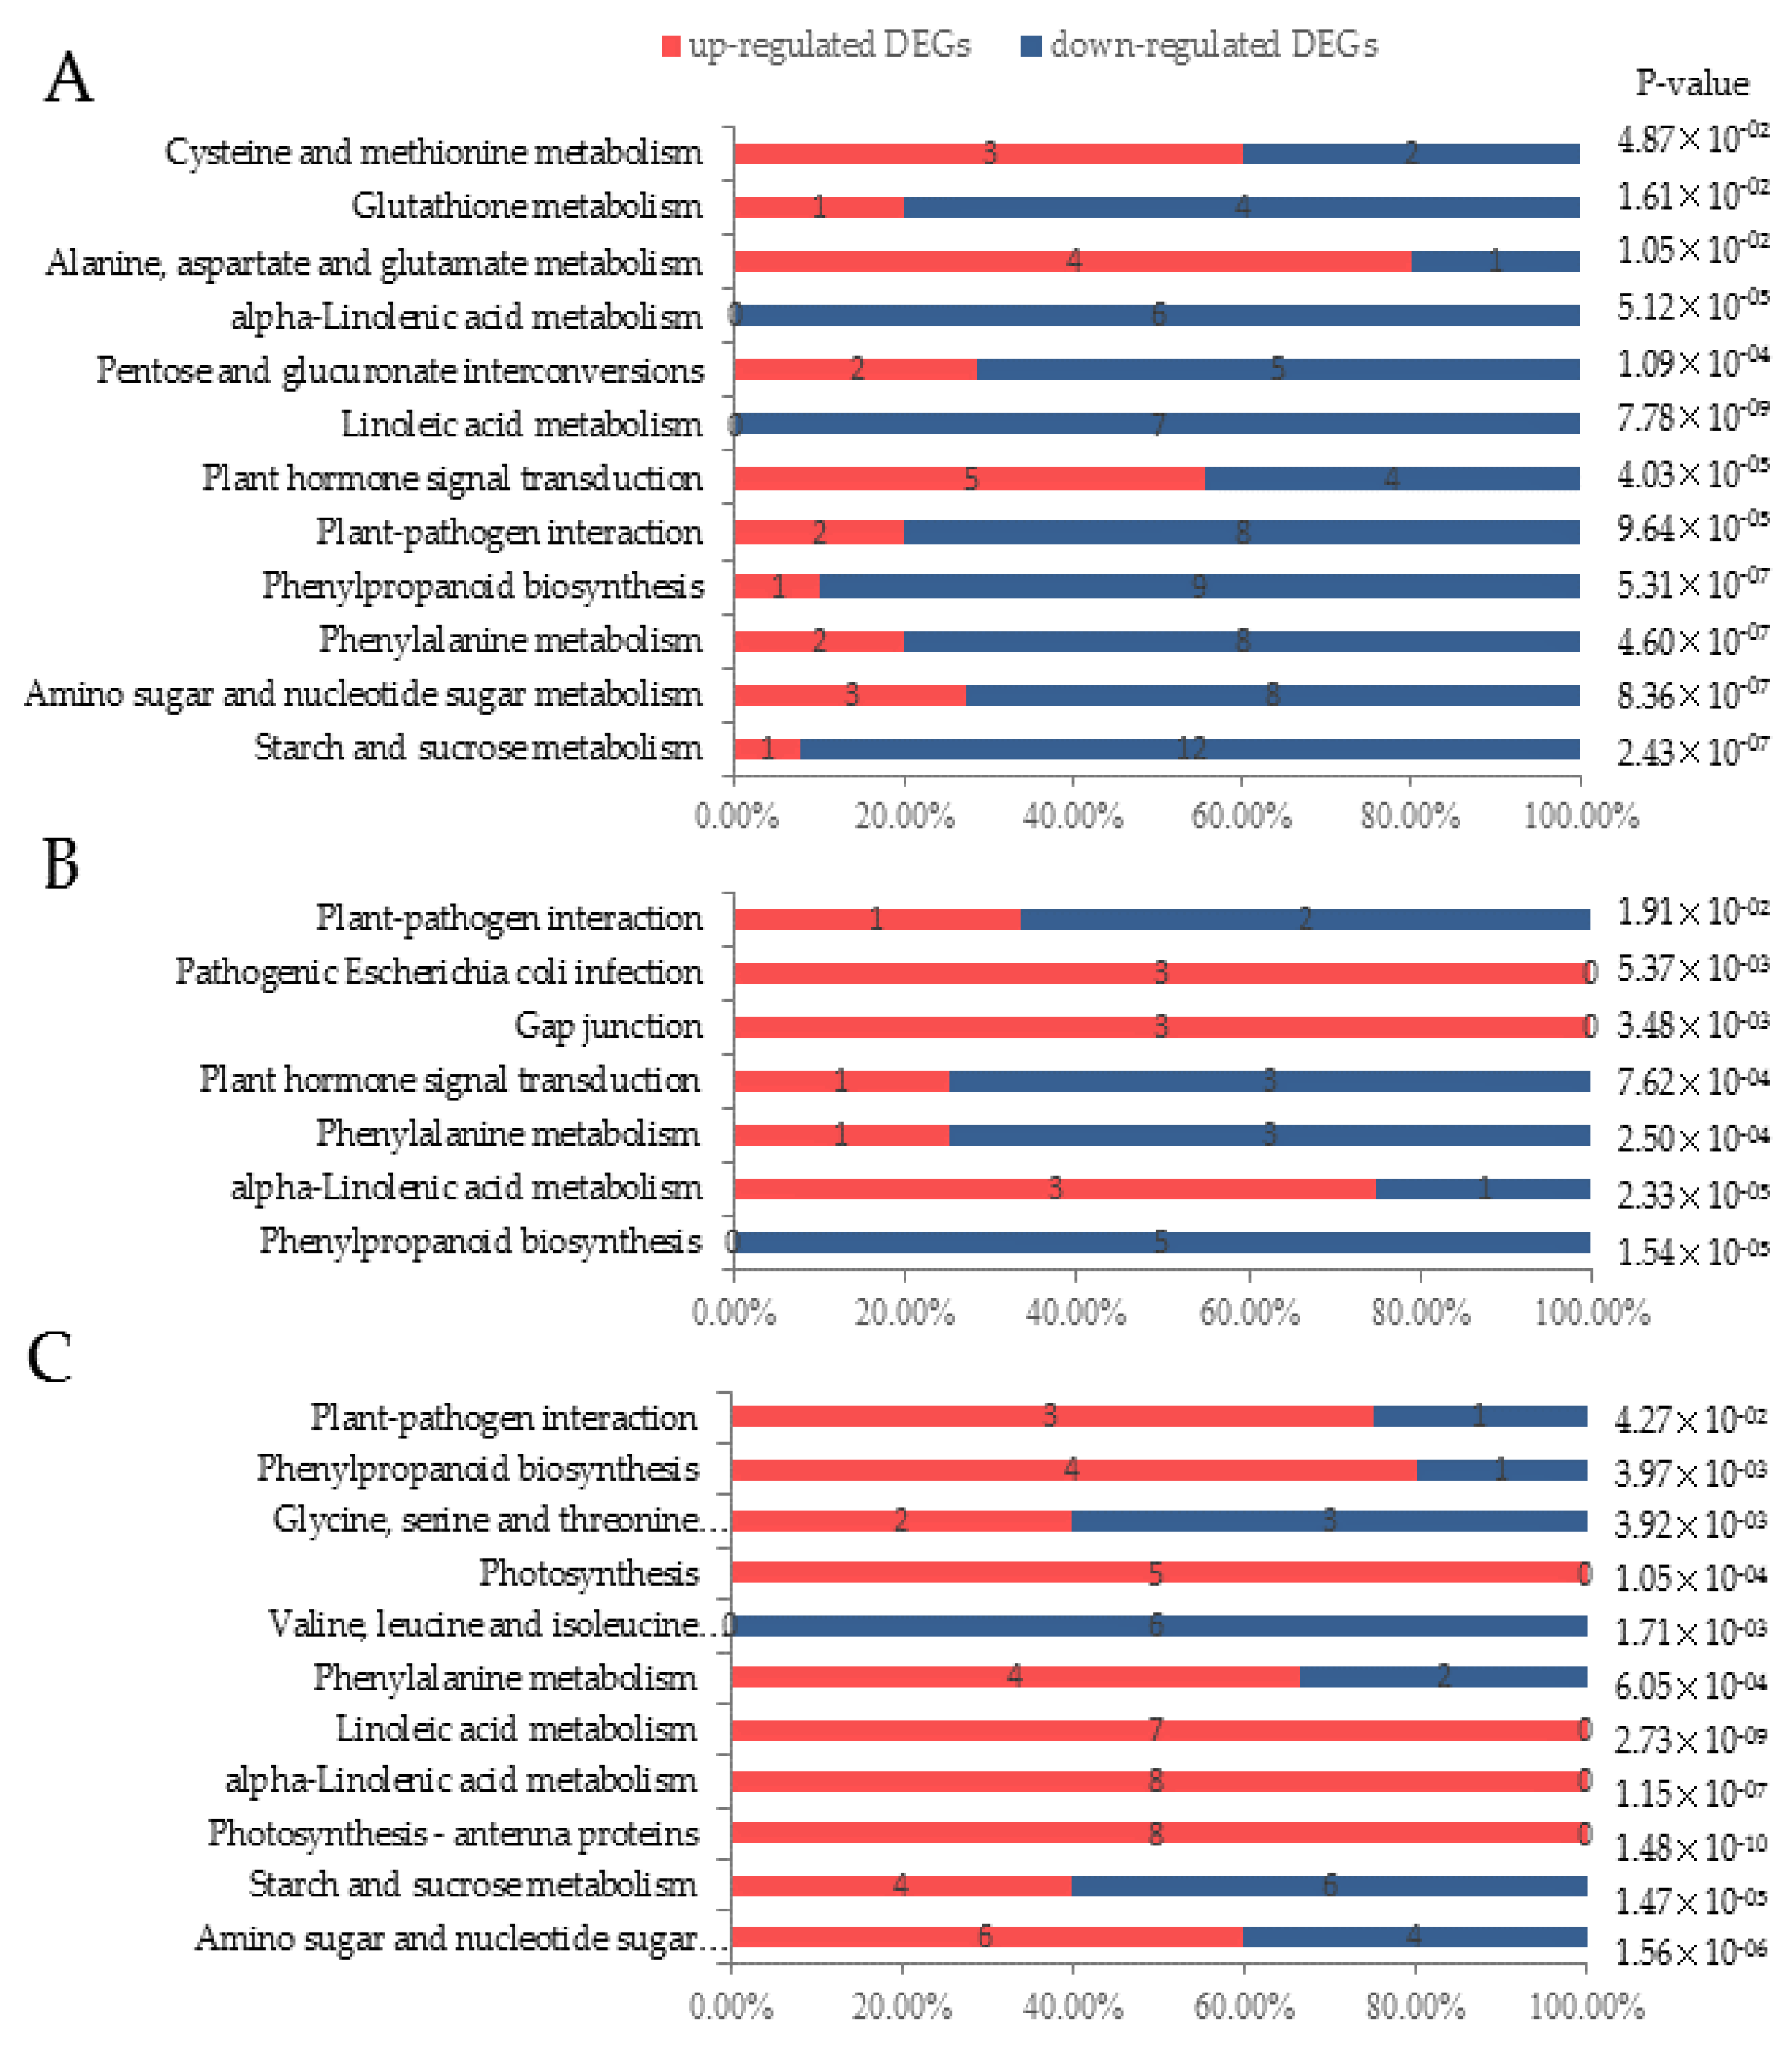
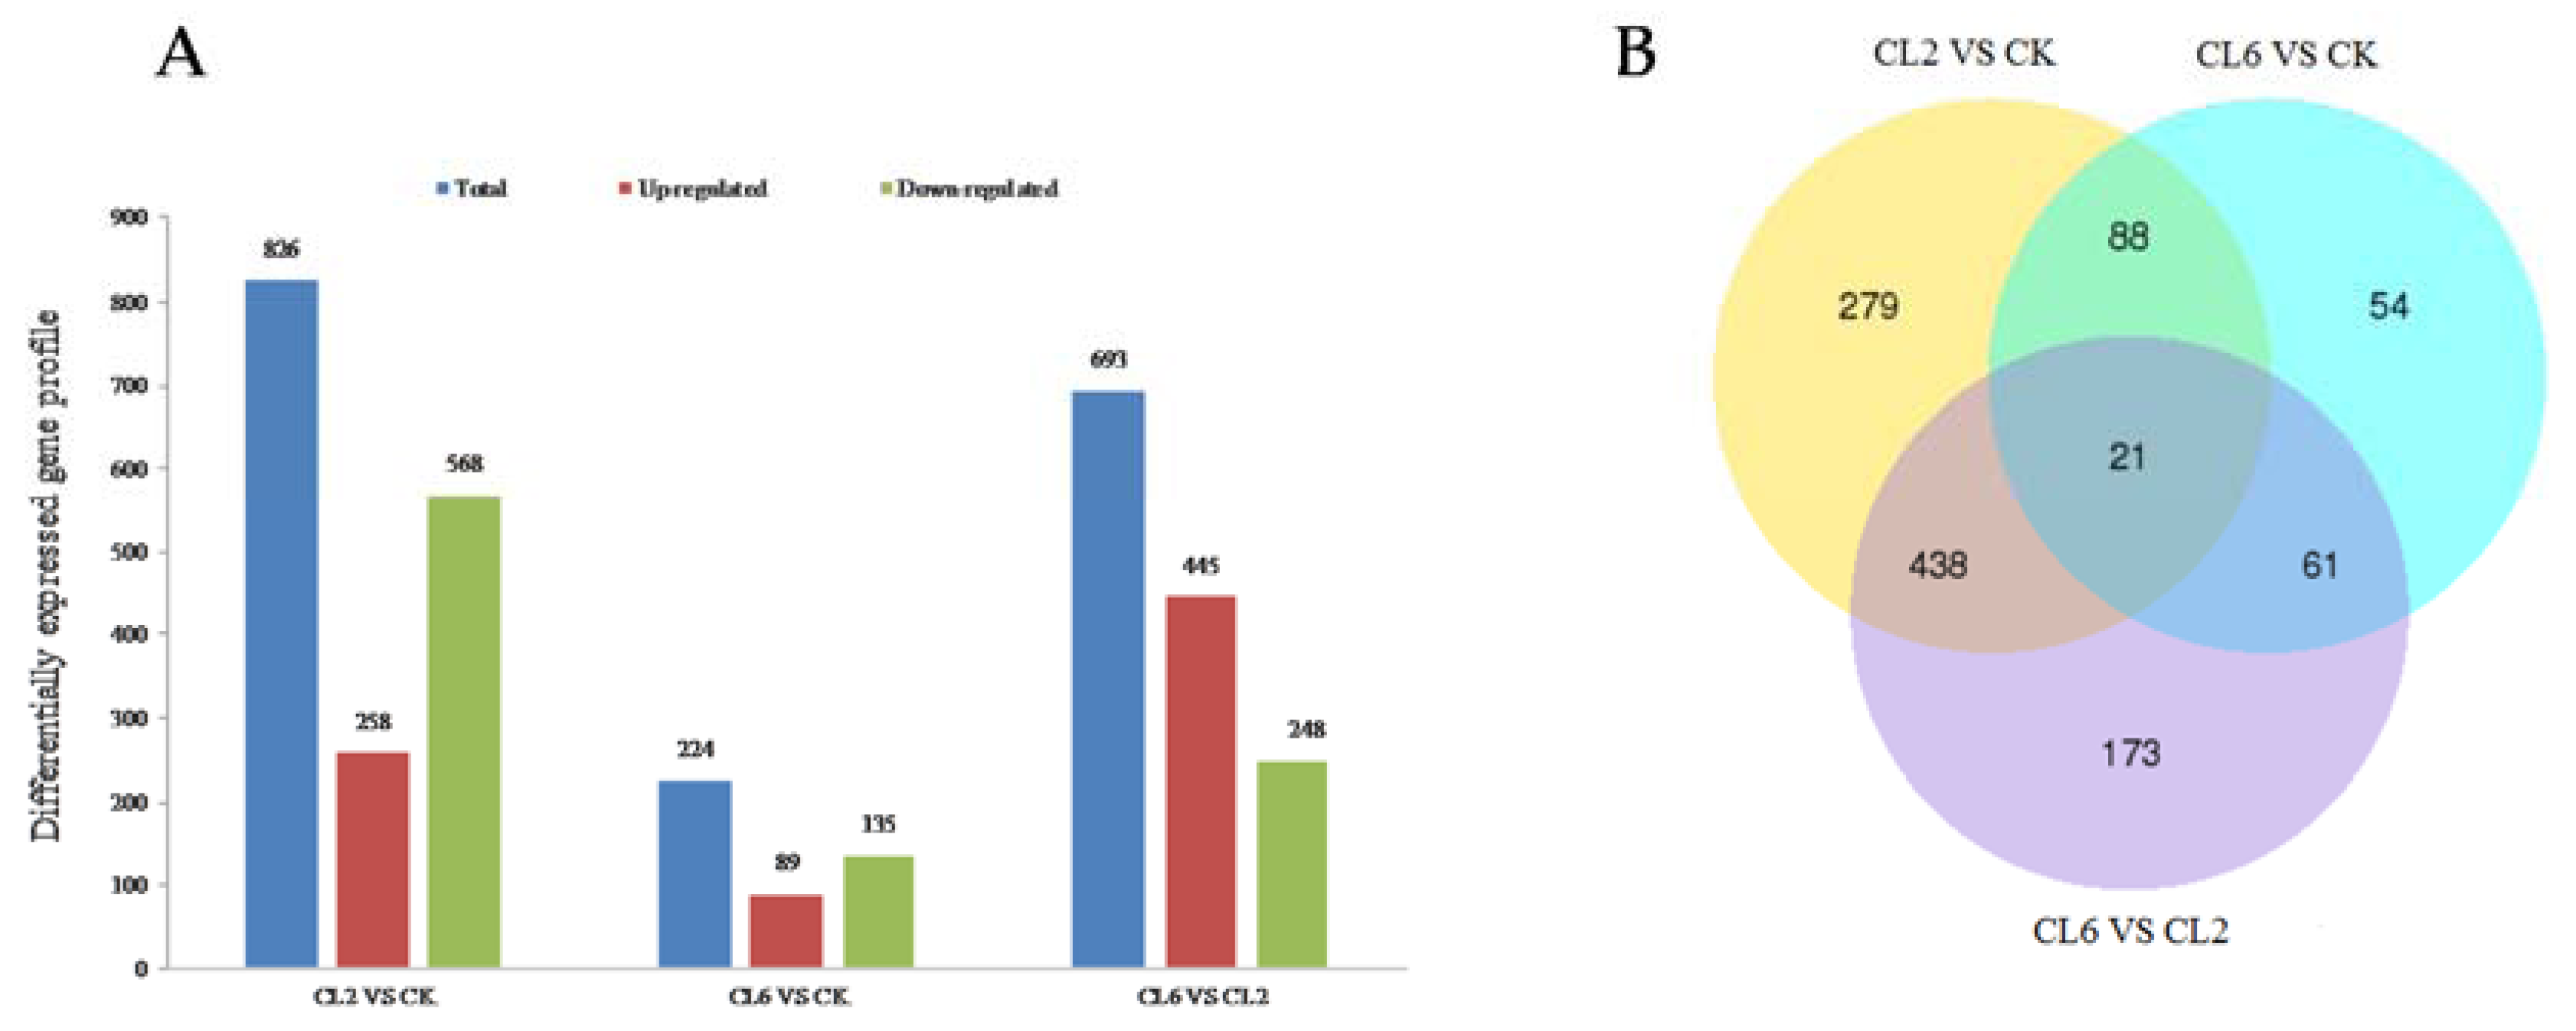
3.3. Digital Gene Expression Library Sequencing

To research the DGE profiles of salt-stressed N. sibirica Pall., three DGE libraries (CK, CL2 and CL6) were constructed and sequenced using Illumina deep sequencing technology. Specifically, variations in the gene expression of leaves were analysed under different amounts of salt stress. In total, the CK, CL2 and CL6 DGE libraries generated 17.9 million, 14.8 million and 16.2 million raw reads, respectively. Approximately 14.7 million (0.74 G) to 17.8 million (0.89 G) clean reads were obtained by removing low-quality reads. The GC proportion of each library was similar (approximately 45%) (Table 3).
The amount of the reads mapped to the transcripts in each sample were 16,622,090 (CK), 13,714,511 (CL2) and 15,023,640 (CL6), accounting for 93.03%, 93.03% and 92.98% of transcripts mapped, respectively (Table 3). The gene expression level of the different treatments was determined by number of concentrations using expected number of fragments per kilobase of transcript sequence per million base pairs sequenced (FPKM). The differences in expression of each sample were evaluated by the overall distribution (Figure 3A) and overall dispersion (Figure 3B) of expression quantity.
To explore the response of the differentially expressed genes of N. sibirica Pall. to salt stress, digital gene expression profiling of CK, CL2 and CL6 samples was used for differential expression analysis. DEGs were determined by applying the screening thresholds of q value < 0.005 and |log2(fold change)| > 1. Based on this analysis, a total of 826 significant DEGs were detected between CL2 and CK; among these DEGs, 258 were significantly up-regulated, and 568 were down-regulated. The comparison of CL6 with CK revealed that 89 genes were significantly up-regulated, and 135 genes were down-regulated. In addition, 445 genes were up-regulated, and 248 genes were down-regulated in CL6 compared with CL2. Furthermore, CL6 vs. CL2 resulted in the most up-regulated DEGs, whereas CL6 vs. CK resulted in the most down-regulated DEGs (Figure 4A). The differentially expressed genes (DEGs) of different treatments were divided based on cluster analysis (Figure S3). A Venn diagram was constructed that demonstrates the number of DEGs. The diagram shows that 21 genes were common among the three groups, and 279, 54, and 173 genes were identified only in the CL2 vs. CK, CL6 vs. CK and CL6 vs. CL2 groups, respectively (Figure 4B).
BiNGO, a plugin of Cytoscape, was used to analyse the GO functional enrichment analysis for all DEGs between different treatments to evaluate the ontologies in biological networks [56]. GO-slim plant terms were selected for the namespace of BiNGO to clearly describe the GO enrichment network [61]. The GO network of DEGs in CL2 vs. CK, CL6 vs. CK and CL6 vs. CL2 is shown in Figure 5 and Table S6. The functions of highly expressed DEGs in CL2 vs. CK, CL6 vs. CK and CL6 vs. CL2 focused on the GO terms of hydrolase activity, catalytic activity and carbohydrate metabolic process. Most of the GO terms in CL6 vs. CL2 were associated with transferase activity, lipid metabolic process, external encapsulating structure, and cell wall, which were also over-represented in CL2 vs. CK. The GO terms of membrane, sequence-specific DNA binding transcription factor activity, carbohydrate binding, secondary metabolic process, growth, and cellular protein modification process, among others, were significantly enriched only in CL2 vs. CK. In contrast to CL2 vs. CK, the GO term “response to stress” was over-represented only in CL6 vs. CL2. The GO term “catalytic activity” played an important role in the biological processes of the different treatments, and the number of genes associated with it in CL2 vs. CK was approximately three-fold higher than the number in CL6 vs. CK.
The KEGG pathway network was used to reveal the altered metabolic pathways of DEGs among the different treatments. Specific significantly enriched KEGG pathways were discerned on the basis of the p-value. The results show that 24, 14 and 26 pathways were identified to be significantly changed in the comparison of CL2 vs. CK, CL6 vs. CK and CL6 vs. CL2, respectively (Table S7). At the same time, the starch and sucrose metabolism, phenylpropanoid biosynthesis, amino sugar and nucleotide sugar metabolism and starch and sucrose metabolism pathways contained the most unigenes (13, 5, 10, 10) when comparing CL2 vs. CK, CL6 vs. CK and CL6 vs. CL2 (Figure 6). In contrast, with CK, the unigene numbers related to the starch and sucrose metabolism, amino sugar and nucleotide sugar metabolism, phenylalanine metabolism, phenylpropanoid biosynthesis, and plant-pathogen interaction pathways showed a significant decrease in CL2, while the number of unigenes in the plant hormone signal transduction and alanine, aspartate, and glutamate metabolism pathways presented an increasing trend. In the comparison of CL6 vs. CK, the phenylpropanoid biosynthesis pathway contained the most down-regulated DEGs.

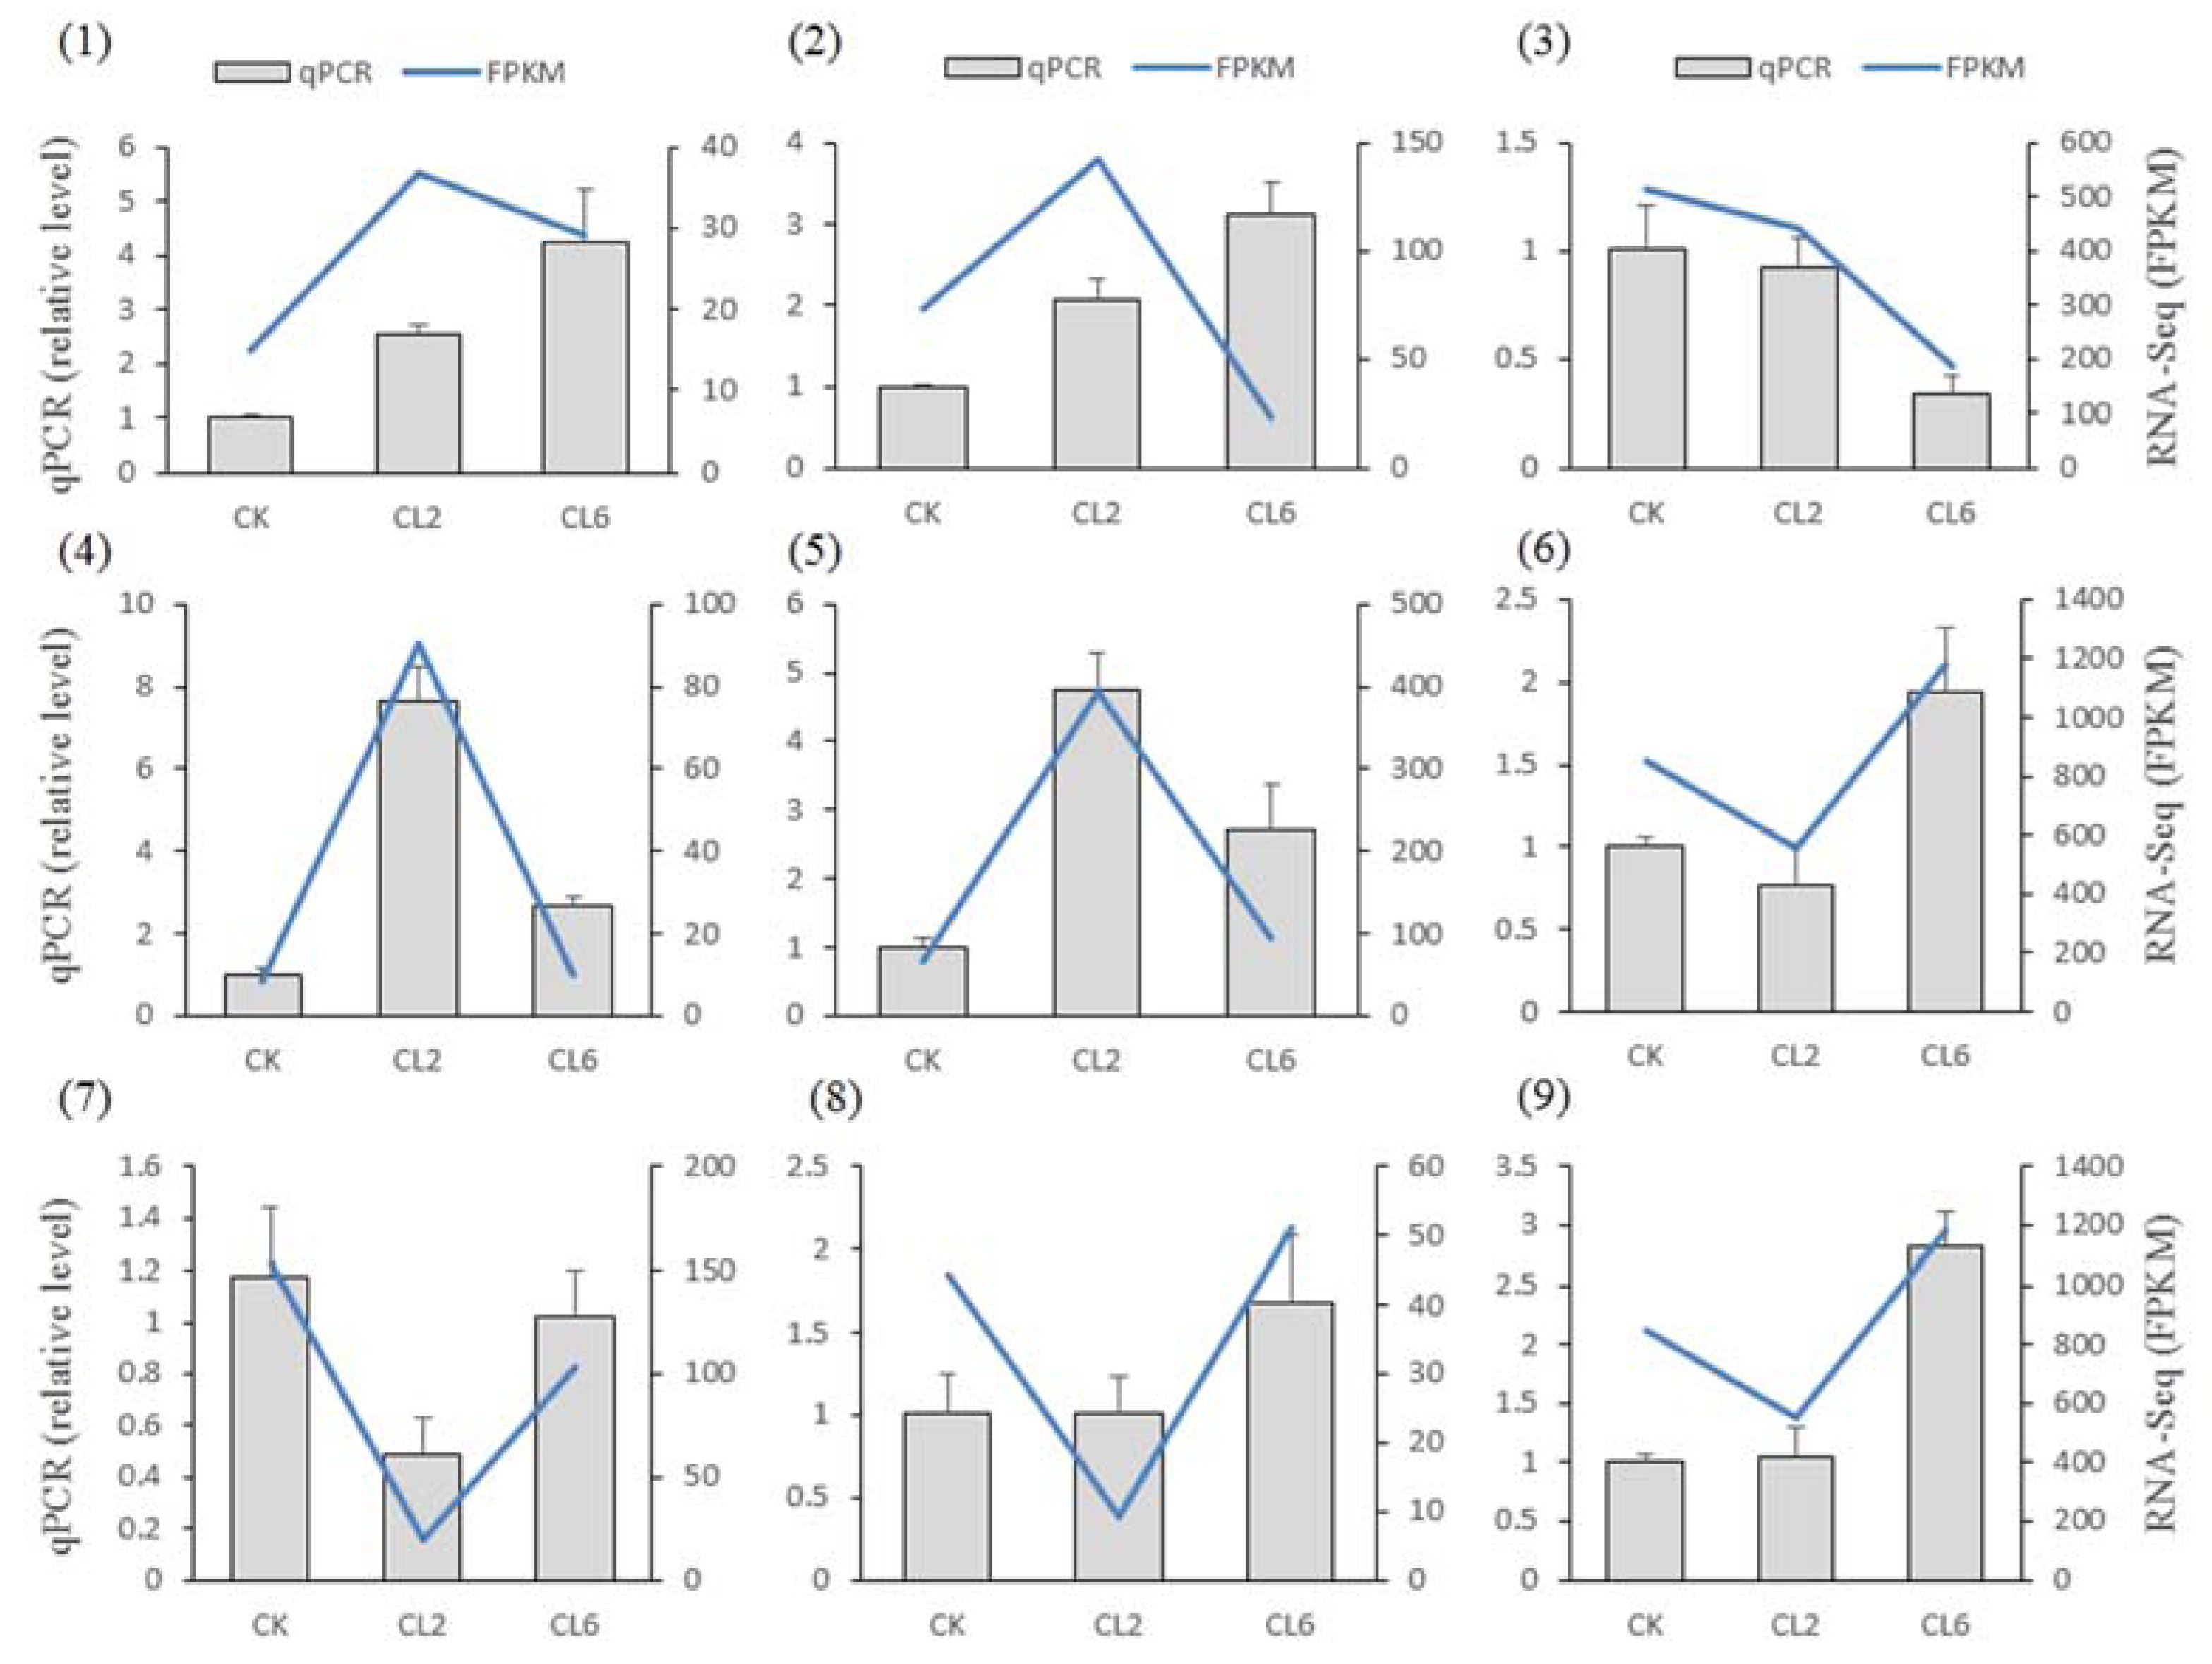
3.4. Verification of the RNA-Seq Results by qPCR

To test the validity of the data generated using the Illumina sequencing platform, quantitative PCR (qPCR) analysis was performed. A total of nine representative transcripts related to ATP synthase, ion transport, and basic-leucine zipper transcription, among others, were selected for qPCR analysis. The results of the qPCR and digital gene expression are shown in Figure 7. From the results, we can see that among the nine detected transcripts, seven transcripts show the same performance, while the c57026_g1 (1) and c61353_g2 (2) genes display the opposite behaviours in CL2 and CL6, respectively. Therefore, the results of the digital gene expression (DGE) analysis are reliable overall. The different detection methods and different sampled plants may explain the differences in fold changes between the qPCR and DGE results.

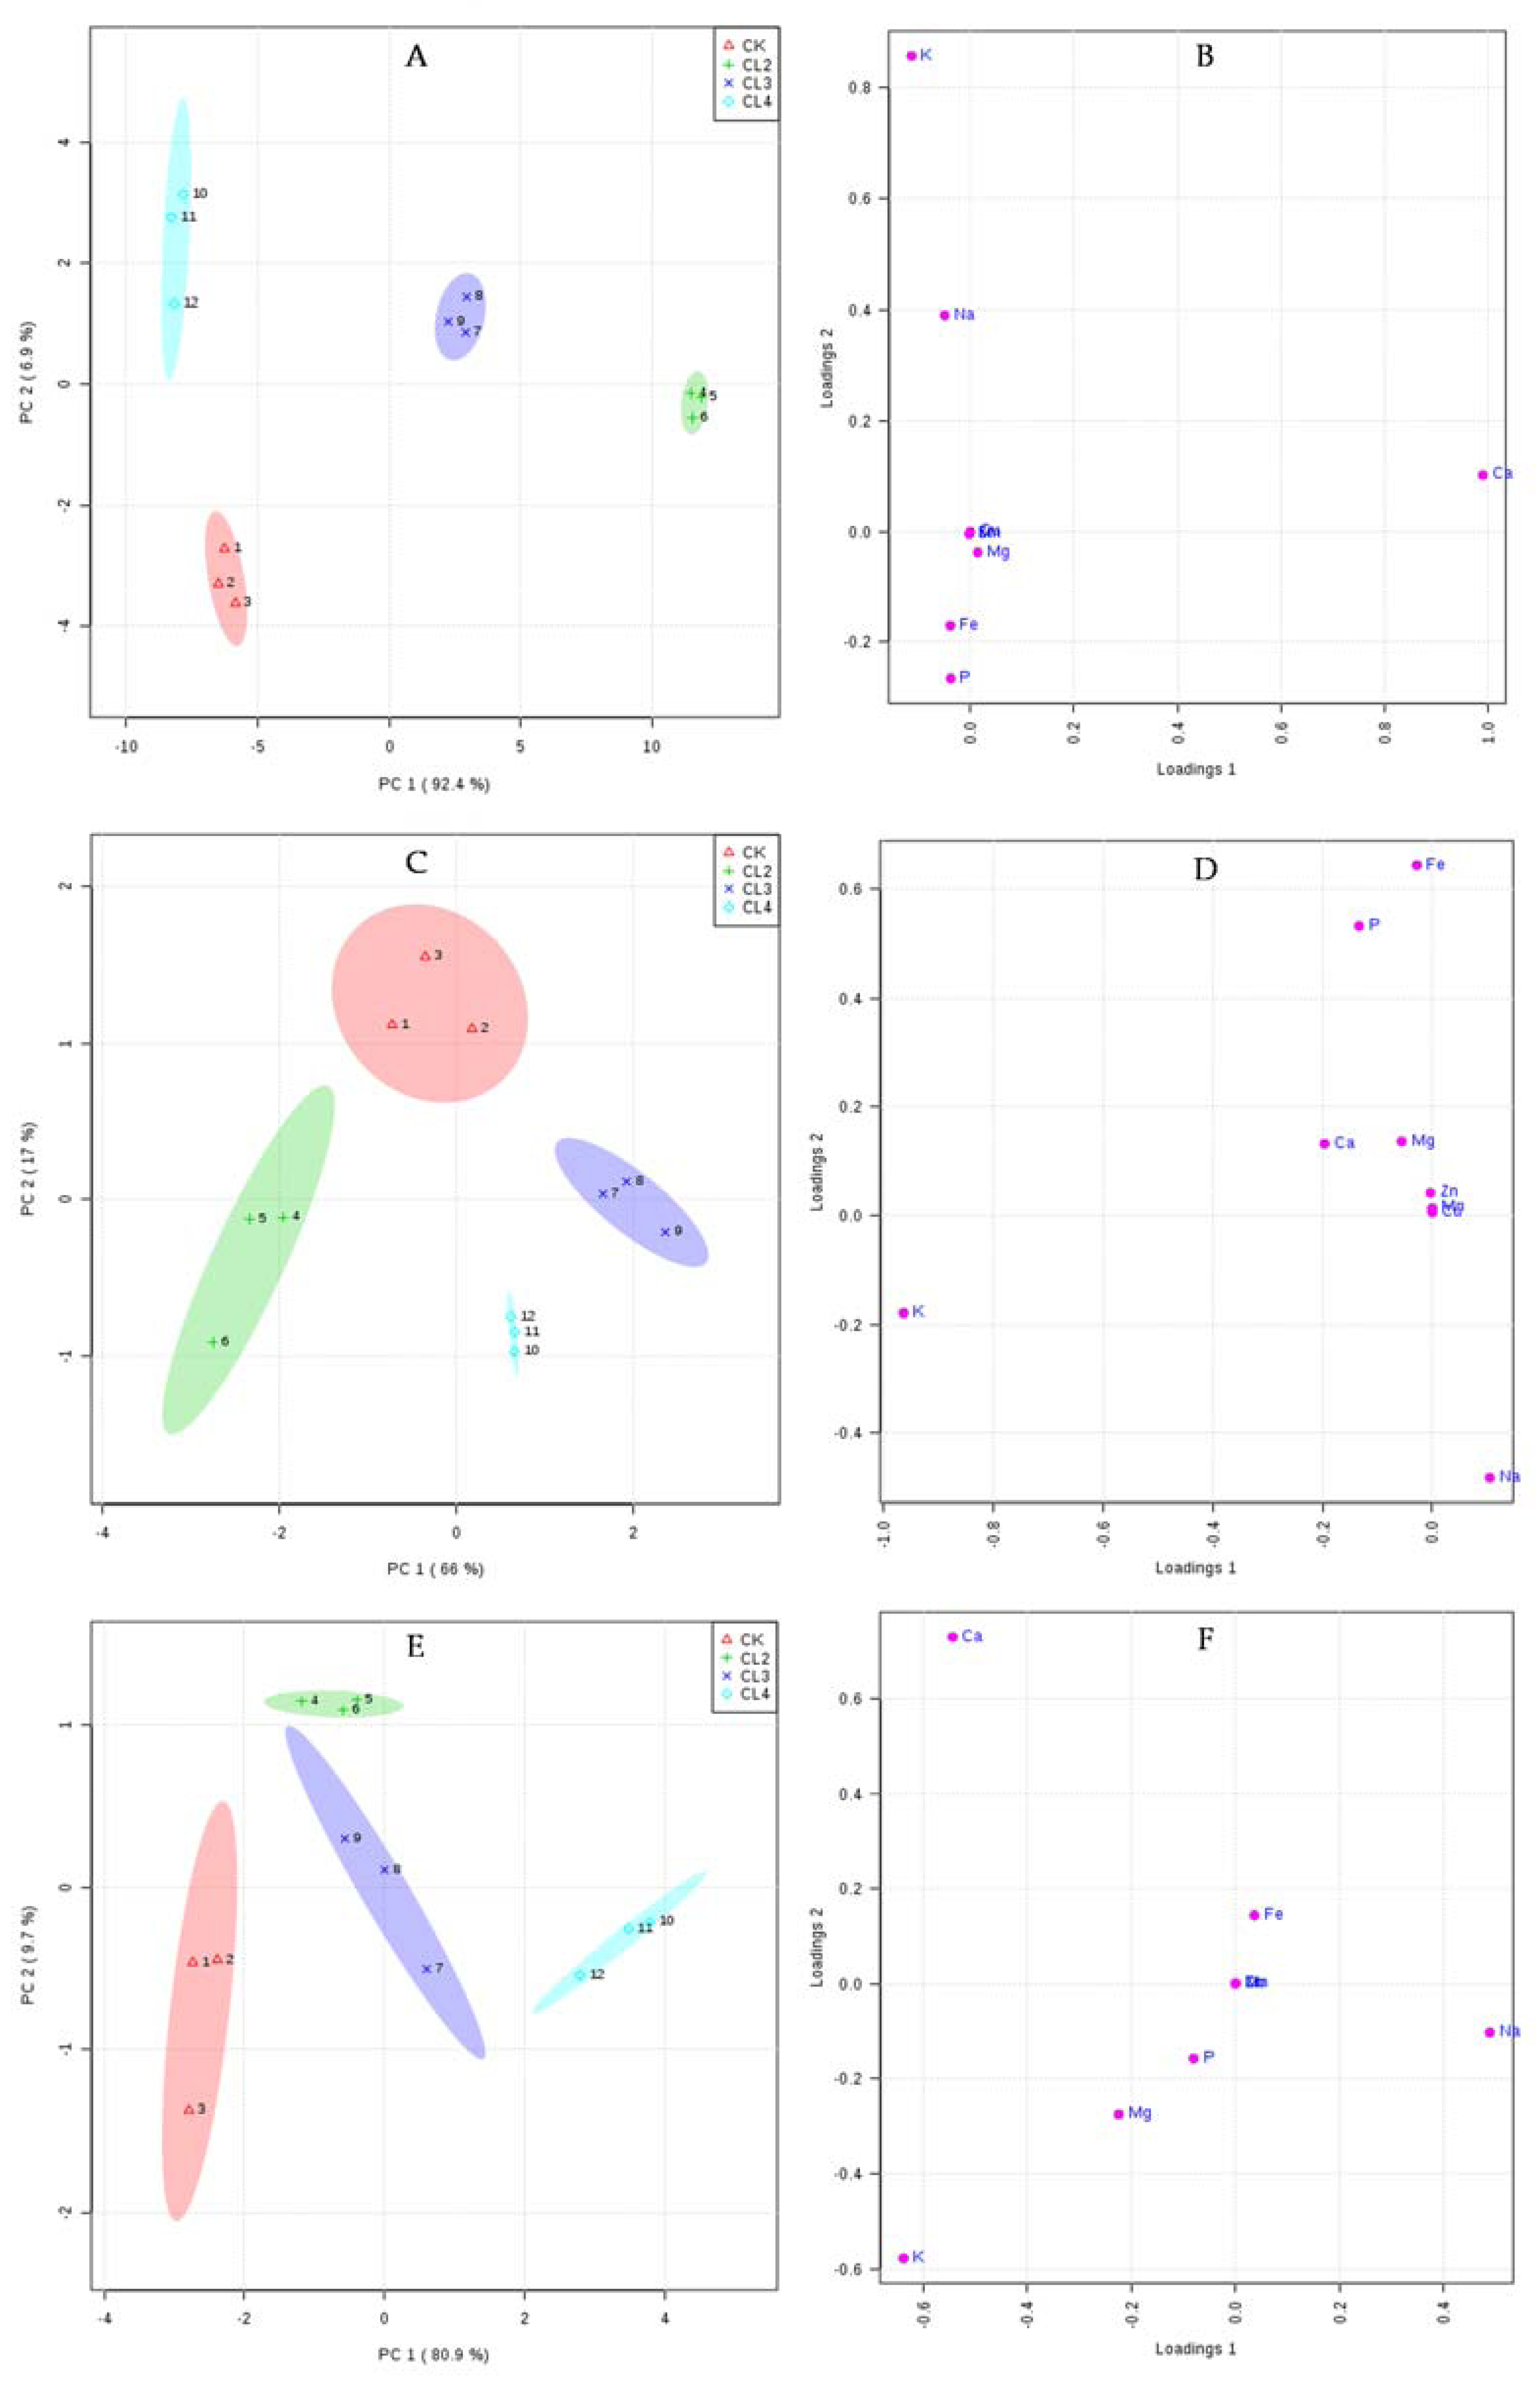
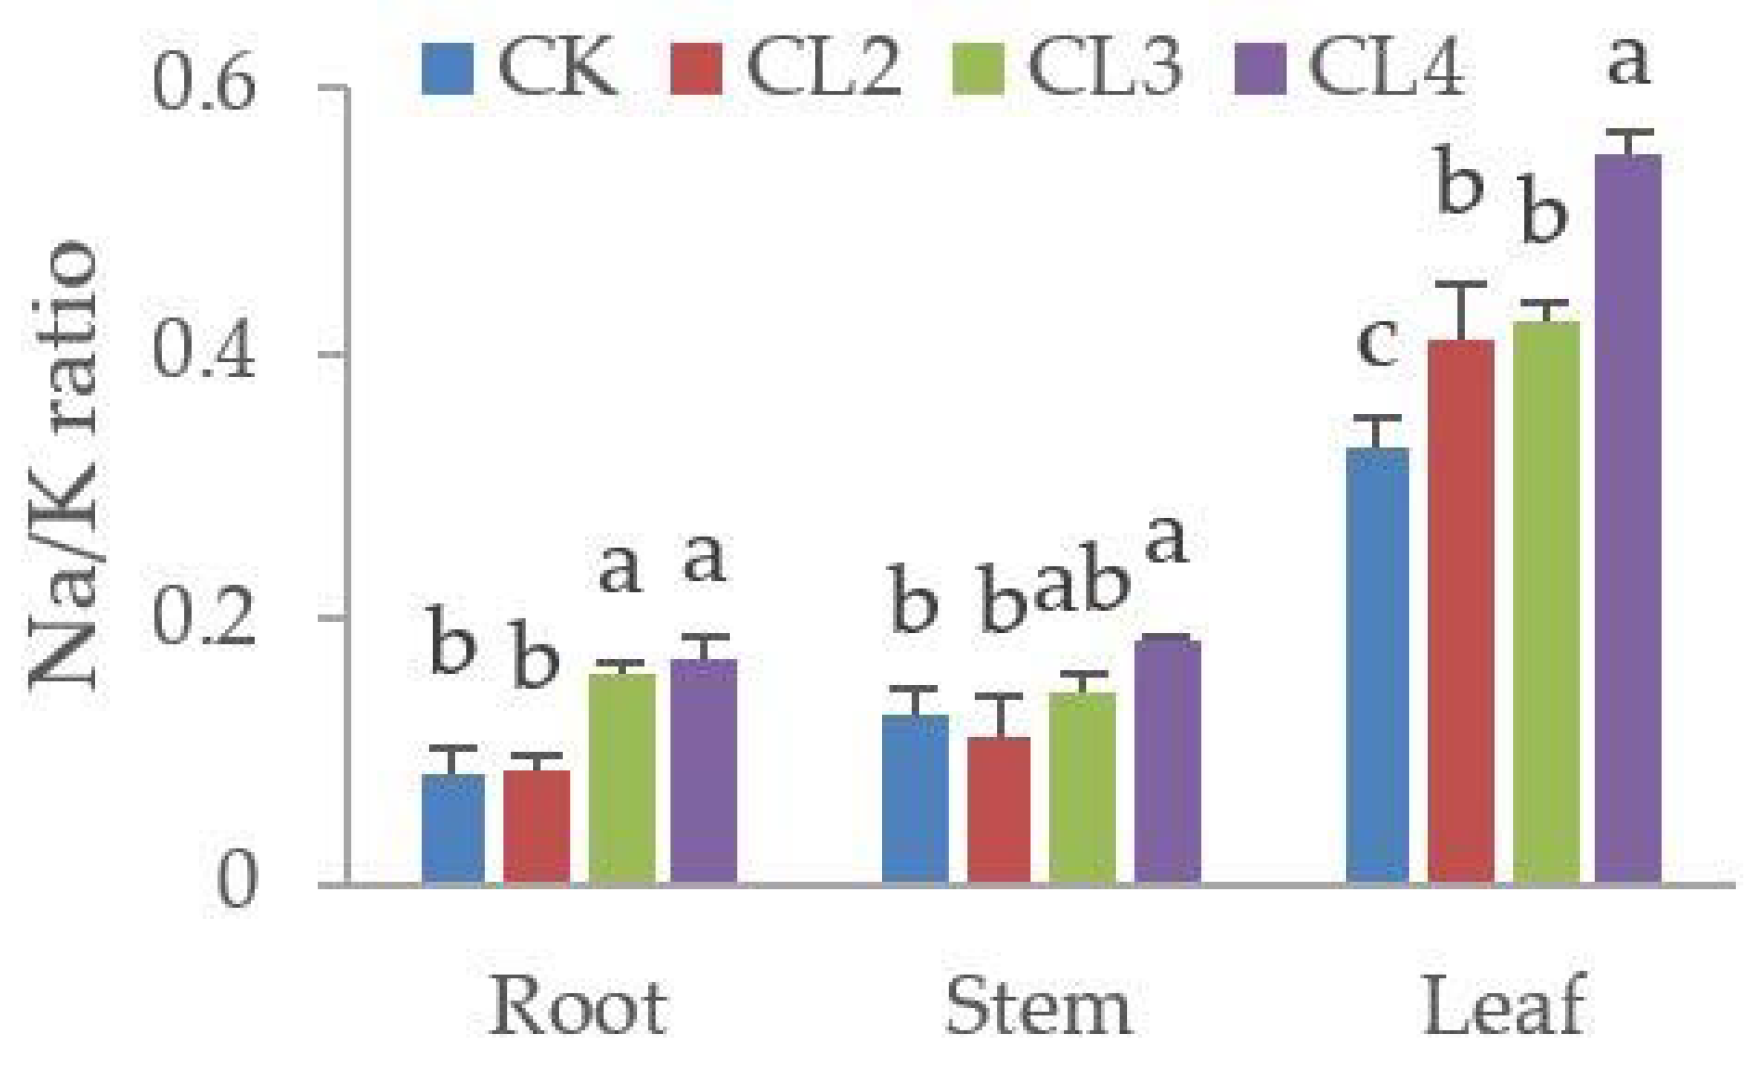
3.5. The Influence of Salt Stress on the Ionome of N. sibirica Pall.

Principal component analysis (PCA) was conducted on the element contents to show an overall view of ionomic responses of roots, stems and leaves under different treatments. A distinct separation of samples between different treatments was revealed by PCA (Figure 8). The different treated samples of roots, stems and leaves were clearly separated by the first principal component (PC1), representing 92.4%, 66.0% and 80.9% of the total variation, respectively (Figure 8A,C,E). The major elements that contributed to PC1 were Ca in the root ionome, K in the stem ionome, and both K and Ca in the leaf ionome (Figure 8B,D,F). Correspondingly, treatment differences were reflected by PC2, which clearly separated the samples of CK, CL2, CL3 and CL4 in the roots, stems and leaves, explaining 6.9%, 17.0% and 9.7% of the variation, respectively (Figure 8A,C,E). The contribution of elements to PC2 was dominated by K in the root ionome. Fe and P contents contributed to variation in shoots, while Ca and K contents were dominant in the shoot ionome (Figure 8B,D,F). The response of element contents to salt stress clearly varied with different treatments.
After salt stress, Na content in roots significantly increased from 1.33 to 3.53 mg/g averaged across the different treatments. The contents of Fe, Mg, P, Mn, Cu and Zn in the roots of CL2, CL3 and CL4 were significantly reduced in comparison with those of CK. In stems, Na content also increased, while the other element contents decreased under high salt stress (CL3 and CL4). In leaves, the Na content significantly increased by 37.7% in leaves from CK to CL4. Notably, the Ca and K content were significantly reduced by 14.4% and 16.9% from CK to CL4, respectively. The Mg, P and Mn contents also significantly decreased under salt stress (Table 4). The Na/K ratios of N. sibirica Pall. in different tissues under salt stress were all less than 1. With the increase in salt concentration, the Na/K ratios showed a tendency to increase. The Na/K ratios in leaves were higher than those in stems and roots (Figure 9), which shows that Na uptake affects the absorption and transportation of K. Only two elements each in the roots, stems and leaves (Mn and Ca, Fe and K, Zn and P, respectively) had a positive correlation with Na in the CL4 treatment, while for control roots, stems and leaves, there were six, four and eight kinds of elements, respectively, that had a positive correlation with Na (Table S3). The results clearly indicated that high salt stress had a great influence on the absorption of elements by plants.

4. Discussion

Many studies have explored the salt tolerance mechanism of N. sibirica Pall. High-throughput omics techniques have been widely used to research complex molecular responses underlying salt tolerance in plants [62], and transcriptome analysis has become an attractive alternative for in-depth research of the salt tolerance molecular mechanism of N. sibirica Pall. Therefore, in order to understand the mechanisms of salt tolerance in N. sibirica Pall., different treatments were used to investigate the molecular and ion content changes in response to salt stress. To our current knowledge, this is the first study to use de novo transcriptome assembly, DGE, and ionomics methods to explore the mechanisms of differentially expressed genes under salt stress.
The transcriptome of N. sibirica Pall. consisted of materials from different organs, and treatments were performed following the methods of Tian [63]. In our experiment, we obtained 137,421 unigenes, and 88,486 (64.39%) unigenes were annotated in at least one database; approximately 35.6% of the unigenes did not obtain a functional annotation, which may be due to the lack of genome of closely related species of N. sibirica Pall. A similar functional annotation situation exists with the transcriptome of Zygophyllum xanthoxylum which also belongs to Zygophyllaceae; the number of unigenes assigned to a GO term is 308,896, which was more than that of the Zygophyllaceae [64]. From the digital gene expression results, 826 and 224 genes were differentially expressed in CL2 and CL6 in comparison with CK, respectively. Of the DEGs, the down-regulated gene number was higher than the up-regulated gene number in CL2 and in CL6 in comparison with CK, which was opposite of the tendency in Gossypium aridum [65] and in Canola [66]; this phenomenon may be because N. sibirica Pall. is a halophyte.
The GO analysis of N. sibirica Pall. confirmed that carbohydrate metabolic processes, hydrolase activity and catalytic activity items contained some of the identified salt-responsive transcripts. Studies with the transcriptome of Gossypium hirsutum seedlings under salt stress also reported that most enriched categories referred to metabolism and signalling pathways, among others [67]. From the KEGG enrichment analysis, pathways involved in amino sugar and nucleotide sugar metabolism; plant hormone signal transduction; alanine, aspartate and glutamate metabolism; and alpha-linolenic acid metabolism, among others, were up-regulated, whereas those involved in starch and sucrose metabolism and phenylpropanoid biosynthesis, among others, were down-regulated under salt stress. Some genes were in agreement with a report that amino acid metabolism, secondary metabolism, signaling etc. related to salt-tolerance were down-regulated under salt stress [68]. In our study, the number of down-regulated genes in CL2 was more than in CL6 (Figure 6, Table S7). N. sibirica Pall. as a salt-diluting halophyte has a strong salt-tolerant capability that under light salt treatment for a short time (CL2) may not be serious or no stress, and only heavy salt treatment for a long time (CL6) may have a salt stress effect. Hence, CL6 led to the decrease of down-regulated genes compared to CL2.
Ion imbalance and oxidative stress in plants are caused by excess Na [13,25]. Regarding the ionic concentrations of N. sibirica Pall. under salt stress, Na and K content were significantly altered. With an increase of NaCl concentration, the Na concentration increased, and K concentration decreased in plant tissues in response to salt stress. A low Na/K ratio is a key feature of plant resistance to salt stress in saline environments [69,70]. In the current study, the Na/K ratios in the leaves and stems were higher than that in the roots, which is similar in Tibetan wild barley under salt stress [62], indicating that maintaining an optimal Na/K ratio could improve salt tolerance. Kirmizi and Bell [71] reported that nutrient element uptake and distribution in plant tissues are affected by salt stress. In this study, we also found that Ca, Cu, Fe, Mg, and K contents decreased in roots, stems and leaves under salt stress. Similar results have also been reported in which salt stress affects the uptake of Mg [27], Fe [30], Ca [72], and K [73], among others, by plants.
As previously mentioned, salt stress affects nutrient element absorption and distribution, with a subsequent impact on the deficiency of nutrient elements in plants. Amtmann and Armengaud reported that the deficiency of nutrient elements will affect metabolism [74]. Therefore, down-regulation of the KEGG pathways of N. sibirica Pall. under salt stress, including starch and sucrose metabolism, amino sugar and nucleotide sugar metabolism, and phenylalanine metabolism, may be due to a lack of nutrient elements. Glycolysis and amino acid synthesis were inhibited in roots, whereas they were enhanced in leaves of a salt-sensitive barley genotype under salt stress [33,75]. These differences may be because N. sibirica Pall. has a stronger salt tolerance ability than does barley. How the metabolite composition during metabolism is affected by NaCl stress will be studied in our future research.

5. Conclusions

In this study, we present the transcriptome profile of N. sibirica Pall. under salt stress using next-generation RNA-Seq technology and DGE deep-sequencing technology. De novo transcriptome assembly generated 137,421 unigenes. In total, 58,340 and 34,033 unigenes were annotated with GO terms and mapped to KEGG pathways, respectively. For the DGE, there were 826 and 224 DEGs in CL2 and CL6 compared to CK, respectively. The different terms and pathways of DEGs were revealed by GO category gene enrichment analysis and KEGG analysis in CL2, CL6 and CK. These DEGs also involved in signal transduction, transporters, cell wall and growth and defense metabolism involved in salt tolerance. We also used ionomics to analyse the absorption and distribution of ions affected by salt stress of N. sibirica Pall. Salt stress significantly affected uptake and distribution of Ca, Cu, Fe, Mg and K in different organs of N. sibirica Pall. The accumulation of Na and reduction of other elements caused osmotic stress and affected metabolism. To our current knowledge, this is the first time Illumina sequencing technology and high flux element analysis technology has been used to research the transcriptome, DEGs, and ionome involved in N. sibirica Pall. salt tolerance mechanisms in response to salt stress. The current study will provide an effective reference for future studies of salt tolerance genes and key metabolic pathways related to salt stress for extending our view of salt tolerance mechanisms in N. sibirica Pall.

Supplementary Materials

The following are available online at www.mdpi.com/1999-4907/8/6/211/s1. Figure S1: The length distribution of splicing unigenes, Figure S2: KEGG biochemical mappings for N. sibirica Pall., Figure S3: Hierarchical cluster analysis of DEGs of N. sibirica Pall. under salinity stress, Table S1: Statistics of unigene annotation results, Table S2: Species distribution of matched proteins in the Nr database (List of top 30 species), Table S3: The correlation coefficients between Na and other elements in different organs and treatments of N. sibirica Pall., Table S4: Results of the gene completeness assessment of the transcriptome assembly from CEGMA, Table S5: Primers used for quantitative PCR (qPCR) analysis, Table S6: Significantly over-representative GO terms for DEGs in different treatments (3 sheets), Table S7: Specific significantly enriched KEGG pathways for DEGs in different treatments (3 sheets).

Acknowledgments

The authors wish to thank the anonymous reviewers for their constructive comments. This research was financially supported by the National Science & Technology Pillar Program during the 12th Five-year Plan Period (Project No.2015BAD07B0102) and the National Key Research and Development Program of China (Project No. 2016YFC0501303).

Author Contributions

Huanyong Li, Xiuyan Yang and Huaxin Zhang conceived and designed the experiments; Huanyong Li and Xiuyan Yang performed the experiments, analyzed the data, and drafted the manuscript; Xiaoqian Tang aided in analyzing the data and performing the experiments; all authors have read and approved this version of the manuscript.

Conflicts of Interest

The authors declare no conflict of interest.

References

  1. Zhu, J.-K. Abiotic stress signaling and responses in plants. Cell 2016, 167, 313–324. [Google Scholar] [CrossRef] [PubMed]
  2. Zhu, J.-K. Salt and drought stress signal transduction in plants. Ann. Rev. Plant Biol. 2002, 53, 247–273. [Google Scholar] [CrossRef] [PubMed]
  3. Nawar, S.; Buddenbaum, H.; Hill, J. Estimation of soil salinity using three quantitative methods based on visible and near-infrared reflectance spectroscopy: A case study from Egypt. Arab. J. Geosci. 2015, 8, 5127–5140. [Google Scholar] [CrossRef]
  4. FAO. Global Network on Integrated Soil Management for Sustainable Use of Salt Affected Soils; FAO Land and Plant Nutricion Management Services: Rome, Italy, 2005. [Google Scholar]
  5. Munns, R. Genes and salt tolerance: Bringing them together. New Phytol. 2005, 167, 645–663. [Google Scholar] [CrossRef] [PubMed]
  6. Yan, K.; Shao, H.; Shao, C.; Chen, P.; Zhao, S.; Brestic, M.; Chen, X. Physiological adaptive mechanisms of plants grown in saline soil and implications for sustainable saline agriculture in coastal zone. Acta Physiol. Plant. 2013, 35, 2867–2878. [Google Scholar] [CrossRef]
  7. Suzuki, N.; Koussevitzky, S.; Mittler, R.; Miller, G. ROS and redox signalling in the response of plants to abiotic stress. Plant Cell Environ. 2012, 35, 259–270. [Google Scholar] [CrossRef] [PubMed]
  8. Yang, C.; Shi, D.; Wang, D. Comparative effects of salt and alkali stresses on growth, osmotic adjustment and ionic balance of an alkali-resistant halophyte Suaeda glauca (Bge.). Plant Growth Regul. 2008, 56, 179. [Google Scholar] [CrossRef]
  9. Li, H.; Li, D.; Chen, A.; Tang, H.; Li, J.; Huang, S. RNA-seq for comparative transcript profiling of kenaf under salinity stress. J. Plant Res. 2017, 130, 365–372. [Google Scholar] [CrossRef] [PubMed]
  10. Hamamoto, S.; Horie, T.; Hauser, F.; Deinlein, U.; Schroeder, J.I.; Uozumi, N. HKT transporters mediate salt stress resistance in plants: From structure and function to the field. Curr. Opin. Biotechnol. 2015, 32, 113–120. [Google Scholar] [CrossRef] [PubMed]
  11. Chen, S.; Polle, A. Salinity tolerance of populus. Plant Biol. 2010, 12, 317–333. [Google Scholar] [CrossRef] [PubMed]
  12. Sun, W.; Xu, X.; Zhu, H.; Liu, A.; Liu, L.; Li, J.; Hua, X. Comparative transcriptomic profiling of a salt-tolerant wild tomato species and a salt-sensitive tomato cultivar. Plant Cell Physiol. 2010, 51, 997–1006. [Google Scholar] [CrossRef] [PubMed]
  13. Munns, R.; Tester, M. Mechanisms of salinity tolerance. Annu. Rev. Plant Biol. 2008, 59, 651–681. [Google Scholar] [CrossRef] [PubMed]
  14. Gao, B.; Zhang, D.; Li, X.; Yang, H.; Zhang, Y.; Wood, A.J. De novo transcriptome characterization and gene expression profiling of the desiccation tolerant moss Bryum argenteum following rehydration. BMC Genom. 2015, 16, 416. [Google Scholar] [CrossRef] [PubMed]
  15. Bahieldin, A.; Atef, A.; Sabir, J.S.; Gadalla, N.O.; Edris, S.; Alzohairy, A.M.; Radhwan, N.A.; Baeshen, M.N.; Ramadan, A.M.; Eissa, H.F.; et al. RNA-seq analysis of the wild barley (H. Spontaneum) leaf transcriptome under salt stress. C. R. Biol. 2015, 338, 285–297. [Google Scholar] [CrossRef] [PubMed]
  16. Fan, X.-D.; Wang, J.-Q.; Yang, N.; Dong, Y.-Y.; Liu, L.; Wang, F.-W.; Wang, N.; Chen, H.; Liu, W.-C.; Sun, Y.-P.; et al. Gene expression profiling of soybean leaves and roots under salt, saline–alkali and drought stress by high-throughput Illumina sequencing. Gene 2013, 512, 392–402. [Google Scholar] [CrossRef] [PubMed]
  17. Postnikova, O.A.; Shao, J.; Nemchinov, L.G. Analysis of the alfalfa root transcriptome in response to salinity stress. Plant Cell Physiol. 2013, 54, 1041–1055. [Google Scholar] [CrossRef] [PubMed]
  18. Yao, D.; Zhang, X.; Zhao, X.; Liu, C.; Wang, C.; Zhang, Z.; Zhang, C.; Wei, Q.; Wang, Q.; Yan, H.; et al. Transcriptome analysis reveals salt-stress-regulated biological processes and key pathways in roots of cotton (Gossypium hirsutum L.). Genomics 2011, 98, 47–55. [Google Scholar] [CrossRef] [PubMed]
  19. Zhou, Y.; Yang, P.; Cui, F.; Zhang, F.; Luo, X.; Xie, J. Transcriptome analysis of salt stress responsiveness in the seedlings of dongxiang wild rice (Oryza rufipogon griff.). PLoS ONE 2016, 11, e0146242. [Google Scholar] [CrossRef] [PubMed]
  20. Atienza, S.G.; Faccioli, P.; Perrotta, G.; Dalfino, G.; Zschiesche, W.; Humbeck, K.; Stanca, A.M.; Cattivelli, L. Large scale analysis of transcripts abundance in barley subjected to several single and combined abiotic stress conditions. Plant Sci. 2004, 167, 1359–1365. [Google Scholar] [CrossRef]
  21. Barragán, V.; Leidi, E.O.; Andrés, Z.; Rubio, L.; De Luca, A.; Fernández, J.A.; Cubero, B.; Pardo, J.M. Ion exchangers NHX1 and NHX2 mediate active potassium uptake into vacuoles to regulate cell turgor and stomatal function in arabidopsis. Plant Cell. 2012, 24, 1127–1142. [Google Scholar] [CrossRef] [PubMed]
  22. Yang, Y.; Tang, R.J.; Jiang, C.M.; Li, B.; Kang, T.; Liu, H.; Zhao, N.; Ma, X.J.; Yang, L.; Chen, S.L.; et al. Overexpression of the PtSOS2 gene improves tolerance to salt stress in transgenic poplar plants. Plant Biotechnol. J. 2015, 13, 962–973. [Google Scholar] [CrossRef] [PubMed]
  23. Taji, T.; Seki, M.; Satou, M.; Sakurai, T.; Kobayashi, M.; Ishiyama, K.; Narusaka, Y.; Narusaka, M.; Zhu, J.-K.; Shinozaki, K. Comparative genomics in salt tolerance between arabidopsis and arabidopsis-related halophyte salt cress using arabidopsis microarray. Plant Physiol. 2004, 135, 1697–1709. [Google Scholar] [CrossRef]
  24. Singh, U.M.; Sareen, P.; Sengar, R.S.; Kumar, A. Plant ionomics: A newer approach to study mineral transport and its regulation. Acta Physiol. Plant. 2013, 35, 2641–2653. [Google Scholar] [CrossRef]
  25. Zhu, J.-K. Regulation of ion homeostasis under salt stress. Curr. Opin. Plant Biol. 2003, 6, 441–445. [Google Scholar] [CrossRef]
  26. Munns, R. Approaches to identifying genes for salinity tolerance and the importance of timescale. Methods Mol. Biol. 2010, 639, 25–38. [Google Scholar]
  27. Tavakkoli, E.; Fatehi, F.; Coventry, S.; Rengasamy, P.; McDonald, G.K. Additive effects of Na+ and Clions on barley growth under salinity stress. J. Exp. Bot. 2011, 62, 2189–2203. [Google Scholar] [CrossRef] [PubMed]
  28. Chen, Z.; Newman, I.; Zhou, M.; Mendham, N.; Zhang, G.; Shabala, S. Screening plants for salt tolerance by measuring K+ flux: A case study for barley. Plant Cell Environ. 2005, 28, 1230–1246. [Google Scholar] [CrossRef]
  29. Nazar, R.; Iqbal, N.; Masood, A.; Syeed, S.; Khan, N.A. Understanding the significance of sulfur in improving salinity tolerance in plants. Environ. Exp. Bot. 2011, 70, 80–87. [Google Scholar] [CrossRef]
  30. Yousfi, S.; Mahmoudi, H.; Abdelly, C.; Gharsalli, M. Effect of salt on physiological responses of barley to iron deficiency. Plant Physiol. Biochem. 2007, 45, 309–314. [Google Scholar] [CrossRef] [PubMed]
  31. Lotfi, N.; Vahdati, K.; Kholdebarin, B.; Hassani, D.; Amiri, R. Mineral composition of some walnut cultivars (Juglans regia L.) for evaluation of ionome and ionomics under salt stress condition. In I International Symposium on Biotechnology of Fruit Species: BIOTECHFRUIT2008; ISHS Acta Horticulturae 839: Dresden, Germany, 2008; pp. 293–300. [Google Scholar]
  32. Hill, C.B.; Jha, D.; Bacic, A.; Tester, M.; Roessner, U. Characterization of ion contents and metabolic responses to salt stress of different arabidopsis ATHKT1; 1 genotypes and their parental strains. Mol. Plant. 2013, 6, 350–368. [Google Scholar] [CrossRef] [PubMed]
  33. Wu, D.; Shen, Q.; Cai, S.; Chen, Z.-H.; Dai, F.; Zhang, G. Ionomic responses and correlations between elements and metabolites under salt stress in wild and cultivated barley. Plant Cell Physiol. 2013, 54, 1976–1988. [Google Scholar] [CrossRef] [PubMed]
  34. Shen, Q.; Fu, L.; Qiu, L.; Xue, F.; Zhang, G.; Wu, D. Time-course of ionic responses and proteomic analysis of a tibetan wild barley at early stage under salt stress. Plant Growth Regul. 2017, 81, 11–21. [Google Scholar] [CrossRef]
  35. Ni, J.W.; Wu, X.; Zhang, H.X.; Liu, T.; Zhang, L. Comparative analysis of salt tolerance of three Nitraria species. For. Res. 2012, 25, 48–53. [Google Scholar]
  36. Li, Q.H.; Wu, S.X.; Xu, J.; Ren, W.J.; Zhao, Y.M. Comprehensive evaluation on salt tolerance of different desert shrubs in Ulan Buh desert regions. Pratacult. Sci. 2012, 29, 1132–1136. [Google Scholar]
  37. Yang, S.; Zhang, H.-X.; Liu, T. Effect of salt stress on osmotic adjustment substances in plants. For. Res. 2012, 25, 269–277. [Google Scholar]
  38. Zhang, G.L. Effects of iso-osmotic salt and water stresses on growth and ionic absorption and distribution in Nitraria sibirica seedlings. Agric. Res. Arid Areas 2013, 31, 114–118. [Google Scholar]
  39. Rina, S.; Guilin, C. Effect of exogenous spermidine on antioxidant enzyme system in leaves of Nitraria sibirica pall. Seedlings under salt stress. Acta Bot. Boreali Occident. Sin. 2013, 33, 352–356. [Google Scholar]
  40. Cheng, T.L.; Li, H.Y.; Wu, H.W.; Liu, X.Z.; Wu, X.; Yang, S.; Zhang, H.X.; Yang, X.Y. Comparison on osmotica accumulation of different salt-tolerant plants under salt stress. For. Res. 2015, 28, 826–832. [Google Scholar]
  41. Wu, X.; Ni, J.; Zhang, H.; Liu, T.; Zhang, L. Effects of salt stress on osmotic adjustment substances in three species of Nitraria. J. Northeast Univ. 2012, 40, 44–47. [Google Scholar]
  42. Wang, L.; Li, F.-F.; Zhang, W.-B.; Chen, G.-L.; Lin, X.-F. Isolation and characterization of Nitraria sibirica actin gene. Acta Pratacult. Sin. 2012, 21, 151–158. [Google Scholar]
  43. Wang, L.; Ma, Y.; Li, N.; Zhang, W.; Mao, H.; Lin, X. Isolation and characterization of a tonoplast Na+/H+ antiporter from the halophyte Nitraria sibirica. Biol. Plant. 2016, 60, 113–122. [Google Scholar] [CrossRef]
  44. Tang, X.; Wang, R.H.; Yan, X.Y.; Zhu, J.F.; Liu, Z.X.; Ni, J.W.; Zhang, H.X. Isolation and expression analysis of a vacuolar membrane Na+/H+ antiporter gene ntnhx1 from Nitraria tangutorum. Sci. Silvae Sin. 2014, 50, 38–44. [Google Scholar]
  45. Zhu, J.; Yang, X.; Liu, Z.; Zhang, H. Identification and target prediction of micrornas in Ulmus pumila L. Seedling roots under salt stress by high-throughput sequencing. Forests 2016, 7, 318. [Google Scholar] [CrossRef]
  46. Shavrukov, Y. Salt stress or salt shock: Which genes are we studying? J. Exp. Bot. 2013, 64, 119–127. [Google Scholar] [CrossRef]
  47. Sanchez, D.H.; Lippold, F.; Redestig, H.; Hannah, M.A.; Erban, A.; Krämer, U.; Kopka, J.; Udvardi, M.K. Integrative functional genomics of salt acclimatization in the model legume Lotus japonicus. Plant J. 2008, 53, 973–987. [Google Scholar] [CrossRef]
  48. Grabherr, M.G.; Haas, B.J.; Yassour, M.; Levin, J.Z.; Thompson, D.A.; Amit, I.; Adiconis, X.; Fan, L.; Raychowdhury, R.; Zeng, Q.; et al. Full-length transcriptome assembly from RNA-seq data without a reference genome. Nat. Biotechnol. 2011, 29, 644–652. [Google Scholar] [CrossRef]
  49. Parra, G.; Bradnam, K.; Ning, Z.; Keane, T.; Korf, I. Assessing the gene space in draft genomes. Nucleic Acids Res. 2009, 37, 289–297. [Google Scholar] [CrossRef]
  50. Parra, G.; Bradnam, K.; Korf, I. Cegma: A pipeline to accurately annotate core genes in eukaryotic genomes. Bioinformatics 2007, 23, 1061–1067. [Google Scholar] [CrossRef] [PubMed]
  51. Bedell, J.; Korf, I.; Yandell, M. Basic Local Alignment Search Tool; O’Reilly: Sebastopol, CA, USA, 2003. [Google Scholar]
  52. Götz, S.; García-Gómez, J.M.; Terol, J.; Williams, T.D.; Nagaraj, S.H.; Nueda, M.J.; Robles, M.; Talón, M.; Dopazo, J.; Conesa, A. High-throughput functional annotation and data mining with the Blast2GO suite. Nucleic Acids Res. 2008, 36, 3420–3435. [Google Scholar] [CrossRef]
  53. Kanehisa, M.; Goto, S.; Sato, Y.; Furumichi, M.; Tanabe, M. KEGG for integration and interpretation of large-scale molecular data sets. Nucleic Acids Res. 2011, 40, 109–114. [Google Scholar] [CrossRef] [PubMed]
  54. Li, B.; Dewey, C.N. RSEM: Accurate transcript quantification from RNA-seq data with or without a reference genome. BMC Bioinform. 2011, 12, 323. [Google Scholar] [CrossRef]
  55. Young, M.D.; Wakefield, M.J.; Smyth, G.K.; Oshlack, A. Gene ontology analysis for RNA-seq: Accounting for selection bias. Genome Biol. 2010, 11, R14. [Google Scholar] [CrossRef]
  56. Maere, S.; Heymans, K.; Kuiper, M. Bingo: A cytoscape plugin to assess overrepresentation of gene ontology categories in biological networks. Bioinformatics 2005, 21, 3448–3449. [Google Scholar] [CrossRef]
  57. Smoot, M.E.; Ono, K.; Ruscheinski, J.; Wang, P.-L.; Ideker, T. Cytoscape 2.8: New features for data integration and network visualization. Bioinformatics 2011, 27, 431–432. [Google Scholar] [CrossRef]
  58. Mao, X.; Cai, T.; Olyarchuk, J.G.; Wei, L. Automated genome annotation and pathway identification using the KEGG Orthology (KO) as a controlled vocabulary. Bioinformatics 2005, 21, 3787–3793. [Google Scholar] [CrossRef]
  59. Hong, S.-Y.; Seo, P.J.; Yang, M.-S.; Xiang, F.; Park, C.-M. Exploring valid reference genes for gene expression studies in Brachypodium distachyon by real-time PCR. BMC Plant Biol. 2008, 8, 112. [Google Scholar] [CrossRef]
  60. Ye, J.; Fang, L.; Zheng, H.; Zhang, Y.; Chen, J.; Zhang, Z.; Wang, J.; Li, S.; Li, R.; Bolund, L.; et al. WEGO: A web tool for plotting go annotations. Nucleic Acids Res. 2006, 34, W293–W297. [Google Scholar] [CrossRef] [PubMed]
  61. Consortium, G.O. The gene ontology (GO) database and informatics resource. Nucleic Acids Res. 2004, 32, D258–D261. [Google Scholar] [CrossRef]
  62. Shen, Q.; Fu, L.; Dai, F.; Jiang, L.; Zhang, G.; Wu, D. Multi-omics analysis reveals molecular mechanisms of shoot adaption to salt stress in Tibetan wild barley. BMC Genom. 2016, 17, 889. [Google Scholar] [CrossRef] [PubMed]
  63. Tian, D.-Q.; Pan, X.-Y.; Yu, Y.-M.; Wang, W.-Y.; Zhang, F.; Ge, Y.-Y.; Shen, X.-L.; Shen, F.-Q.; Liu, X.-J. De novo characterization of the Anthurium transcriptome and analysis of its digital gene expression under cold stress. BMC Genom. 2013, 14, 827. [Google Scholar] [CrossRef] [PubMed]
  64. Ma, Q.; Bao, A.-K.; Chai, W.-W.; Wang, W.-Y.; Zhang, J.-L.; Li, Y.-X.; Wang, S.-M. Transcriptomic analysis of the succulent xerophyte Zygophyllum xanthoxylum in response to salt treatment and osmotic stress. Plant Soil 2016, 402, 343–361. [Google Scholar] [CrossRef]
  65. Xu, P.; Liu, Z.; Fan, X.; Gao, J.; Zhang, X.; Zhang, X.; Shen, X. De novo transcriptome sequencing and comparative analysis of differentially expressed genes in Gossypium aridum under salt stress. Gene 2013, 525, 26–34. [Google Scholar] [CrossRef]
  66. Long, W.; Zou, X.; Zhang, X. Transcriptome analysis of canola (Brassica napus) under salt stress at the germination stage. PLoS ONE 2015, 10, e0116217. [Google Scholar] [CrossRef]
  67. Wang, G.; Zhu, Q.; Meng, Q.; Wu, C. Transcript profiling during salt stress of young cotton (Gossypium hirsutum) seedlings via solexa sequencing. Acta Physiol. Plant. 2012, 34, 107–115. [Google Scholar] [CrossRef]
  68. Gharat, S.A.; Parmar, S.; Tambat, S.; Vasudevan, M.; Shaw, B.P. Transcriptome analysis of the response to nacl in Suaeda maritima provides an insight into salt tolerance mechanisms in halophytes. PLoS ONE 2016, 11, e0163485. [Google Scholar] [CrossRef]
  69. Shabala, S.; Cuin, T.A. Potassium transport and plant salt tolerance. Physiol. Plant. 2008, 133, 651–669. [Google Scholar] [CrossRef]
  70. Tester, M.; Davenport, R. Na+ tolerance and Na+ transport in higher plants. Ann. Bot. 2003, 91, 503–527. [Google Scholar] [CrossRef]
  71. Kırmızı, S.; Bell, R.W. Responses of barley to hypoxia and salinity during seed germination, nutrient uptake, and early plant growth in solution culture. J. Plant Nutr. Soil Sci. 2012, 175, 630–640. [Google Scholar] [CrossRef]
  72. Kopittke, P.M. Interactions between Ca, Mg, Na and K: Alleviation of toxicity in saline solutions. Plant Soil 2012, 352, 353–362. [Google Scholar] [CrossRef]
  73. Shabala, S.; Shabala, S.; Cuin, T.A.; Pang, J.; Percey, W.; Chen, Z.; Conn, S.; Eing, C.; Wegner, L.H. Xylem ionic relations and salinity tolerance in barley. Plant J. 2010, 61, 839–853. [Google Scholar] [CrossRef]
  74. Amtmann, A.; Armengaud, P. Effects of N, P, K and S on metabolism: New knowledge gained from multi-level analysis. Curr. Opin. Plant Biol. 2009, 12, 275–283. [Google Scholar] [CrossRef] [PubMed]
  75. Wu, D.; Cai, S.; Chen, M.; Ye, L.; Chen, Z.; Zhang, H.; Dai, F.; Wu, F.; Zhang, G. Tissue metabolic responses to salt stress in wild and cultivated barley. PLoS ONE 2013, 8, e55431. [Google Scholar] [CrossRef] [PubMed]
Figure 1. The distributions of E-value and similarity by BLASTx to the Nr database.
Forests 08 00211 g001
Figure 2. Gene ontology (GO) classification of unigenes. Biological process (red), Cellular components (blue) and Molecular function (green).
Forests 08 00211 g002
Figure 3. Contrast figure of gene expression levels under different experimental conditions. (A) The X-axis represents the log10(FPKM) value where FPKM: fragments per kilobase of transcript sequence per million base pairs sequenced. A higher value indicates a higher gene expression quantity. The Y-axis represents the density of log10(FPKM); (B) Boxplot of FPKM. The X-axis represents the different samples. The Y-axis represents the log10(FPKM+1). Each area of the boxplot corresponds to five statistics: maximum, upper quartile, median, lower quartile and minimum from top to bottom, respectively.
Forests 08 00211 g003
Figure 4. Distribution of the genes commonly and specifically expressed in CK, CL2 and CL6. (A) Statistics of differentially expressed genes (DEGs) in the different treatments, DEGs were identified either by a comparison of adjacent treatment or comparing each treatment to CK; (B) Venn diagram describing the exclusion and overlap of regulated genes in the different treatments.
Forests 08 00211 g004
Figure 5. Enriched GO terms of DEGs in CL2 vs. CK (A), CL6 vs. CK (B) and CL6 vs. CL2 (C). Node size represents the gene number per node, and the colour of the node represents the p-value. White nodes were not statistically significant over-representative GO terms.
Forests 08 00211 g005
Figure 6. Specific significantly enriched Kyoto Encyclopedia of Genes and Genomes (KEGG) pathways for DEGs from CL2 vs. CK (A), CL6 vs. CK (B) and CL6 vs. CL2 (C). Sample number ≥ 5 for A and C, Sample number ≥ 3 for B.
Forests 08 00211 g006
Figure 7. Verification of digital gene expression results by qPCR. (19) indicate nine differentially expressed genes (DEGs). Quantitative gene expression data are shown as the mean ± SE. The actin genes were used as reference genes.
Forests 08 00211 g007
Figure 8. Principal component analysis (PCA) and loadings of elements to PC1 and PC2 for root, stem and leaf ionome variation under different treatments. (A) PCA of roots; (B) loadings in roots; (C) PCA of stems; (D) loadings in stems; (E) PCA of leaves; (F) loadings in leaves; PC1: first principal component; PC2: second principal component.
Forests 08 00211 g008
Figure 9. Na/K ratios of N. sibirica Pall. in different tissues under salt stress. Significant differences of tissues between different treatments were determined by the T-test and bars with different letters were significant difference at 95% probability.
Forests 08 00211 g009
Table 1. Experimental design of N. sibirica Pall. Seedlings.
Sample NamesThe Time Points of Salt Treatment and Sample Collection/day
−14.25−13−12−11−10−9−8.25−7−6.25−6−5−4.25−4−3−2.25−2−1−0.250
CK sample collection
CL1
CL2
CL3
CL4
CL5
CL6
√, Indicating add 50 mM NaCl every time; CK, without salt stress; CL1, 50 mM NaCl treated for 0.25 day; CL2, 100 mM NaCl treated for 1 day; CL3, 200 mM NaCl treated for 1 day; CL4, 300 mM NaCl treated for 1 day; CL5, 300 mM NaCl treated for 3 days; CL6, 300 mM NaCl treated for 9 days.
Table 2. Summary of the N. sibirica Pall. Transcriptome.
ItemNumber
Total number of raw reads109,605,726
Total number of clean reads103,965,286
Total clean bases (G)13
Q20 percentage (%)95.59
GC percentage (%)45.71
Total number of unigenes137,421
Min length of unigenes (bp)201
Max length of unigenes (bp)15,714
Mean length of unigenes (bp)555
Length of N50 (bp)846
Table 3. Summary for digital gene expression (DGE) sequencing datasets.
ItemCKCL2CL6
Raw reads17,939,40914,784,83716,231,582
Clean reads17,866,85214,742,61816,158,118
Clean bases (G)0.890.740.81
Total mapped16,622,090
93.03%
13,714,511
93.03%
15,023,640
92.98%
Q20 (%)98.1198.298.11
GC (%)45.6845.4845.81
CK, without salt stress; CL2, 100 mM NaCl treated for 1 day; CL6, 300 mM NaCl treated for 9 days.
Table 4. Element contents (mg/g) in different tissues of N. sibirica Pall. under different treatments.
TissueTreatmentNaCaKFeMgPMnCuZn
RootsCK1.33 c18.75 c15.92 c2.40 a1.81 ab8.71 a0.1221 a0.0189 a0.1923 a
CL21.43 c36.67 a16.34 c0.92 c1.72 ab7.10 b0.0594 d0.0091 d0.1388 d
CL32.97 b28.04 b18.58 b1.65 b2.19 a7.40 b0.0959 b0.0132 c0.1887 b
CL43.53 a17.41 d20.86 a1.19 c1.39 c7.11 b0.0890 c0.0139 b0.1576 c
StemsCK3.04 b12.84 a23.46 b1.72 a2.27 a4.75 a0.0531 a0.0156 a0.1133 a
CL22.86 b13.34 a25.64 a0.39 b2.02 a3.81 b0.0230 d0.0060 c0.0279 b
CL33.13 b12.51 a21.40 c0.48 b1.83 a3.46 b0.0265 b0.0094 b0.0247 c
CL44.21 a12.42 a22.92 b0.34 b1.84 a3.57 b0.0251 c0.0047 d0.0243 c
LeavesCK7.88 c20.31 a23.81 a0.16 b7.87 a5.06 a0.0532 a0.0047 c0.0307 bc
CL28.86 bc20.76 a21.54 b0.58 a7.03 b4.70 a0.0513 b0.0067 a0.0319 a
CL39.32 b19.43 b22.04 b0.67 a6.63 b4.52 a0.0481 c0.0057 b0.0303 c
CL410.85 a17.39 c19.78 c0.50 a6.44 b4.54 a0.0477 c0.0059 ab0.0311 b
Significant differences of tissues between different treatments were determined by the T-test and different letters in the same column represent a significant difference at 95% probability.

