Article

Coordination and Determinants of Leaf Community Economics Spectrum for Canopy Trees and Shrubs in a Temperate Forest in Northeastern China

Center for Ecological Research, Northeast Forestry University, Harbin 150030, China
*
Author to whom correspondence should be addressed.
Forests 2017, 8(6), 202; https://doi.org/10.3390/f8060202
Submission received: 15 April 2017 / Revised: 27 May 2017 / Accepted: 6 June 2017 / Published: 9 June 2017
(This article belongs to the Special Issue Successional Dynamics of Forest Structure and Function)

Abstract

:
Upscaling the leaf economics spectrum (LES) from the species level to community level is an important step to understand how assemblages are constructed based on functional traits and how these coordinated traits for a community respond to the environmental gradients and climate change. In a 9-ha temperate forest dynamics plot located in northeastern China, we collected four LES traits and three other leaf traits from 28 tree species and 13 shrub species. We then related the LES traits at the community level to topographical and soil factors. We observed that the coordination of LES at the community level was stronger than at the species level. Soil nutrients were the primary drivers of distribution of leaf community economics spectrum with acquisition strategy communities in the resource-rich locations. We also observed that different environmental factors affected the distributions of leaf community economics spectrums for trees and shrubs. Our results provided novel evidence for the existence of leaf community economics spectrum in the continental monsoon climate zone. Both abiotic filtering and niche differentiation determined their distributions across different growth forms at the local spatial scale.

1. Introduction

Recently, ecologists have become increasingly interested in trait-based ecology due to the important role of functional traits in plant growth, survival, and performance, as well as community assembly and species coexistence [1,2,3,4]. One challenge in trait-based ecology is to know what and how traits are coordinated or covariant across different plant organs and species [5]. For example, some leaf traits related to photosynthesis (e.g., specific leaf area (SLA) and leaf nitrogen content (LNC)) are found to be strongly correlated with each other along a so-called leaf economics spectrum (LES) across global species datasets [6,7]. One end of the spectrum represents an acquisition strategy wherein a plant with a higher SLA, LNC, and photosynthetic rate has a lower constructive cost, and thus, shorter leaf lifespan [6]. Conversely, the other end of the spectrum represents a conservation strategy wherein a plant with a lower SLA, LNC, and photosynthesis rate has a higher constructive cost, and thus, a longer leaf lifespan [6]. These traits are expected to have important effects on plant growth rates [2,8].
Previous studies investigating the LES traits or their covariations were mainly focused on species level [6,9], or within-species level and local scales in more recent years [10,11,12,13,14,15]. Although some new insights have been gained by relating certain LES traits (e.g., SLA) at the community level to environmental factors [16,17], the coordination of community-LES traits (i.e., mean values of species traits weighted by their relative abundance in a community; also can be called a ‘leaf community economics spectrum’ as a part of the ‘plant community economics spectrum’ [18]) have received little attention (but see [18,19]). Upscaling the coordination of LES traits from within-species, among-species to the community level is an important step to allow us to predict how communities are constructed along an environmental gradient and respond to climate change. Previous studies have found stronger correlations among some functional traits at the community level than at the species level, and these community-level trait values were influenced by environmental factors such as soil nutrients and water content [17,18,19,20]. However, the determinants (e.g., environmental factors) of inter-correlated LES traits at the community level still require additional efforts due to their significant implications on the mechanisms of community assembly [17,21].
In this study, we explore the coordination of LES traits at the community level and how their distributions are determined by the gradients of topography and soil nutrients in a spatially explicit 9-ha (300 m × 300 m) temperate forest dynamics plot. Species within different growth forms, such as shrubs and canopy species, often occupy different positions along the LES axis [7,22]. This raises an additional question as to how LES traits at the community level for shrubs and canopy trees are constructed differently along environmental gradients, because shrubs (understory) and canopy species grow up to different heights and thus are expected to occupy different niches. This can help us to understand the coexistence of shrubs and trees by exploring the relationships between their community-level distributions of LES traits along the environmental gradients. Overall, we aim to explore (1) how the LES traits of shrubs and trees are coordinated at the species and community levels; (2) how the LES traits at the community level for shrubs and trees are determined by topographical and soil factors in the forest dynamics plot; and (3) the difference of coordination and determinations of LES traits at the community level across shrubs and trees, and implications for their coexistence along environmental gradients.

2. Materials and Methods

2.1. Study Area and Species Selection

The study area is located in the Liangshui National Nature Reserve (47°10′50″ N, 128°53′20″ E), which was established to protect the original broadleaved-Korean pine (Pinus koraiensis) forests in northeastern China. The mean annual temperature in this region is −0.3 °C and the mean annual precipitation is 676 mm. In 2005, we established a 9-ha (300 m × 300 m) forest dynamics plot in this reserve following the protocols of the Center for Tropical Forest Science—Forest Global Earth Observatory (CTFS-ForestGEO) network [23]. The elevation across the plot ranges from 425 m to 508 m. We documented all individuals with diameter in breast height (DBH) ≥1 cm. In 2010 and 2015, we performed two recensuses over this plot and documented 30 tree species, 16 shrubs, and 2 lianas. This study covered 28 tree species and 13 shrubs, based on the 2010 recensus data, which accounted for 97.9% of all individuals in the plot. Spatial distributions of the four most abundant shrub and tree species are shown in Figures S1 and S2. For tree species, only individuals with DBH > 10 cm were included to represent the canopy layer [24]. All analyses at the community level were performed at the 20 m × 20 m spatial scale (225 subplots).

2.2. Leaf Traits Collections and Measurements

We collected four core LES traits in this study, which included SLA, leaf dry matter content (LDMC), LNC, and leaf phosphorus content (LPC) [6,25]. We also selected three leaf traits (i.e., leaf area (LA), leaf thickness (LT), and leaf carbon content (LCC)), which might be tightly correlated to LES traits at either species or community level [26,27,28]. All of these traits were measured following the standard criteria [29]. If possible, five healthy individuals per species (DBH > 10 cm for tree species), two branches per individual, and 20 leaves per branch were chosen for the measurements of SLA, LDMC, LA, and LT. All leaves were taken to the laboratory, and the LT was immediately measured by a micrometer and then scanned to obtain LA. LA was calculated by a digital analysis of the image. To guarantee saturated water in the leaves, we placed the leaves into distilled water for 12 h. Then, the water of each sample leaf was wiped carefully with a filter paper and the water-saturated leaf was weighed. Finally, all samples were oven-dried at 60 °C for 48 h and weighed. SLA was determined by dividing the LA by oven-dried matter. LDMC was determined by dividing oven-dried matter by saturated water weight.
Additional leaves were also collected to measure LNC, LPC, and LCC. All leaves were initially oven-dried at 60 °C for 48 h and smashed. The LNC was measured by the Hanon K9840 auto Kjedahl analyzer (Jinan Hanon Instruments Co., Ltd., Jinan, China). The LPC was measured by the molybdenum blue colorimetric method, using leaves digested in a H2SO4 + H2O2 solution [30]. The LCC was analyzed by the multi N/C 2100 analyzer (Analytik Jena AG, Jena, Germany).

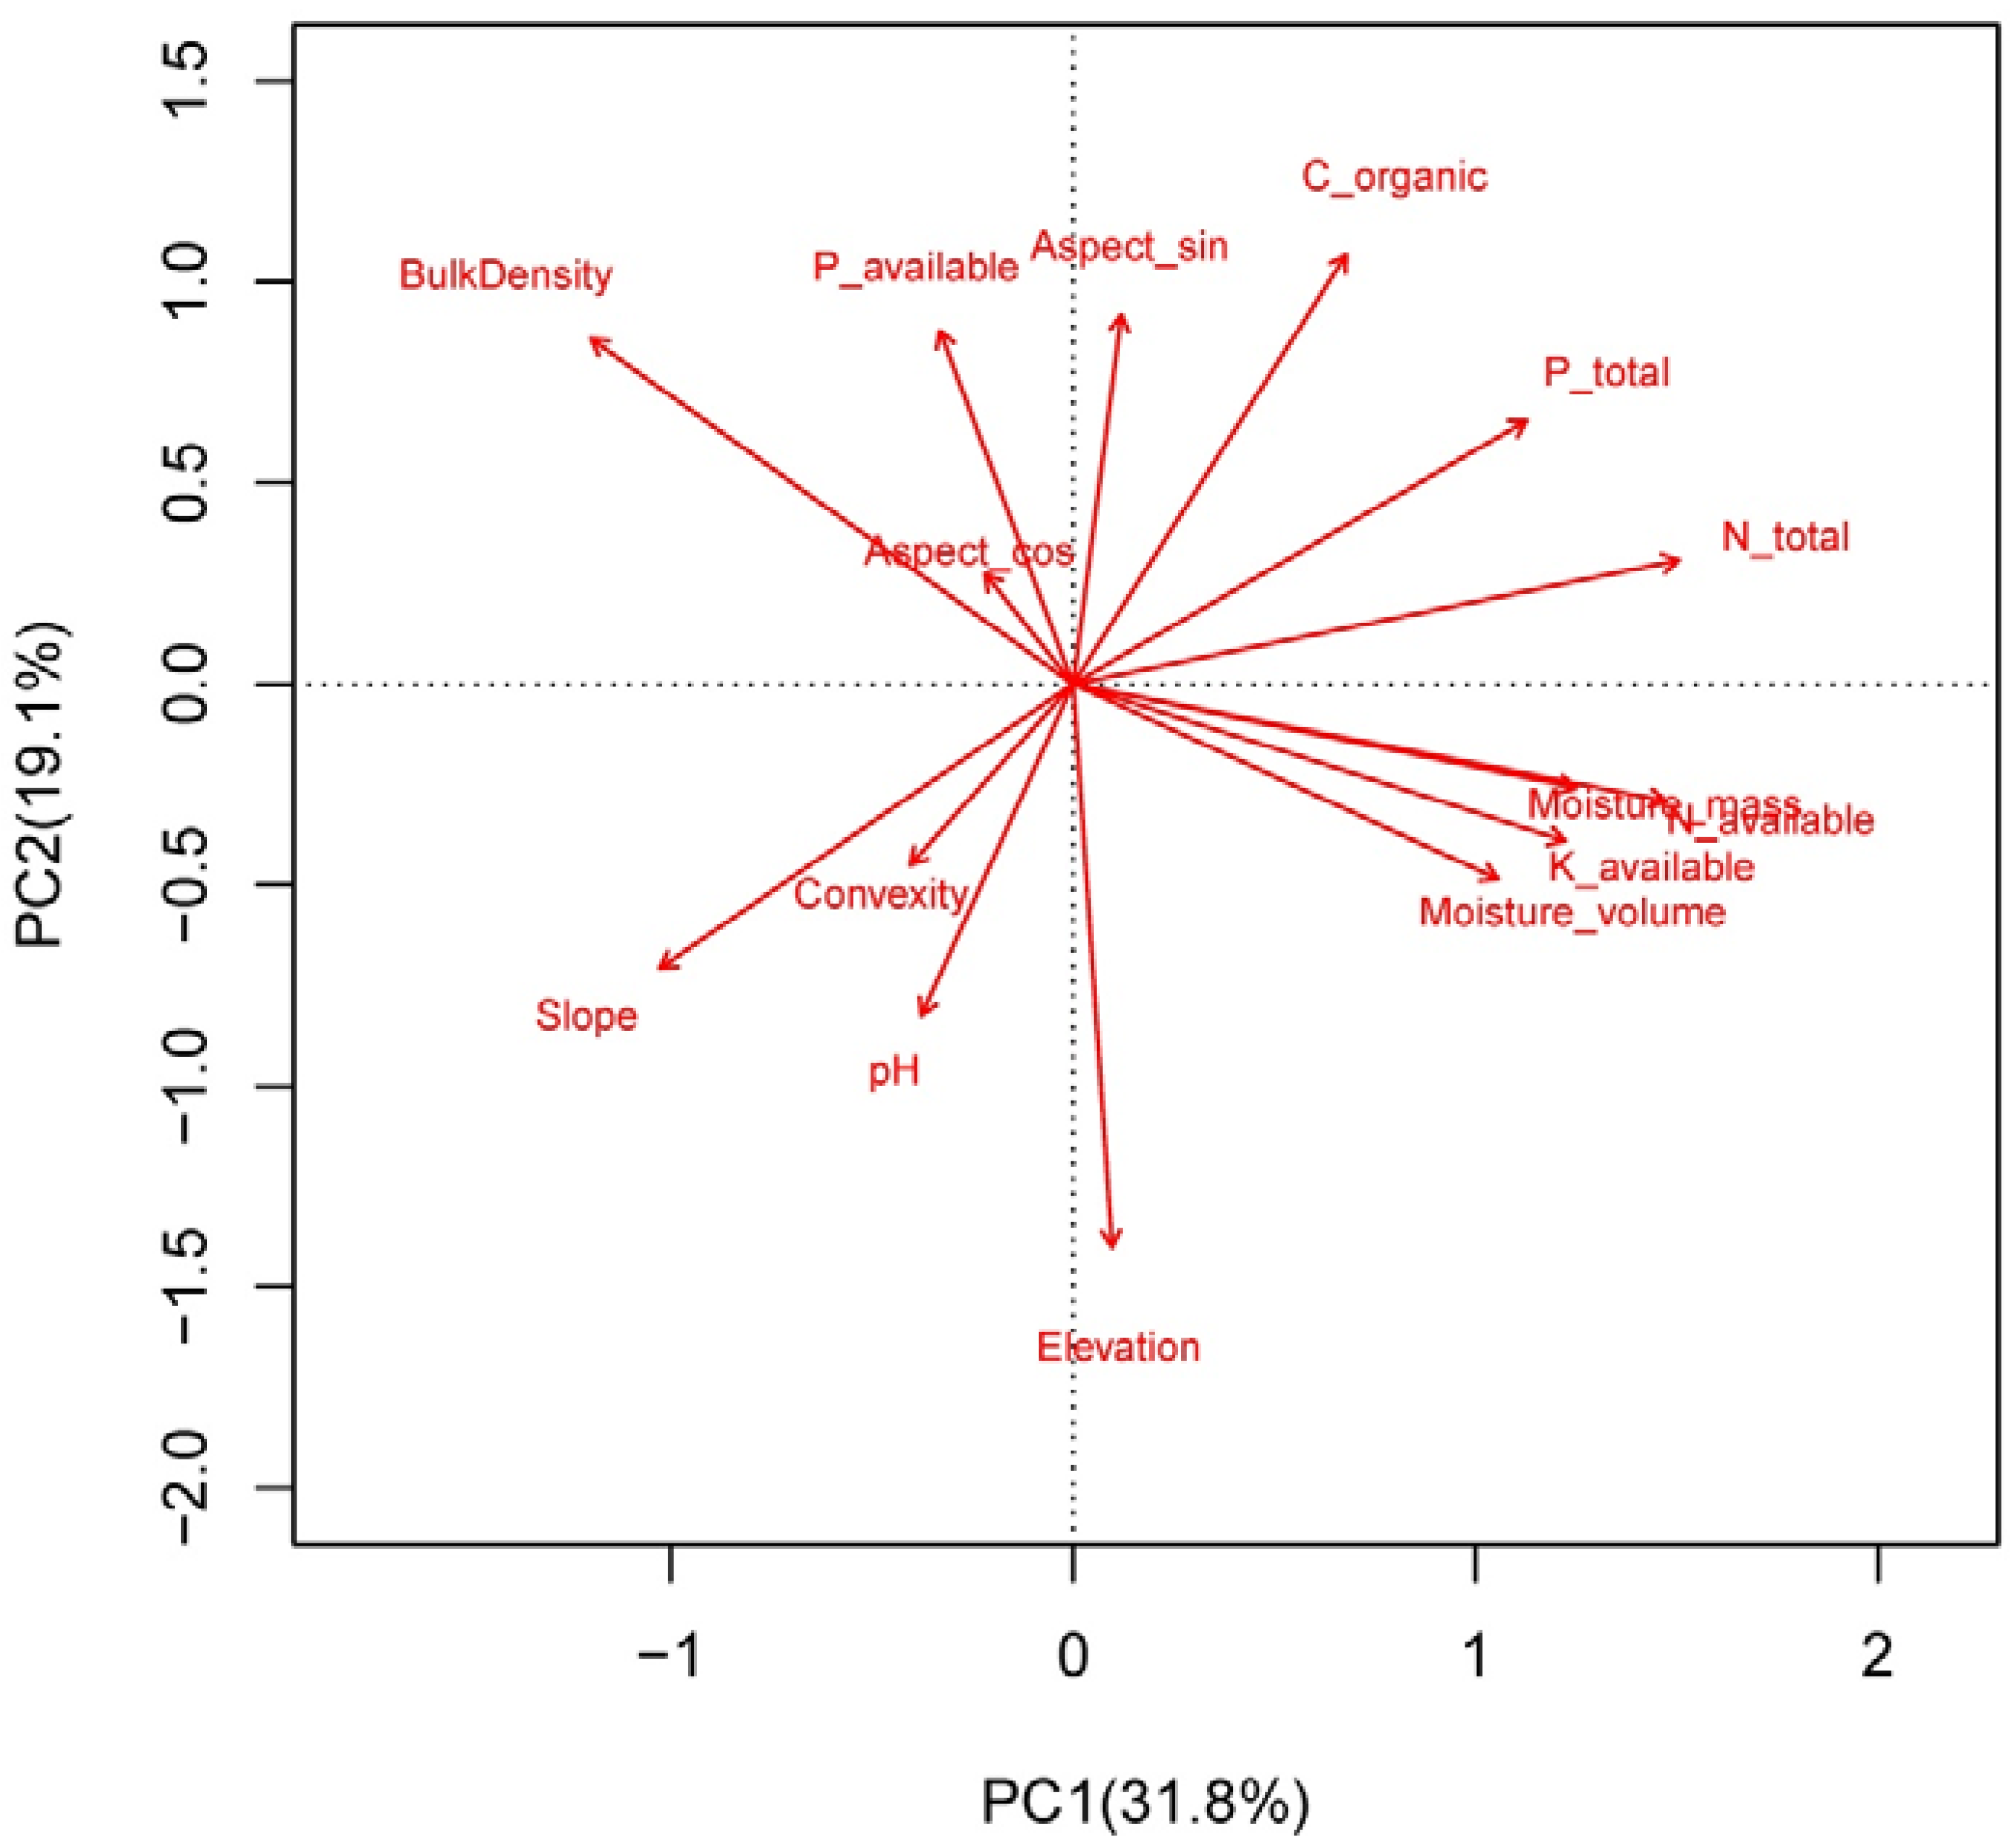
2.3. Topography and Soil Properties Collections

Topographical variables for each subplot included the elevation, slope, aspect, and convexity, which were all calculated based upon the elevations of the four corners in each subplot [31,32]. The elevation was the mean value of elevations of the four corners in each subplot [31]. The slope was determined by the mean angular deviation from the horizontal of four triangular planes formed by connecting the three corners of the subplot. The aspect was calculated based upon the formula in previous studies [32]. Sin (aspect) and cos (aspect) were used to represent the north-south and the east-west orientations, respectively [33]. The convexity was the difference between the elevation of the central subplot and mean elevation of the eight surrounding subplots [31]. Soil properties included bulk density, available N, available P, available K, organic C, total N, total P, pH, volumetric moisture, and mass moisture. The 9-ha plot was divided by a 20 m × 20 m square grid to create a total of 256 intersections. For bulk density and mass moisture, we collected soil samples from these 256 sample points. For the other eight soil variables, we also selected two additional points (2, 5, or 8 m to each intersection; 768 points in total) in a randomly assigned cardinal direction [34]. Bulk density was analyzed using a 100-mL cylinder [34]. Available N was measured by alkaline hydrolysis diffusion method. Available P was measured by an HCl and H2SO4 mixed solution at a 1:5 ratio (w:v) of soil to solution. Available K was measured by a flame photometer. The measurements of organic C, total N, and total P were similar to the leaf traits described above. The pH was measured in water (1:2.5 w). Volumetric moisture was measured using a time domain reflectometry (TDR) probe (IMKO, Ettlingen, Germany). Mass moisture was measured as grams of water per gram of oven-dried soil. We used Kriging interpolation to generate these ten soil variables for all 225 subplots.

2.4. Statistical Analysis

For the traits at the species level, we used the mean values of all sampled individuals for each species. For traits at the community level, we used the community-weighted mean values for each subplot [1,35]. This was calculated by weighing trait values by the relative abundance of each species in a subplot. In addition, we also calculated community-trait values using species occurrence data (presence/absence) to account for the effects of species abundance on the correlations of LES traits at the community level [36]. To generate the coordination of LES and other leaf traits, we employed a principal component analysis (PCA). In addition, we also performed a Pearson correlation analysis for pairwise leaf traits at the species and community levels.
We used the PCA method to generate the gradients of topographical and soil factors in the plot. When we linked the LES traits at the community level to environmental gradients, abundance-weighted trait values were only used because of the important role of species abundance on inferring ecological processes. Because of the good coordination of LES traits at the community level on the principal component 1 (PC1) axis (see Figure 1c,f), we used the PC1 axis as the LES traits gradient at the community level to relate to the environmental gradients. Linear regression was employed to relate LES traits (PC1) at the community level to the first two principal component axes of environmental gradients for both trees and shrubs. We also generated Pearson correlation coefficients between the LES traits at the community level and each topographical and soil factor. All traits were log-transformed before the analyses. All analyses were performed in R-3.2.5 [37].

3. Results

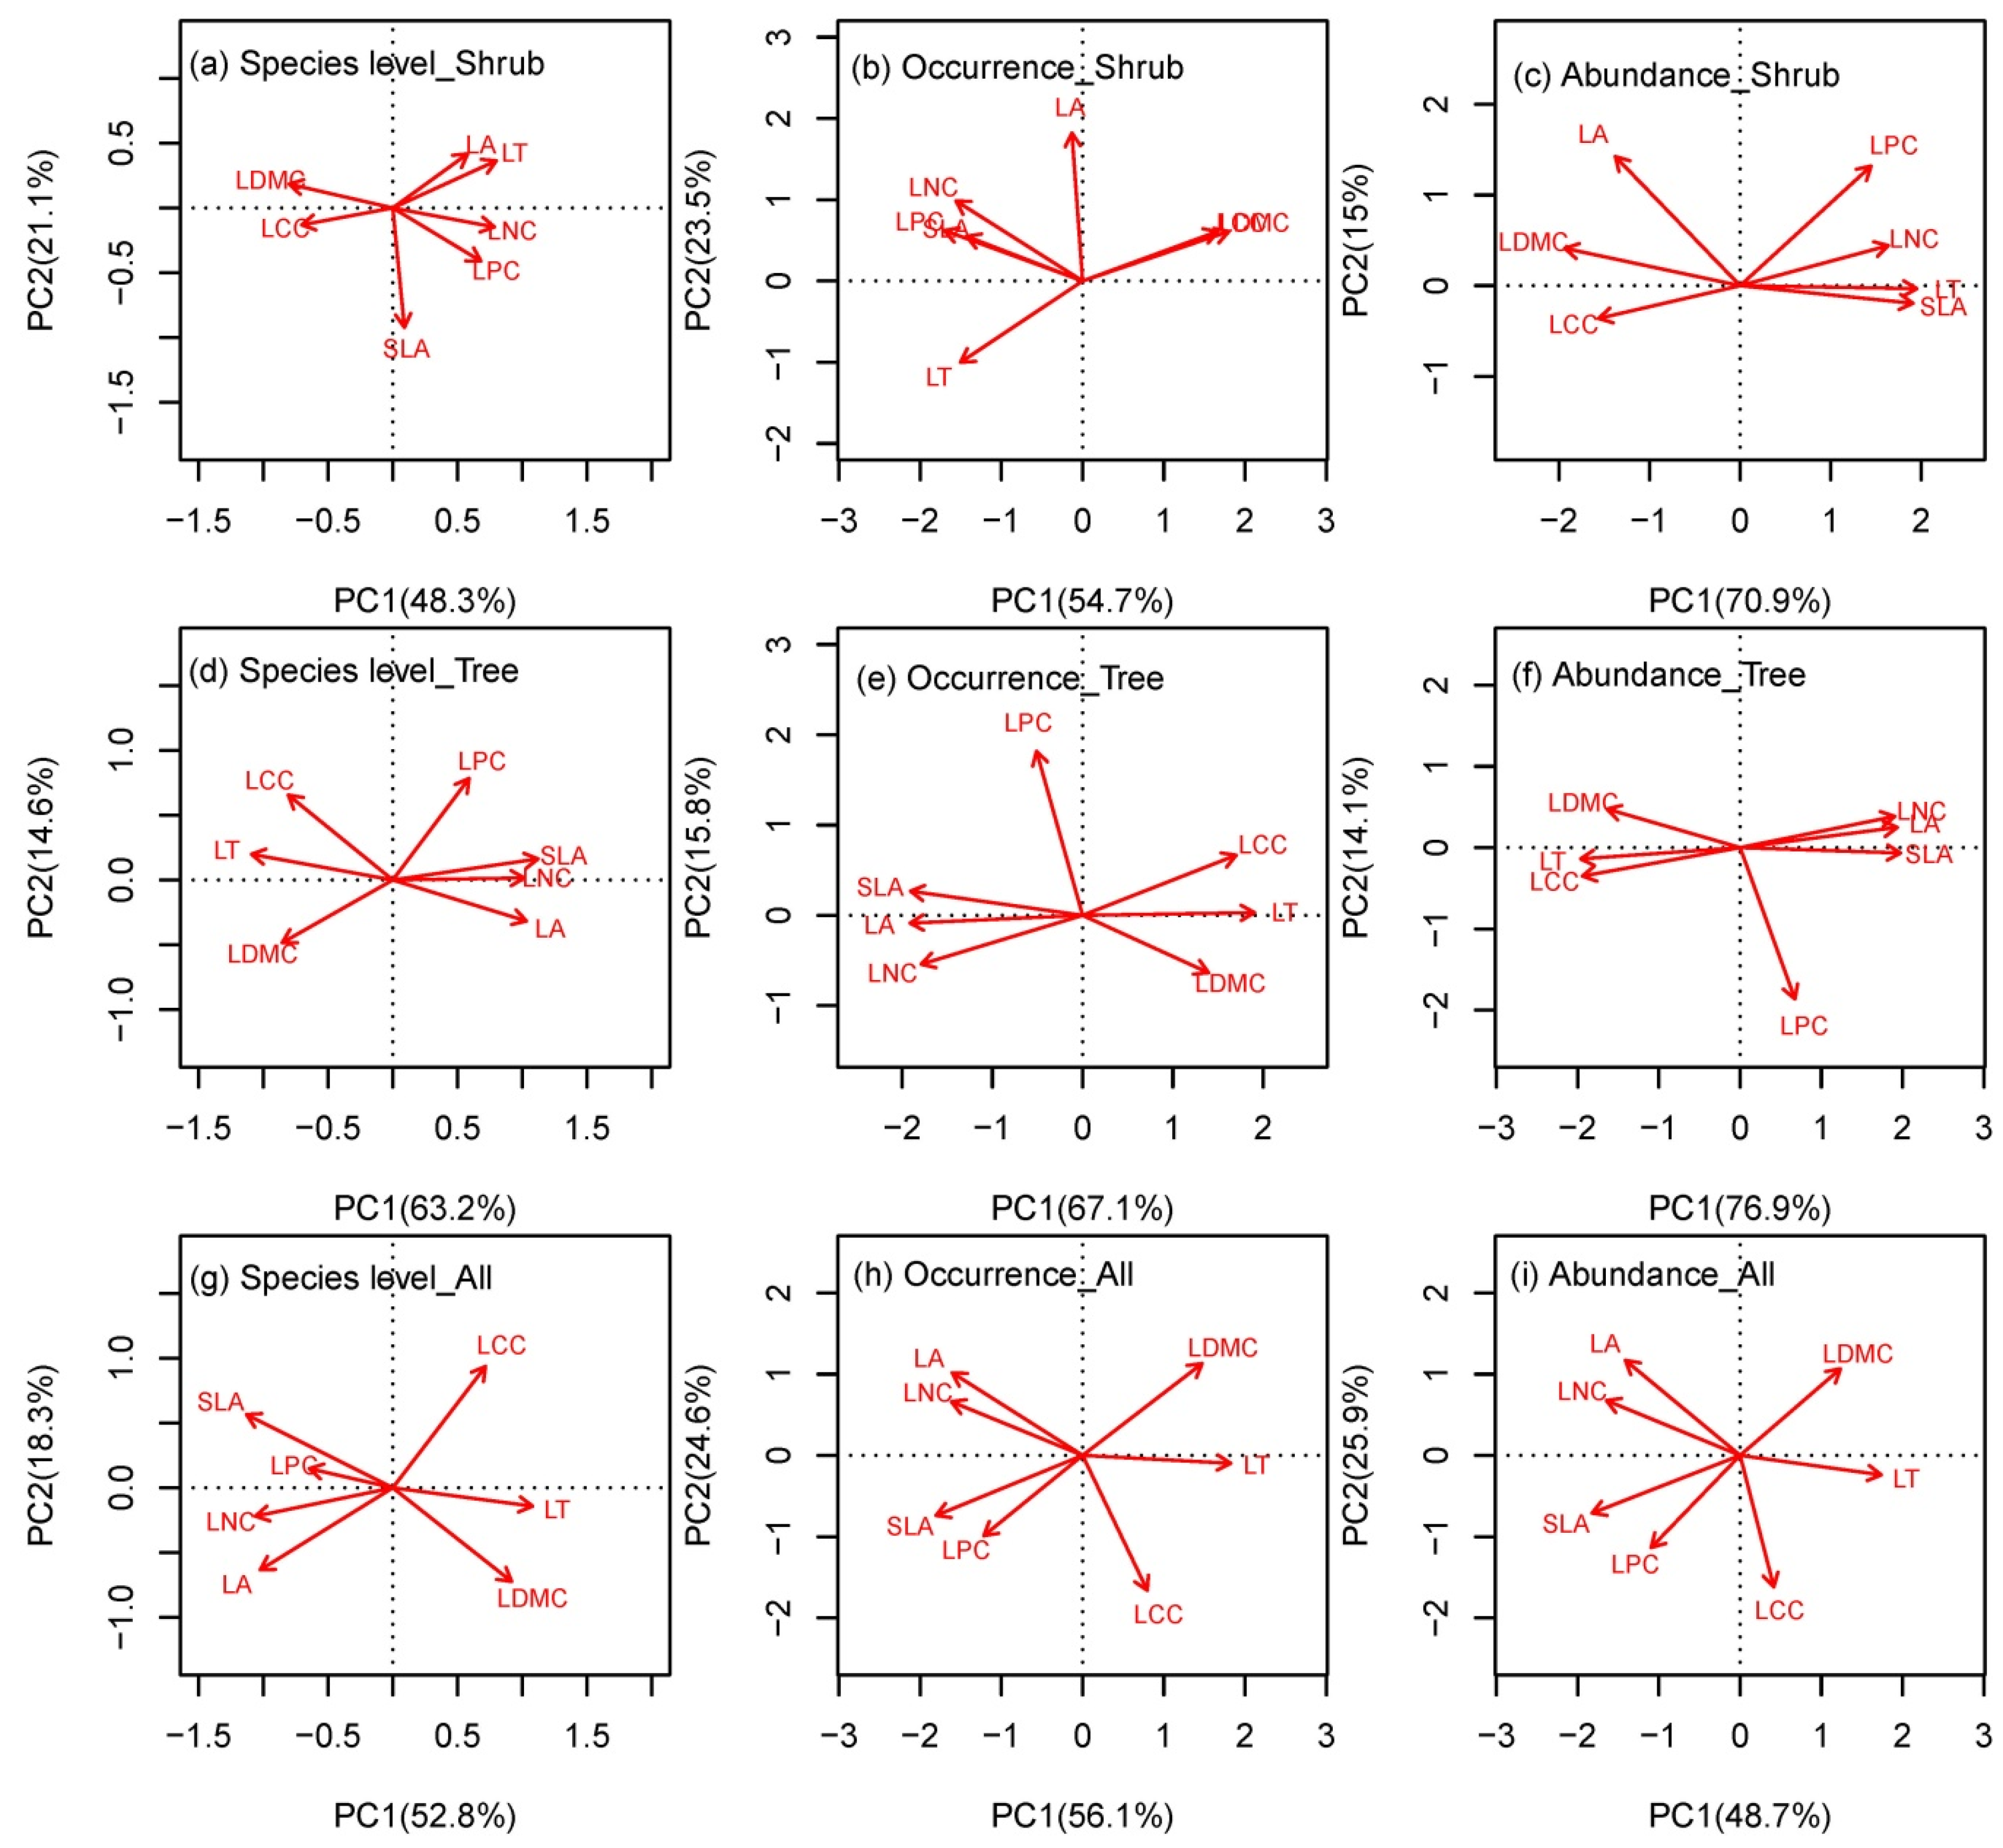
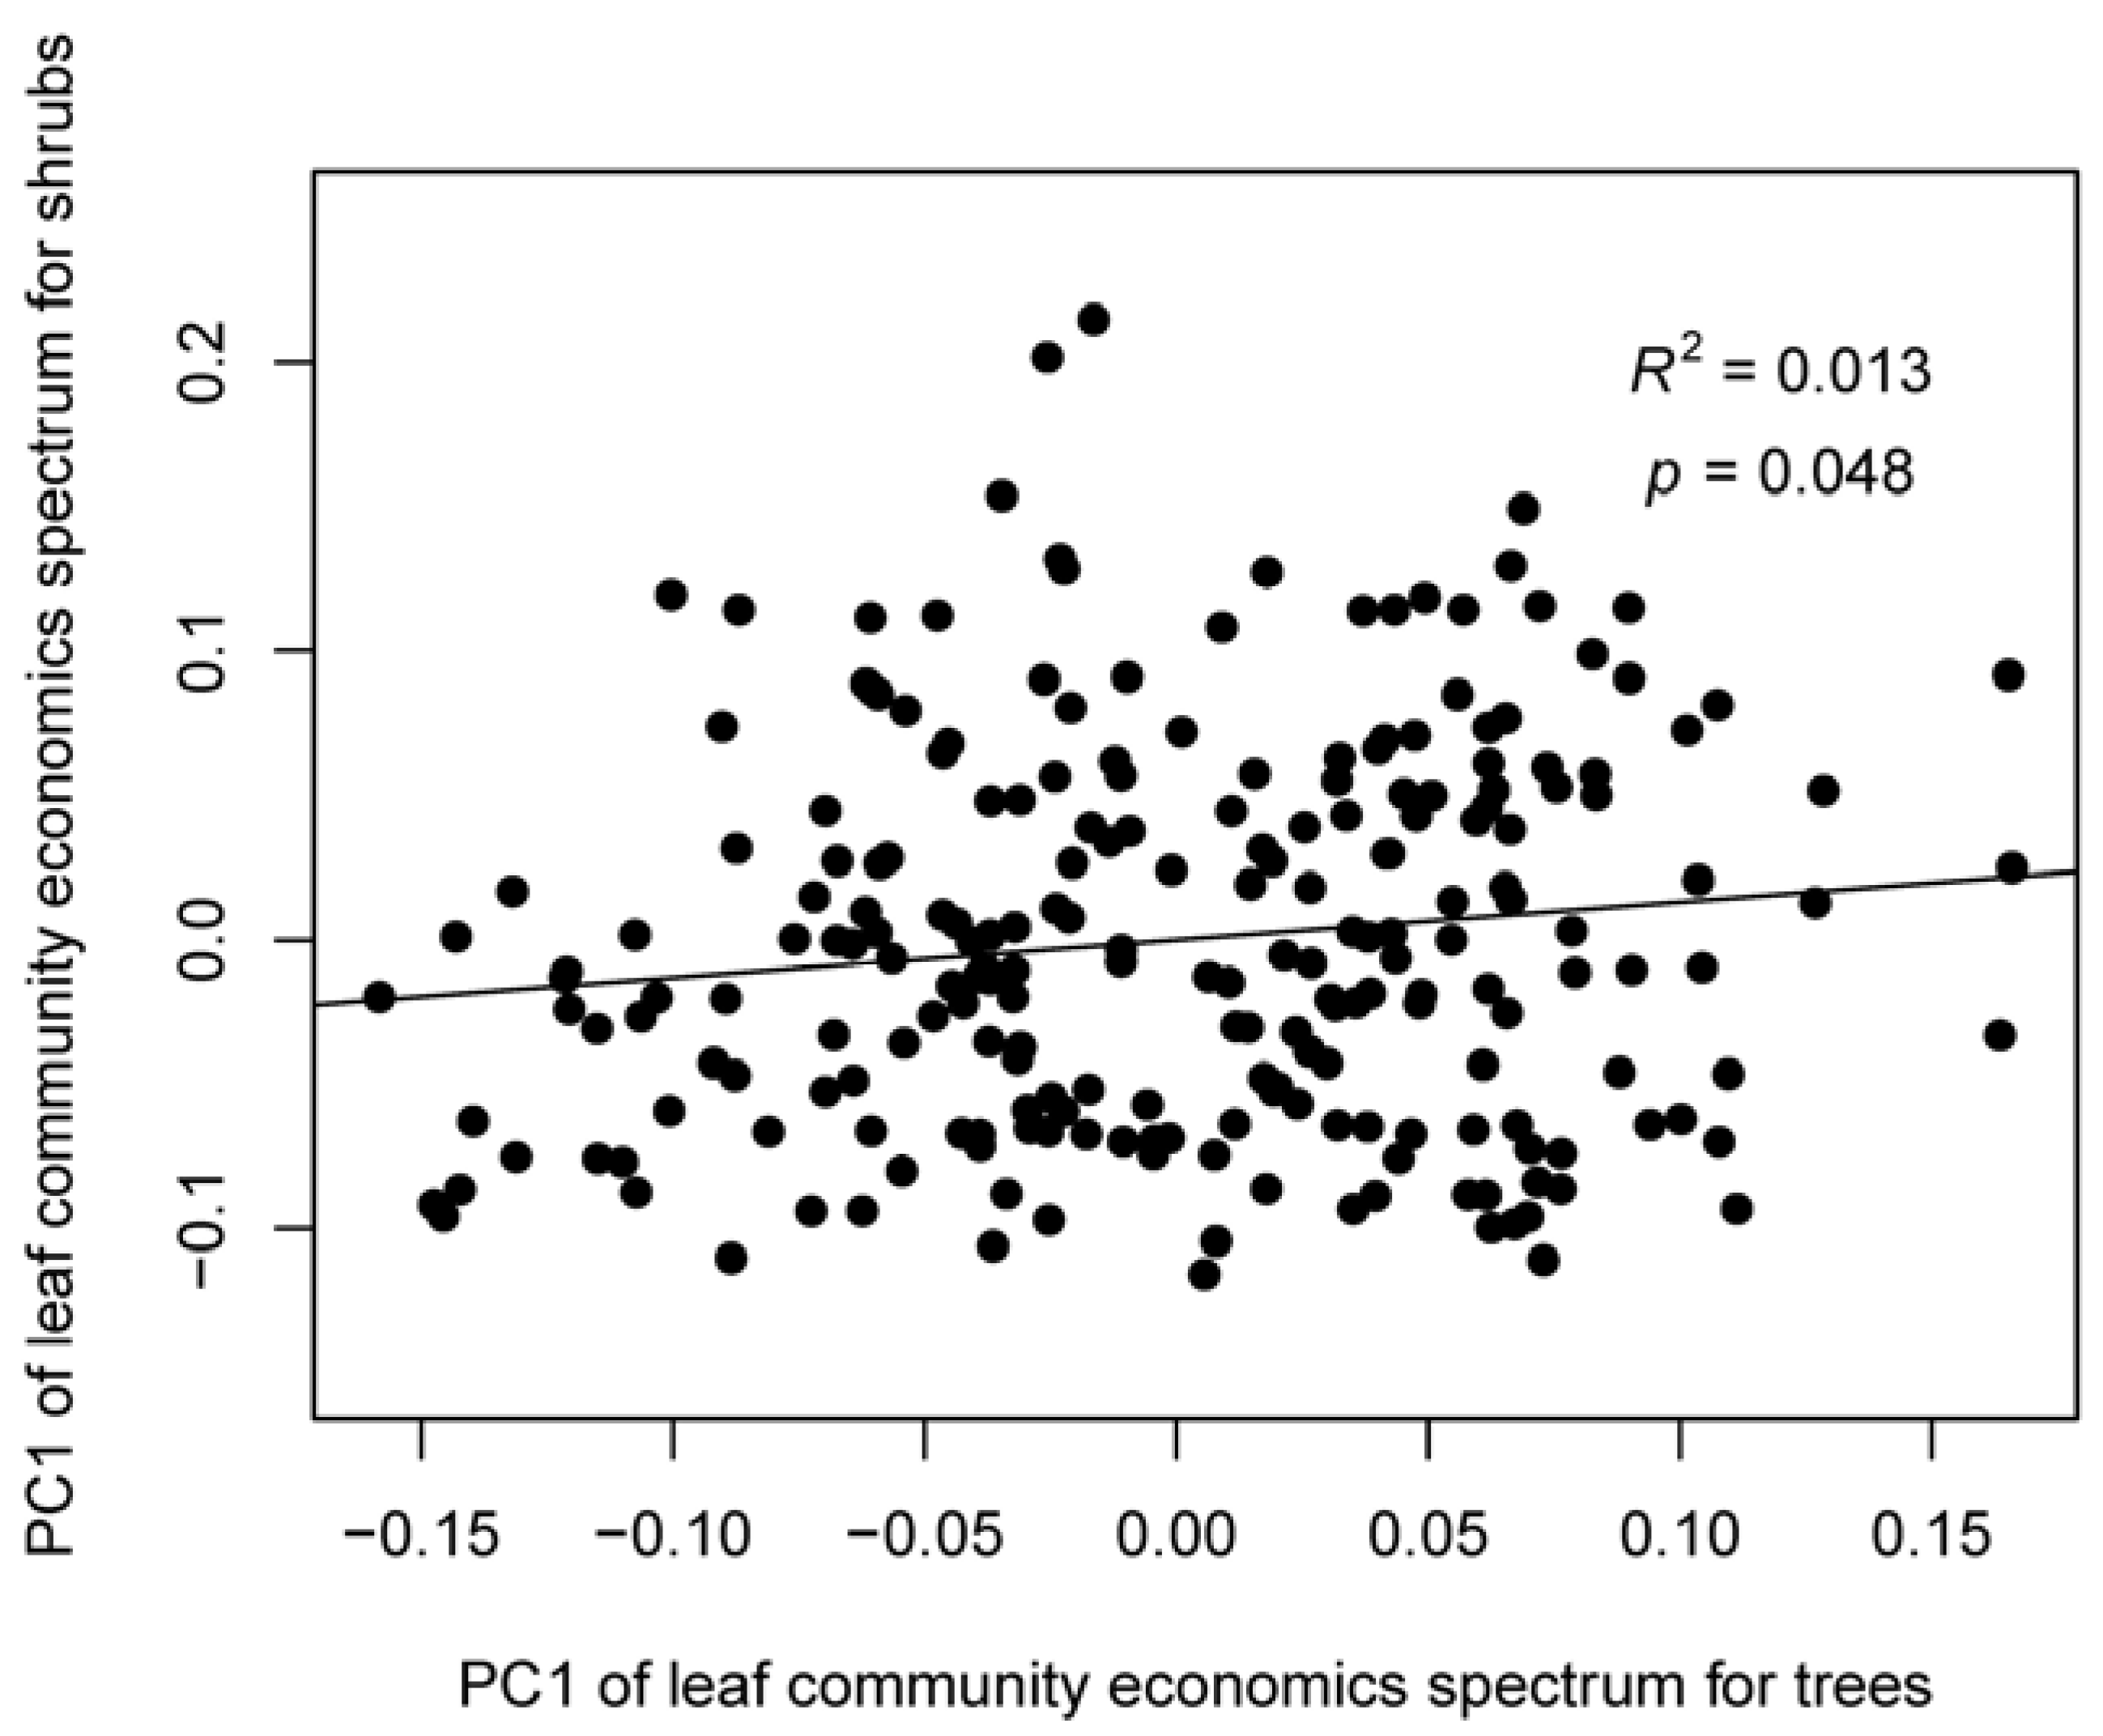
3.1. Coordination among Leaf Traits at the Species and Community Levels

We found the coordination of leaf traits in shrub and canopy species across species and community levels (Table 1 and Table 2, and Table S1; Figure 1). For shrubs at the species level, the PC1 axis explained 48.3% of total variations in leaf traits (Figure 1a); the coordination of LES traits was indicated by significantly negative correlation between LDMC and LNC (r = −0.56, p < 0.05; Table 1). At the community level, the PC1 axis explained 54.7% of total variations when using occurrence data (Figure 1b); the coordination of community-LES traits was indicated by significant correlations among SLA, LDMC, LNC, and LPC. When using species abundance data, the PC1 axis explained 70.9% of total variations (Figure 1c); all pairwise leaf traits except for LA vs. LPC were significantly correlated (Table 1).
For trees at the species level, the PC1 axis explained 63.2% of total variations in leaf traits (Figure 1d); the coordination of LES traits was indicated by significant correlations among the SLA, LDMC, LNC, and LPC (Table 2). At the community level, the PC1 axis explained 67.1% of total variations when using occurrence data (Figure 1e); the coordination of community-LES traits was indicated by significant correlations among the SLA, LDMC, LNC, and LPC (specifically, LNC and LPC were not significantly correlated). When using species abundance data, the PC1 axis explained 76.9% of total variations (Figure 1f); all pairwise leaf traits were significantly correlated (Table 2). For shrubs and trees, higher SLA, LNC, and LPC represented resource acquisition strategy while higher LDMC represented resource conservation strategy. The coordination of LES traits increased from species level, community level using occurrence data to community level using abundance data. This result implied that species abundance influenced the coordination of leaf traits at the community level.
When we analyzed shrub and canopy species jointly, results were slightly different from those separate analyses above (Table S1; Figure 1). At the species level, PC1 axis explained 52.8% of total variations (Figure 1g); LNC was significantly correlated to SLA, LDMC, and LPC. At the community level, the PC1 axis explained 56.1% and 48.7% variation when using occurrence and abundance data, respectively (Figure 1h,i); All four core LES traits (SLA, LDMC, LNC, and LPC) were significantly correlated. Especially, our analyses below focused on these separate analyses for shrubs and trees.
The other three leaf traits (LA, LT, and LCC) showed different correlations with each other and LES traits across different growth forms at both species and community levels (Table 1 and Table 2; Figure 1). While LT was positively correlated to LCC and LDMC for trees at both levels, these correlations were converted to be negative for shrubs (Table 1 and Table 2). At the community level, LA was positively correlated to SLA and LNC for trees (Figure 1f), whereas their correlations were negative for shrubs (Figure 1c).

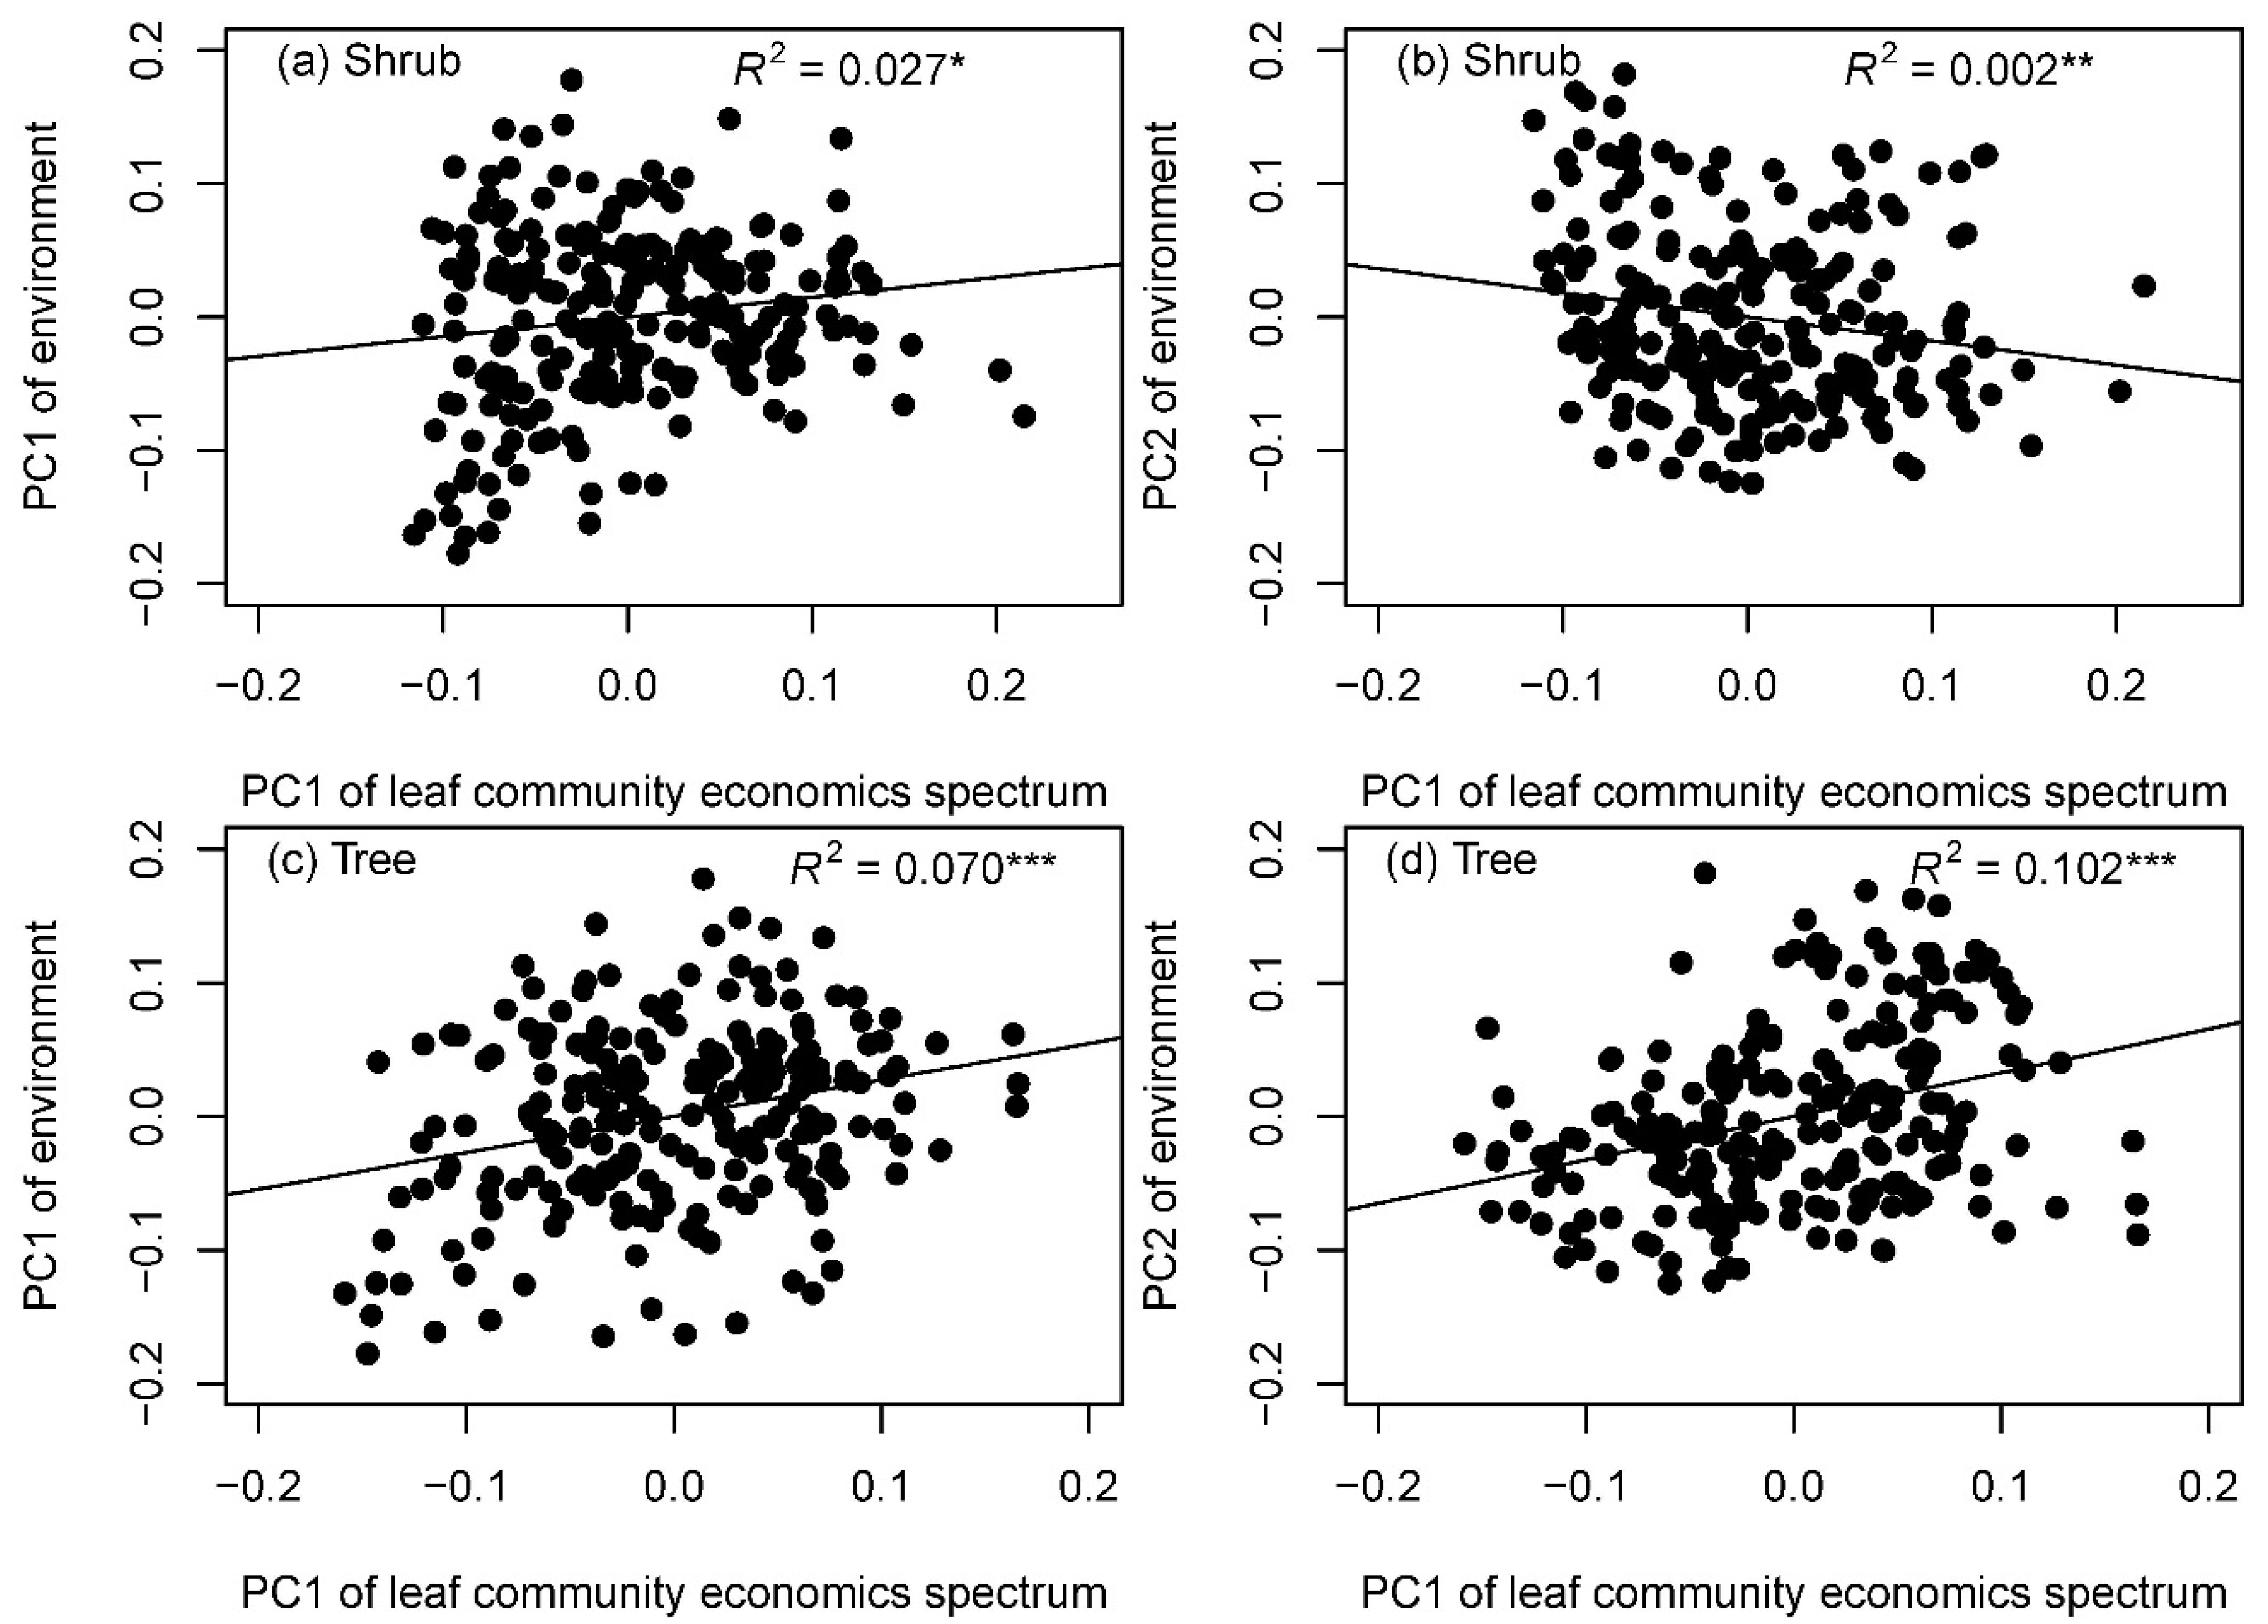
3.2. Effects of Environment on LES Traits Distributions at the Community Level

While the topographical and soil variables were correlated in the dynamics plot, 31.8% of the total variation was explained by the PC1 axis and 19.1% by the PC2 axis (Figure 2). The PC1 axis primarily indicated increasing soil nutrients and water content (negative to positive values). The PC2 axis represented an environmental gradient from a high elevation, sub-acidity, and infertile resource (negative value) to a low elevation, acidity, and rich resource (positive value). For shrubs, the PC1 axis of LES traits at the community level (all analyses based on abundance data; see methods) was weakly and positively correlated to the PC1 axis of environment (Figure 3a). However, it was negatively correlated to the PC2 axis of environment (Figure 3b). For trees, the PC1 axis of LES traits at the community level were positively correlated to both PC1 and PC2 axes of environment (Figure 3c,d).
The factors that determined the spatial distributions of LES traits at the community level were different for shrubs and trees (Table 3). Shrubs were positively correlated to the available N, available K, and pH, and negatively correlated to the convexity, sin (aspect), cos (aspect), and bulk density (Table 3). However, trees were positively correlated to the available N, available K, organic C, total N, and total P, and negatively correlated to elevation, slope, and convexity (Table 3). The spatial distributions of LES traits at the community level between shrubs and trees were weakly correlated (R2 = 0.013, p = 0.048; Figure 4 and Figure S3), which implied that their LES traits distributions might be independent along environmental gradients.

4. Discussion

In the study, we found the existence of a leaf community economics spectrum in a 9-ha temperate forest dynamics plot in northeastern China. The coordination of LES traits at the community level was stronger than at the species level for both canopy tree species and understory shrub species. Species abundance influenced the coordination of leaf traits at the community level. Next, we found that the species with a resource acquisition strategy often occurred in the soil resource-rich communities, whereas the species with a resource conservation strategy often occurred in the soil resource-infertile communities. Finally, we found a weak relationship for the spatial distributions of leaf community economics spectrum between shrubs and trees.

4.1. The Leaf Community Economics Spectrum

The strong coordination of LES traits at the community level indicated the existence of a leaf community economics spectrum across trees and shrubs, which could be one part of plant community economics spectrum [18,19]. In addition, we found that the relationships of LES traits at both community levels were stronger than species level. Our results indicated that both species turnover (using species occurrence data) and abundance (using species abundance data) could improve the coordination of leaf community economics spectrum [36]. We acknowledged that our results might underestimate the coordination of leaf community economics spectrum without considering intraspecific trait variations [36]. We noted that the coordination of community-LES traits decreased when we analyzed all shrub and tree species together, especially at the community level using abundance data. This result might be caused by different adaptations of shrubs and trees to environmental gradients, and we gave some explanations below. Our results (located in the continental monsoon climate zone) were consistent with those found by previous studies, which were primarily conducted in the Mediterranean climate zones [18,19,20,26]. This consistency across different climate zones and growth forms strengthened the evidence of widely existing leaf community economics spectrum.
We found that LA and LT had different correlations with core LES traits across different growth forms and organization levels. First, LT was positively correlated to LDMC for trees but negatively correlated to LDMC for shrubs at both levels. This result might be caused by the difference of leaf structure and water content among tree and shrub species. Second, LT was negatively correlated to SLA (or acquisition strategy) for tree species at the community level. Surprisingly, they were positively correlated for shrubs, which contrasted with previous studies at the species level [28]. We found this relationship was driven by dominant species of shrubs. For shrubs at the species level, LT was negatively but non-significantly correlated to SLA (Figure S4). However, we found that the relationship for the four most abundant shrubs, which accounted for 89.2% of all individual shrubs, was non-significantly positive (Figure S4). We suggest that these four dominant species drove the positive coordination of LT and SLA at the community level. The result was similar with the correlations between LA and LNC and LT (Figure S5). Three dominant shrub species (Corylus mandshurica, Eleutherococcus senticosus, Philadelphus schrenkii), which accounted for 76.0% of all individuals, drove the negative correlations between LA and LNC and LT at the community level (Figure S5). These results also warned that any trait coordination at the species level could not be simply extended to community level, which strongly depended on abundance and the trait combinations of dominant species.

4.2. Determinants of Leaf Community Economics Spectrum: Hints for Community Assembly

We found that the spatial distributions of leaf community economics spectrum (based on abundance data) were affected by topography, soil nutrients, and pH. The leaf community economics spectrum was negatively correlated to the topographical factors for trees, with communities using a resource conservation strategy related to both high elevation and steep slope. Generally, the soil nutrients in these communities were infertile (Figure 2). In our study, soil nutrients were the most important factors that drove the distributions of leaf community economics spectrum, which was consistent to the findings of previous studies [18,20]. The communities with rich soil resources had more individuals with the resource acquisition strategy. These species could quickly assimilate resources and had a high growth rate [2]. Conversely, conserved species generally established through a greater construction cost can endure more extreme environments, for example, high elevations and acidic and infertile soils. The aspect also influenced the distributions of leaf community economics spectrum for shrubs. While the aspect was a qualitative measurement for light availability, the leaf community economics spectrum (from conservation to acquisition strategies) was positively correlated to that. This result was consistent with the finding of Pérez-Ramos et al. [18], but contrary to the result found by Ackerly et al. [26]. They found a decreasing community-weighted SLA with increasing potential diurnal insolation [26]. For the plants growing in the understory, light availability might be an important limiting factor influencing plant growth. Species with the acquisition strategy therefore needed more light to run photosynthesis. Leaf size generally decreased with increasing isolation [26,38], which is consistent to our finding that smaller leaves were associated with communities with an acquisition strategy (Figure 1c). Small leaf size could reduce evaporative cooling and maintain leaf temperature in a hot environment [26,38].
We observed that there were no significant relationships between leaf community economics spectrum and soil water content (i.e., volumetric moisture and mass moisture) for both trees and shrubs. The results were also consistent with the findings of Domínguez et al. [20] in Mediterranean communities but inconsistent with earlier studies [17,39] that found community-weighted SLA responded to the gradient of soil water. Soil water may be tightly correlated to plant hydraulic architecture [40]. For leaves, however, the LES traits were found to be commonly uncorrelated with hydraulic traits [28,41]. That might explain why we were unable to find the expected relationship between leaf community economics spectrum and soil water content.
Across shrubs and trees, the determinants of leaf community economics spectrum implied the rules of community assembly. The mechanism underlying community assembly is commonly regarded as a hierarchical process by community ecologists [21,42]. For the leaf community economics spectrum across communities, abiotic filtering by the limitation of soil nutrients determined the species distributions in this forest. On the other hand, within a community, the niches of shrubs and trees were differential along multiple environmental axes to promote the coexistence of canopy and understory species. For example, light availability might be a limiting factor for shrubs, but not for canopy trees. The leaf community economics spectrums of shrubs and trees responded differently to the PC2 axis of topographical and soil gradient (Figure 3b,d). In addition, the weak correlation of leaf community economics spectrum between shrubs and trees also indicated their different responses to environmental axes. We note that the contrasting distributions of leaf community economics spectrums for shrubs and trees along environmental gradients might cause the decreasing coordination that we observed when we analyzed both growth forms together at the community level using abundance data (Figure 1g–i). Our results based on the distributions of the leaf community economics spectrum favored the niche theory [16,43], and contradicted the neutral theory [44].

5. Conclusions

In a 9-ha temperate forest dynamics plot in northeastern China, we discovered the existence of a leaf community economics spectrum for both understory shrubs and canopy trees in a continental monsoon climate zone. The coordination of LES traits was observed to be stronger at the community level than species level. We found that trait coordination at the community level was strongly influenced by species abundance and trait combination of dominant species. Additionally, we found that spatial distributions of leaf community economics spectrum were primarily driven by the gradients of soil nutrients. Our results suggest that the leaf community economics spectrum traits are helpful for our understandings of community assembly and species coexistence, as well as our understandings about the response of LES traits at the community scale to environmental gradients and climate change.

Supplementary Materials

The following are available online at www.mdpi.com/1999-4907/8/6/202/s1. Table S1. Pearson correlation coefficients among the traits of 41 shrubs and canopy species at the species and community levels in the Liangshui forest dynamics plot. Figure S1. Spatial distributions of the four most abundant shrub species in the 300 m × 300 m temperate forest dynamics plot. Figure S2. Spatial distributions of the four most abundant canopy species (DBH > 10 cm) in the 300 m × 300 m temperate forest dynamics plot. Figure S3. Distributions of leaf community economics spectrum (PC1 axis; using abundance data) of 13 shrubs species (a) and 28 canopy species (b) in the 300 m × 300 m forest dynamics plot. Figure S4. The relationship between specific leaf area and leaf thickness for shrubs at the species level. Figure S5. The relationships between leaf area, leaf nitrogen content, and leaf thickness for shrubs at the species level.

Acknowledgments

This study was financially supported by the National Natural Science Foundation of China (No. 31270473). We thank two anonymous reviewers for constructive suggestions to improve the quality of the manuscript. Especially, we thank Enrique G. de la Riva, María T. Domínguez, Le Li, Zhili Liu, Jie Yang and Xiaojuan Liu for the helpful suggestions when we revised the original manuscript.

Author Contributions

F.J. and G.J. conceived the idea; F.J., Y.X. and H.C. collected and analyzed the data; F.J. and G.J. wrote the manuscript; other authors provided editorial advice.

Conflicts of Interest

The authors declare no conflict of interest.

References

  1. Violle, C.; Navas, M.-L.; Vile, D.; Kazakou, E.; Fortunel, C.; Hummel, I.; Garnier, E. Let the concept of trait be functional! Oikos 2007, 116, 882–892. [Google Scholar] [CrossRef]
  2. Wright, S.J.; Kitajima, K.; Kraft, N.J.; Reich, P.B.; Wright, I.J.; Bunker, D.E.; Condit, R.; Dalling, J.W.; Davies, S.J.; Díaz, S. Functional traits and the growth-mortality trade-off in tropical trees. Ecology 2010, 91, 3664–3674. [Google Scholar] [CrossRef] [PubMed]
  3. Swenson, N.G.; Stegen, J.C.; Davies, S.J.; Erickson, D.L.; Forero-Montaña, J.; Hurlbert, A.H.; Kress, W.J.; Thompson, J.; Uriarte, M.; Wright, S.J. Temporal turnover in the composition of tropical tree communities: Functional determinism and phylogenetic stochasticity. Ecology 2012, 93, 490–499. [Google Scholar] [CrossRef] [PubMed]
  4. Kraft, N.J.; Godoy, O.; Levine, J.M. Plant functional traits and the multidimensional nature of species coexistence. Proc. Natl. Acad. Sci. USA 2015, 112, 797–802. [Google Scholar] [CrossRef] [PubMed]
  5. Laughlin, D.C.; Wilson, S. The intrinsic dimensionality of plant traits and its relevance to community assembly. J. Ecol. 2014, 102, 186–193. [Google Scholar] [CrossRef]
  6. Wright, I.J.; Reich, P.B.; Westoby, M.; Ackerly, D.D.; Baruch, Z.; Bongers, F.; Cavender-Bares, J.; Chapin, T.; Cornelissen, J.H.; Diemer, M. The worldwide leaf economics spectrum. Nature 2004, 428, 821–827. [Google Scholar] [CrossRef] [PubMed]
  7. Diaz, S.; Kattge, J.; Cornelissen, J.H.; Wright, I.J.; Lavorel, S.; Dray, S.; Reu, B.; Kleyer, M.; Wirth, C.; Prentice, I.C.; et al. The global spectrum of plant form and function. Nature 2016, 529, 167–171. [Google Scholar] [CrossRef] [PubMed]
  8. Poorter, L.; Wright, S.J.; Paz, H.; Ackerly, D.D.; Condit, R.; Ibarra-Manríquez, G.; Harms, K.E.; Licona, J.C.; Martínez-Ramos, M.; Mazer, S.J.; et al. Are functional traits good predictors of demographic rates? Evidence from five neotropical forests. Ecology 2008, 89, 1908–1920. [Google Scholar] [CrossRef] [PubMed]
  9. Onoda, Y.; Wright, I.J.; Evans, J.R.; Hikosaka, K.; Kitajima, K.; Niinemets, U.; Poorter, H.; Tosens, T.; Westoby, M. Physiological and structural tradeoffs underlying the leaf economics spectrum. New Phytol. 2017, 214, 1447–1463. [Google Scholar] [CrossRef] [PubMed]
  10. Vasseur, F.; Violle, C.; Enquist, B.J.; Granier, C.; Vile, D. A common genetic basis to the origin of the leaf economics spectrum and metabolic scaling allometry. Ecol. Lett. 2012, 15, 1149–1157. [Google Scholar] [CrossRef] [PubMed]
  11. Blonder, B.; Violle, C.; Enquist, B.J.; Cornelissen, H. Assessing the causes and scales of the leaf economics spectrum using venation networks inpopulus tremuloides. J. Ecol. 2013, 101, 981–989. [Google Scholar] [CrossRef]
  12. Blonder, B.; Vasseur, F.; Violle, C.; Shipley, B.; Enquist, B.J.; Vile, D. Testing models for the leaf economics spectrum with leaf and whole-plant traits in arabidopsis thaliana. AoB Plants 2015, 7, plv049. [Google Scholar] [CrossRef] [PubMed]
  13. Siefert, A.; Violle, C.; Chalmandrier, L.; Albert, C.H.; Taudiere, A.; Fajardo, A.; Aarssen, L.W.; Baraloto, C.; Carlucci, M.B.; Cianciaruso, M.V.; et al. A global meta-analysis of the relative extent of intraspecific trait variation in plant communities. Ecol. Lett. 2015, 18, 1406–1419. [Google Scholar] [CrossRef] [PubMed]
  14. Messier, J.; McGill, B.J.; Enquist, B.J.; Lechowicz, M.J. Trait variation and integration across scales: Is the leaf economic spectrum present at local scales? Ecography 2017, 40, 685–697. [Google Scholar] [CrossRef]
  15. Messier, J.; Lechowicz, M.J.; McGill, B.J.; Violle, C.; Enquist, B.J.; Cornelissen, H. Interspecific integration of trait dimensions at local scales: The plant phenotype as an integrated network. J. Ecol. 2017, in press. [Google Scholar] [CrossRef]
  16. Kraft, N.J.; Valencia, R.; Ackerly, D.D. Functional traits and niche-based tree community assembly in an amazonian forest. Science 2008, 322, 580–582. [Google Scholar] [CrossRef] [PubMed]
  17. Cornwell, W.K.; Ackerly, D.D. Community assembly and shifts in plant trait distributions across an environmental gradient in coastal California. Ecol. Monogr. 2009, 79, 109–126. [Google Scholar] [CrossRef]
  18. Pérez-Ramos, I.M.; Roumet, C.; Cruz, P.; Blanchard, A.; Autran, P.; Garnier, E.; Aerts, R. Evidence for a ‘plant community economics spectrum’ driven by nutrient and water limitations in a mediterranean rangeland of southern France. J. Ecol. 2012, 100, 1315–1327. [Google Scholar] [CrossRef]
  19. De la Riva, E.G.; Tosto, A.; Pérez-Ramos, I.M.; Navarro-Fernández, C.M.; Olmo, M.; Anten, N.P.R.; Marañón, T.; Villar, R.; de Bello, F. A plant economics spectrum in mediterranean forests along environmental gradients: Is there coordination among leaf, stem and root traits? J. Veg. Sci. 2016, 27, 187–199. [Google Scholar] [CrossRef]
  20. Domínguez, M.T.; Aponte, C.; Pérez-Ramos, I.M.; García, L.V.; Villar, R.; Marañón, T. Relationships between leaf morphological traits, nutrient concentrations and isotopic signatures for mediterranean woody plant species and communities. Plant Soil 2012, 357, 407–424. [Google Scholar] [CrossRef]
  21. Keddy, P.A. Assembly and response rules: Two goals for predictive community ecology. J. Veg. Sci. 1992, 3, 157–164. [Google Scholar] [CrossRef]
  22. Zhao, Y.T.; Ali, A.; Yan, E.R. The plant economics spectrum is structured by leaf habits and growth forms across subtropical species. Tree Physiol. 2017, 37, 173–185. [Google Scholar] [CrossRef] [PubMed]
  23. Anderson-Teixeira, K.J.; Davies, S.J.; Bennett, A.C.; Gonzalez-Akre, E.B.; Muller-Landau, H.C.; Wright, S.J.; Abu Salim, K.; Almeyda Zambrano, A.M.; Alonso, A.; Baltzer, J.L.; et al. Ctfs-forestgeo: A worldwide network monitoring forests in an era of global change. Glob. Chang. Biol. 2015, 21, 528–549. [Google Scholar] [CrossRef] [PubMed]
  24. Piao, T.; Comita, L.S.; Jin, G.; Kim, J.H. Density dependence across multiple life stages in a temperate old-growth forest of northeast China. Oecologia 2013, 172, 207–217. [Google Scholar] [CrossRef] [PubMed]
  25. Hu, Y.K.; Pan, X.; Liu, G.F.; Li, W.B.; Dai, W.H.; Tang, S.L.; Zhang, Y.L.; Xiao, T.; Chen, L.Y.; Xiong, W.; et al. Novel evidence for within-species leaf economics spectrum at multiple spatial scales. Front. Plant Sci. 2015, 6, 901. [Google Scholar] [CrossRef] [PubMed]
  26. Ackerly, D.; Knight, C.; Weiss, S.; Barton, K.; Starmer, K. Leaf size, specific leaf area and microhabitat distribution of chaparral woody plants: Contrasting patterns in species level and community level analyses. Oecologia 2002, 130, 449–457. [Google Scholar] [CrossRef] [PubMed]
  27. Baraloto, C.; Timothy Paine, C.E.; Poorter, L.; Beauchene, J.; Bonal, D.; Domenach, A.M.; Herault, B.; Patino, S.; Roggy, J.C.; Chave, J. Decoupled leaf and stem economics in rain forest trees. Ecol. Lett. 2010, 13, 1338–1347. [Google Scholar] [CrossRef] [PubMed]
  28. Li, L.; McCormack, M.L.; Ma, C.; Kong, D.; Zhang, Q.; Chen, X.; Zeng, H.; Niinemets, U.; Guo, D. Leaf economics and hydraulic traits are decoupled in five species-rich tropical-subtropical forests. Ecol. Lett. 2015, 18, 899–906. [Google Scholar] [CrossRef] [PubMed]
  29. Pérez-Harguindeguy, N.; Díaz, S.; Garnier, E.; Lavorel, S.; Poorter, H.; Jaureguiberry, P.; Bret-Harte, M.S.; Cornwell, W.K.; Craine, J.M.; Gurvich, D.E.; et al. New handbook for standardised measurement of plant functional traits worldwide. Aust. J. Bot. 2013, 61, 167–234. [Google Scholar] [CrossRef]
  30. Bao, S.D. Soil Agricultural Chemical Analysis; China Agricultural Press: Beijing, China, 2000. [Google Scholar]
  31. Legendre, P.; Mi, X.; Ren, H.; Ma, K.; Yu, M.; Sun, I.-F.; He, F. Partitioning beta diversity in a subtropical broad-leaved forest of China. Ecology 2009, 90, 663–674. [Google Scholar] [CrossRef] [PubMed]
  32. De Cáceres, M.; Legendre, P.; Valencia, R.; Cao, M.; Chang, L.-W.; Chuyong, G.; Condit, R.; Hao, Z.; Hsieh, C.-F.; Hubbell, S.; et al. The variation of tree beta diversity across a global network of forest plots. Glob. Ecol. Biogeogr. 2012, 21, 1191–1202. [Google Scholar] [CrossRef]
  33. Jones, M.M.; Tuomisto, H.; Borcard, D.; Legendre, P.; Clark, D.B.; Olivas, P.C. Explaining variation in tropical plant community composition: Influence of environmental and spatial data quality. Oecologia 2008, 155, 593–604. [Google Scholar] [CrossRef] [PubMed]
  34. Shi, B.; Gao, W.; Cai, H.; Jin, G. Spatial variation of soil respiration is linked to the forest structure and soil parameters in an old-growth mixed broadleaved-Korean pine forest in northeastern China. Plant Soil 2015, 400, 263–274. [Google Scholar] [CrossRef]
  35. Garnier, E.; Cortez, J.; Billès, G.; Navas, M.-L.; Roumet, C.; Debussche, M.; Laurent, G.; Blanchard, A.; Aubry, D.; Bellmann, A.; et al. Plant functional markers capture ecosystem properties during secondary succession. Ecology 2004, 85, 2630–2637. [Google Scholar] [CrossRef]
  36. De la Riva, E.G.; Pérez-Ramos, I.M.; Tosto, A.; Navarro-Fernández, C.M.; Olmo, M.; Marañón, T.; Villar, R. Disentangling the relative importance of species occurrence, abundance and intraspecific variability in community assembly: A trait-based approach at the whole-plant level in mediterranean forests. Oikos 2016, 125, 354–363. [Google Scholar] [CrossRef]
  37. R Core Team. R: A Language and Environment for Statistical Computing; R Foundation for Statistical Computing: Vienna, Austria, 2016; Available online: https://www.R-project.org/ (accessed on 14 April 2016).
  38. Peppe, D.J.; Royer, D.L.; Cariglino, B.; Oliver, S.Y.; Newman, S.; Leight, E.; Enikolopov, G.; Fernandez-Burgos, M.; Herrera, F.; Adams, J.M.; et al. Sensitivity of leaf size and shape to climate: Global patterns and paleoclimatic applications. New Phytol. 2011, 190, 724–739. [Google Scholar] [CrossRef] [PubMed]
  39. Jung, V.; Violle, C.; Mondy, C.; Hoffmann, L.; Muller, S. Intraspecific variability and trait-based community assembly. J. Ecol. 2010, 98, 1134–1140. [Google Scholar] [CrossRef]
  40. Cosme, L.H.; Schietti, J.; Costa, F.R.; Oliveira, R.S. The importance of hydraulic architecture to the distribution patterns of trees in a central amazonian forest. New Phytol. 2017, in press. [Google Scholar] [CrossRef] [PubMed]
  41. Kawai, K.; Okada, N.; Watling, J. How are leaf mechanical properties and water-use traits coordinated by vein traits? A case study in Fagaceae. Funct. Ecol. 2016, 30, 527–536. [Google Scholar] [CrossRef]
  42. HilleRisLambers, J.; Adler, P.B.; Harpole, W.S.; Levine, J.M.; Mayfield, M.M. Rethinking community assembly through the lens of coexistence theory. Annu. Rev. Ecol. Evol. Syst. 2012, 43, 227–248. [Google Scholar] [CrossRef]
  43. Chase, J.M.; Leibold, M.A. Ecological Niches: Linking Classical and Contemporary Approaches; University of Chicago Press: Chicago, IL, USA, 2003. [Google Scholar]
  44. Hubbell, S.P. The Unified Neutral Theory of Biodiversity and Biogeography; Princeton University Press: Princeton, NJ, USA, 2001. [Google Scholar]
Figure 1. Principal component analysis (PCA) for seven traits of 13 shrub species, 28 canopy species, and all 41 species at the species level and community level (using species occurrence and abundance data, respectively) in the Liangshui forest dynamics plot. SLA: specific leaf area; LA: leaf area; LT: leaf thickness; LDMC: leaf dry matter content; LCC: leaf carbon content; LNC: leaf nitrogen content; LPC: leaf phosphorus content.
Forests 08 00202 g001
Figure 2. Principal component analysis (PCA) for topographical and soil variables in the Liangshui forest dynamics plot.
Forests 08 00202 g002
Figure 3. Relationships between the leaf community economics spectrum (PC1 axis) and environment (PC1 and PC2 axes) for trees and shrubs, respectively. The leaf community economics spectrum is calculated using species abundance data. * p < 0.05; ** p < 0.01; *** p < 0.001.
Forests 08 00202 g003
Figure 4. The relationship for spatial distributions of leaf community economics spectrum (PC1 axes) between shrubs and trees. The leaf community economics spectrum is calculated using species abundance data.
Forests 08 00202 g004
Table 1. Pearson correlation coefficients among the traits of 13 shrubs at the species (above the diagonal) and community levels (below the diagonal) in the Liangshui forest dynamics plot.
SLALALTLDMCLCCLNCLPC
SLA −0.26 ns−0.29 ns−0.24 ns0.01 ns0.21 ns0.36 ns
LA−0.67 (0.10 ns) 0.46 ns−0.20 ns−0.31 ns0.55 ns0.32 ns
LT0.84 (0.17)−0.68 (−0.22) −0.79−0.610.43 ns0.38 ns
LDMC−0.97 (−0.63)0.77 (0.24)−0.89 (−0.80) 0.47 ns−0.56−0.53 ns
LCC−0.54 (−0.39)0.48 (0.16)−0.86 (−0.78)0.58 (0.68) −0.51 ns−0.33 ns
LNC0.83 (0.57)−0.31 (0.48)0.69 (0.36)−0.80 (−0.50)−0.42 (−0.54) 0.56
LPC0.62 (0.65)−0.06 ns (0.29)0.67 (0.43)−0.55 (−0.66)−0.68 (−0.55)0.63 (0.70)
The correlations out of the parentheses are calculated using species abundance data and the correlations in the parentheses are calculated using species occurrence data. SLA: specific leaf area; LA: leaf area; LT: leaf thickness; LDMC: leaf dry matter content; LCC: leaf carbon content; LNC: leaf nitrogen content; LPC: leaf phosphorus content. ns: non-significant, p > 0.05.
Table 2. Pearson correlation coefficients among the traits of 28 canopy species at the species (above the diagonal) and community levels (below the diagonal) in the Liangshui forest dynamics plot.
SLALALTLDMCLCCLNCLPC
SLA 0.74−0.90−0.80−0.480.770.42
LA0.90 (0.84) −0.80−0.43−0.680.710.33 ns
LT−0.97 (−0.93)−0.92 (−0.88) 0.540.63−0.73−0.32 ns
LDMC−0.80 (−0.74)−0.71 (−0.56)0.69 (0.52) 0.30 ns−0.51−0.40
LCC−0.91 (−0.67)−0.94 (−0.81)0.92 (0.71)0.75 (0.50) −0.50−0.13 ns
LNC0.90 (0.77)0.93 (0.85)−0.95 (−0.85)−0.61 (−0.38)−0.92 (−0.79) 0.41
LPC0.34 (0.28)0.22 (0.24)−0.28 (−0.24)−0.30 (−0.26)−0.16 (0.03ns)0.18 (0.07 ns)
The correlations out of the parentheses are calculated using species abundance data and the correlations in the parentheses are calculated using species occurrence data. SLA: specific leaf area; LA: leaf area; LT: leaf thickness; LDMC: leaf dry matter content; LCC: leaf carbon content; LNC: leaf nitrogen content; LPC: leaf phosphorus content. ns: non-significant, p > 0.05.
Table 3. Pearson correlation coefficients between abiotic factors and the PC1 axes of leaf community economics spectrum for 13 shrub species and 28 canopy species.
Abiotic FactorsShrubTree
TopographyElevation0.09−0.30 *
Slope−0.05−0.34 *
Convexity−0.14 *−0.26 *
Sin (Aspect)−0.31 *0.11
Cos (Aspect)−0.22 *−0.02
SoilBulk density−0.14 *0.02
Available N0.25 *0.20 *
Available P−0.090.09
Available K0.20 *0.31 *
Organic C0.000.37 *
Total N0.090.29 *
Total P0.080.45 *
pH0.21 *0.04
Volumetric moisture0.10−0.02
Mass moisture0.10−0.03
The leaf community economics spectrum is calculated using species abundance data. * p < 0.05.

