
Potential of Windbreak Trees to Reduce Carbon Emissions by Agricultural Operations in the US


Abstract
:1. Introduction
2. Materials and Methods
2.1. Carbon Emissions for the Major Crops in the United States
- Extreme outliers (more than four standard deviations away from the mean),
- Uninsulated houses,
- Households where the occupants neither owned nor paid rent (i.e., squatted), and
- Farmsteads with wood as the primary source of heat.
2.2. Reduced Carbon Emissions in Agricultural Lands by Planting Windbreaks
- Windbreaks were planted perpendicular to the prevailing wind with conifers and deciduous trees at a canopy density of 40–60% [36].
- An area of 2 ha was defined for both small and medium farms; an area of 3 ha was used for large farms. These farmsteads contained an adequately insulated house of 230 and 270 m2 built before and after 2000, respectively.
- We used a house built after 2000, due to no significant differences on houses’ age (before and after 2000).
- For full protection of the small and medium farmsteads, a 200-m windbreak was required. For large farms, a 300-m windbreak was required.
- In northern zones, a 10-row windbreak is needed while in southern zones a 3-row windbreak is sufficient. Typically, these windbreaks have two sections arranged in an “L-shaped” design and located north and west of the home to protect against winter winds.
- Three farm sizes were considered: small (60 ha), medium (300 ha), and large (600 ha). This resulted in six scenarios (two age groups of houses and three farm sizes). For calculations, we made some adjustments to the report from United States Department of Agriculture (USDA) Census of Agriculture [39].
2.3. Data Analysis
3. Results
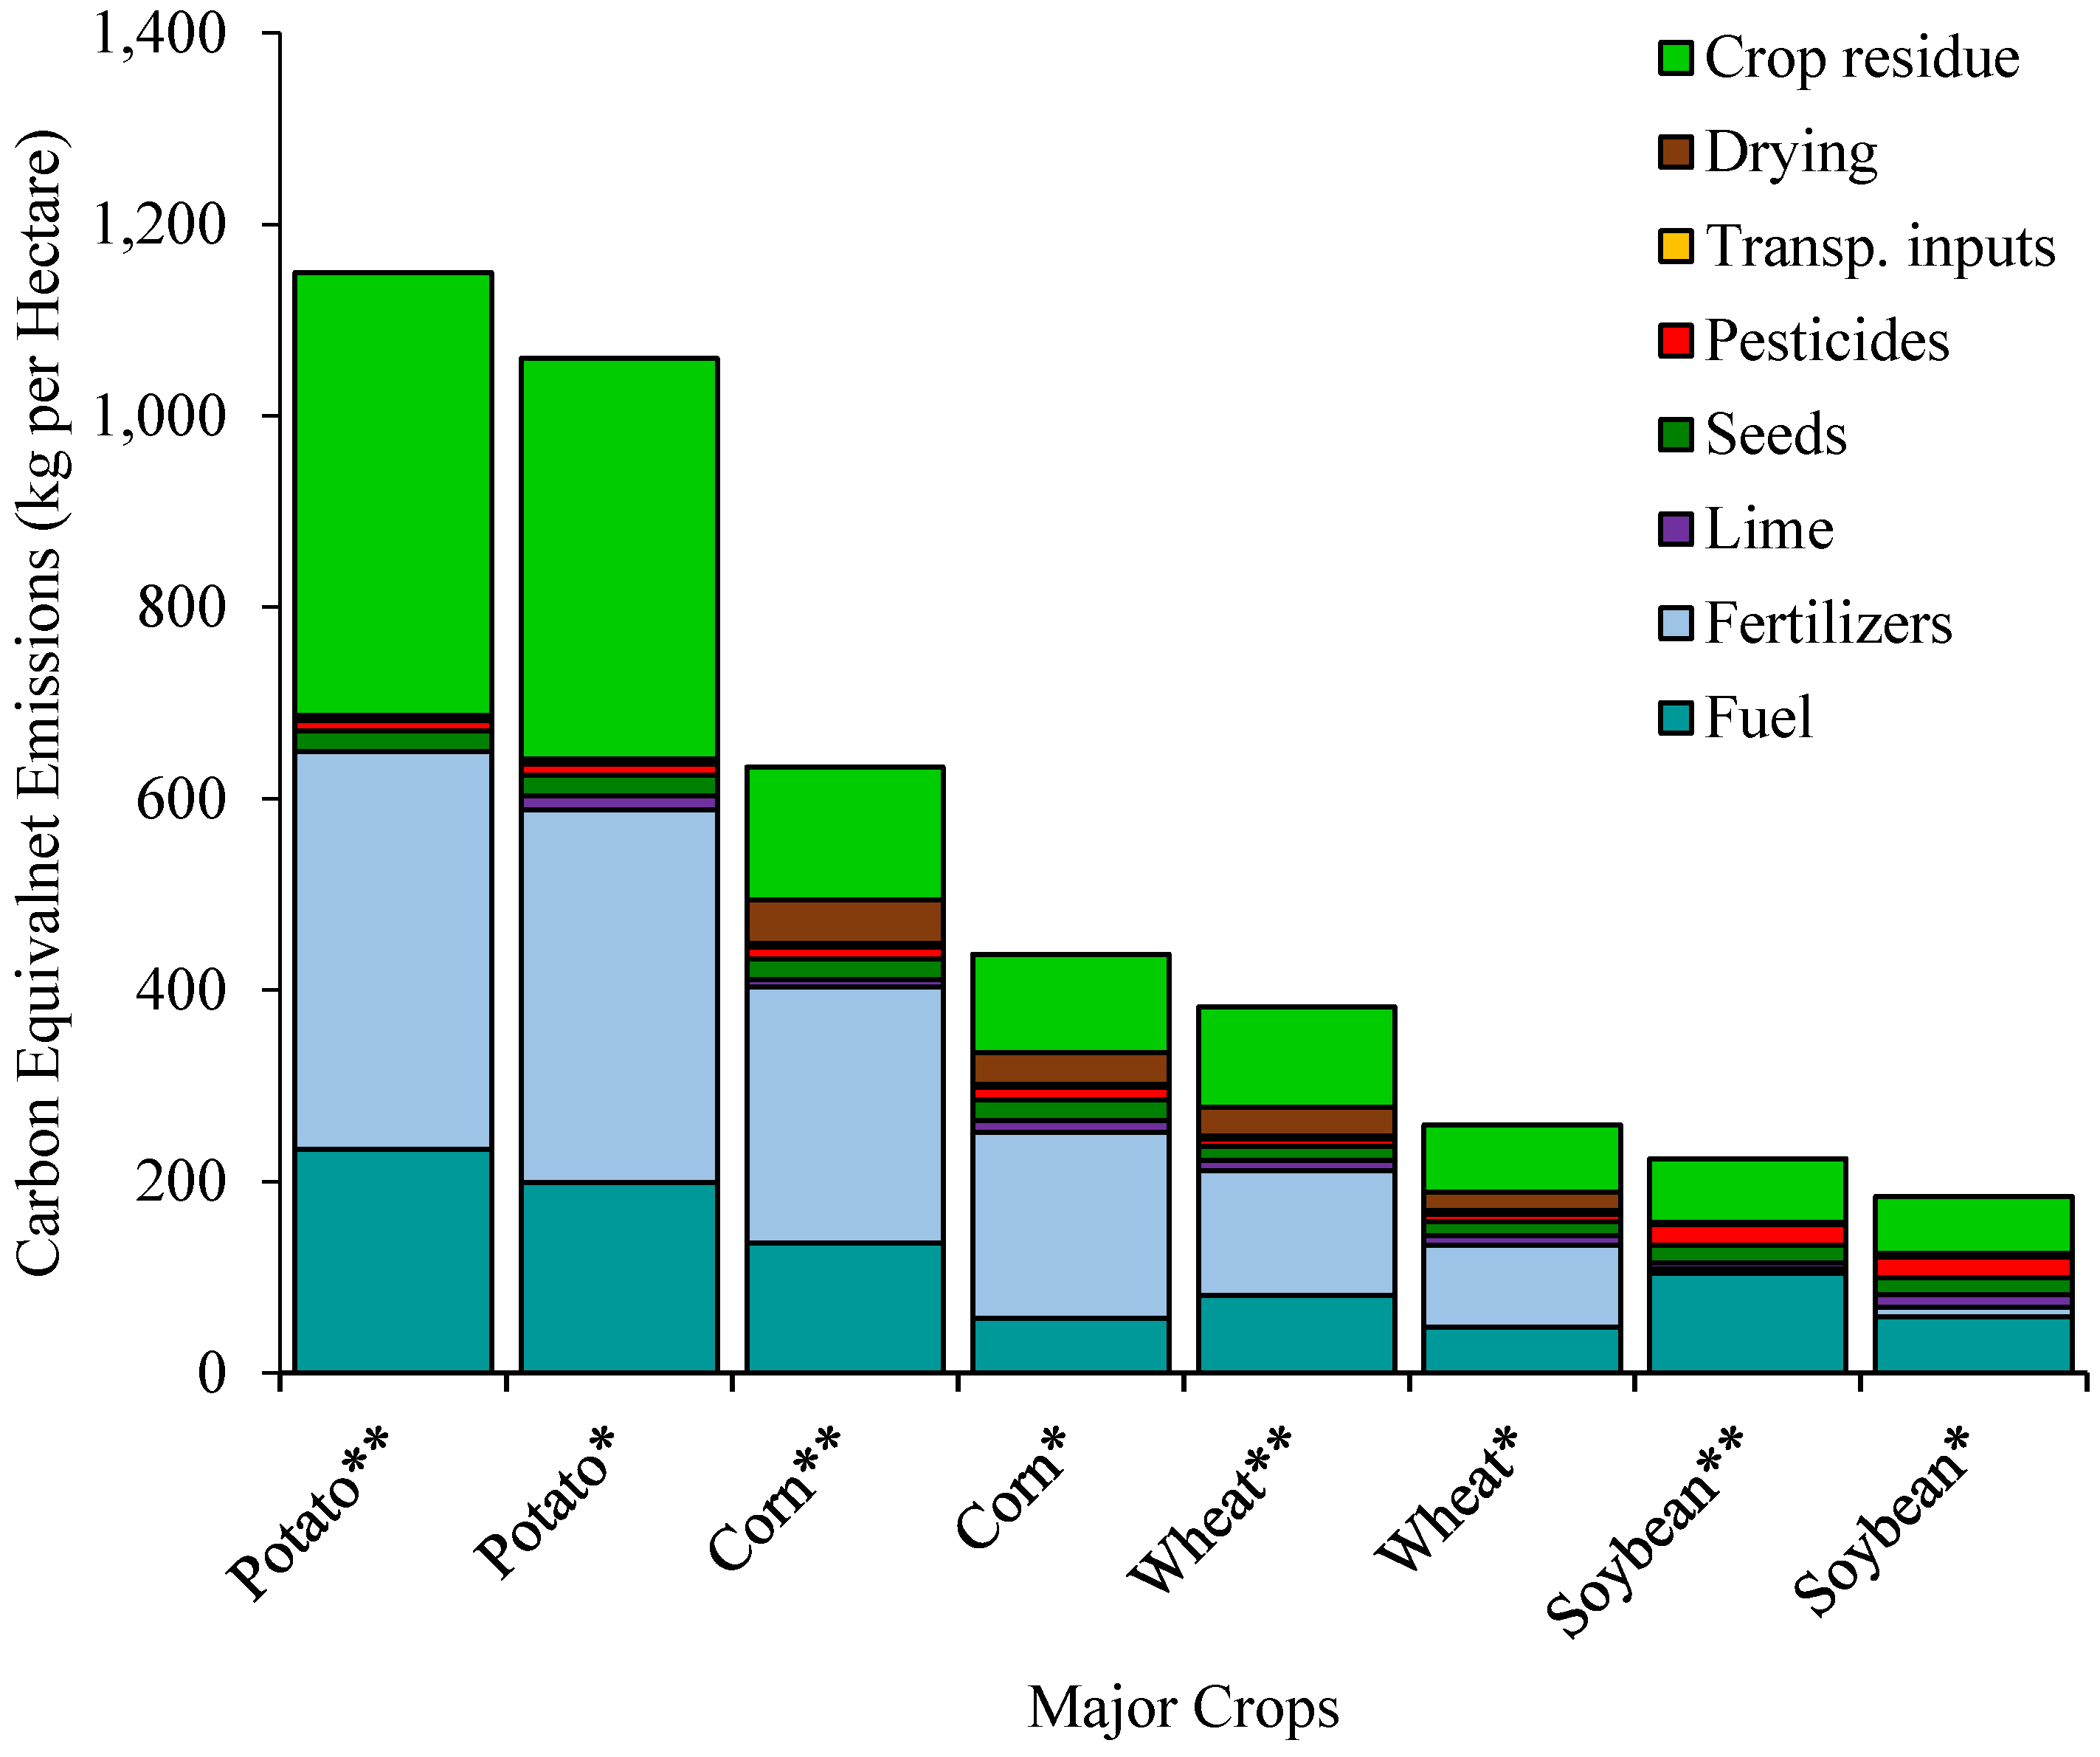
3.1. Carbon Emissions for the Major Crops and Farmsteads in the United States
3.2. Reduction of Emissions by Windbreaks on Agricultural Lands
4. Discussion
5. Conclusions
Acknowledgments
Author Contributions
Conflicts of Interest
Appendix A

| Region 1 | State | Crop | Id 2 | System Description |
|---|---|---|---|---|
| NLS | WI | Corn | 1 | Continuous corn, 155 bu. |
| Corn | 2 | Corn after soybean, 181 bu. | ||
| Soybean | 3 | Soybean after corn, 55 bu. | ||
| Wheat | 4 | No description | ||
| CB | OH | Corn | 5 | Conservation Tillage (No till) |
| Corn | 6 | Conservation Tillage (No till) | ||
| Corn | 7 | Conservation Tillage (No till) | ||
| Soybean | 8 | Conservation Tillage Corn/No-Till RR 3 Soybean | ||
| Soybean | 9 | Conservation Tillage Corn/No-Till RR Soybean | ||
| Soybean | 10 | Conservation Tillage Corn/No-Till RR Soybean | ||
| Wheat | 11 | Wheat/Corn/No-Till RR Soybeans | ||
| Wheat | 12 | Wheat/Corn/No-Till RR Soybeans | ||
| Wheat | 13 | Wheat/Corn/No-Till RR Soybeans | ||
| IO | Corn | 14 | Corn following Corn | |
| Corn | 15 | Corn following Corn | ||
| Corn | 16 | Corn following Corn | ||
| Soybean | 17 | Herbicide Tolerant Soybeans following Corn (non-irrigated) | ||
| Soybean | 18 | Herbicide Tolerant Soybeans following Corn | ||
| Soybean | 19 | Herbicide Tolerant Soybeans following Corn | ||
| SP | TX | Corn | 20 | Corn–GMO Seed, Conventional Till-12 Row, Non-irrigated |
| Corn | 21 | Corn for grain, Bt 3 Furrow irrigated | ||
| Soybean | 22 | Soybeans, RR 4, Furrow Irrigated, Following Corn or Sorghum | ||
| Soybean | 23 | Soybeans, Roundup Ready, Sprinkler Irrigated | ||
| Wheat | 24 | Continuous Wheat, Furrow Irrigated | ||
| Wheat | 25 | Continuous Wheat, Sprinkler Irrigated | ||
| DS | AR | Corn | 26 | Stacked gene, Center Pivot Irrigation |
| Corn | 27 | Stacked gene, No Irrigation | ||
| Soybean | 28 | RR, Furrow Irrigation | ||
| Soybean | 29 | RR, Center Pivot Irrigation | ||
| Soybean | 30 | RR, no Irrigation | ||
| Wheat | 31 | Table 28-A. Wheat enterprise | ||
| AP | TE | Corn | 32 | Non-Irrigated Corn, No-Till |
| Corn | 33 | Non-Irrigated Corn, Conventional Tillage | ||
| Corn | 34 | Corn, No-Till, Irrigated, 225 Bushels/Acre Yield | ||
| Soybean | 35 | Non-Irrigated Soybean Budget (No-Till) | ||
| Soybean | 36 | Irrigated Soybean Budget (No-Till) | ||
| Wheat | 37 | Wheat Budget (Conventional Tillage) | ||
| RMN | IO | Wheat | 38 | 2013 Eastern Idaho Non-irrigated Hard Red Winter Wheat Following Summer Fallow |
| Wheat | 39 | Table 1. 2013 Eastern Idaho Non-irrigated Hard White Spring Wheat: Higher Rainfall Areas. | ||
| Wheat | 40 | Table 1. 2013 Irrigated Soft White Winter Wheat for Eastern Idaho. | ||
| Potato4 | 41 | Table 1. 2013 Irrigated Russet Burbank Commercial Potatoes With Fumigation and On-Farm Storage for Eastern Idaho: Bannock, Bingham and Power Counties. | ||
| Potato | 42 | Table 1. 2013 Irrigated Russet Burbank Commercial Potatoes With On-Farm Storage for Eastern Idaho Northern Region: Bonneville and Madison Counties. | ||
| Corn | 43 | Continuous corn | ||
| RMS | CO | Corn | 44 | Table 16. 2013. non-irrigated Corn in North East Colorado, Reduced till in a two-crop in three year Rotation |
| Corn | 45 | Table 5. 2013. Irrigated Corn | ||
| Wheat | 46 | Table 15. 2013 Estimated Production Costs and Returns—Non-irrigated Winter Wheat in Northeastern Colorado. Reduced-Till in a Two-Crop in Three-Year Rotation | ||
| Wheat | 47 | Table 14. 2013. non-irrigated Winter Wheat in Northeastern Colorado, conventional tillage-Till Wheat - Fallow Rotation | ||
| Potato | 48 | Table 6. 2013 Estimated Production Costs and Returns - Irrigated Potatoes in Northeastern Colorado (550 cwt 5) | ||
| NE | MA | Potato | 49 | no Irrigation |
| NP | NE | Corn | 50 | 15. Corn, conventional tillage, continuous, 90 bu yield goal (85 bu, actual yield |
| Corn | 51 | 22. Corn, Continuous, SmartStax 6 RIB Complete, 190 bu yield goal (180 bu, actual yield), canal irrigated, gravity, 15 acre-inches | ||
| Corn | 52 | 24. Corn, no-till, SmartStax, RIB Complete 7, continuous, 250 bu yield goal (235 bu, actual yield), pivot irrigated, 800 GPM 35 PSI, 9 acre-inches | ||
| Wheat | 53 | 65. Wheat, no-till after beans, 100 bu, yield Goal (90 bu actual yield)/Pivot irrigated, 800 GPM 35 PSI, 8 acre-inches | ||
| Wheat | 54 | 63.Wheat, Clean Till Fallow, 1 Crop in 2 year, 50 bu yield goal (45 bu actual yield)/non-irrigated | ||
| Wheat | 55 | 65. Wheat, no-till wheat before corn, 2 crops in 3 year, 65 bu yield goal (60 bu actual yield) non-irrigated | ||
| Soybean | 56 | 48. Soybeans, tilled seedbed, Roundup Ready® after corn (62 bu actual yield)/pivot irrigated, 800 GPM 35 PSI, 9 acre-inches | ||
| Soybean | 57 | 47. Soybeans, no-till, Roundup Ready continuous (39 bu actual yield)/non-irrigated | ||
| Soybean | 58 | 51. Soybeans Roundup Ready, no-till narrow row, continuous (59 bu actual yield)/pivot irrigated, 800 GPM 35 PSI, 6 acre-inches |
| Number | Variable | Description |
|---|---|---|
| 1 | HDD30YEAR | Heating degree days, 30-year average 1981–2010, base 65F |
| 2 | CDD30YEAR | Cooling degree days, 30-year average 1981–2010, base 65F |
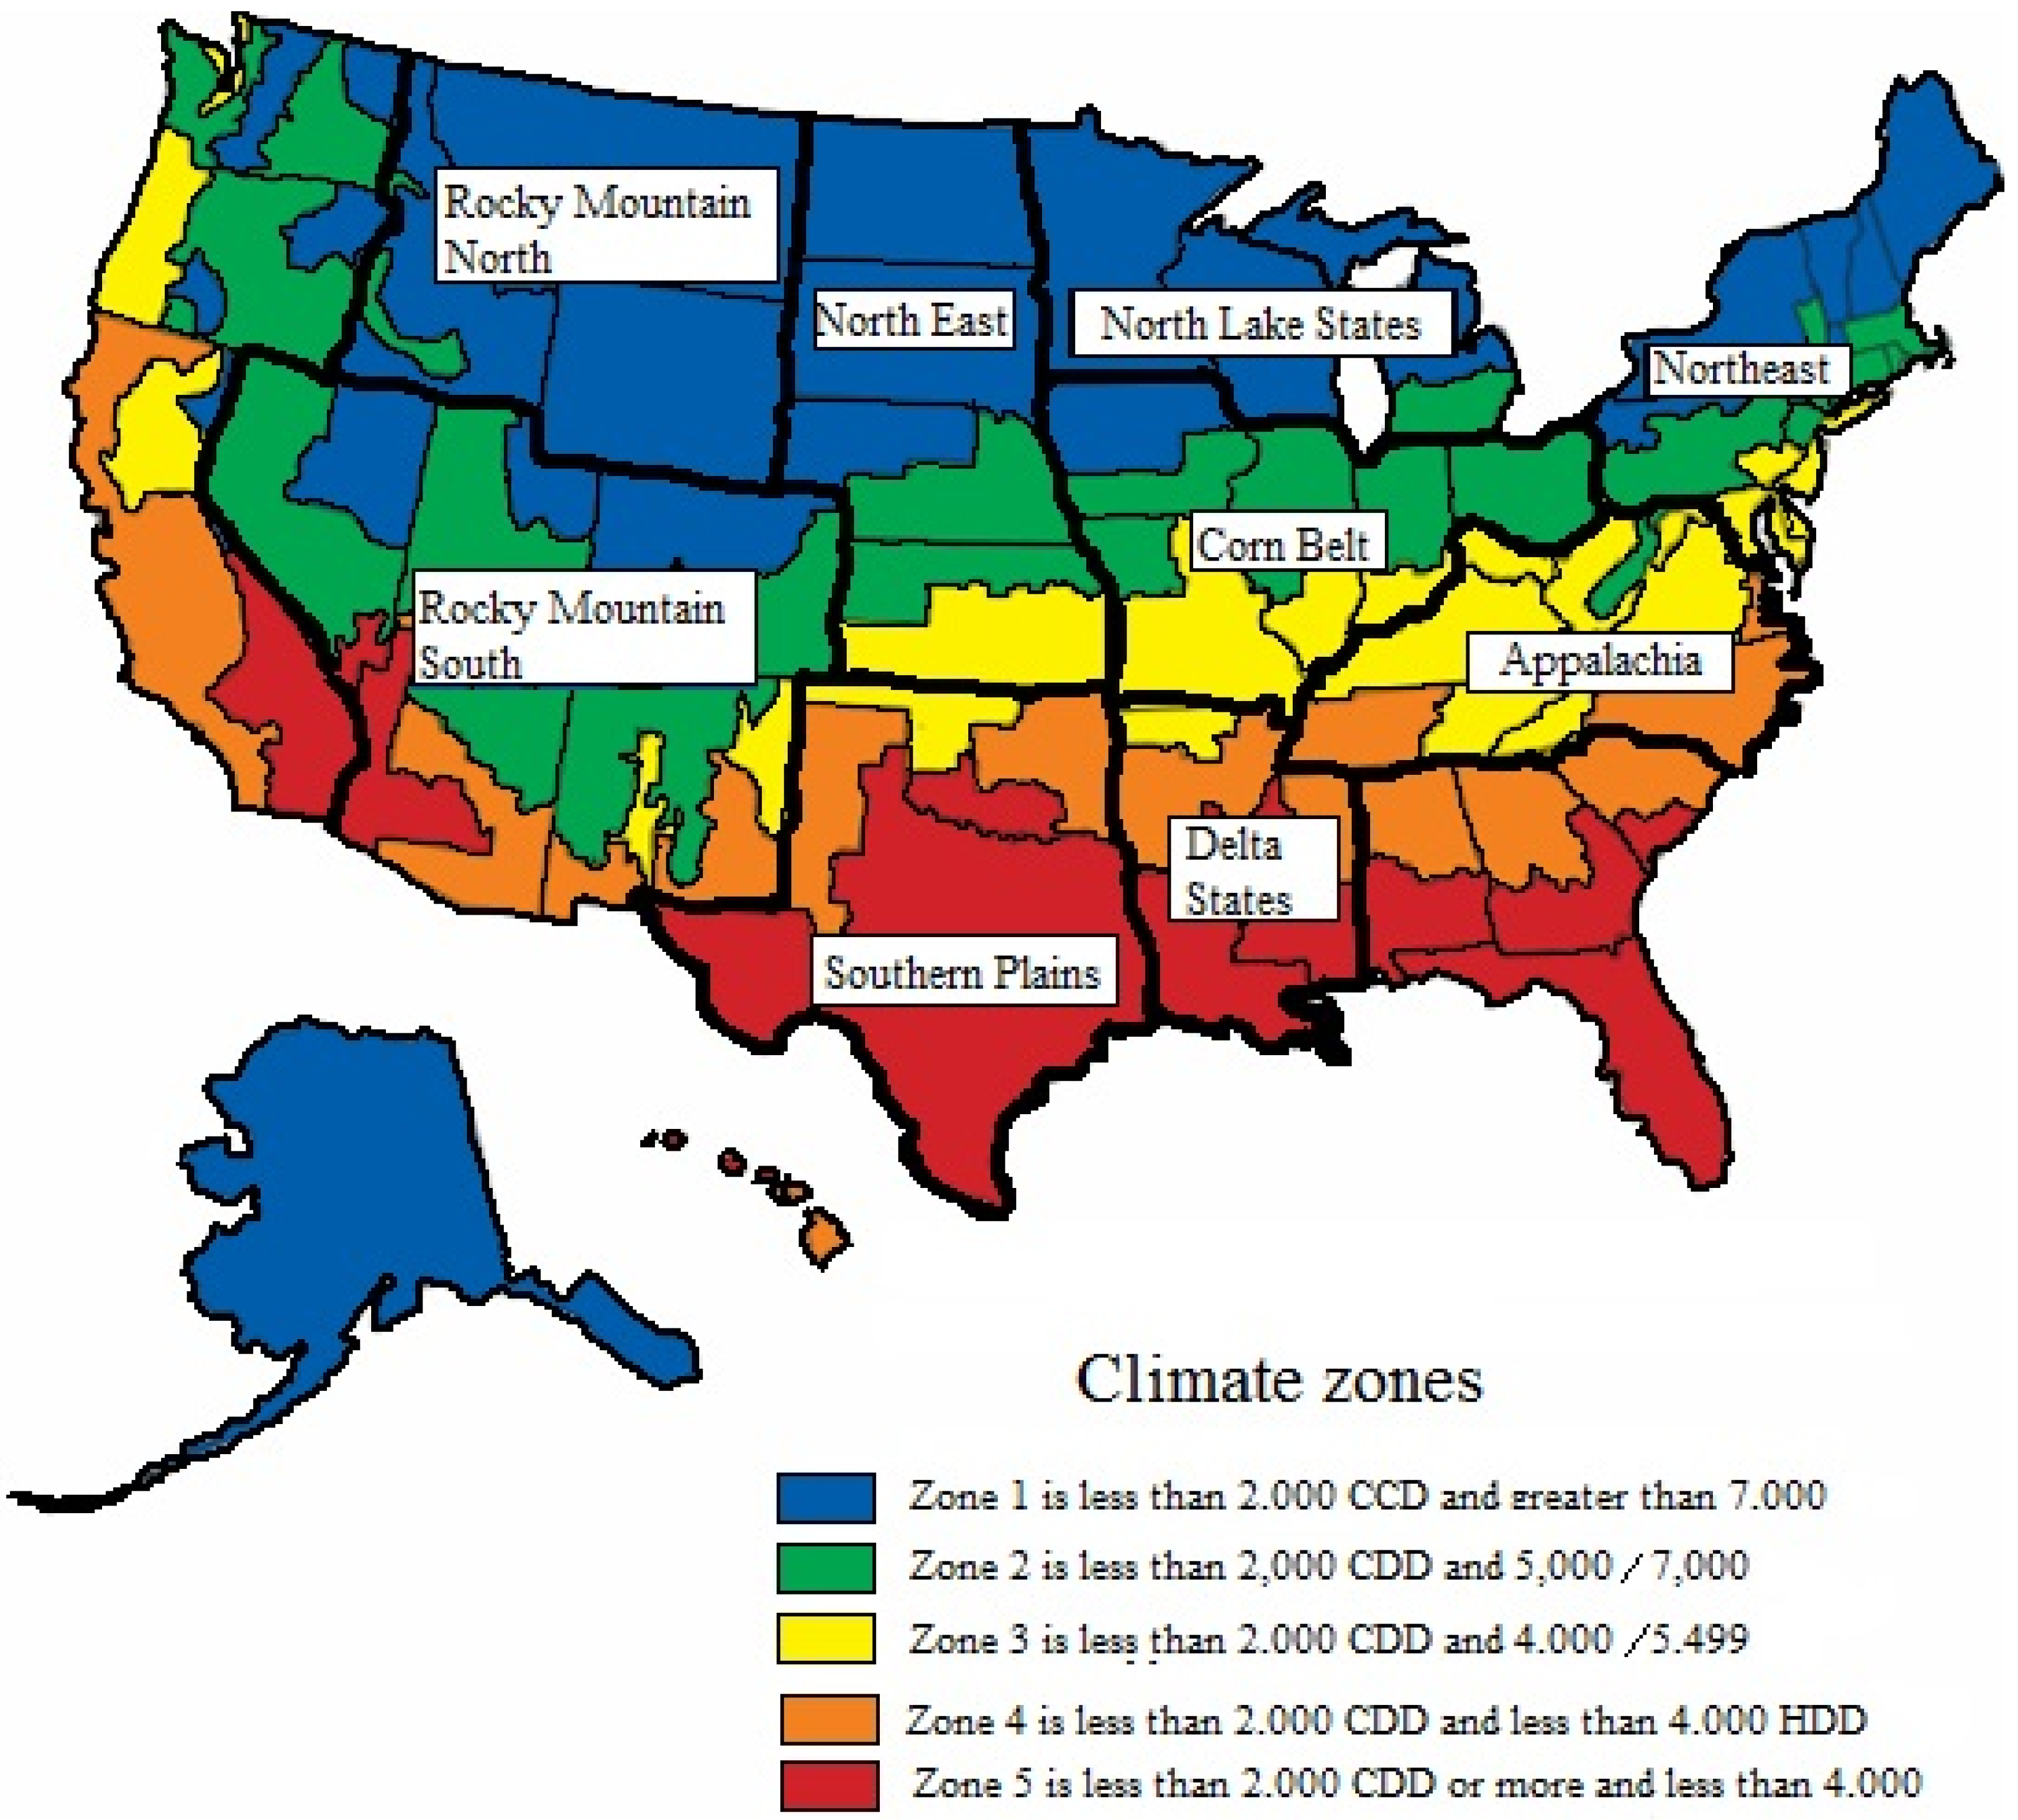
| 3 | AIA Zone | 1. Less than 2000 CDD and greater than 7000 HDD; 2. Less than 2000 CDD and 5500–7000 HDD; 3. Less than 2000 CDD and 4000–5499 HDD; 4. Less than 2000 CDD and less than 4000 HDD; 5. 2000 CDD or more and less than 4000 HDD |
| 4 | YEARMADERANGE | Year range when housing unit was built: 1. Before 1950; 2. 1950 to 1959; 3. 1960 to 1969; 4. 1970 to 1979; 5. 1980 to 1989; 6. 1990 to 1999; 7. 2000 to 2004; 8. 2005 to 2009 |
| 5 | ADQINSUL | Level of insulation (respondent reported): 1. Well Insulated; 2. Adequately Insulated; 3. Poorly Insulated; 4. No Insulation |
| 6 | TOTSQFT | Total square footage (includes all attached garages, all basements, and finished/heated/cooled attics) |
| 7 | BTUELSPH | Electricity usage for space heating, in thousand BTU, 2009 |
| 8 | BTUELCOL | Electricity usage for air-conditioning, central and window/wall (room), in thousand BTU, 2009 |
| 9 | BTUNGSPH | Natural Gas usage for space heating, in thousand BTU, 2009 |
| 10 | BTULPSPH | LPG/Propane usage for space heating, in thousand BTU, 2009 |
| 11 | BTUFOSPH | Fuel Oil usage for space heating, in thousand BTU, 2009 |
| 12 | BTUKERSPH | Kerosene usage for space heating, in thousand BTU, 2009 |
| 13 | TOTALBTUSPH | Total usage for space heating, in thousand BTU, 2009 |
| 14 | TOTALBTUCOL | Total usage for air conditioning, in thousand BTU, 2009 |
| 15 | TOTALBTUOTH | Total usage for appliances, electronics, lighting, and miscellaneous uses, in thousand BTU, 2009 |
| Energy Source | Process to Convert Energy Sources into kg CE |
|---|---|
| Electricity | kWh per home × 1232 lbs. CO2 per megawatt-hour generated × (1/(1 − 0.072)) MWh generated/MWh delivered × 1 MWh/1000 kWh × 1 metric ton/2204.6 lb = metric tons CO2 home−1/1000 * 0.27 kg CE. |
| Natural gas | Cubic feet per home × 0.0544 kg CO2 cubic foot−1 × 1/1000 kg metric ton−1 = metric tons CO2 home−1/1000 * 0.27 kg CE. |
| Liquid petroleum gas | Gallons per home × 1/42 barrels gallon−1 × 219.3 kg CO2 barrel−1 × 1/1000 kg metric ton−1 = metric tons CO2 home−1/1000 * 0.27 kg CE. |
| Fuel oil | Gallons per home × 1/42 barrels gallon−1 × 429.61 kg CO2 barrel−1 × 1/1000 kg metric ton−1 = metric tons CO2 home−1/1000 * 0.27 kg CE. |
| Region | State | Id 1 | Carbon equivalent emissions (kg CE ha−1 year−1) | |||||||||
|---|---|---|---|---|---|---|---|---|---|---|---|---|
| Bu 2 | Fuel 3 | Fertilizers 4 | Lime | Seed 5 | Pesticides 6 | Transport 7 | Drying 8 | Residue 9 | Total | |||
| RMN | ID | 41 | 1025.1 | 227.5 | 359.0 | - | 179.8 | 11.4 | 4.6 | - | 484.7 | 1267.0 |
| 42 | 864.5 | 233.4 | 328.9 | - | 151.7 | 7.7 | 4.1 | - | 409.9 | 1135.8 | ||
| RMS | CO | 48 | 1358.5 | 142.3 | 471.6 | - | 238.3 | 11.1 | 5.8 | - | 640.0 | 1509.2 |
| MS | 49 | 741.0 | 225.3 | 281.6 | - | 130.0 | 13.0 | 9.8 | - | 352.4 | 1012.1 | |
| Region | State | Id | Bu | Carbon Equivalent Emissions (kg CE ha−1 year−1) | ||||||||
|---|---|---|---|---|---|---|---|---|---|---|---|---|
| Fuel | Fertilizers | Lime | Seed | Pesticides | Transport | Drying | Residue | Total | ||||
| NLS 10 | WI | 1 | 383 | 69 | 217 | - | 19 | 11 | 2 | 35 | 107 | 459.9 |
| 2 | 447 | 69 | 159 | - | 22 | 8 | 2 | 40 | 123 | 423.6 | ||
| CB | OH | 5 | 316 | 48 | 170 | 24 | 16 | 15 | 5 | 29 | 90 | 396.4 |
| 6 | 395 | 48 | 210 | 24 | 19 | 15 | 5 | 36 | 110 | 467.3 | ||
| 7 | 474 | 48 | 249 | 24 | 23 | 15 | 6 | 43 | 131 | 539.2 | ||
| IA | 14 | 358 | 38 | 242 | - | 18 | 16 | 2 | 32 | 101 | 447.9 | |
| 15 | 408 | 69 | 243 | - | 20 | 16 | 2 | 37 | 114 | 499.8 | ||
| 16 | 457 | 69 | 244 | - | 23 | 16 | 2 | 41 | 126 | 520.7 | ||
| SP | TX | 20 | 247 | 49 | 77 | - | 12 | 16 | 1 | 22 | 72 | 248.6 |
| 21 | 494 | 269 | 322 | - | 24 | 17 | 2 | 45 | 136 | 814.8 | ||
| DS | AR | 26 | 445 | 66 | 292 | - | 22 | 13 | 3 | 40 | 123 | 558.0 |
| 27 | 309 | 66 | 208 | - | 15 | 13 | 2 | 28 | 88 | 419.2 | ||
| AP | TN | 32 | 371 | 61 | 225 | 44 | 18 | 10 | 8 | 34 | 104 | 503.8 |
| 33 | 371 | 77 | 225 | 44 | 18 | 10 | 8 | 34 | 104 | 519.8 | ||
| 34 | 556 | 78 | 316 | 44 | 27 | 10 | 9 | 50 | 152 | 686.8 | ||
| RMN | ID | 43 | 378 | 70 | 162 | - | 19 | 6 | 1 | 34 | 106 | 397.1 |
| RMS | CO | 44 | 368 | 28 | 158 | - | 18 | 18 | 1 | 33 | 103 | 359.3 |
| 45 | 450 | 60 | 192 | - | 22 | 15 | 1 | 41 | 124 | 456.6 | ||
| NP | NE | 50 | 222 | 49 | 125 | - | 11 | 8 | 1 | 20 | 65 | 278.4 |
| 51 | 469 | 156 | 203 | - | 23 | 12 | 1 | 42 | 130 | 567.0 | ||
| 52 | 618 | 186 | 280 | - | 30 | 11 | 2 | 56 | 168 | 734.2 | ||
| Region | State | Id | Bu | Carbon Equivalent Emissions (kg CE ha−1 year−1) | ||||||||
|---|---|---|---|---|---|---|---|---|---|---|---|---|
| Fuel | Fertilizers | Lime | Seed | Pesticides | Transport | Drying | Residue | Total | ||||
| NLS | WI | 4 | 197.6 | 67.1 | 99.3 | - | 28.2 | 7.7 | 3.1 | 27.7 | 96.3 | 329.4 |
| CB | OH | 11 | 143.3 | 38.5 | 74.4 | 24.0 | 20.5 | 7.7 | 6.1 | 20.1 | 71.7 | 262.9 |
| 12 | 177.8 | 38.5 | 54.4 | 24.0 | 25.4 | 7.7 | 6.1 | 24.9 | 87.3 | 268.3 | ||
| 13 | 212.4 | 37.9 | 59.0 | 24.0 | 30.3 | 7.7 | 6.1 | 29.7 | 103.0 | 297.8 | ||
| SP | TX | 24 | 148.2 | 41.3 | 81.4 | - | 21.2 | 7.7 | 2.6 | 20.7 | 73.8 | 248.8 |
| 25 | 160.6 | 54.4 | 81.4 | - | 22.9 | 7.7 | 2.6 | 22.5 | 79.5 | 271.1 | ||
| DS | AR | 31 | 148.2 | 53.9 | 155.0 | - | 21.2 | 7.7 | 3.3 | 20.7 | 73.8 | 335.5 |
| AP | TN | 37 | 148.2 | 73.7 | 106.0 | 43.6 | 21.2 | 7.7 | 8.9 | 20.7 | 73.8 | 355.6 |
| RMN | ID | 38 | 88.9 | 48.1 | 64.9 | - | 12.7 | 7.7 | 2.3 | 12.4 | 47.0 | 195.1 |
| 39 | 123.5 | 43.4 | 115.8 | - | 17.6 | 7.7 | 2.6 | 17.3 | 62.7 | 267.0 | ||
| 40 | 308.8 | 62.8 | 194.0 | - | 44.1 | 7.7 | 3.1 | 43.2 | 146.7 | 501.6 | ||
| RMS | CO | 46 | 86.5 | 34.9 | 54.1 | - | 12.4 | 7.7 | 2.2 | 12.9 | 48.3 | 172.4 |
| 47 | 71.6 | 45.1 | 42.6 | - | 10.2 | 7.7 | 2.1 | 9.8 | 38.3 | 155.8 | ||
| NP | NE | 53 | 247.0 | 165.0 | 165.3 | - | 35.3 | 7.7 | 2.8 | 34.6 | 118.7 | 529.4 |
| 54 | 123.5 | 52.9 | 78.0 | - | 17.6 | 7.7 | 2.4 | 17.3 | 62.7 | 238.6 | ||
| 55 | 148.2 | 43.5 | 115.4 | - | 21.2 | 7.7 | 2.6 | 20.7 | 73.8 | 285.0 | ||
| Region | State | Id | Bu | Carbon Equivalent Emissions (kg CE ha−1 year−1) | ||||||||
|---|---|---|---|---|---|---|---|---|---|---|---|---|
| Fuel | Fertilizers | Lime | Seed | Pesticides | Transport | Drying | Residue | Total | ||||
| NLS | WI | 3 | 136 | 60.9 | 29.7 | - | 34.0 | 17.9 | 1.8 | - | 64.7 | 209.0 |
| CB | OH | 8 | 91 | 27.5 | 8.6 | 24.0 | 22.8 | 22.5 | 5.1 | - | 58.2 | 168.7 |
| 9 | 116 | 27.5 | 8.6 | 24.0 | 29.0 | 22.5 | 5.1 | - | 58.2 | 174.9 | ||
| 10 | 138 | 27.5 | 10.3 | 24.0 | 34.6 | 22.5 | 5.2 | - | 65.5 | 189.6 | ||
| IA | 17 | 111 | 86.5 | 8.6 | - | 27.8 | 23.0 | 1.7 | - | 56.5 | 204.1 | |
| 18 | 124 | 87.2 | 9.6 | - | 30.9 | 23.0 | 1.8 | - | 60.6 | 213.0 | ||
| 19 | 136 | 88.2 | 10.5 | - | 34.0 | 23.1 | 1.8 | - | 64.7 | 222.2 | ||
| SP | TX | 22 | 148 | 178.5 | 5.1 | - | 37.1 | 21.1 | 1.3 | - | 68.7 | 311.7 |
| 23 | 148 | 137.5 | 5.1 | - | 37.1 | 21.1 | 1.3 | - | 68.7 | 270.8 | ||
| DS | AR | 28 | 124 | 56.9 | 8.5 | - | 30.9 | 22.5 | 1.7 | - | 60.6 | 181.1 |
| 29 | 124 | 58.5 | 8.5 | - | 30.9 | 22.5 | 1.7 | - | 60.6 | 182.6 | ||
| 30 | 74 | 58.5 | 8.5 | - | 18.5 | 22.5 | 1.7 | - | 45.4 | 155.1 | ||
| AP | TN | 35 | 111 | 54.5 | 4.9 | 43.6 | 27.8 | 21.4 | 7.6 | - | 56.5 | 216.4 |
| 36 | 148 | 54.5 | 4.9 | 43.6 | 37.1 | 21.4 | 7.6 | - | 68.7 | 237.8 | ||
| NP | NE | 56 | 153 | 196.3 | - | - | 38.3 | 21.4 | 1.0 | - | 70.4 | 327.4 |
| 57 | 96 | 68.2 | - | - | 24.1 | 21.4 | 1.0 | - | 70.4 | 185.0 | ||
| 58 | 146 | 187.5 | - | - | 36.4 | 21.4 | 1.0 | - | 70.4 | 316.7 | ||
| Region | State | Crop System | System Code | Climatic Zone | Scenarios for Avoided Emissions (Mg CE year−1) 1 | |||||
|---|---|---|---|---|---|---|---|---|---|---|
| House Built before 2000 | House Built after 2000 | |||||||||
| Farm Size (ha) 2 | Farm Size (ha) | |||||||||
| Small (60) | Medium (300) | Large (600) | Small (60) | Medium (300) | Large (600) | |||||
| NLS | WI | Corn | 1 | 1 | 1.93 | 7.4 | 14.3 | 1.7 | 7.3 | 14.2 |
| Corn | 2 | 1 | 1.7 | 6.8 | 13.2 | 1.6 | 6.7 | 13.0 | ||
| Soybean | 3 | 1 | 1.1 | 3.4 | 6.3 | 1.0 | 3.3 | 6.1 | ||
| Wheat | 4 | 1 | 1.4 | 5.2 | 9.9 | 1.3 | 5.2 | 9.8 | ||
| CB | OH | Corn | 5 | 2 | 1.6 | 6.4 | 12.4 | 1.5 | 6.4 | 12.4 |
| Corn | 6 | 2 | 1.8 | 7.4 | 14.4 | 1.7 | 7.4 | 14.4 | ||
| Corn | 7 | 2 | 2.0 | 8.4 | 16.4 | 1.9 | 8.4 | 16.4 | ||
| Soybean | 8 | 2 | 0.9 | 2.8 | 5.3 | 0.8 | 2.8 | 5.2 | ||
| Soybean | 9 | 2 | 0.9 | 2.8 | 5.3 | 0.8 | 2.8 | 5.2 | ||
| Soybean | 10 | 2 | 0.9 | 3.0 | 5.6 | 0.9 | 2.9 | 5.5 | ||
| Wheat | 11 | 2 | 1.1 | 4.2 | 8.1 | 1.1 | 4.2 | 8.0 | ||
| Wheat | 12 | 2 | 1.1 | 4.2 | 8.1 | 1.1 | 4.2 | 8.0 | ||
| Wheat | 13 | 2 | 1.2 | 4.6 | 8.8 | 1.2 | 4.6 | 8.8 | ||
| IA | Corn | 14 | 2 | 1.7 | 7.1 | 13.9 | 1.7 | 7.1 | 13.9 | |
| Corn | 15 | 2 | 1.9 | 7.9 | 15.4 | 1.8 | 7.8 | 15.3 | ||
| Corn | 16 | 2 | 1.9 | 8.1 | 15.9 | 1.9 | 8.1 | 15.9 | ||
| Soybean | 17 | 2 | 1.0 | 3.3 | 6.2 | 0.9 | 3.3 | 6.2 | ||
| Soybean | 18 | 2 | 1.0 | 3.4 | 6.4 | 0.9 | 3.3 | 6.3 | ||
| Soybean | 19 | 2 | 1.0 | 3.5 | 6.6 | 1.0 | 3.4 | 6.5 | ||
| SP | TX | Corn | 20 | 5 | 1.2 | 4.3 | 8.1 | 1.0 | 4.1 | 7.9 |
| Corn | 21 | 5 | 2.8 | 12.5 | 24.7 | 2.6 | 12.3 | 24.5 | ||
| Soybean | 22 | 5 | 1.3 | 4.8 | 9.1 | 1.1 | 4.6 | 9.0 | ||
| Soybean | 19 | 2 | 1.1 | 4.2 | 7.9 | 1.0 | 4.0 | 7.7 | ||
| Soybean | 23 | 5 | 1.1 | 4.0 | 7.6 | 0.9 | 3.8 | 7.5 | ||
| Wheat | 24 | 5 | 1.2 | 4.3 | 8.3 | 1.0 | 4.1 | 8.1 | ||
| Wheat | 25 | 5 | 1.2 | 4.3 | 8.1 | 1.0 | 4.1 | 7.9 | ||
| DS | AR | Corn | 26 | 4 | 1.9 | 8.6 | 17.0 | 2.0 | 8.7 | 17.0 |
| Corn | 27 | 4 | 1.5 | 6.7 | 13.0 | 1.6 | 6.7 | 13.1 | ||
| Soybean | 28 | 4 | 0.8 | 2.8 | 5.3 | 0.8 | 2.9 | 5.4 | ||
| Soybean | 29 | 4 | 0.8 | 2.8 | 5.4 | 0.8 | 2.9 | 5.4 | ||
| Soybean | 30 | 4 | 0.8 | 2.6 | 4.9 | 0.8 | 2.7 | 5.0 | ||
| Wheat | 31 | 4 | 1.3 | 5.2 | 10.1 | 1.3 | 5.3 | 10.2 | ||
| AP | TN | Corn | 32 | 4 | 1.8 | 7.9 | 15.5 | 1.8 | 7.9 | 15.5 |
| Corn | 33 | 4 | 1.8 | 8.1 | 15.9 | 1.9 | 8.2 | 16.0 | ||
| Corn | 34 | 4 | 2.3 | 10.5 | 20.6 | 2.3 | 10.5 | 20.7 | ||
| Soybean | 35 | 4 | 0.9 | 3.4 | 6.5 | 1.0 | 3.4 | 6.5 | ||
| Soybean | 36 | 4 | 0.9 | 3.6 | 6.8 | 1.0 | 3.6 | 6.9 | ||
| Wheat | 37 | 4 | 1.3 | 5.5 | 10.7 | 1.4 | 5.6 | 10.8 | ||
| RMN | ID | Wheat | 38 | 1 | 1.1 | 3.5 | 6.4 | 1.0 | 3.3 | 6.3 |
| Wheat | 39 | 1 | 1.3 | 4.5 | 8.4 | 1.2 | 4.3 | 8.3 | ||
| Wheat | 40 | 1 | 1.9 | 7.6 | 14.6 | 1.8 | 7.4 | 14.5 | ||
| Potato | 41 | 1 | 3.7 | 17.0 | 33.6 | 3.6 | 16.9 | 33.5 | ||
| Potato | 42 | 1 | 3.4 | 15.5 | 30.5 | 3.3 | 15.4 | 30.4 | ||
| Corn | 43 | 1 | 1.7 | 6.5 | 12.5 | 1.6 | 6.4 | 12.3 | ||
| RMS | CO | Corn | 44 | 1 | 1.6 | 5.9 | 11.4 | 1.4 | 5.8 | 11.2 |
| Corn | 45 | 1 | 1.8 | 7.3 | 14.1 | 1.7 | 7.2 | 14.0 | ||
| Wheat | 46 | 1 | 1.0 | 3.1 | 5.7 | 0.9 | 3.0 | 5.6 | ||
| Wheat | 47 | 1 | 1.0 | 2.9 | 5.3 | 0.9 | 2.8 | 5.2 | ||
| Potato | 48 | 1 | 4.3 | 19.8 | 39.1 | 4.1 | 19.7 | 39.0 | ||
| NE | MA | Potato | 49 | 1 | 3.3 | 14.6 | 28.8 | 3.1 | 14.5 | 28.7 |
| NP | NE | Corn | 50 | 2 | 1.2 | 4.7 | 9.0 | 1.2 | 4.7 | 9.0 |
| Corn | 51 | 2 | 2.0 | 8.8 | 17.3 | 2.0 | 8.8 | 17.2 | ||
| Corn | 52 | 2 | 2.5 | 11.2 | 22.1 | 2.5 | 11.2 | 22.0 | ||
| Wheat | 53 | 2 | 1.9 | 8.0 | 15.6 | 1.8 | 7.9 | 15.5 | ||
| Wheat | 54 | 2 | 1.1 | 3.9 | 7.4 | 1.0 | 3.9 | 7.4 | ||
| Wheat | 55 | 2 | 1.2 | 4.5 | 8.7 | 1.2 | 4.5 | 8.7 | ||
| Soybean | 56 | 2 | 1.3 | 5.0 | 9.6 | 1.2 | 4.9 | 9.5 | ||
| Soybean | 57 | 2 | 0.9 | 3.1 | 5.7 | 0.9 | 3.0 | 5.7 | ||
| Soybean | 58 | 2 | 1.3 | 4.8 | 9.3 | 1.2 | 4.8 | 9.3 | ||
References
- IPCC. Climate Change: The Physical Science Basis. Contribution of Working Group I to the Fifth Assessment Report of the Intergovernmental Panel on Climate Change. Chapter 8, Anthropogenic and Natural. 2013. Available online: https://www.ipcc.ch/pdf/assessment-report/ar5/wg1/WG1AR5_Frontmatter_FINAL.pdf (accessed on 14 February 2017).
- Schoeneberger, M.M.; Bentrup, G.; de Gooijer, H.; Soolanayakanahally, R.; Sauer, T.; Brandle, R.J.; Zhou, X.; Current, D. Branching out: Agroforestry as a climate change mitigation and adaptation tool for agriculture. Soil Water Conserv. 2012, 67, 128–136. [Google Scholar] [CrossRef]
- Brandle, J.R.; Wardle, T.D.; Bratton, G.F. Opportunities to increase tree planting in shelterbelts and the potential impacts on carbon storage and conservation. In Forests and Global Change; Opportunities for Increasing Forest Cover; Coomes, D.A., Burslem, D.F.R.P., Simonson, W.D., Eds.; American Forests: Washington, DC, USA, 1992; Volume 1, pp. 157–176. [Google Scholar]
- Caborn, J.M. Shelterbelts and Microclimate; Forestry Commission. Bulletin No. 29; Department of Forestry, University of Edinburgh: Edinburgh, UK, 1957; p. 135. [Google Scholar]
- Stoeckler, J.H. Shelterbelt Influence on Great Plains Field Environment and Crops; Forest Service Product, Research Paper; USDA: Washington, DC, USA, 1962; Volume 62, p. 2. [Google Scholar]
- Van Eimern, J.; Karscho, R.; Razumova, L.A.; Roberston, G.W. Windbreaks and Shelterbelts; Technical Note No. 59; World Meteorological Organization: Geneva, Switzerland, 1964; p. 188. [Google Scholar]
- Grace, J. Plant response to wind. Agric. Ecosyst. Environ. 1988, 22, 71–88. [Google Scholar] [CrossRef]
- Kort, J. Benefits of windbreaks to field and forage crops. Agric. Eco. Environ. 1998, 22, 165–190. [Google Scholar]
- Sun, D.; Dickinson, G.R. Wind effect on windbreak establishment in Northern Australia. Tree Plant. Notes 1994, 45, 72–75. [Google Scholar]
- Hodges, L.; Suratman, M.N.; Brandle, J.R.; Hubbard, K.G. Growth and yield of snap beans as affected by wind protection and microclimate manages due to shelterbelts and planting dates. Hort. Sci. 2004, 39, 996–1004. [Google Scholar]
- Brandle, J.R.; Hodges, L.; Tyndall, J.; Sudmeyer, R.A. Windbreak practices. In North American Agroforestry, an Integrated Science and Practice, 2nd ed.; Garrett, H.E., Ed.; American Society of Agronomy: Madison, WI, USA, 2009; pp. 75–104. [Google Scholar]
- Shaw, D.L. The design and use of living snow fences in North America. Agric. Ecosyst. Environ. 1988, 22, 351–362. [Google Scholar] [CrossRef]
- Scholten, H. Snow distribution on crop fields. Agric. Ecosyst. Environ. 1988, 22, 363–380. [Google Scholar] [CrossRef]
- Mattingly, G.E.; Harrje, D.T.; Heisler, G.M. The effectiveness of an evergreen windbreak for reducing residential energy consumption. ASHRAE Trans. 1979, 85, 428–443. [Google Scholar]
- Harrje, D.T.; Buckley, C.E.; Heisler, G.M. Building energy reductions: Windbreak optimization. J. Energy Div. Am. Soc. Civ. Eng. 1981, 108, 143–154. [Google Scholar]
- DeWalle, D.R.; Heisler, G.M. Use of windbreaks for home energy conservation. Agric. Ecosyst. Environ. 1988, 22, 243–260. [Google Scholar] [CrossRef]
- Moyer, R.L. Shelterbelt benefit to home heating cost. Trans. ASAE 1999, 33, 2–10. [Google Scholar]
- USDA National Agroforestry Centre (USDA-NAC). Windbreaks. Available online: http://nac.unl.edu/practices/windbreaks.htm (accessed on 14 February 2017).
- Ballesteros, P.W.; Brandle, J.R.; Domke, G.; Schoeneberger, M.; Blankenship, E. Estimating carbon storage in windbreak trees on U.S. agricultural lands. Agrofor. Syst. 2016, 90, 889–904. [Google Scholar]
- Helmers, G.A.; Brandle, J. Optimum Windbreak Spacing in Great Plains Agriculture (2005). Great Plains Res. 2005, 15, 179–198. [Google Scholar]
- US Energy Information Administration (USEIA). Residential Energy Consumption Survey, Microdata (RECS). Available online: http://www.eia.gov/consumption/residential/data/2009/index.cfm?view=microdata (accessed on 14 February 2017).
- US Energy Information Administration (USEIA). Residential Energy Consumption Survey, Maps: (RECS). Available online: http://www.eia.gov/consumption/residential/data/2009/index.cfm?view=microdata (accessed on 14 February 2017).
- Lal, R. Carbon emission from farm operations. Environ. Int. 2004, 30, 981–990. [Google Scholar] [CrossRef] [PubMed]
- Camargo, G.T.; Ryan, M.R.; Richard, T.L. Energy use and greenhouse gas emissions from crop production using the farm energy analysis tool. BioScience 2013, 63, 263–273. [Google Scholar]
- University of Colorado. Crop Enterprise Budgets. Available online: http://www.coopext.colostate.edu/abm/cropbudgets.htm (accessed on 14 February 2017).
- University of Idaho. Crop Budgets. Available online: http://web.cals.uidaho.edu/idahoagbiz/enterprise-budgets/ (accessed on 14 February 2017).
- University of Iowa. Estimated Costs of Crop Production in Iowa—2017. Available online: http://www.extension.iastate.edu/agdm/crops/pdf/a1–20.pdf (accessed on 14 February 2017).
- University of Kansas. Crop Budges, Sheets Budgets. Available online: http://www.sedgwick.k-state.edu/agriculture/crops/crop-budget-sheets.html (accessed on 14 February 2017).
- University of Montana. Crops Cost of Production. Available online: http://www.montana.edu/softwaredownloads/cropdownloads.html (accessed on 14 February 2017).
- University of Nebraska (Klein, N.R.). Nebraska Crop Budgets. Available online: http://cropwatch.unl.edu/budgets (accessed on 14 February 2017).
- University of Ohio. Research: Farm Management Enterprise Budgets. Available online: http://aede.osu.edu/research/osu-farm-management/enterprise-budgets (accessed on 14 February 2017).
- University of Tennessee. Field Crop Budgets. Available online: http://economics.ag.utk.edu/budgets.html (accessed on 14 February 2017).
- University of Texas. Crops and Livestock Budgets. Available online: http://agecoext.tamu.edu/resources/crop-livestock-budgets/ (accessed on 14 February 2017).
- University of Wisconsin. Enterprise Budgets: Field Crop Enterprise Budgets for 2014. Available online: http://www.uwex.edu/ces/farmteam/budgets/fieldcrop.cfm (accessed on 14 February 2017).
- US Environmental Protection Agency (USEPA). Calculations and References. Available online: https://www.epa.gov/energy/greenhouse-gases-equivalencies-calculator-calculations-and-references (accessed on 14 February 2017).
- Brandle, J.R.; Hintz, D.L.; Sturrock, J.W. (Eds.) Windbreak Technology; Elsevier Science Publishers: Amsterdam, The Netherlands, 1988; p. 598. [Google Scholar]
- McPherson, E.G. Using urban forests for energy efficiency and C storage. J. For. 1994, 94, 36–41. [Google Scholar]
- McPherson, E.G. Energy-saving potential of trees in Chicago. In Chicago’s Urban Forest Ecosystem: Results of the Chicago Urban Forest Climate Project; General Technical Report; USDA Forest service: Davis, CA, USA, 1994; p. 210. [Google Scholar]
- USDA. Census of the Agriculture: Highlights, Preliminary Report: U.S. Farms and Farmers. Available online: https://www.agcensus.usda.gov/Publications/2012/Preliminary_Report/Highlights.pdf (accessed on 2 April 2017).
- Comprehensive R Archival Network (CRAN). R Project. Available online: http://cran.r-project.org (accessed on 14 February 2017).
- Sivak, M. Air conditioning versus heating: Climate control is more energy demanding in Minneapolis than in Miami. Environ. Res. Lett. 2013, 8, 1–4. [Google Scholar] [CrossRef]
- Elliott, R.L.; Walker, W.R. Field evaluation of furrow infiltration and advance functions. Trans. ASAE 1982, 25, 396–400. [Google Scholar] [CrossRef]
- Yonts, C.D.; Eisenhauer, D.E.; Varner, D.L. Managing Furrow Irrigation Systems. Available online: http://extensionpublications.unl.edu/assets/html/g1338/build/g1338.htm (accessed on 14 February 2017).
- IPCC. Climate Change 2014: Mitigation of Climate Change. Contribution of Working Group III to the Fifth Assessment Report of the Intergovernmental Panel on Climate Change; Edenhofer, O., Pichs-Madruga, R., Sokona, Y., Farahani, E., Kadner, S., Seyboth, K., Adler, A., Baum, I., Brunner, S., Eickemeier, P., Eds.; Cambridge University Press: Cambridge, UK; New York, NY, USA, 2014; Available online: http://www.ipcc.ch/pdf/assessment-report/ar5/wg3/ipcc_wg3_ar5_full.pdf (accessed on 2 April 2017).
- McMichael, A.J.; Powles, J.W.; Butler, C.D.; Uauy, R. Food, livestock production, energy, climate change, and health. Lancet 2007, 370, 1253–1263. [Google Scholar] [CrossRef]
- Mann, L.K. Changes in soil C storage after cultivation. Soil Sci. 1986, 142, 279–288. [Google Scholar] [CrossRef]
- Davidson, E.A.; Ackerman, I.L. Changes in soil carbon inventories following cultivation of previously untilled soils. Biogeochemistry 1993, 20, 161–193. [Google Scholar] [CrossRef]
- Freibauer, A.; Rounsevell, M.D.A.; Smith, P.; Verhagen, J. C sequestration in the agricultural soils of Europe. Geoderma 2004, 122, 1–23. [Google Scholar] [CrossRef]
- Smith, P.; Martino, D.; Cai, Z.; Gwary, D.; Janzen, H.; Kumar, P.; McCarl, B.; Ogle, S.; Rice, C.; Scholes, B.; et al. Greenhouse gas mitigation in agriculture. Philos. Trans. R. Soc. B Biol. Sci. 2008, 363, 789–813. [Google Scholar] [CrossRef] [PubMed]
- Rhodes, C.J. The 2015 Paris Climate Change Conference: COP21. Sci. Prog. 2016, 99, 97–104. [Google Scholar] [CrossRef] [PubMed]
- Post, M.W. Impact of soil restoration, management and land-use history in forest-soil carbon. In The Potential of U.S. Forest Soils to Sequester Carbon and Mitigate the Greenhouse Effect; CRC Press: New York, NY, USA, 2002; p. 448. [Google Scholar]
- Schlesinger, W.H. C sequestration in soils. Science 1999, 284. [Google Scholar] [CrossRef]
- Morgan, J.A.; Follett, R.F.; Leon, H.A., Jr.; Del Grosso, S.; Derner, J.D.; Dijkstra, F.; Franzluebbers, A.; Fry, R.; Paustian, K.; Schoeneberger, M.M. Carbon sequestration in agricultural lands of the United States. J. Soil Water Conserv. 2010, 65, 6–13. [Google Scholar] [CrossRef]
- Gordon, A.M.; Thevathasan, N.V.; Nair, P.K.R. An agro-ecological foundation for temperate agroforestry. In North American Agroforestry an Integrated Science and Practice; American Society of Agronomy: Madison, WI, USA, 2009; pp. 25–41. [Google Scholar]
- Kisambuli, K.E. The Effects of Windbreaks on the Effectiveness of Sprinkler Irrigation Systems; University of Canterbury: Christchurch, New Zealand, 2015; Available online: https://ir.canterbury.ac.nz/bitstream/handle/10092/10420/thesis_fulltextpdf.pdf?sequence=1&isAllowed=y (accessed on 2 April 2017).
- Verchot, L.V.; Noordwijk, M.V.; Kandji, S.; Tomich, T.; Ong, C. Climate change: Linking adaptation and mitigation through agroforestry. Mitig. Adapt. Strateg. Glob. Chang. 2007, 12, 901–918. [Google Scholar] [CrossRef]
- Torn, M.S.; Harte, J. Missing feedbacks, asymmetric uncertainties, and the underestimation of future warming. Geophy. Res. Lett. 2006, 33, L10703. [Google Scholar] [CrossRef]
- Luedeling, E.; Smethurst, P.J.; Baudron, F.; Bayala, J.; Huth, N.I.; van Noordwijk, M.; Ong, C.K.; Mulia, R.; Lusiana, B.; Muthuri, C.; et al. Field-scale modeling of tree–crop interactions: Challenges and development needs. Agric. Syst. 2016, 142, 51–69. [Google Scholar] [CrossRef]
- Heisler, G.M. Computer Simulation for Optimizing Windbreak Placement to Save Energy for Heating and Cooling Buildings. Available online: http://www.nrs.fs.fed.us/pubs/jrnl/1991/nrs_1991_heisler_001.pdf (accessed on 14 February 2017).
- USDA Natural Resource Conservation Service (USDA-NRCS). Conservation Practice Standard: Windbreak/Shelterbelt Establishment (Feet) Code 380. Available online: http://efotg.sc.egov.usda.gov/references/public/MN/380mn.pdf (accessed on 14 February 2017).
- USDA Natural Resource Conservation Service (USDA-NRCS). Plants Database. Available online: http://www.plants.usda.gov/java/ (accessed on 14 February 2017).
- Mitsch, W.J.; Wendell, J.W.; Gilliam, P.M.; Groffman, D.L.; Hey, G.W.; Wang, R.; Wang, N. Reducing nitrogen loading to the Gulf of Mexico from the Mississippi river basin: Strategies to counter a persistent ecological problem. Bioscience 2001, 51, 373–388. [Google Scholar] [CrossRef]
- Bielinski, M.S. Selecting the right nutrient rate: Basis for managing fertilization programs. HortTechnology 2011, 21, 683–685. [Google Scholar]
- Clark, W.; Gellings, K.; Parmenter, E. Energy efficiency in fertilizer production and use. In Efficient Use and Conservation of Energy, Encyclopedia of Life Support Systems (EOLSS); Clark, W.G., Kornelis, B., Eds.; Eolss Publishers: Oxford, UK, 2004; Available online: http://www.eolss.net/sample-chapters/c08/e3-18-04-03.pdf (accessed on 14 February 2017).
- Martin, D. Estimating the Savings from Improving Pumping Plant Performance, University of Nebraska Extension, 2p. Available online: https://cropwatch.unl.edu/documents/Irrigation%20Pumping%20Plant%20Savings.pdf (accessed on 14 February 2017).
- Muratory, M. Rural Energy Use and the Challenges for Energy Conservation and Efficiency. Available online: http://www.nardep.info/uploads/Brief17_RuralEnergyConservation.pdf (accessed on 14 February 2017).
- Kort, J.; Turnock, R. Carbon reservoir and biomass in Canadian prairie shelterbelts. Agrofor. Syst. 1998, 44, 175–186. [Google Scholar] [CrossRef]
- Stoeckeler, J.H. Shelterbelt Influence on Great Plains Field Environment and Crops; Production Research Report No. 62; US Forest Service: Washington, DC, USA, 1962; p. 26.
- Pelton, W.L. The effect of a windbreak on wind travel, evaporation and wheat yield. Can. J. Plant Sci. 1967, 47, 209–214. [Google Scholar] [CrossRef]
- Staple, W.J.; Lehana, J.J. The influence of field shelterbelts on wind velocity, evaporation, soil moisture and crop yield. Can. J. Agric. Sci. 1955, 35, 440–460. [Google Scholar]
- George, E.J. Effect of Tree Windbreaks and Slat Barriers on Wind Velocity and Crop Yields; Production Research Report No. 121; USDA: Washington, DC, USA, 1971.
- Frank, A.B.; Harris, D.G.; Willis, W.O. Influence of windbreaks on crop performance and snow management in North Dakota. In Shelterbelts on the Great Plains; Tinus, R., Ed.; Great Plane Agriculture Council: Denver, CO, USA, 1975; pp. 41–48. [Google Scholar]
- Skidmore, E.L.; Hagen, L.J.; Naylor, D.G.; Teare, J.P. Winter wheat response to barrier induced microclimate. Agron. J. 1974, 66, 501–505. [Google Scholar] [CrossRef]
- Nair, P.K.R. Carbon sequestration studies in agroforestry systems: A reality-check. Agrofor. Syst. 2011, 86, 243–253. [Google Scholar] [CrossRef]
- Pearce, D.; Koundoury, P. Fertilizer and Pesticide Taxes for Controlling Non-Point Agricultural Pollution, Agriculture and Rural Development, The World Bank Group, 5. Available online: https://pdfs.semanticscholar.org/c604/76541819ed46860a11d0fba3bfd254b75d2b.pdf (accessed on 14 February 2017).
- Monsanto. Genuity SmartStax RIB Complete Corn. Available online: http://test.monsanto.com/products/pages/genuity-smartstax-rib-complete-corn.aspx (accessed on 14 February 2017).
- Dow AgroSciences. SmartStax. Available online: http://www.dowagro.com/en-us/usag/product-solution-finder/traits/smartstax (accessed on 14 February 2017).
| Energy Source | Units | BTU | kWh | Mg CE |
|---|---|---|---|---|
| Electricity | kWh | 3412.14 | 1 | 0.000164 |
| Natural gas | Cubic feet | 1030 | 0.30 | 0.000164 |
| Liquefied petroleum gas (LPG) | Gallon | 91,600 | 26.85 | 0.000164 |
| Fuel oil | Gallon | 139,000 | 40.74 | 0.000164 |
| Year Built | Energy Source | Carbon emissions (Mg CE/year/house) by Climatic Zone and Insulation Type 1 | ||||||||||||||
|---|---|---|---|---|---|---|---|---|---|---|---|---|---|---|---|---|
| Northern Regions | Sothern Regions | |||||||||||||||
| 1W | 1A | 1P | 2W | 2A | 2P | 3W | 3A | 3P | 4W | 4A | 4P | 5W | 5A | 5P | ||
| <2000 | Electricity | 1.5 | 1.9 | 2.1 | 1.5 | 1.7 | 1.8 | 2.4 | 2.6 | 2.5 | 2.7 | 2.9 | 3.1 | 3.0 | 4.1 | 4.0 |
| Natural gas | 1.4 | 1.3 | 2.3 | 1.0 | 1.5 | 1.7 | 1.6 | 1.6 | 1.7 | 1.0 | 1.4 | 1.5 | 0.7 | 1.0 | 1.4 | |
| Propane | 0.9 | 1.2 | 1.9 | 1.3 | 1.5 | 2.2 | 0.9 | 0.8 | 0.9 | 0.8 | 0.7 | 1.1 | 0.8 | 0.4 | 1.1 | |
| Fuel oil | 1.2 | 1.3 | 1.8 | 1.4 | 1.7 | 1.6 | 1.3 | 1.4 | 1.4 | 0.8 | 0.02 | 0.0 | 0.0 | 0.0 | 0.0 | |
| >2000 | Electricity | 1.8 | 1.6 | 1.9 | 1.4 | 1.4 | 2.1 | 2.2 | 2.7 | 3.4 | 2.6 | 2.7 | 2.8 | 2.9 | 2.9 | 3.9 |
| Natural gas | 2.0 | 1.2 | 1.3 | 1.3 | 1.5 | 1.2 | 1.0 | 1.6 | 2.0 | 1.3 | 1.4 | 1.7 | 1.0 | 0.9 | 0.7 | |
| Propane | 1.1 | 1.3 | 2.0 | 1.3 | 1.5 | 3.7 | 0.9 | 0.8 | 1.1 | 0.8 | 0.7 | 0.9 | 0.7 | 0.3 | 0.9 | |
| Fuel oil 2 | 2.0 | 1.7 | 2.2 | 1.6 | 2.5 | 0.0 | 0.0 | 0.0 | 0.0 | 0.7 | 0.0 | 0.0 | 0.0 | 0.0 | 0.0 | |
| Year Built | Energy Source | Total Energy Usage for Heating and Cooling CE Mg | ||||||||||||||
|---|---|---|---|---|---|---|---|---|---|---|---|---|---|---|---|---|
| Northern Regions | Southern Regions | |||||||||||||||
| 1W 1 | 1A | 1P | 2W | 2A | 2P | 3W | 3A | 3P | 4W | 4A | 4P | 5W | 5A | 5P | ||
| <2000 | Electricity heating | 0.4 | 0.4 | 0.4 | 0.3 | 0.3 | 0.4 | 0.5 | 0.5 | 0.5 | 0.4 | 0.4 | 0.5 | 0.3 | 0.5 | 0.5 |
| Electricity cooling | 0.1 | 0.1 | 0.1 | 0.1 | 0.1 | 0.1 | 0.3 | 0.3 | 0.2 | 0.4 | 0.5 | 0.5 | 0.8 | 1.0 | 1.1 | |
| Propane | 1.1 | 1.3 | 1.7 | 1.1 | 1.1 | 1.1 | 0.7 | 0.8 | 0.9 | 0.8 | 0.8 | 1.0 | 0.3 | 0.6 | 0.9 | |
| Total | 1.6 | 1.8 | 2.2 | 1.5 | 1.5 | 1.6 | 1.5 | 1.6 | 1.6 | 1.6 | 1.7 | 2.0 | 1.4 | 2.1 | 2.5 | |
| >2000 | Electricity heating | 0.5 | 0.4 | 0.2 | 0.2 | 0.1 | 0.1 | 0.4 | 0.5 | 0.6 | 0.4 | 0.4 | 0.3 | 0.3 | 0.3 | 0.3 |
| Electricity cooling | 0.1 | 0.1 | 0.1 | 0.1 | 0.1 | 0.1 | 0.3 | 0.4 | 0.2 | 0.5 | 0.6 | 0.7 | 1.0 | 1.0 | 1.2 | |
| Propane | 0.9 | 1.2 | 1.7 | 1.0 | 1.3 | 1.9 | 0.7 | 0.6 | 0.8 | 0.7 | 0.8 | 0.9 | 0.4 | 0.5 | 0.6 | |
| Total | 1.5 | 1.7 | 2.0 | 1.4 | 1.5 | 2.2 | 1.4 | 1.5 | 1.6 | 1.6 | 1.8 | 1.9 | 1.7 | 1.8 | 2.1 | |
| Crop Systems | Houses Built after 2000 | |||
|---|---|---|---|---|
| Small (60 ha) | Medium (300 ha) | Large (600 ha) | ||
| Mg CE year−1 | ||||
| (a) | ||||
| Potato ** | 73.1 | 361.3 | 720.4 | |
| Potato * | 60.1 | 294.6 | 586.6 | |
| Corn ** | 40.2 | 192.2 | 381.5 | |
| Corn * | 28.8 | 133.4 | 263.7 | |
| Wheat ** | 25.0 | 114.1 | 225.1 | |
| Wheat * | 18.5 | 80.4 | 157.6 | |
| Soybean ** | 17.6 | 76.1 | 148.9 | |
| Soybean * | 14.1 | 58.1 | 112.9 | |
| (b) | ||||
| Potato ** | 3.79 | 18.20 | 39.15 | |
| Potato * | 3.14 | 14.86 | 29.46 | |
| Corn ** | 2.14 | 9.74 | 19.21 | |
| Corn * | 1.57 | 6.80 | 13.31 | |
| Wheat ** | 1.38 | 5.84 | 11.39 | |
| Wheat * | 1.05 | 4.15 | 8.01 | |
| Soybean ** | 1.01 | 3.94 | 7.58 | |
| Soybean * | 0.84 | 3.04 | 5.78 | |
| (c) 1 | ||||
| Potato ** | 64,139 2 | 60,859 | 60,450 | |
| Potato * | 53,121 | 49,693 | 49,264 | |
| Corn ** | 36,229 | 32,572 | 32,114 | |
| Corn * | 26,526 | 22,737 | 22,263 | |
| Wheat ** | 23,351 | 19,519 | 19,040 | |
| Wheat * | 17,792 | 13,884 | 13,396 | |
| Soybean ** | 17,077 | 13,160 | 12,671 | |
| Soybean * | 14,112 | 10,155 | 9660 | |
© 2017 by the authors. Licensee MDPI, Basel, Switzerland. This article is an open access article distributed under the terms and conditions of the Creative Commons Attribution (CC BY) license (http://creativecommons.org/licenses/by/4.0/).
Share and Cite
Ballesteros-Possu, W.; Brandle, J.R.; Schoeneberger, M. Potential of Windbreak Trees to Reduce Carbon Emissions by Agricultural Operations in the US. Forests 2017, 8, 138. https://doi.org/10.3390/f8050138
Ballesteros-Possu W, Brandle JR, Schoeneberger M. Potential of Windbreak Trees to Reduce Carbon Emissions by Agricultural Operations in the US. Forests. 2017; 8(5):138. https://doi.org/10.3390/f8050138
Chicago/Turabian StyleBallesteros-Possu, William, James R. Brandle, and Michele Schoeneberger. 2017. "Potential of Windbreak Trees to Reduce Carbon Emissions by Agricultural Operations in the US" Forests 8, no. 5: 138. https://doi.org/10.3390/f8050138
APA StyleBallesteros-Possu, W., Brandle, J. R., & Schoeneberger, M. (2017). Potential of Windbreak Trees to Reduce Carbon Emissions by Agricultural Operations in the US. Forests, 8(5), 138. https://doi.org/10.3390/f8050138