Article

Assessing Pine Processionary Moth Defoliation Using Unmanned Aerial Systems

by
Adrián Cardil
1,
Udayalakshmi Vepakomma
2 and
Lluis Brotons
1,3,4,*
1
InForest Joint Research Unit (CTFC-CREAF), 25280 Solsona, Spain
2
FPInnovations, 570 Boulevard Saint-Jean, Pointe-Claire, QC H9R 3J9, Canada
3
CREAF, 08193 Cerdanyola del Vallès, Spain
4
CSIC, 08193 Cerdanyola del Vallès, Spain
*
Author to whom correspondence should be addressed.
Forests 2017, 8(10), 402; https://doi.org/10.3390/f8100402
Submission received: 11 June 2017 / Revised: 13 October 2017 / Accepted: 20 October 2017 / Published: 23 October 2017
(This article belongs to the Special Issue Optimizing Forest Inventories with Remote Sensing Techniques)

Abstract

:
Pine processionary moth (PPM) is one of the most destructive insect defoliators in the Mediterranean for many conifers, causing losses of growth, vitality and eventually the death of trees during outbreaks. There is a growing need for cost-effective monitoring of the temporal and spatial impacts of PPM in forest ecology to better assess outbreak spread patterns and provide guidance on the development of measures targeting the negative impacts of the species on forests, industry and human health. Remote sensing technology mounted on unmanned aerial systems (UASs) with high-resolution image processing has been proposed to assess insect outbreak impacts at local and forest stand levels. Here, we used UAS-acquired RGB imagery in two pine sites to quantify defoliation at the tree-level and to verify the accuracy of the estimates. Our results allowed the identification of healthy, infested and completely defoliated trees and suggested that pine defoliation estimates using UASs are robust and allow high-accuracy (79%) field-based infestation indexes to be derived that are comparable to those used by forest technicians. When compared to current field-based methods, our approach provides PPM impact assessments with an efficient data acquisition method in terms of time and staff, allowing the quantitative estimation of defoliation at tree-level scale. Furthermore, our method could be expanded to a number of situations and scaled up in combination with satellite remote sensing imagery or citizen science approaches.

1. Introduction

Defoliating insects causing large-scale outbreaks such as the pine processionary moth (Thaumetopoea pityocampa Dennis and Schiff., Lepidoptera: Notodontidae; henceforth PPM) are considered as a major driver of forest dynamics in many regions [1]. Populations of these species rise periodically to explosive population levels and induce critical impacts in key vegetation processes such as tree vitality or survival [2]. PPM is one of the most destructive pests in Mediterranean countries [3] and although it attacks several tree species, Pinus sp. are the most susceptible. PPM caterpillars usually damage and weaken conifer trees by extensively feeding on their foliage, causing large-scale defoliation events. Occasionally, these outbreaks can also be a direct cause of tree mortality, especially in the case of multiple stressors co-occurring in space and time. Most commonly, PPM outbreaks cause large-scale impacts on forests due to the extensive defoliation, leading to significant decrease in tree growth and reproductive capacity [4]. Additionally, PPM usually triggers decreased tree resistance and resilience against other disturbances such as forest fires, drought conditions or other pests [5]. The fine hairs of caterpillars contain thaumetopoein, a toxin which, when in contact with the skin of humans or other animals, can cause allergic reactions such as extreme skin irritation or respiratory problems and can also be a threat to public health [6].
PPM is a native species of the Mediterranean region including North Africa, southern Europe and some areas of the Middle East. However, in the last decades, and probably as a result of increasing winter temperatures, the area affected by PPM in Europe is expanding northwards and upwards, affecting higher altitude and latitude areas where, until recently, it was absent [3]. Hence, there is an urgent need for the development of cost-effective, detailed assessments and monitoring programs of PPM; insights need to be made into the species spatio-temporal dynamics and impact on forests at local scales, and this knowledge needs to be expanded with information obtained at large spatial scales. The collection of information at these relevant spatial scales is required to develop comprehensive forest management programs aimed at understanding the dynamics of the species to identify adequate measures to minimize the negative impacts of the species in forestry and public health. However, cost-effective means of acquiring such key biological information are currently lacking.
Conventionally, the degree of infestation and mortality by PPM in pine stands [7,8,9] is commonly assessed visually through interpretation of aerial photographs [10] or most commonly in the field 4 by forestry technicians. However, field inventories are expensive and require a large amount of manpower [11,12] and resources while time-series of aerial photographs taken in periods relevant to assess PPM impacts are not always readily available and/or lack the adequate detail. In addition, visual examinations are subjective if not carefully validated and may not always provide the required quantitative information needed when assessing spatial variability in PPM impacts. Multi-temporal satellite images and remote sensing products such as Landsat Thematic Mapper (TM), Moderate Resolution Imaging Spectroradiometer (MODIS), TerraSAR-X and light detection and ranging (LiDAR), have been extensively used in forest health detection of attacks by pest insects [10,13,14,15] and were found to be useful for insect outbreak surveys at large spatial scales [16]. However, even medium resolution remote sensing products are unable to capture patchy patterns in agroforestry mosaics or capture the complex defoliation patterns caused by PPM at local scales [16]. We are not aware of studies that assess PPM defoliation at fine forest scales at the tree level using remote sensing platforms [17]. Owing to the restrictions in terms of its range, safety and operations, currently the unmanned aerial system (UAS) platform is suitable for local-scale assessment, validation and sampling that can be combined with high-resolution aerial or satellite imagery for broader spatial scale assessment [18].
Over recent years, there has been an enormous increase in the use of UASs due to low infrastructure requirements, ease of deployment, acquisition and suitability for photogrammetric workflows [19,20]. UASs may be used to identify and characterize the level of infestation at tree levels given their ability to capture cloud-free images [21] at high-resolution with off-the-shelf miniaturized sensors. The current availability of photogrammetric software allows the handling and processing of large spatial datasets. UASs have been used not only in large-scale applications such as forest fire analysis, meteorology, forest inventories or vegetation mapping [18,22,23] but also in fine-scale studies on inventory forest resources [19], to map diseases [24], to assess pest damages at tree-level scale [16] in forested landscapes [25,26], to quantify spatial gaps or estimate post-harvest soil displacement [27]. UAS platforms are becoming established for low-cost image acquisition at local scales which makes this technology an interesting option in forestry applications.
In this study, we aim to evaluate the potential of using high-resolution RGB imagery acquired from an UAS platform and image processing techniques to quantitatively assess PPM impact on pine forests. We used field data to validate these results and identify the level of detail and accuracy of impact variables that can be obtained to investigate the spatial dynamics of the pest. More precisely, the present study attempts to (1) develop a method using high-resolution, RGB images collected with UASs to automatically quantify defoliation by PPM for individual trees, (2) assess the effectiveness of this method to assess the ratio of healthy vs. infested trees on a given forest stand; (3) explore the potential of the method to retrieve within-forest stand PPM impact patterns derived from tree-level defoliation estimates and relate them to commonly used surrogates of infestation such as PPM nest abundance.

2. Materials and Methods

2.1. Study Area

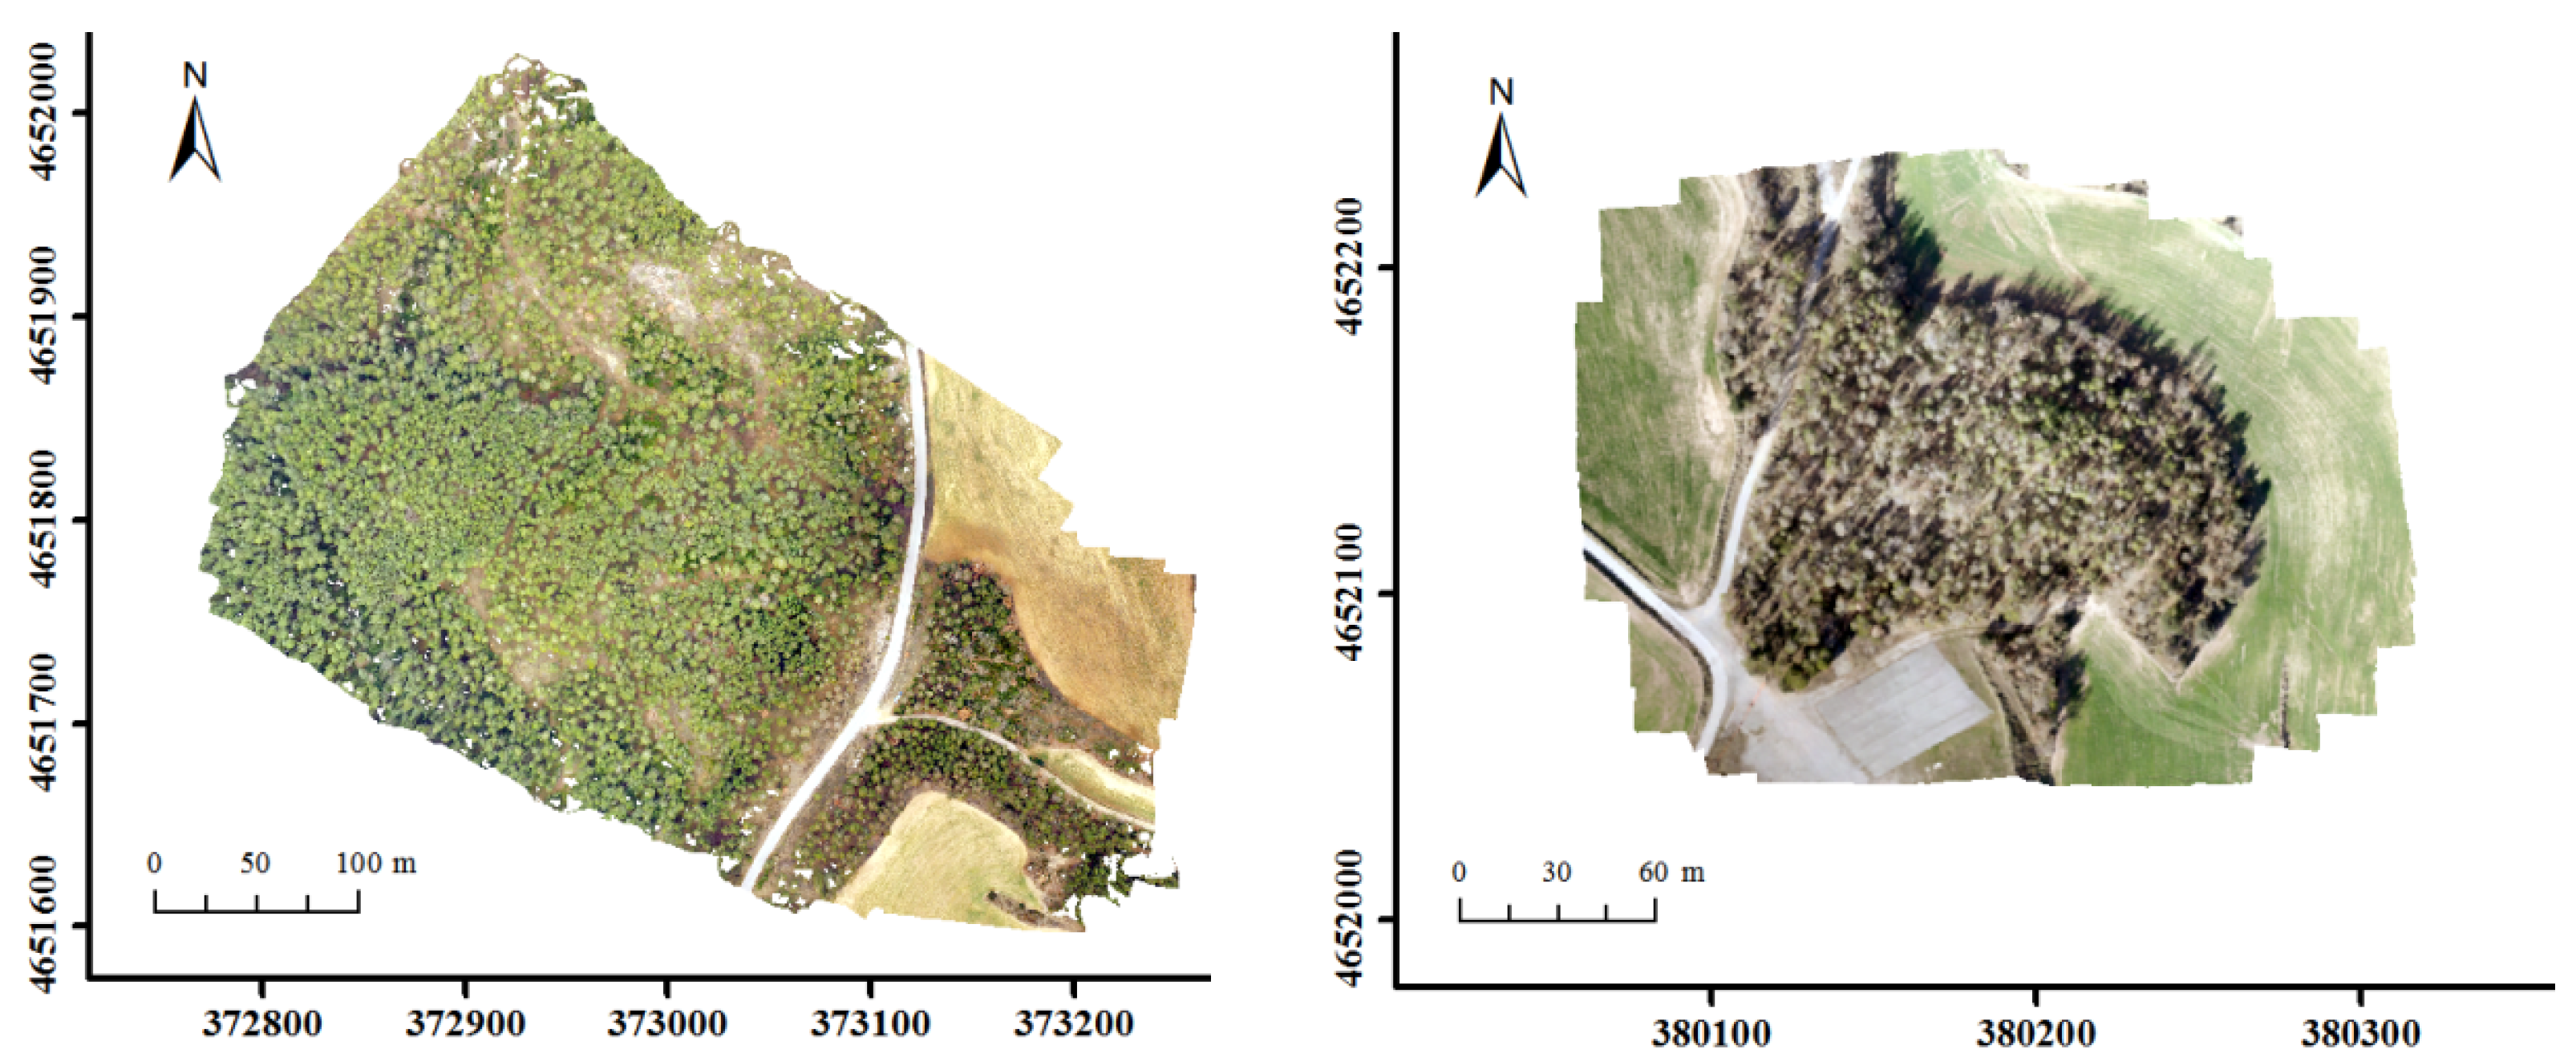
The study was conducted near the city of Solsona (Lleida, Catalonia, NE Spain, Figure 1). The area has a Mediterranean climate with hot dry summers and mild wet winters. The vegetation is mostly comprised of forest and shrubland. Evergreen species occur in 60% of the total forest area, 73% of which is occupied by conifers (mainly Pinus sylvestris L., Pinus halepensis Mill, and Pinus nigra Arn), with sclerophyllous and deciduous species (Quercus ilex L., Quercus faginea Lam. and Quercus suber L.) covering the remaining 40% [28]. The study was carried out in two different areas located in Catalonia, Spain: “Torregassa” (42°0′26″ N, 1°28′03″ E) and “Bosquet” (42°0′43″ N, 1°33′11″ E). The dimensions of the areas were 495 m × 425 m (21 ha) and 180 m × 200 m (3.6 ha), respectively (Figure 2).

2.2. PPM Life Cycle

PPM is adapted to different environmental conditions and feeds on different plant hosts such as pines [29]. The life cycle is characterized by a short-lived moth which typically lives one night and emerges in summer (June–August), larval feeding during fall and winter, and pupation in the soil followed by a short or prolonged (up to 7 years) diapauses [1,9,30]. The female moth produces pheromones in the summer to attract the male moth. A single female can lay up to 300 eggs in a mass on pine needles after mating. PPM spreads across the landscape due to male moths being able to fly up to 10 km and female moths up shorter distances of up to 2 km. Once eggs are laid on pine needles, both sexes die. These eggs hatch into minute caterpillars one month later [29]. Caterpillars eat pine needles during the night in winter (October–March) and build white nests on the tip of pine branches where they spend the day and cold winter nights. Caterpillars leave the trees in late winter (March–April), and follow a leader in a long procession to finally burrow themselves in the ground. Once underground, they will lay dormant as pupae until the moth comes out—usually the following summer.

2.3. UAS-Based Image Acquisition and Data Preprocessing

High spatial resolution image data was collected using a quadcopter (UAS Phantom 3 from DJI). This UAS is light weight (1280 g) and capable of autonomous, waypoint flight following a preplanned route. For this study, it was equipped with an RGB digital camera of f/2.8 lens with a field of view (FOV) of 94 degrees to shoot high density (HD) video at up to 30 frames per second of 12 megapixel resolution. Image acquisition in the study areas “Torregassa” and “Bosquet” was completed in March when tree defoliation was at its peak. The flying altitude was between 80 m in Bosquet and 100 m in Torregassa above ground level in both flights. In all, 143 and 82 images were collected to cover the areas of interest in Torregassa and Bosquet respectively and several videos at 20 m altitude were recorded in a selected region for validation (Figure 3) to facilitate the counting of nests from the air.
Point clouds, 3D reconstruction, and digital surface models (DSM) were generated using automated workflows and SFM (Structure from motion) methods within Agisoft’s Photoscan Professional (v1.2.4) photogrammetric software. Then, orthomosaics were generated for our two study sites (ground sampling distance (GSD) of 1.5 cm for Torregassa and 2.5 cm for Bosquet). Details of the specific algorithms used in Photoscan are beyond the scope of this paper; we refer the interested reader to [31,32]. The overlapping imagery, synchronized GPS position of each image that was automatically tagged during acquisition and the DGPS positions of three reference targets were used as inputs. Photoscan follows a common SfM (structure from motion) and Multiview stereopsis workflow with image identification and feature matching. Image geotags help this process. After initial alignment through bundle adjustment, the resultant sparse cloud was assessed for projection errors, followed by reconstruction of dense point clouds and gridding of these point clouds to generate a DSM (digital surface model) using the cartographic UTM projection system. Projecting original photos onto the 3D models, blending of the overlap areas produced an orthomosaic of images. A DSM was created automatically in Photoscan by classifying the dense point clouds. Normalizing the DSM by subtracting the DEM (digital elevation model), a canopy height model (CHM) raster of 1 m resolution was then calculated. Photogrammetric outputs of Bosquet were used for training the classification models that were then applied to Torregassa. Validation and accuracy assessment of the methods developed was performed on the Torregassa site.

2.4. Field Validation Data

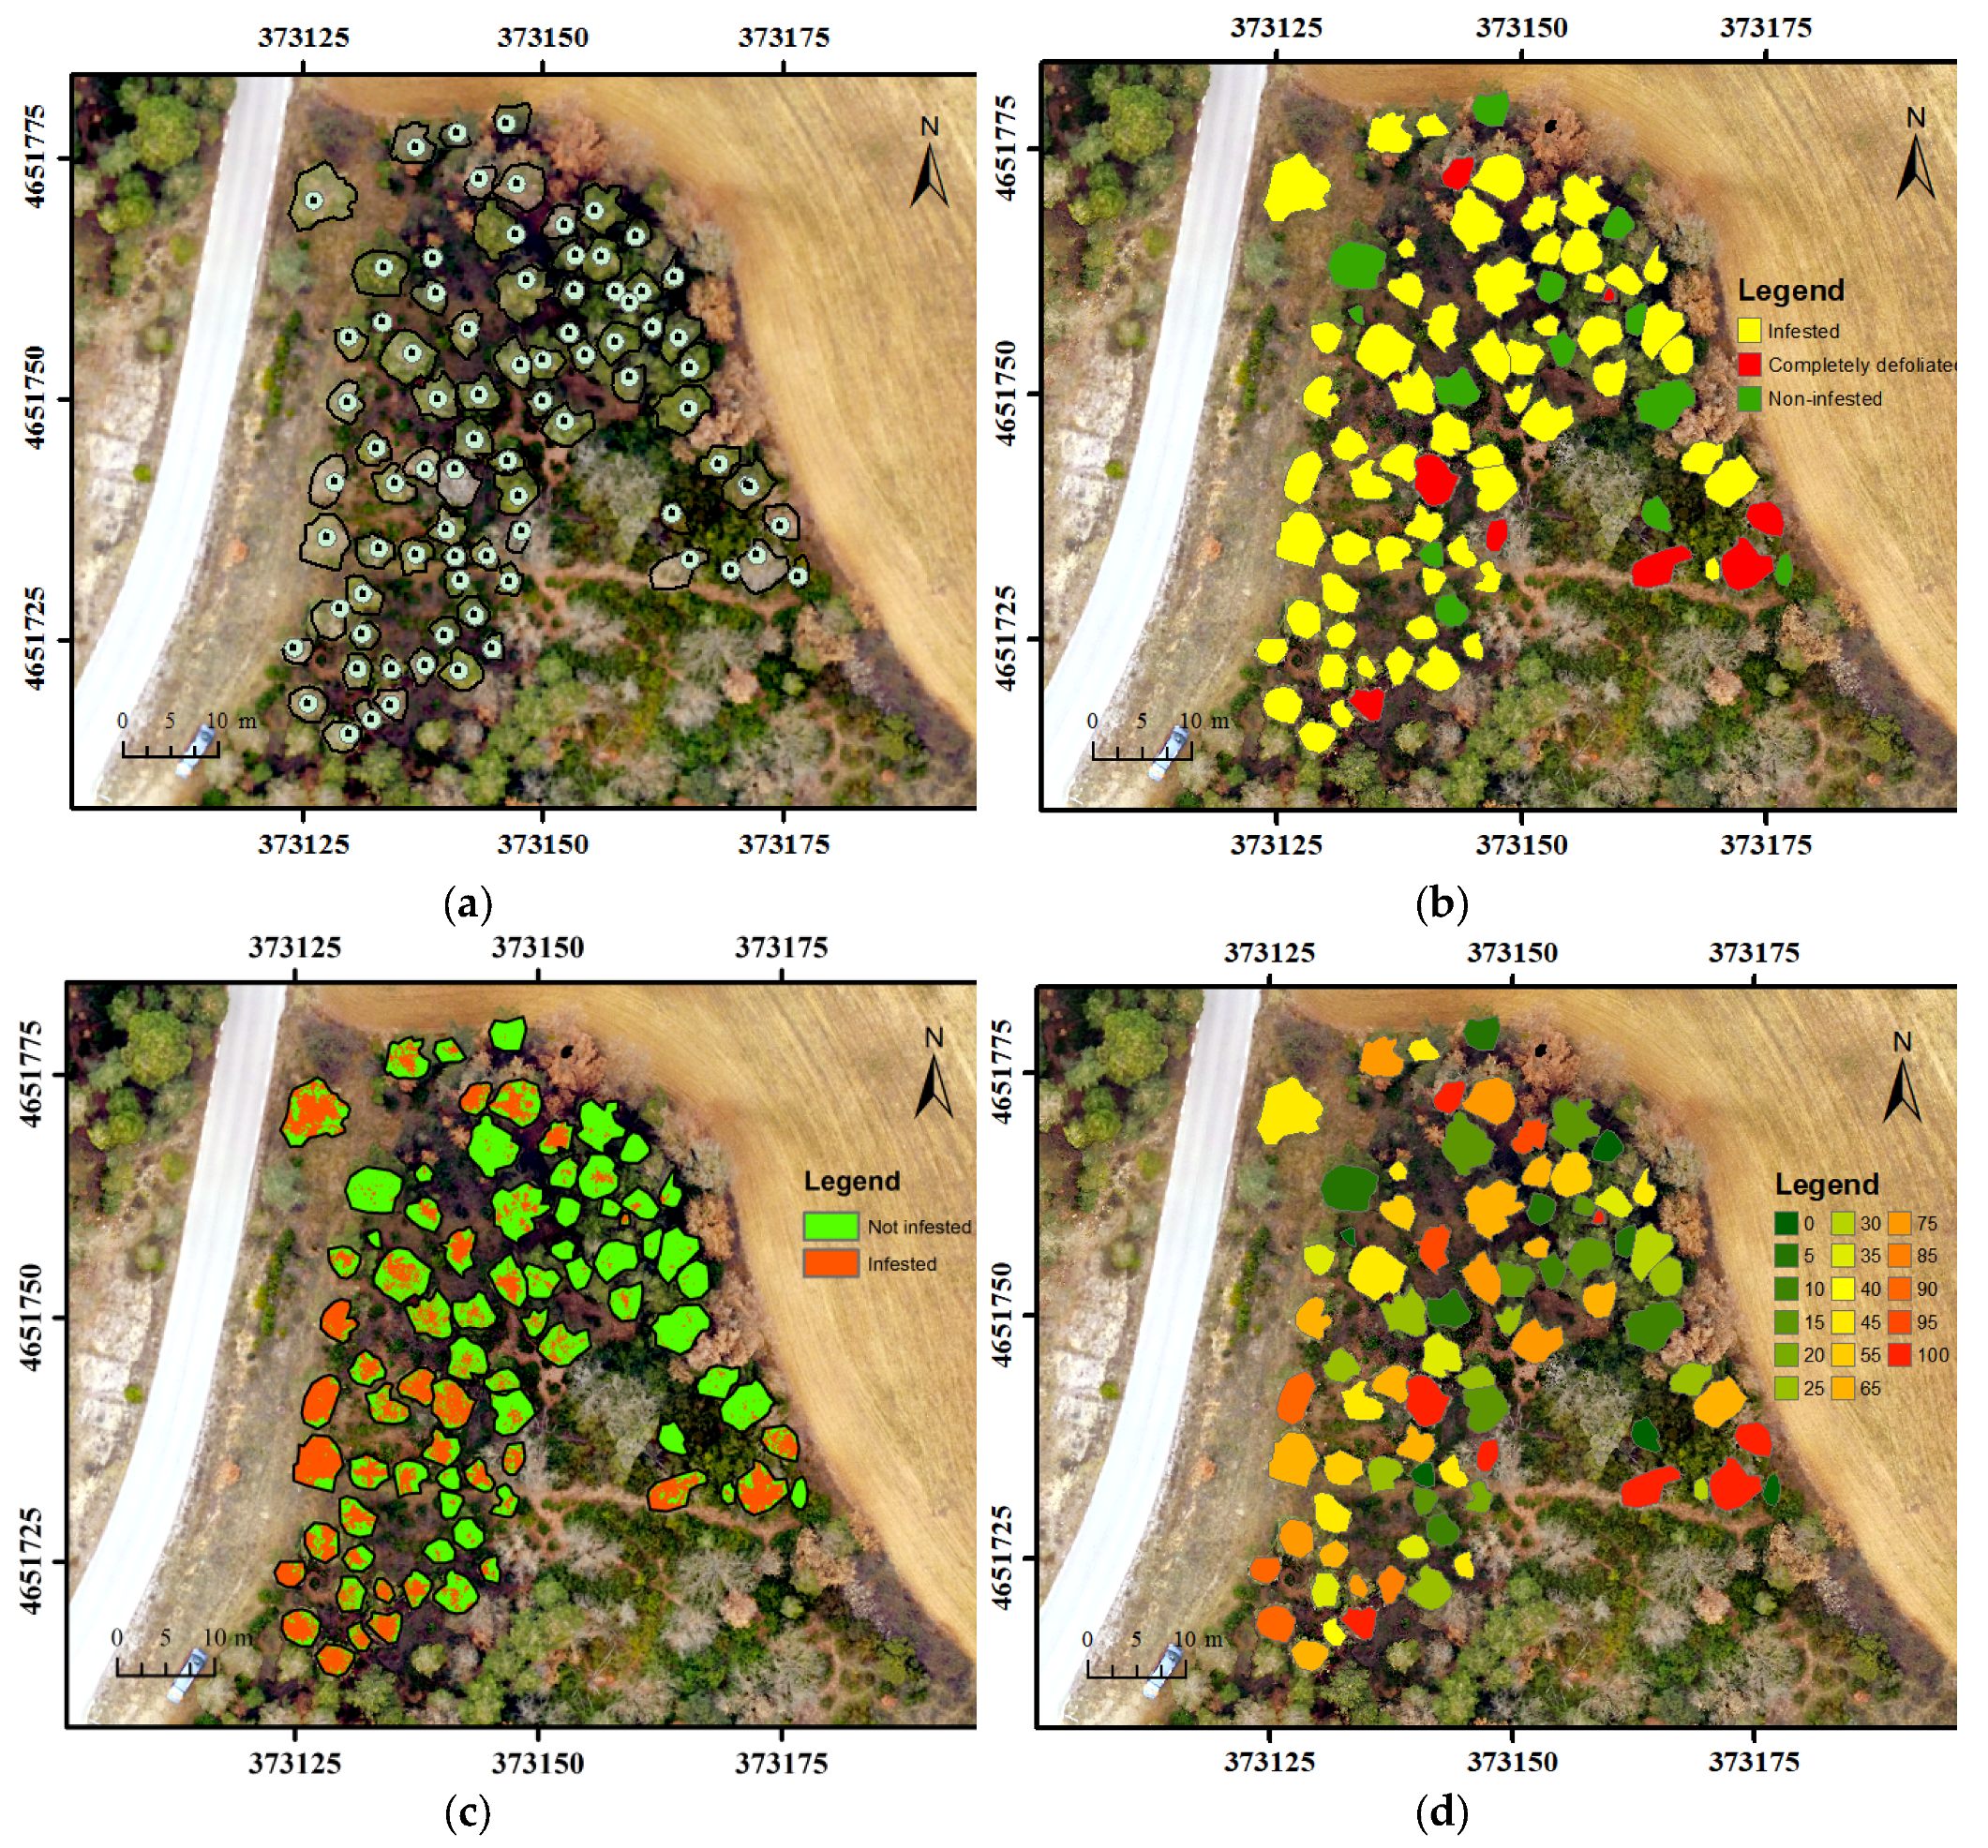
Field validation data was acquired at tree level in the Torregassa site, and the assessment of PPM defoliation levels was visually conducted on 81 selected trees in close proximity for convenience (n = 81; Figure 3). A tree was classified as infested when the percentage of defoliation was higher than 10% considering the tree crown. Thus, selected trees were classified in the field as infested (60), non-infested (13) and completely defoliated (8) (Figure 3). The percentage of defoliation in completely defoliated trees was 100% and in infested trees ranged from 10 to 95%. The mean percentage of defoliation in infested trees was 44.3% with a standard deviation of 26.1%.
We observed that insect impact was generally stronger on the sunnier sides of the crowns (southern aspect), and PPM defoliation was therefore assessed only considering this section. We also recorded both the location and the number of nests in each selected tree. Since counting of nests on each tree was difficult from the ground, available videos were used in the selected region for validation. Due to the difficulties in measuring the total number of nests in completely defoliated trees, these trees were not included in statistical analysis conducted for nests.

2.5. Data Analysis

2.5.1. Image-Based Defoliation Assessment

RGB images from Bosquet were used to train the defoliation assessment workflow at the tree level and later applied to the Torregassa site. Training areas were visually selected to generate class-signatures on the orthomosaic, identifying infested, non-infested (i.e., healthy) crowns, nests, roads, fields, soil, rocks and shadow classes that were manually traced. A minimum of 30 training areas for each class and over 100 for infested/healthy crowns were collected. A supervised maximum likelihood classification (ArcMap 10.3, ESRI Inc., Redlands, CA, USA) was then applied on the orthomosaics with a resolution of 3 cm. Assuming that the sample space is normally distributed multi-dimensional space, this algorithm adopts a Bayesian decision process. The method considers both the variances and covariances of the class signatures when assigning each cell to one of the classes represented in the signature file (ArcMap 10.3). A class can be characterized by the mean vector and the covariance matrix. Given these two characteristics for each cell value, the statistical probability is computed for each class to determine the membership of the cells to the class. The trained signature files obtained from the Bosquet dataset were applied to the Torregassa images.

2.5.2. Tree-Level Defoliation

To assess defoliation at the individual tree level, the location of individual tree tops was determined by assuming that pixels associated with tree tops are at higher altitudes than surrounding pixels on the CHM within a defined buffer [33]. A local maxima filter with a circular non-overlapping moving window of size 1 m (determined based on field crown measurements) was then applied on a twice Gaussian filtered CHM. After tree identification, a buffer of 1 m around the tree top was set to systematically quantify the percentage of defoliation by PPM in each tree. A tree was classified as infested when more than 10% of pixels were infested. NoData pixels (when the buffer reaches areas outside the crown) were not considered in the analysis. Independently, 81 individual tree crowns were manually onscreen-digitized on the orthomosaic image to validate results at the Torregassa site considering the whole crown (Figure 3).

2.5.3. Accuracy of Infested Tree Identification and Validation of Percent Defoliation

To assess image classification accuracy in our PPM defoliation estimates at the tree level and to distinguish between infested and non-infested trees, we computed a confusion matrix of 81 trees that were field identified in the Torregassa site and compared them with the obtained image classifications. Validation of the defoliation classification was performed by comparing field measured defoliation against the classification-derived defoliation at tree level using both tree manual segmentation and a buffer of 1 m from the tree automatic identification point (Figure 3), validating the classification for the whole population.

3. Results

3.1. Field Validation on PPM Defoliation Using RGB-UAS Images

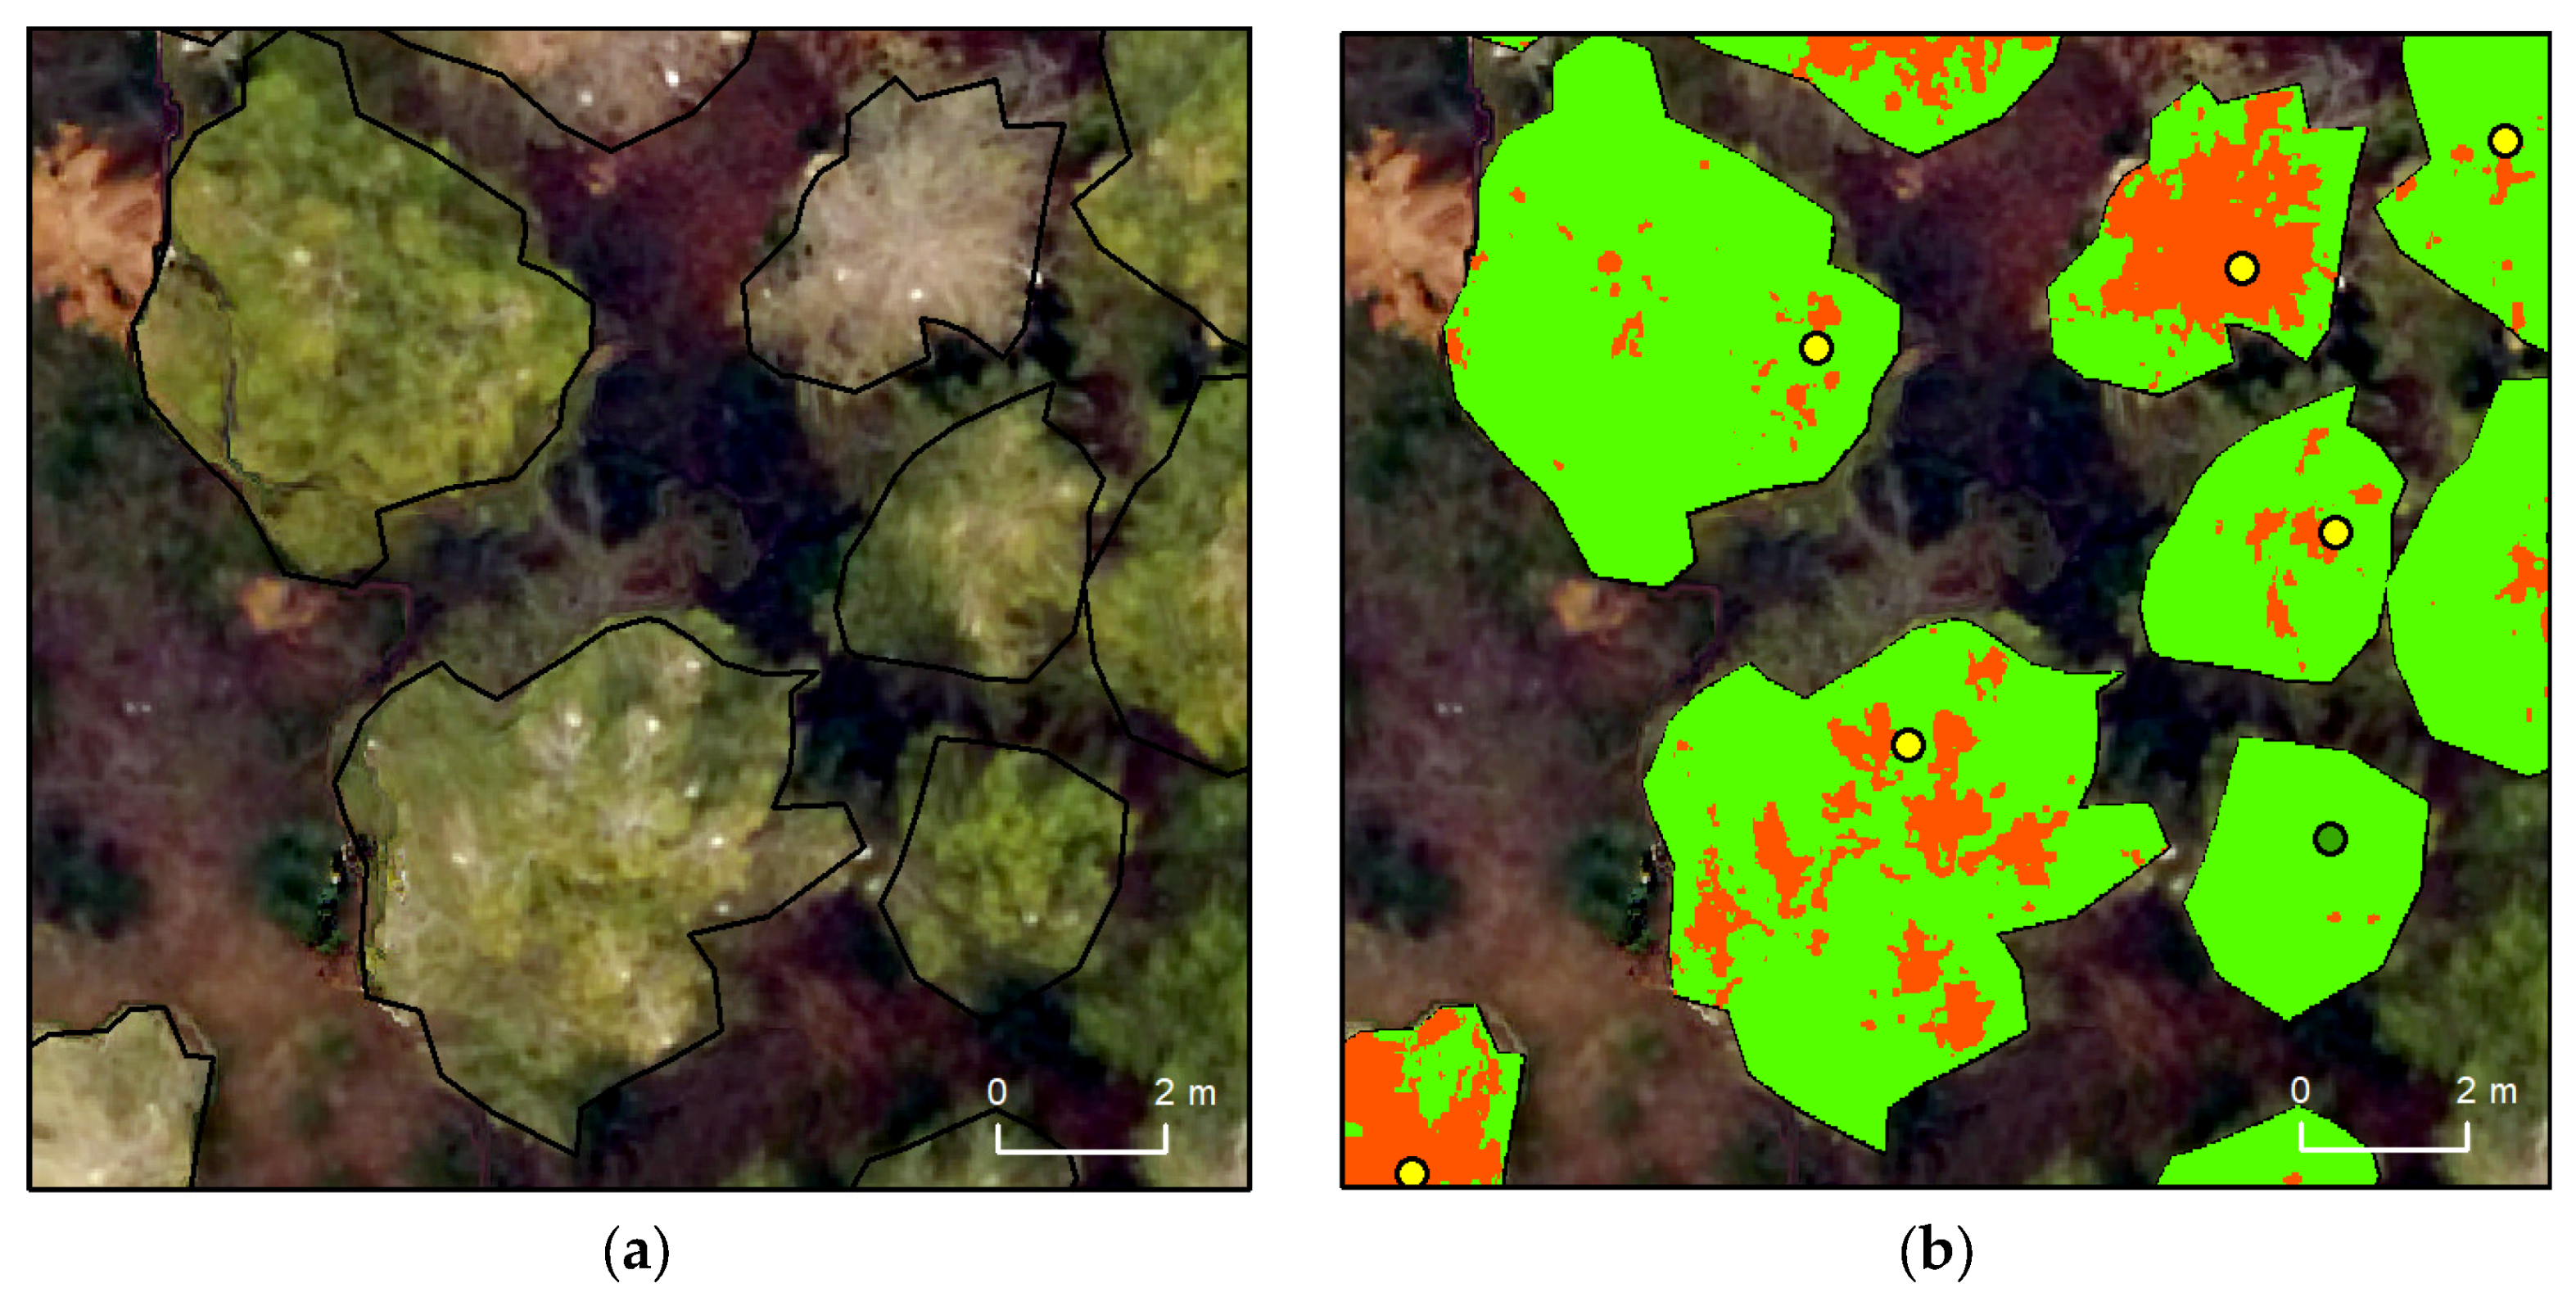
Fifty-three trees were classified as infested and 28 as non-infested using the RGB-UAS images and the automatic classification procedure (Figure 3). Field data measurements indicated that almost all non-infested trees (12 of 13 trees) were correctly classified but 16 trees classified as non-infested were actually infested. The overall accuracy of the classification was 79.0% (Table 1). It should be noted that most infested tree misclassifications (infested trees classified as non-infested trees, commission error = 57.1%) had a relatively low mean defoliation percentage between 10 and 20%. Most of them only had relatively minor defoliations in the outer branches or around tree tops. Figure 4 shows the defoliation measured as infested or non-infested using RGB-UAS images and the automatic classification in detail in some analyzed trees in Torregassa.
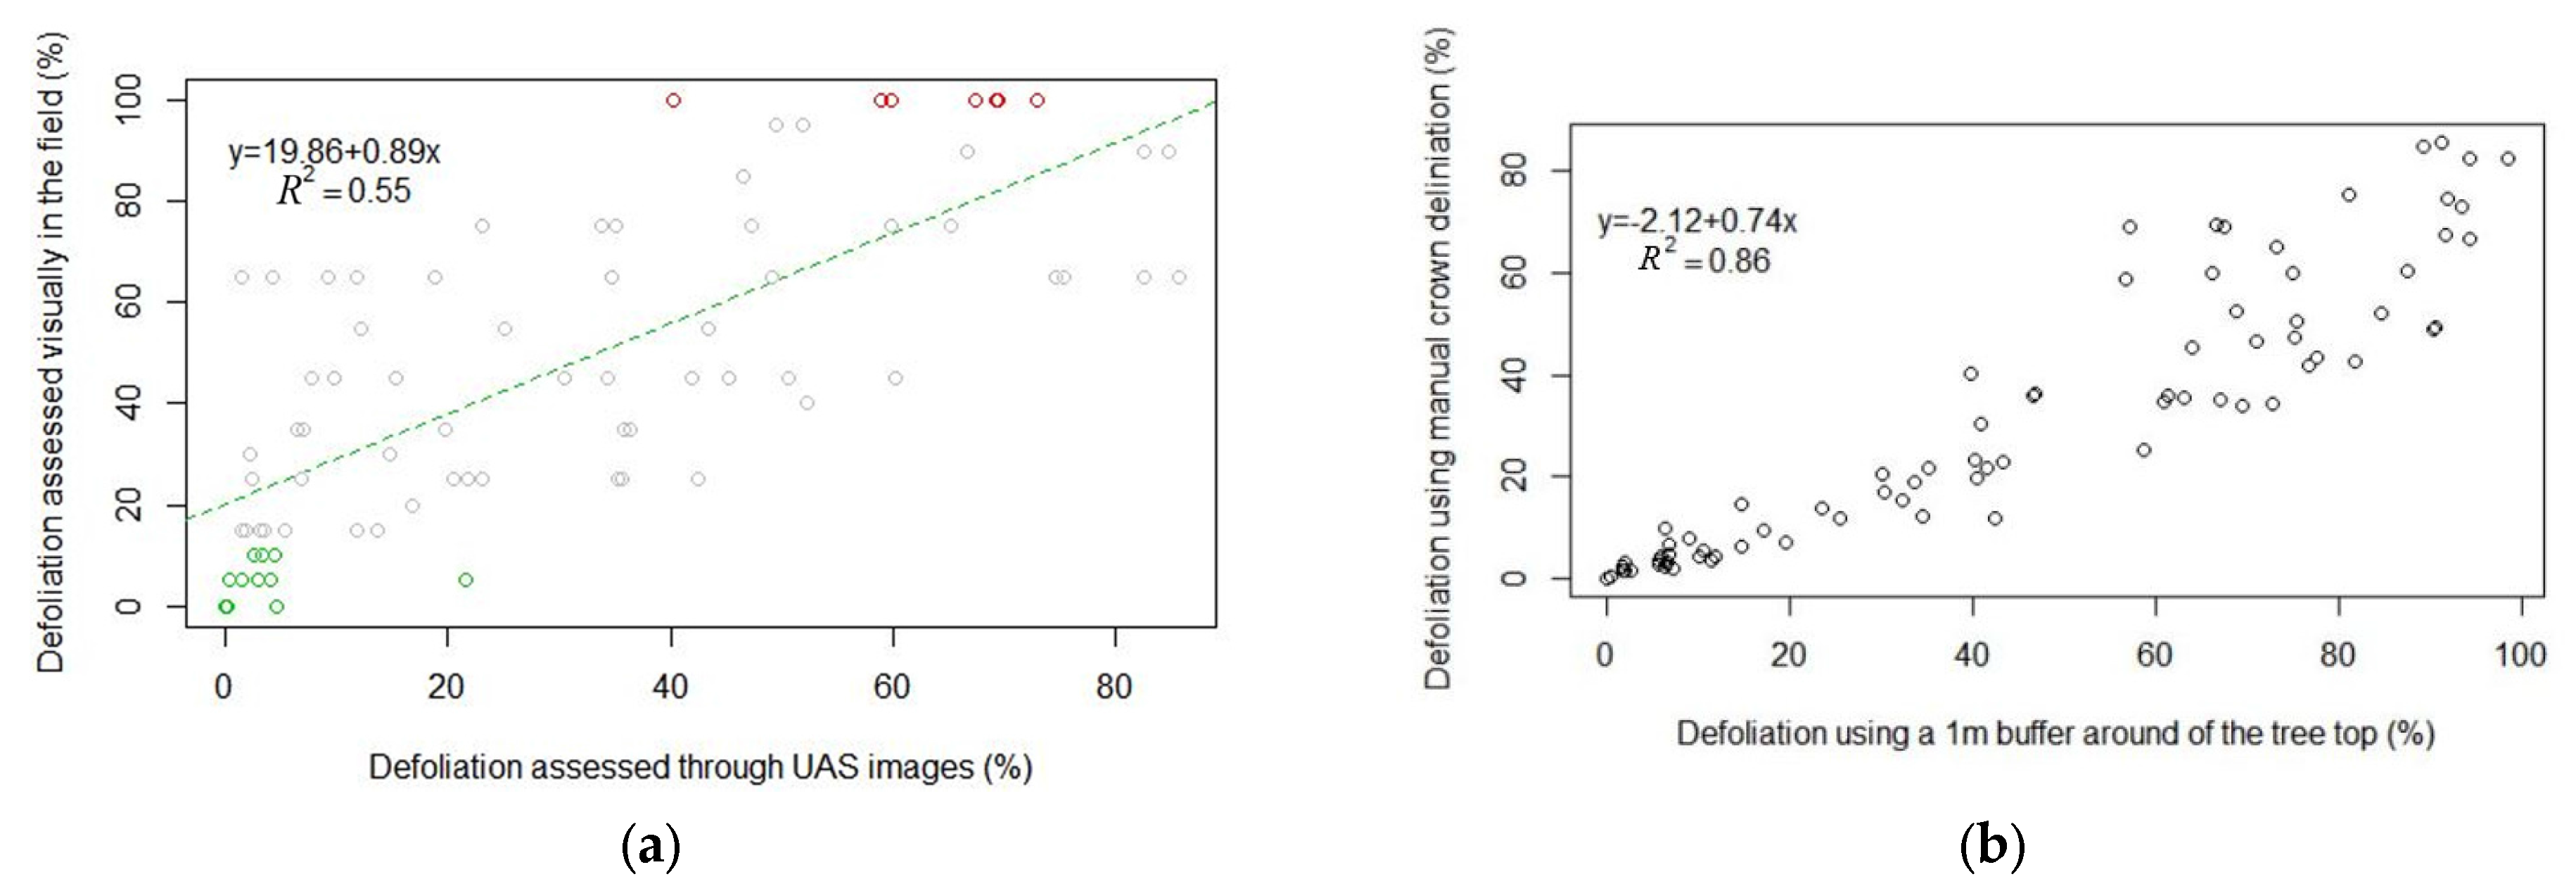
A linear regression model was applied to evaluate whether the percentage of defoliation assessed through UAS images was a significant indicator of the real percentage of defoliation measured in the field (Figure 5a). Our results showed that the association between the two variables was highly significant (p-value < 0.001) and the model’s predictive accuracy was moderate (r2 = 0.55). Measurements using RGB-UAS images tended to underestimate the percentage of defoliation measured in the field (t-student paired test; p-value < 0.01; Figure 5a). We also compared the percentage of defoliation between manual crown delineation and a buffer of 1 m around the tree top. Both variables were highly correlated (r2 = 0.86; Figure 5b) although a 1-m buffer overestimated results significantly in comparison to the use of the entire crown.

3.2. PPM Defoliation in Torregassa and Bosquet

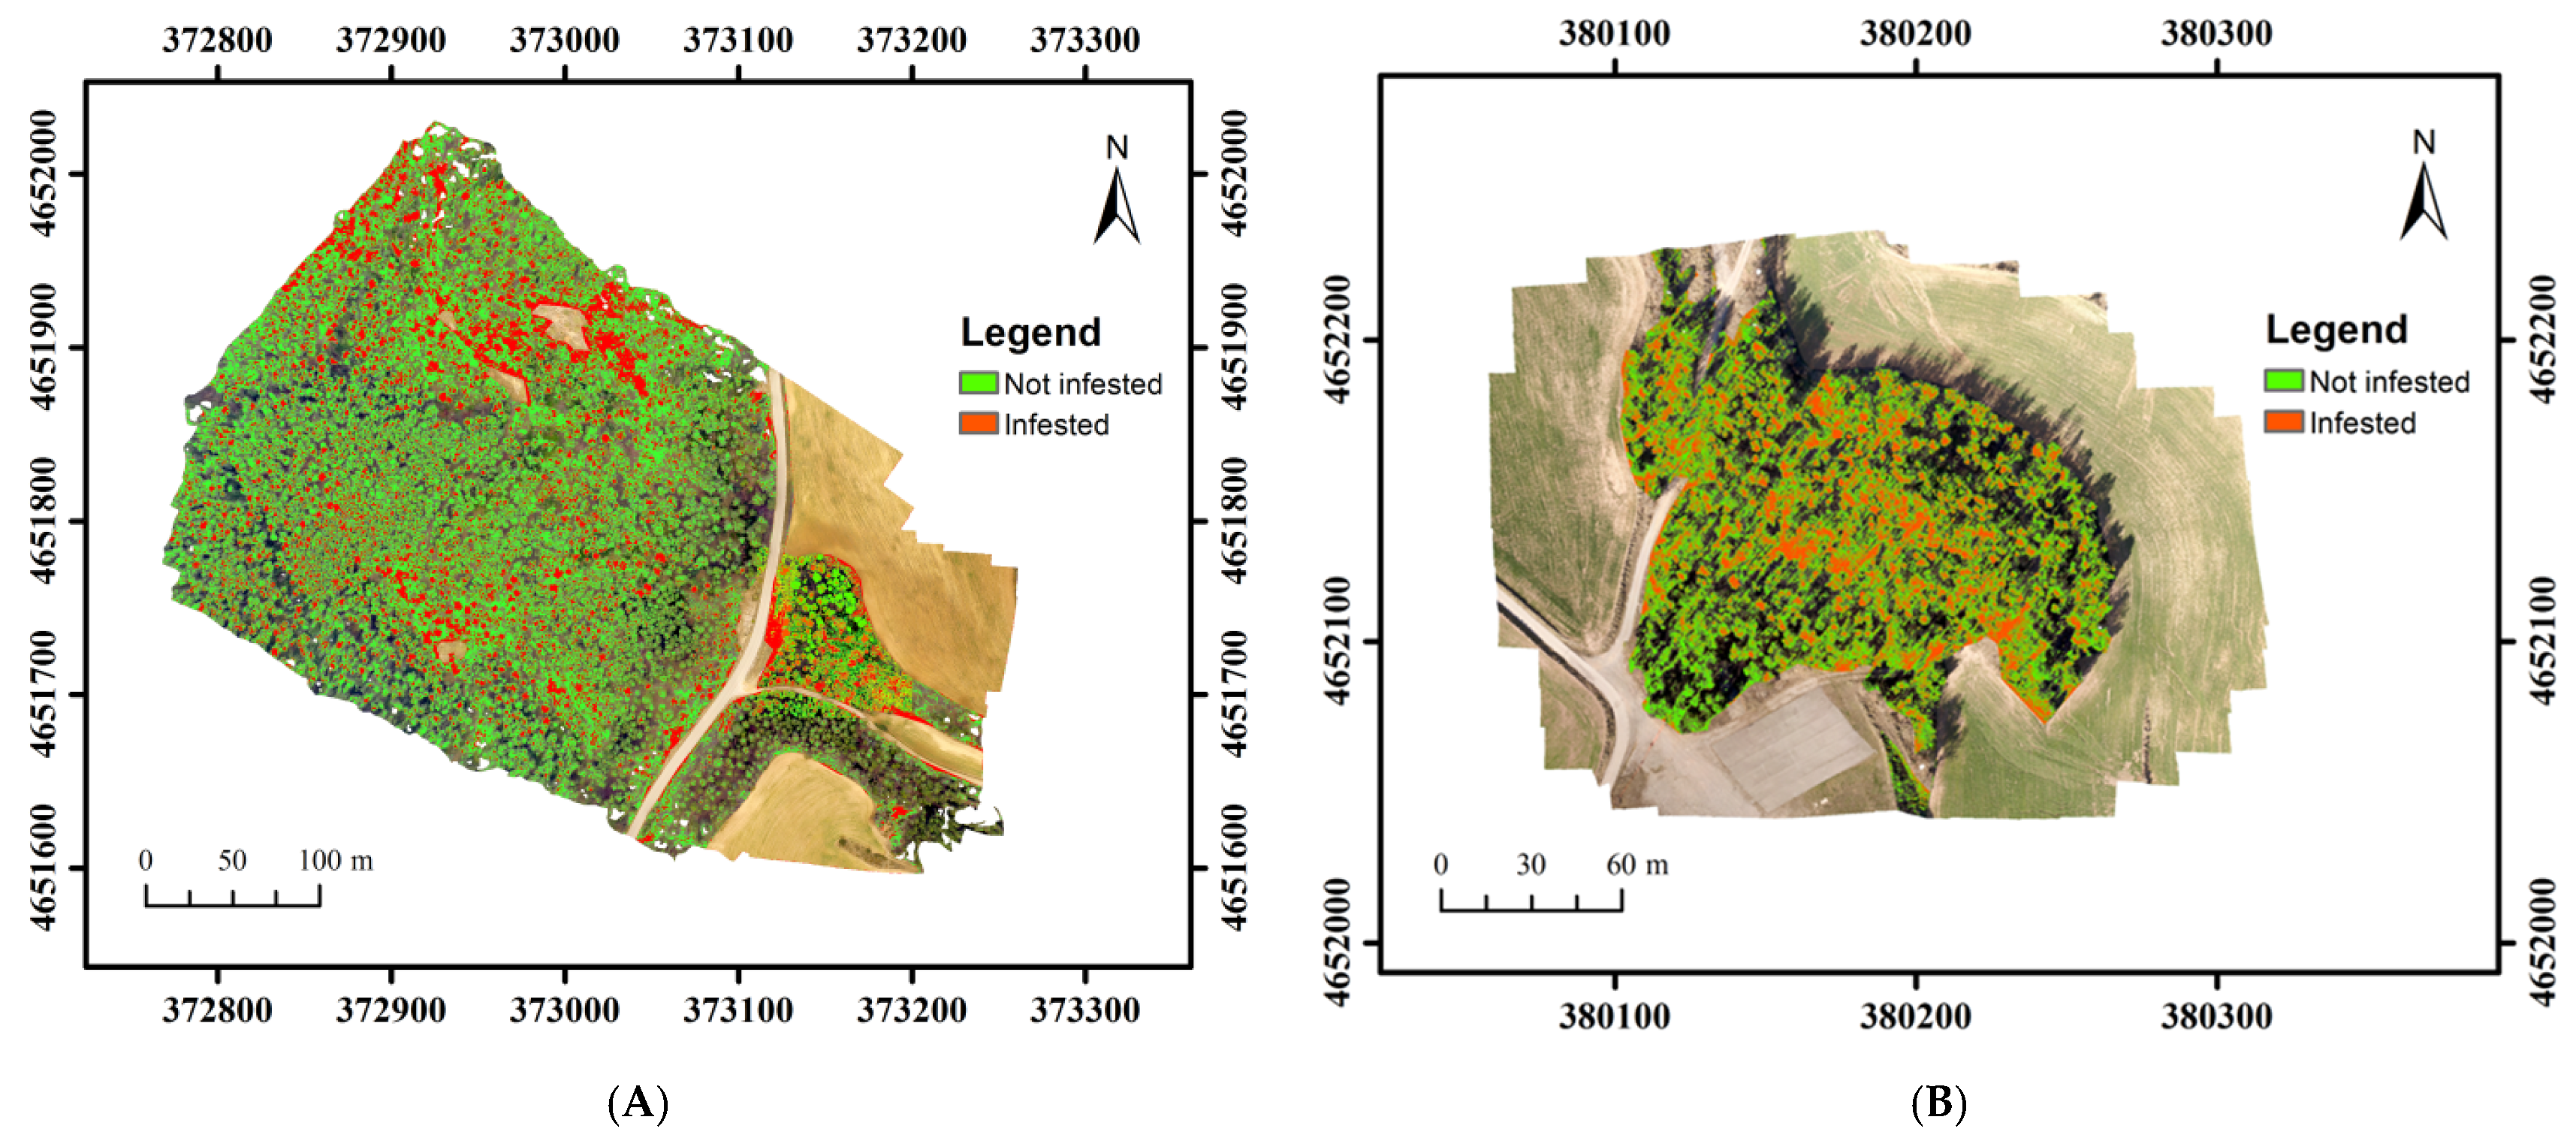
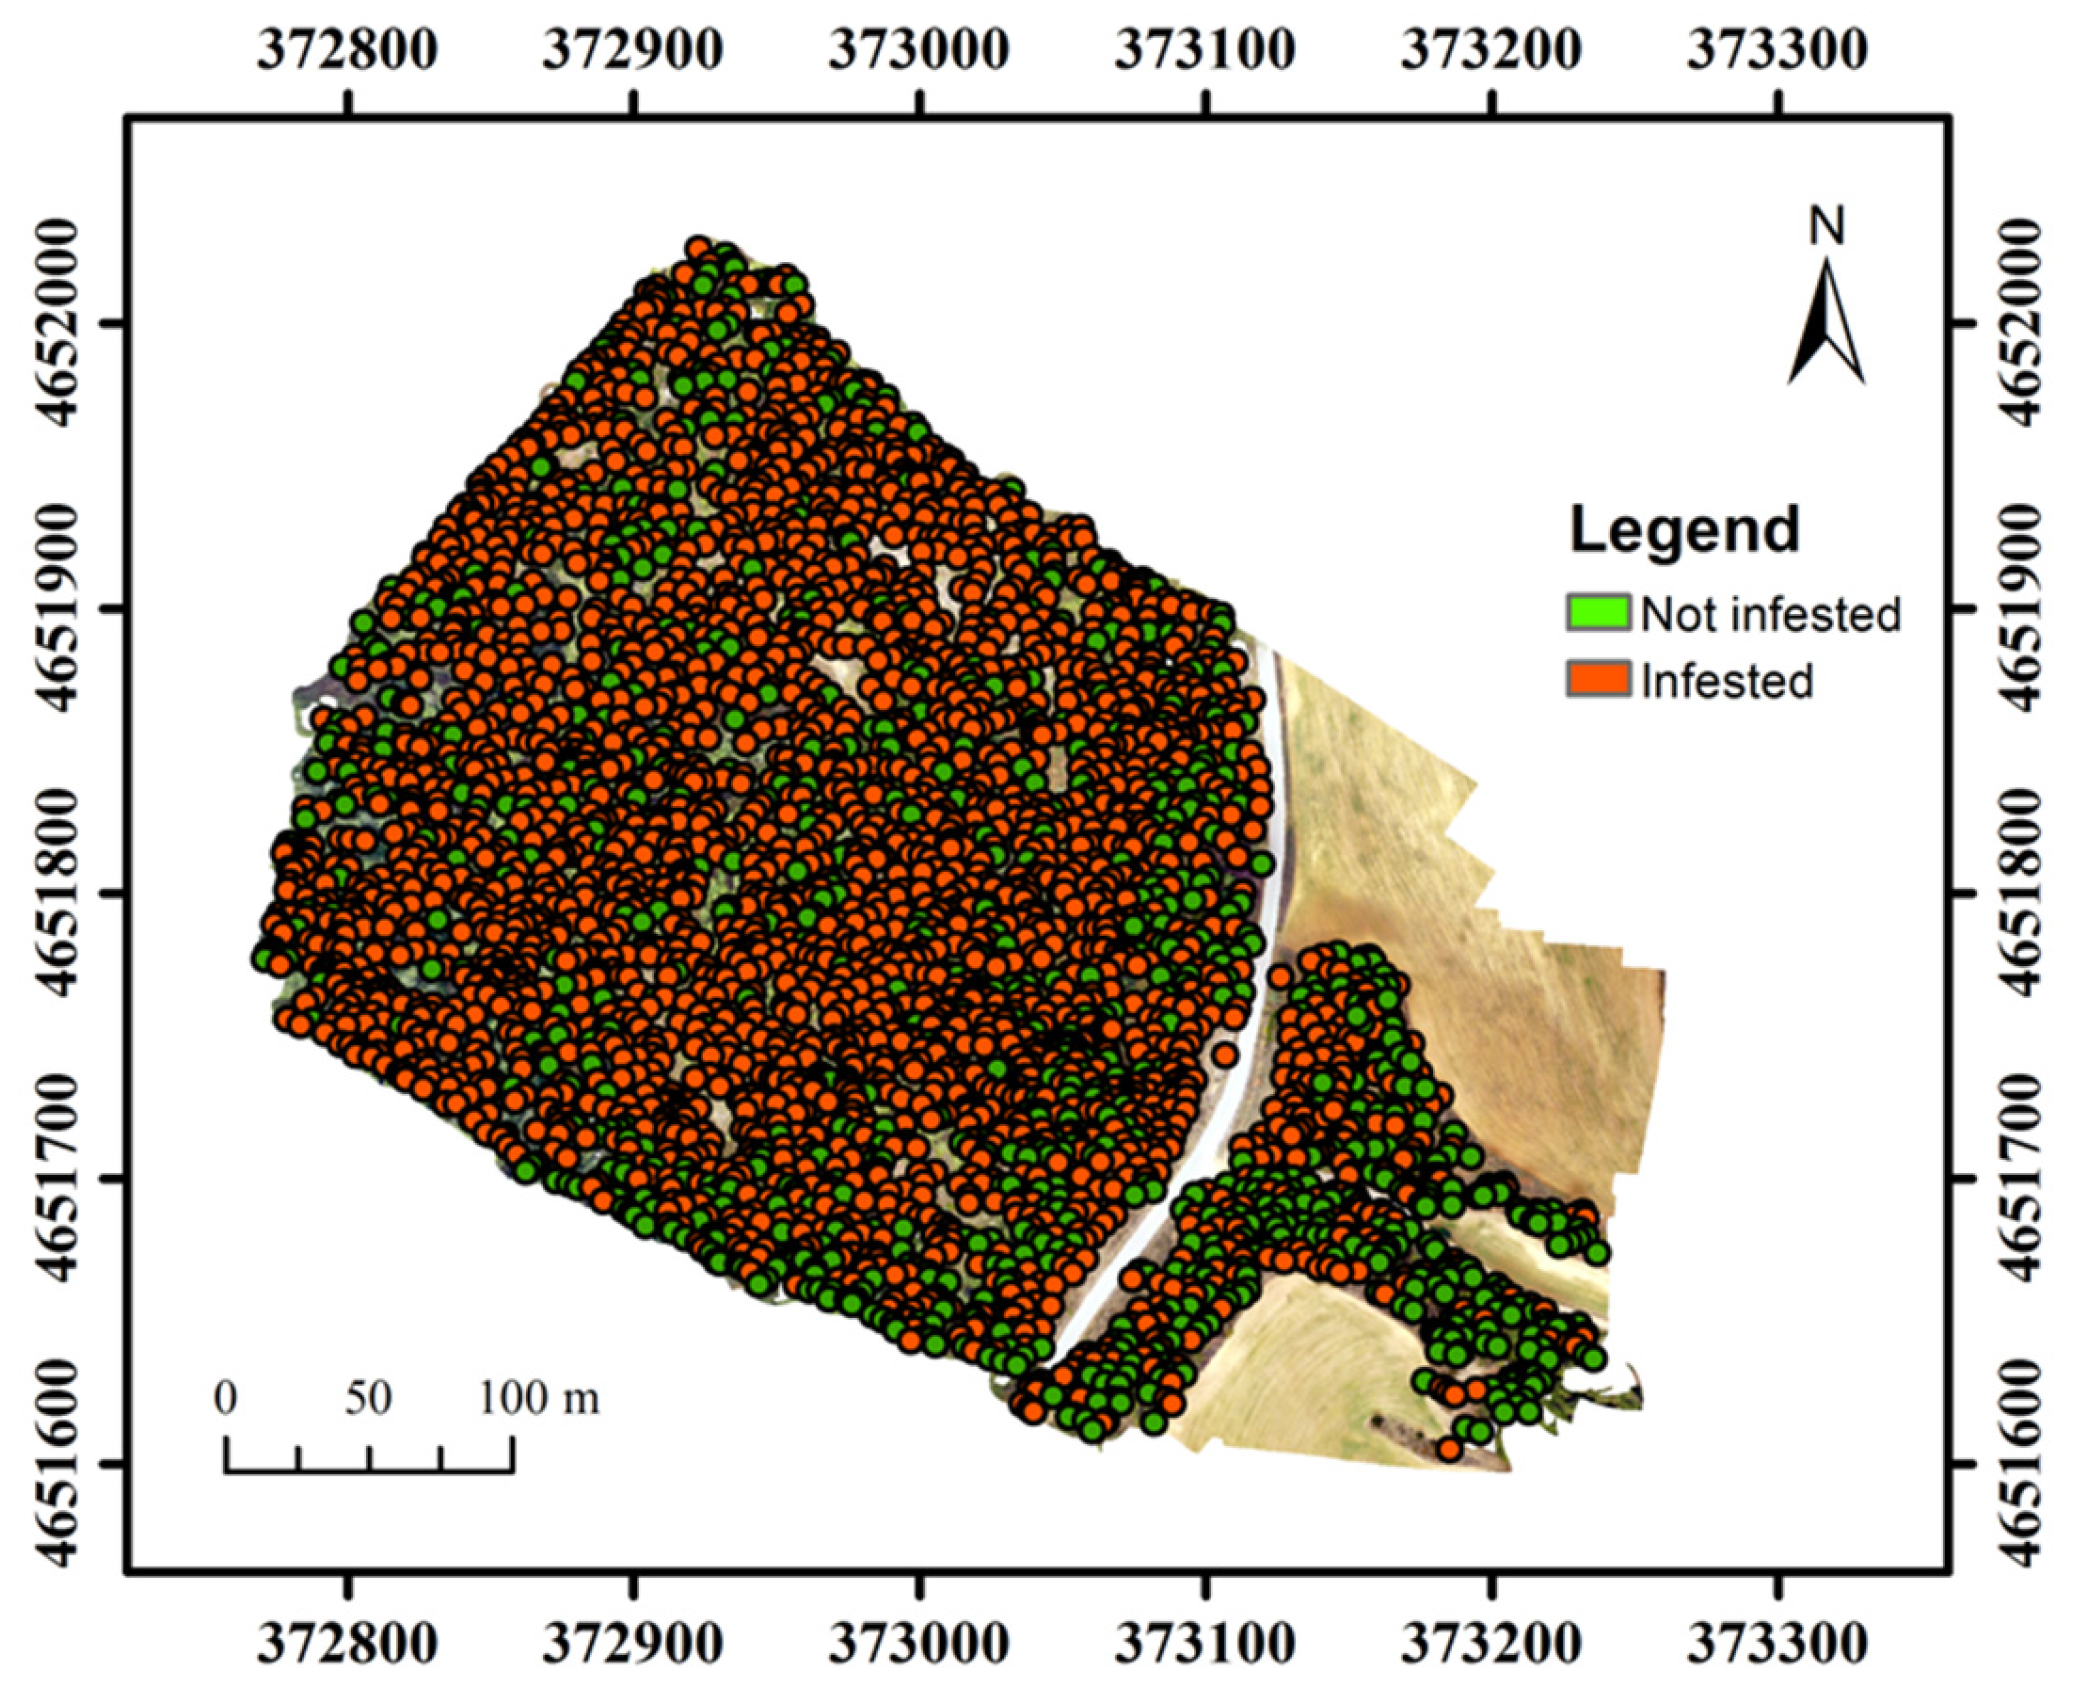
Defoliation was assessed in both Torregassa and Bosquet sites using the whole generated orthomosaic area (Figure 6), showing that defoliation assessment through RGB-UAS images can be also used to map forest stands. Additionally, all trees in Torregassa forest were classified automatically as infested or non-infested (Figure 7) considering tree top identification, a buffer of 1 m around the tree top and the percentage of infested pixels in each tree. Most of the trees were infested and defoliated in at least some parts of the tree. In Torregassa, 2384 of 3391 (70.3%) trees were infested and the mean percentage of defoliation was 50.1%.

3.3. PPM Defoliation Patterns at Tree-Level Scale and Nests

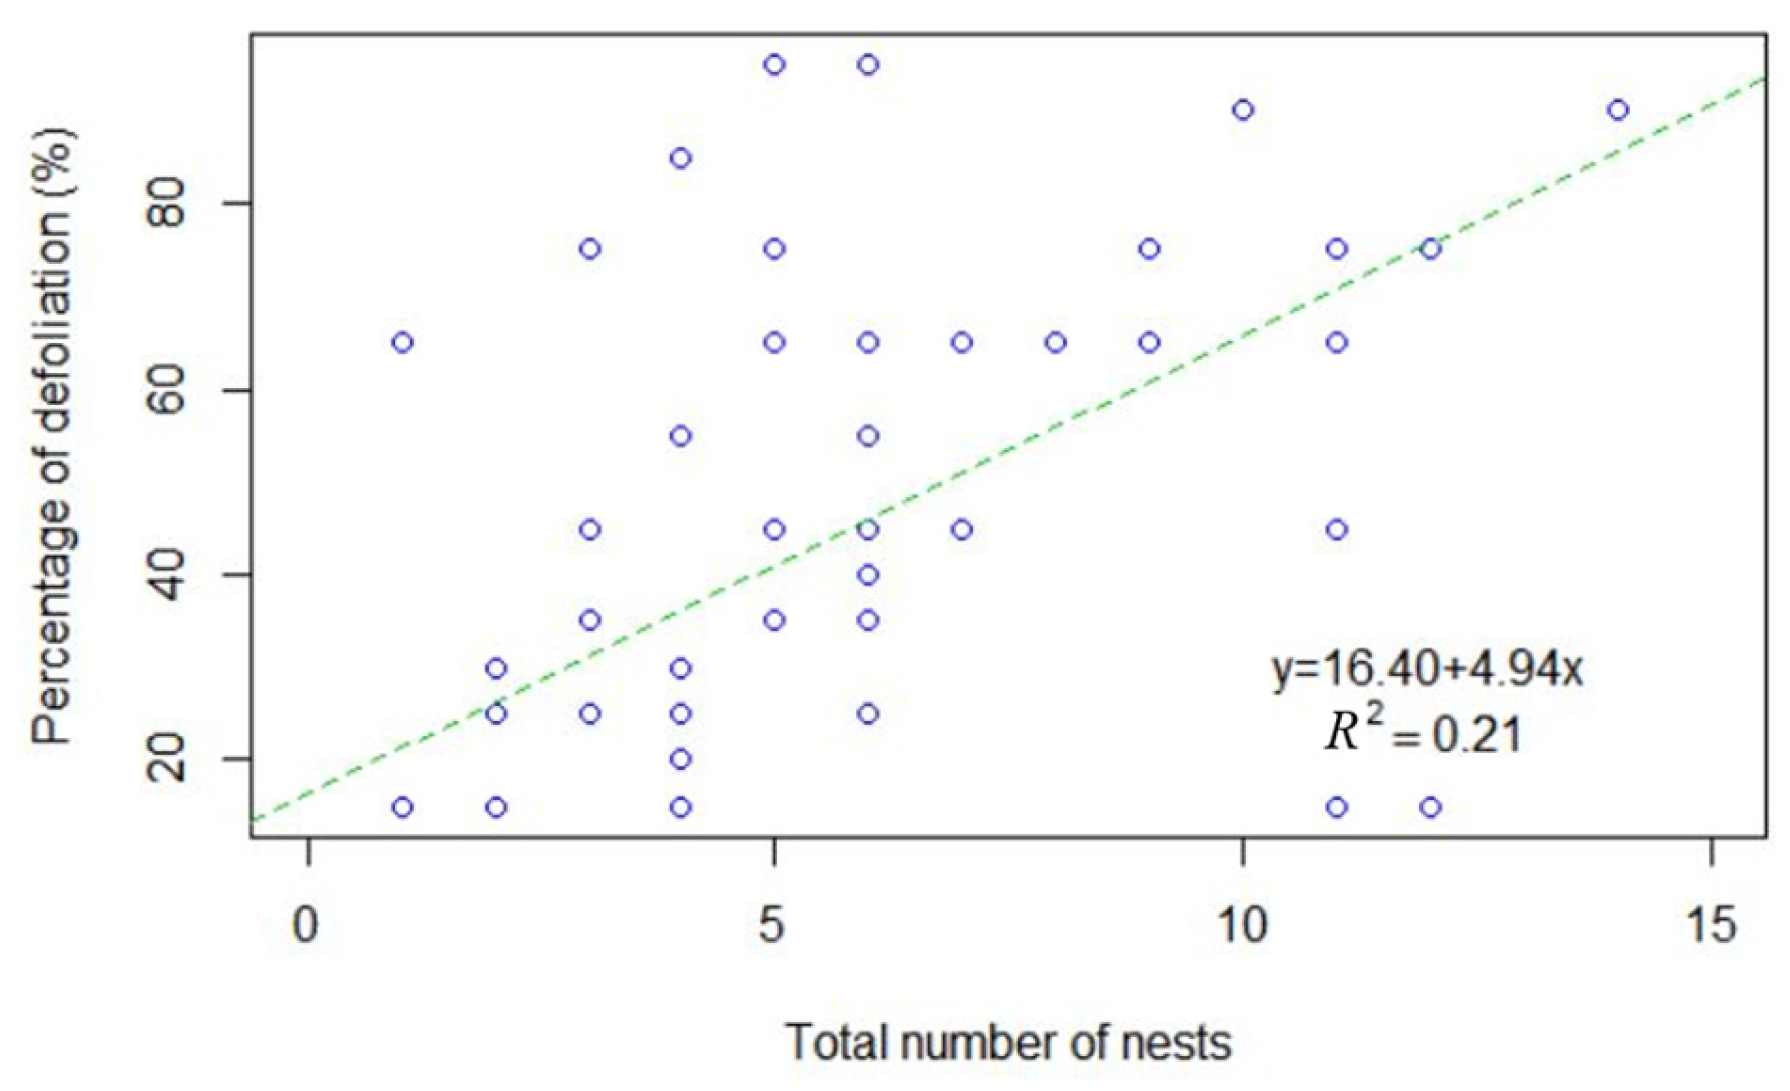
The percentage of defoliation was significantly higher in the sunniest part of the tree (Aspect: south) with a value of 47.5% versus 43.8% (p-value = 0.042; Wilcoxon paired test) and the number of nests measured in the field was significantly correlated with the percentage of defoliation (p-value < 0.01; analysis of variance; Figure 8). Infested trees had a mean of 5.3 nests per tree. The model indicated that a higher number of nests was related to higher infestation in terms of percentage of defoliation as shown in Figure 8. Almost all infested trees had a nest on the top of the tree (58 trees of 60) and the total number of nests was significantly higher in the sunniest part of the tree (Aspect: south) with a value of 3.4 nests per tree vs. 1.8 (p-value < 0.01; Wilcoxon paired test).

4. Discussion

In a rapidly expanding species such as the PPM [4,8,34], aggravated by extreme climatic events such as the summer of 2003 [9,35,36,37,38], there is an urgent need for effective monitoring techniques. Researchers and forest managers interested in pest dynamics have traditionally used visually derived infestation indices to assess PPM damage in pine stands [3,7]. However, the higher frequency and intensity of recent insect outbreaks requires the development of more effective methods that can generate detailed PPM impact descriptors over a range of spatial scales. [16]. Low-cost image acquisition with UAS platforms has been suggested as an option to deal with this challenge and to the authors’ knowledge this study represents the first example provided in the scientific literature showing how to identify healthy, infested and completely defoliated trees by PPM at the tree-level scale using this technology. Here, we have successfully used UAS to assess the percentage of infested trees and the percentage of defoliation in each tree quantitatively and obtained promising validation results with field measurements. Therefore, UAS technology can be efficient in carrying out a PPM inventory and monitoring at detailed spatial scales.
Field validation showed that defoliation assessment through UAS images is accurate. Our approach allows the percentage of defoliation to be measured in each tree individually and allows them to be classified as infested and non-infested automatically with a classification accuracy of 79%. However, when PPM defoliation is low (<20%) and it is only located in treetops or in small branches, our method could not always recognize trees as infested, as shown in Table 1. Several techniques and methods have been applied to detect, map and monitor forest insect damage with several levels of accuracy in the last decades [10,39]. Thus, Landsat data is mostly used in defoliation damage studies, MODIS data is increasingly used for early warning detection, and airborne laser scanning (ALS) data is a promising option for operative detection of defoliation [10]. Previous assessments such as defoliation by Neodiprion sertifer Geoff. in pine forests using multi-temporal MODIS 16-day composite vegetation index data [40] showed that the damage classifications detected 71% to 82% of the pixels with damage, and had kappa coefficients varying between 0.48 and 0.63, indicating some overestimation. The degree of defoliation from MODIS could not be assessed. Other authors have used penetration variables derived from high density ALS data that was related to the field-measured gap fraction in pine forest defoliated by Neodiprion sertifer [41]. They estimated outbreak defoliation by temporal changes in the LAI variable derived from ALS data, with high accuracy (r2 = 0.82–0.95). Also, Landsat data was used to predict defoliation severity caused by Lymantria dispar L. in deciduous forests [42], fitting a sigmoidal model to predict defoliation as a function of the difference in the vegetation index (mean absolute error of 10.8% and r2 = 0.802). Therefore, the accuracy of our method at the tree level is similar to those previously obtained accuracies at medium resolution and it could improve the remote detection of defoliation in sparse cover vegetation [43].
As our work shows, measurements using RGB-UAS images could underestimate PPM defoliation compared to the measured values in the field. The percentage of defoliation measured in the field was assessed using the entire crown and, therefore, the result was a percentage of defoliation in volume. However, the workflow developed in this work to estimate tree PPM defoliation using RGB-UAS images was based on the use of 2D orthomosaic and it did not allow the percentage of defoliation to be estimated using volume measures. Additionally, RGB-UAS images might not be the ideal method to capture the lower part of the trees which is usually subjected to lower PPM impacts than higher parts of the tree. Moreover, the method using a buffer of 1 m around the tree top may potentially overestimate the percentage of defoliation at the tree level when compared to the manual delineation of crowns. This could be related to higher damage in the central part of the trees where many of the nests are usually located. Automatic tree-crown delineation from 3D point clouds should be explored and lead to the reduction or resolution of this bias.
Despite considerable investment in equipment, infrastructure and training of people (i.e., pilots), the use of this technology offers several advantages when applied to the assessment of defoliation caused by insect pests. To state the most important advantages, (1) data acquisition is usually more efficient in terms of time and manpower; (2) the technology has a great capacity to monitor and assess difficult-to-access areas; (3) researchers can easily derive quantitative methods to estimate defoliation at the tree-scale level and even at subtree (i.e., visible branches from the air) levels. Nevertheless, several methodological constraints and considerations also need to be considered when planning for the large-scale deployment of UAS technologies in the estimation of defoliation levels: (1) regulations to use UAS in urban areas and areas located near airfields; (2) limited time window for image acquisition (around noon) to minimize the amount of shadow in the images; (3) infestation classification needs to consider the aspect of the terrain due to the shadows and brightness of the images which could affect the final classification outputs depending on the sun illumination. Limitations 2 and 3 could be minimized using NIR image processing and sunshine correction sensors, also allowing the generation of different vegetation responses and vegetation indices offering great potential over RGB imagery in the estimation of defoliation [10,16].
The use of UAS-related technology opens new avenues in our range of tools available to conduct assessments of forest pests such as the PPM over more representative spatial and temporal scales. Defoliation has been commonly assessed using satellite imagery in several insect pest species with strong constraints on the quantity and quality of information that can be retrieved from this information source. Information and analysis using commonly available, cheap, but high-resolution RGB-UAS images may be integrated or used to validate other data available such as satellite imagery used at larger spatial and temporal scales. Additionally, this technology could also be useful to complement, or even completely substitute field assessments with large-scale quantitative evaluations when detailed results are required.
Finally, the development of simple forest health assessment methodologies using new technological advances such as UAS, offer a new avenue for the development of a new generation of citizen science projects. Citizens using UAS and available cameras could obtain and aggregate aerial images using drones to develop innovative monitoring projects that could eventually be expanded to other pest monitoring activities and forest monitoring activities. Methodologies such as the one introduced in this work linked to the increasing numbers of UAS owned by common citizens, would allow the creation of a cost-effective network of observers to assess the spread of numerous pests; evaluate the damages and outbreaks and monitor their expansion; and complement the measures and monitoring of forest technicians and managers.

5. Conclusions

Our work suggests that the growing need for monitoring methods aimed at capturing both temporal and spatial impacts of PPM on forests can be partially filled by emerging new technologies such as remote sensing imagery mounted on UASs. High-resolution image processing on RGB imagery acquired through UASs allowed the percentage of defoliation to be assessed at tree-level and our results have shown that we can reliably differentiate healthy from infested and completely defoliated trees with high accuracy. This suggests that defoliation estimates for pines under PPM outbreaks using UASs are robust and allow infestation indexes to be derived that are comparable to field-based approaches used by forest technicians. The accuracy of our proposed methods at tree level is similar to previous estimates available for a range of pest outbreaks. Finally, with the use of this emerging technology, new avenues in terms of data acquisition may be opened to researchers in terms of improved time and manpower management, higher capacity to monitor difficult-to-access areas and the development of new quantitative analyses that were previously difficult using qualitative information at the tree or forest stand level.

Acknowledgments

We are grateful to the Newforests European project for supporting this study and funding Cardil’s stay in Montreal (Canada). This work was partly funded by the project “Boscos sans per una societat saludable” funded by “La Caixa” Banking Foundation” and by the Transformative Technologies Program at FPInnovations funded through Natural Resources Canada. This study has also benefited from the Parrot Climate Innovation Grant 2017.

Author Contributions

A.C., U.V. and L.B. conceived and designed the experiments; A.C., U.V. and L.B. performed the experiments; A.C. analyzed the data; A.C., U.V. and L.B. contributed reagents/materials/analysis tools; A.C., U.V. and L.B. wrote the paper.

Conflicts of Interest

The authors declare no conflict of interest.

References

  1. Cayuela, L.; Hódar, J.A.; Zamora, R. Is insecticide spraying a viable and cost-efficient management practice to control pine processionary moth in Mediterranean woodlands? For. Ecol. Manag. 2011, 261, 1732–1737. [Google Scholar] [CrossRef]
  2. Berryman, A. Population Cycles: The Case for Trophic Interactions; Oxford University Press: New York, NY, USA, 2002. [Google Scholar]
  3. Hódar, J.A.; Zamora, R.; Castro, J.; Baraza, E. Feast and famine: Previous defoliation limiting survival of pine processionary caterpillar Thaumetopoea pityocampa in Scots pine Pinus sylvestris. Acta Oecol. 2004, 26, 203–210. [Google Scholar] [CrossRef]
  4. Hódar, J.A.; Castro, J.; Zamora, R. Pine processionary caterpillar Thaumetopoea pityocampa as a new threat for relict Mediterranean Scots pine forests under climatic warming. Biol. Conserv. 2003, 110, 123–129. [Google Scholar] [CrossRef]
  5. Moore, B.; Allard, G. Climate Change Impacts on Forest Health; Working paper FBS/34E; FAO: Rome, Italy, 2008. [Google Scholar]
  6. Battisti, A.; Holm, G.; Fagrell, B.; Larsson, S. Urticating Hairs in Arthropods: Their Nature and Medical Significance. Annu. Rev. Entomol. 2011, 56, 203–210. [Google Scholar] [CrossRef] [PubMed]
  7. Cayuela, L.; Hernández, R.; Hódar, J.A.; Sánchez, G.; Zamora, R. Tree damage and population density relationships for the pine processionary moth: Prospects for ecological research and pest management. For. Ecol. Manag. 2014, 328, 319–325. [Google Scholar] [CrossRef]
  8. Battisti, A. Forests and climate change-Lessons from insects. IForest 2008, 1, 1–5. [Google Scholar] [CrossRef]
  9. Jactel, H.; Menassieu, P.; Vétillard, F.; Barthélémy, B.; Piou, D.; Frérot, B.; Rousselet, J.; Goussard, F.; Branco, M.; Battisti, A. Population monitoring of the pine processionary moth (Lepidoptera: Thaumetopoeidae) with pheromone-baited traps. For. Ecol. Manag. 2006, 235, 96–106. [Google Scholar] [CrossRef]
  10. Rullan-Silva, C.D.; Olthoff, A.E.; Delgado de la Mata, J.A.; Pajares-Alonso, J.A. Remote Monitoring of Forest Insect Defoliation—A Review. For. Syst. 2013, 22, 377–391. [Google Scholar] [CrossRef]
  11. Silva, C.A.; Hudak, A.T.; Klauberg, C.; Vierling, L.A.; González-Benecke, C.; de Padua Chaves Carvalho, S.; Rodríguez, L.C.E.; Cardil, A. Combined effect of pulse density and grid cell size on predicting and mapping aboveground carbon in fast-growing Eucalyptus forest plantation using airborne LiDAR data. Carbon Balance Manag. 2017, 12, 1–16. [Google Scholar] [CrossRef] [PubMed]
  12. Silva, C.A.; Klauberg, C.; Hudak, A.T.; Vierling, L.A. Predicting Stem Total and Assortment Volumes in an Industrial Pinus taeda L. Forest Plantation Using Airborne Laser Scanning Data and Random Forest. Forests 2017, 8, 254. [Google Scholar] [CrossRef]
  13. Kantola, T.; Vastaranta, M.; Lyytikäinen-Saarenmaa, P.; Holopainen, M.; Kankare, V.; Talvitie, M.; Hyyppä, J. Classification of needle loss of individual scots pine trees by means of airborne laser scanning. Forests 2013, 4, 386–403. [Google Scholar] [CrossRef]
  14. Ortiz, S.M.; Breidenbach, J.; Kändler, G. Early detection of bark beetle green attack using terraSAR-X and rapideye data. Remote Sens. 2013, 5, 1912–1931. [Google Scholar] [CrossRef]
  15. Wulder, M.A.; Dymond, C.C.; White, J.C.; Leckie, D.G.; Carroll, A.L. Surveying mountain pine beetle damage of forests: A review of remote sensing opportunities. For. Ecol. Manag. 2006, 221, 27–41. [Google Scholar] [CrossRef]
  16. Näsi, R.; Honkavaara, E.; Lyytikäinen-Saarenmaa, P.; Blomqvist, M.; Litkey, P.; Hakala, T.; Viljanen, N.; Kantola, T.; Tanhuanpää, T.; Holopainen, M. Using UAV-based photogrammetry and hyperspectral imaging for mapping bark beetle damage at tree-level. Remote Sens. 2015, 7, 15467–15493. [Google Scholar] [CrossRef]
  17. Lehmann, J.R.K.; Nieberding, F.; Prinz, T.; Knoth, C. Analysis of unmanned aerial system-based CIR images in forestry-a new perspective to monitor pest infestation levels. Forests 2015, 6, 594–612. [Google Scholar] [CrossRef] [Green Version]
  18. Puliti, S.; Ene, L.T.; Gobakken, T.; Næsset, E. Use of partial-coverage UAV data in sampling for large scale forest inventories. Remote Sens. Environ. 2017, 194, 115–126. [Google Scholar] [CrossRef]
  19. Puliti, S.; Olerka, H.; Gobakken, T.; Næsset, E. Inventory of Small Forest Areas Using an Unmanned Aerial System. Remote Sens. 2015, 7, 9632–9654. [Google Scholar] [CrossRef] [Green Version]
  20. Whitehead, K.; Hugenholtz, C.H. Remote sensing of the environment with small unmanned aircraft systems (UASs), part 1: A review of progress and challenges. J. Unmanned Veh. Syst. 2014, 2, 69–85. [Google Scholar] [CrossRef]
  21. Gao, M.; Xu, X.; Klinger, Y.; van der Woerd, J.; Tapponnier, P. High-resolution mapping based on an Unmanned Aerial Vehicle (UAV) to capture paleoseismic offsets along the Altyn-Tagh fault, China. Sci. Rep. 2017, 7, 8281. [Google Scholar] [CrossRef] [PubMed]
  22. Casbeer, D.W.; Kingston, D.B.; Beard, R.W.; McLain, T.W. Cooperative forest fire surveillance using a team of small unmanned air vehicles. Int. J. Syst. Sci. 2006, 37, 351–360. [Google Scholar] [CrossRef]
  23. Hung, C.; Bryson, M.; Sukkarieh, S. Multi-class predictive template for tree crown detection. ISPRS J. Photogramm. Remote Sens. 2012, 68, 170–183. [Google Scholar] [CrossRef]
  24. Dandois, J.P.; Ellis, E.C. High spatial resolution three-dimensional mapping of vegetation spectral dynamics using computer vision. Remote Sens. Environ. 2013, 136, 259–276. [Google Scholar] [CrossRef]
  25. Feng, Q.; Liu, J.; Gong, J. UAV Remote Sensing for Urban Vegetation Mapping Using Random Forest and Texture Analysis. Remote Sens. 2015, 7, 1074–1094. [Google Scholar] [CrossRef]
  26. Hung, C.; Xu, Z.; Sukkarieh, S. Feature learning based approach for weed classification using high resolution aerial images from a digital camera mounted on a UAV. Remote Sens. 2014, 6, 12037–12054. [Google Scholar] [CrossRef]
  27. Torresan, C.; Berton, A.; Carotenuto, F.; Di Gennaro, S.F.; Gioli, B.; Matese, A. Forestry applications of UAVs in Europe: A review. Int. J. Remote Sens. 2017, 38, 2427–2447. [Google Scholar]
  28. Regos, A.; Aquilué, N.; Retana, J.; De Cáceres, M.; Brotons, L. Using Unplanned Fires to Help Suppressing Future Large Fires in Mediterranean Forests. PLoS ONE 2014, 9, 1–10. [Google Scholar] [CrossRef] [PubMed] [Green Version]
  29. Chenchouni, H.; Zanati, K.; Rezougui, A.; Briki, A.; Arar, A. Population Monitoring of Pine Processionary Moth (Thaumetopoea pityocampa) by Pheromone Trapping at the Southern Limit of Distribution of Pinus halepensis in. For. Sci. Technol. 2010, 6, 67–79. [Google Scholar]
  30. Tamburini, G.; Marini, L.; Hellrigl, K.; Salvadori, C.; Battisti, A. Effects of climate and density-dependent factors on population dynamics of the pine processionary moth in the Southern Alps. Clim. Chang. 2013, 121, 701–712. [Google Scholar] [CrossRef]
  31. Verhoeven, G. Taking computer vision aloft—archaeological three-dimensional reconstructions from aerial photographs with photoscan. Archaeol. Prospect. 2011, 18, 67–73. [Google Scholar] [CrossRef]
  32. Lucieera, A.; Turner, D.; Kingb, D.H.; Robinson, S.A. Using an Unmanned Aerial Vehicle ( UAV ) to capture micro-topography of Antarctic moss beds. Int. J. Appl. Earth Obs. Geoinf. 2014, 27, 52–62. [Google Scholar] [CrossRef]
  33. Mohan, M.; Silva, C.A.; Klauberg, C.; Jat, P.; Catts, G.; Cardil, A.; Hudak, A.T.; Dia, M. Individual Tree Detection from Unmanned Aerial Vehicle (UAV) Derived Canopy Height Model in an Open Canopy Mixed Conifer Forest. Forests 2017, 8, 340. [Google Scholar] [CrossRef]
  34. Battisti, A.; Stastny, M.; Netherer, S.; Robinet, C.; Schopf, A.; Roques, A.; Larsson, S. Expansion of geographic range in the pine processionary moth caused by increased winter temperatures. Ecol. Appl. 2005, 15, 2084–2096. [Google Scholar] [CrossRef]
  35. Cardil, A.; Molina, D.M.; Kobziar, L.N. Extreme temperature days and their potential impacts on southern Europe. Nat. Hazards Earth Syst. Sci. 2014, 14, 3005–3014. [Google Scholar] [CrossRef]
  36. Cardil, A.; Eastaugh, C.S.; Molina, D.M. Extreme temperature conditions and wildland fires in Spain. Theor. Appl. Climatol. 2015, 122, 219–228. [Google Scholar] [CrossRef]
  37. Molina-Terrén, D.M.; Cardil, A.; Kobziar, L.N. Practitioner perceptions of wildland fire management across South Europe and Latin America. Forests 2016, 7, 184. [Google Scholar] [CrossRef]
  38. Molina-Terrén, D.M.; Cardil, A. Temperature determining larger wildland fires in NE Spain. Theor. Appl. Climatol. 2016, 125, 295–302. [Google Scholar] [CrossRef]
  39. Hall, R.J.; Castilla, G.; White, J.C.; Cooke, B.J.; Skakun, R.S. Remote sensing of forest pest damage: A review and lessons learned from a Canadian perspective. Can. Entomol. 2016, 148, S296–S356. [Google Scholar] [CrossRef]
  40. Eklundh, L.; Johansson, T.; Solberg, S. Mapping insect defoliation in Scots pine with MODIS time-series data. Remote Sens. Environ. 2009, 113, 1566–1573. [Google Scholar] [CrossRef]
  41. Solberg, S. Mapping gap fraction, LAI and defoliation using various ALS penetration variables. Int. J. Remote Sens. 2010, 31, 1227–1244. [Google Scholar] [CrossRef]
  42. Townsend, P.A.; Singh, A.; Foster, J.R.; Rehberg, N.J.; Kingdon, C.C.; Eshleman, K.N.; Seagle, S.W. A general Landsat model to predict canopy defoliation in broadleaf deciduous forests. Remote Sens. Environ. 2012, 119, 255–265. [Google Scholar] [CrossRef]
  43. Dennison, P.E.; Nagler, P.L.; Hultine, K.R.; Glenn, E.P.; Ehleringer, J.R. Remote monitoring of tamarisk defoliation and evapotranspiration following saltcedar leaf beetle attack. Remote Sens. Environ. 2009, 113, 1462–1472. [Google Scholar] [CrossRef]
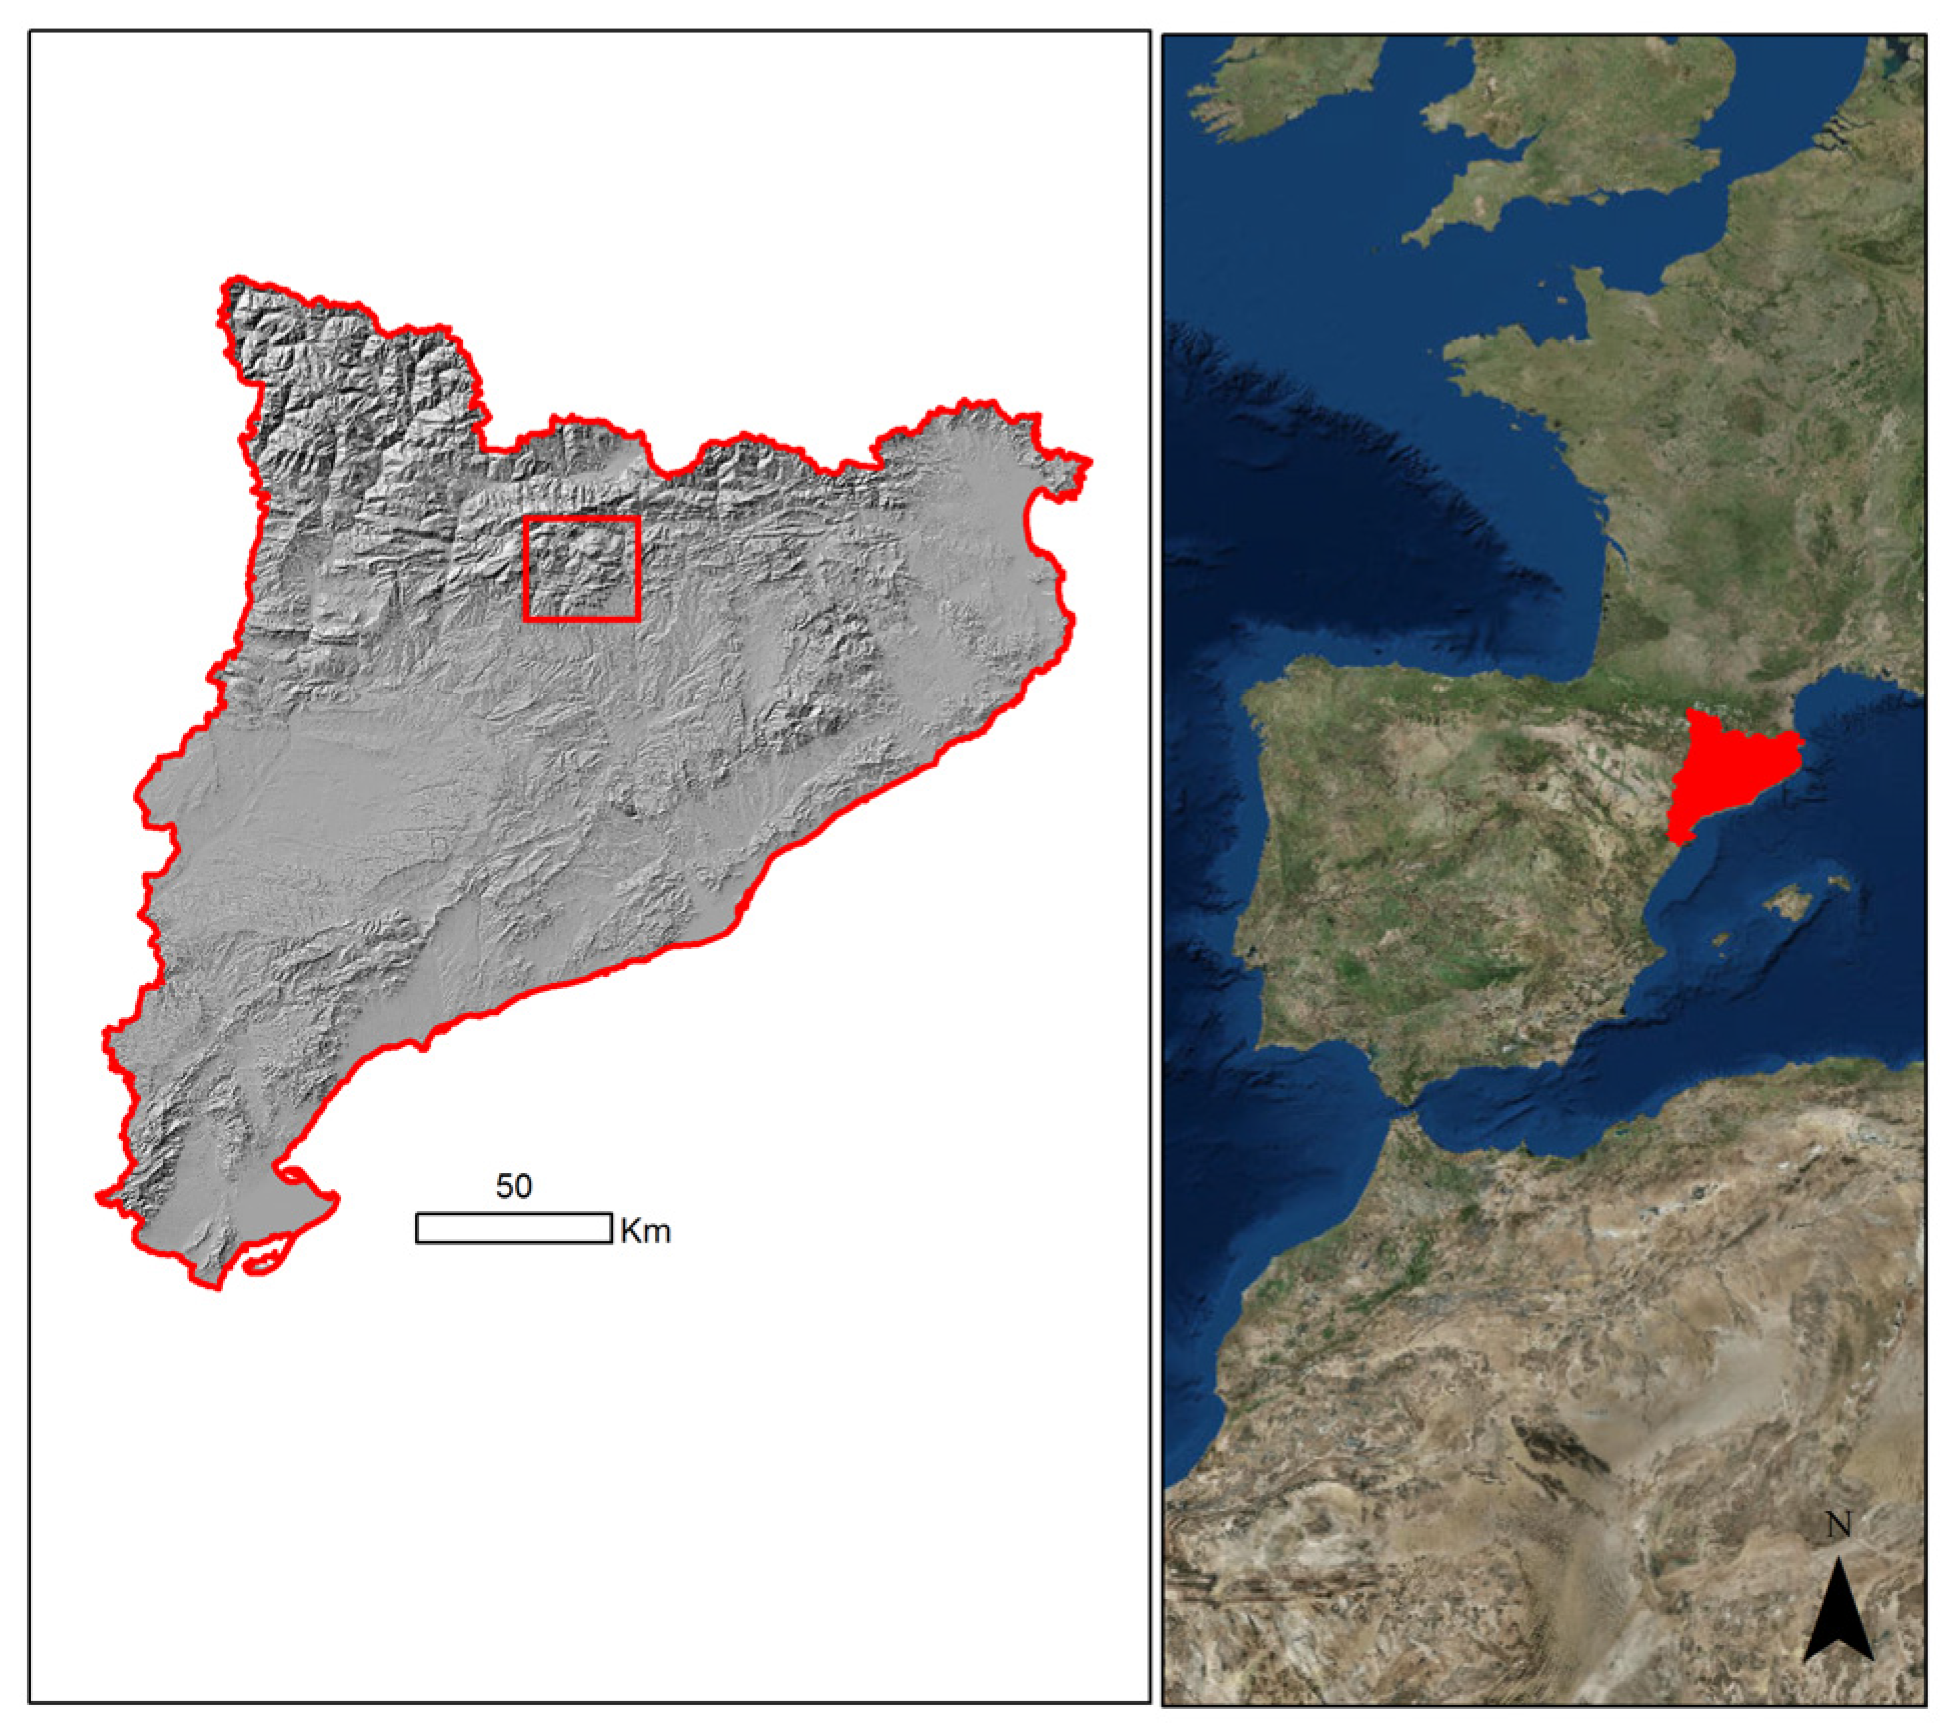
Figure 1. Location of the study area in Catalonia and Spain.
Forests 08 00402 g001
Figure 2. Orthomosaics of the two study sites: Torregassa (left) and Bosquet (right) (Catalonia, Spain).
Forests 08 00402 g002
Figure 3. Pine processionary moth defoliation in the Torregassa forest site: (a) Manual segmentation of analyzed trees and a buffer of 1 m from the tree automatic identification point (blue segment) on the orthomosaic; (b) Visual tree classification in the field as infested (60), non-infested (13) or completely defoliated (8); (c) Defoliation measured as infested or non-infested using RGB images from unmanned aerial systems (RGB-UAS) and the automatic classification; (d) Percentage of defoliation measured in the field.
Forests 08 00402 g003
Figure 4. Pine processionary moth defoliation in healthy (green dots) and infested trees (yellow dots) in Torregassa forest. (a) Manual crown segmentation on the orthomosaic; (b) Defoliation measured as infested (red) or non-infested (green) using RGB-UAS images and the automatic classification.
Forests 08 00402 g004
Figure 5. (a) Linear regression model between defoliation measured in the field and through UAS images in Torregassa forest site; (b) Defoliation using a 1-m buffer around the tree top and using manual crown delineation. n = 81. Red = completely defoliated; grey = infested; green = non-infested.
Forests 08 00402 g005
Figure 6. Pine processionary moth infestation in Torregassa (A) and Bosquet (B) forests.
Forests 08 00402 g006
Figure 7. Automatic tree classification as infested or non-infested using RGB-UAS images for all trees automatically identified in the Torregassa forest site.
Forests 08 00402 g007
Figure 8. Relationship between the total number of nests and percentage of defoliation measured in the field in Torregassa forest (n = 81). Completely defoliated trees are not included in this figure.
Forests 08 00402 g008
Table 1. Confusion Matrix for infested and non-infested trees measured in the field or classified using RGB-UAS images.
Field/RGB-UASNon-InfestedInfestedTotalOmission Error (%)
Non-infested121137.7
Infested16526823.5
Total285381
Commission error57.11.8