Abstract
Rising export of wood pellets from southern United States would bring more land under loblolly pine (Pinus taeda L.) at the expense of other competitive land uses. We developed an approach to project potential changes in existing land uses by integrating site suitability analysis with historical land use dynamics in a watershed located within Oconee River Basin, Georgia, United States. We developed a GIS-based site suitability model to classify land into three categories (High, Medium, and Low) for loblolly pine. Then, we calculated historical rates of land use changes in the selected watershed. Finally, we integrated the output of suitability analysis with the projected rates of land use changes under the two scenarios of wood pellet demand (High and Low) to determine an increase in area under loblolly pine for 2016, 2021, and 2026 in a spatially explicit manner. Relative to 2011, the combined changes in the shrubland and evergreen forest land cover categories under High Demand scenario were 7.6, 14.6, and 21.1% and under Low Demand scenario were 3.8, 7.5, and 11.1% for the years 2016, 2021, and 2026, respectively. The developed approach could be applied in a relatively short time at modest spatial scales. The outputs of this study can also be used to determine the environmental implications of land use changes for ensuring the overall sustainability of wood-based bioenergy development in the United States and beyond.
1. Introduction
The European Union has set the target of sourcing 20% of energy consumption from different renewable sources, including solid biomass to reduce greenhouse gas emissions to 20% below 1990 levels by 2020 [1]. As a result, several power companies in the European Union are increasingly relying on wood pellets as a means of producing heat and electricity [2]. Importantly, these companies are importing wood pellets from the southern United States and western Canada to meet their overall demand [3]. As a result, wood pellet production is continuously rising in southern states, in general, and southeastern states in particular [4]. For example, wood pellet production capacity in the United States has increased by more than four-fold in less than a decade i.e., less than 3 million metric tons in 2008 to over 12 million metric tons in 2014 [2]. This increase in production capacity is responsible for rising exports of wood pellets in the United States. For example, the United States exported about four million metric tons of wood pellets in 2014 [5] and it is expected that exports will rise to about nine million metric tons by 2022 [6]. Southeastern states are currently producing about 98% of the total wood pellets exported from the United States [4] and it is quite likely, that these states will continue to dominate the producton of exported wood pellets in the foreseeable future.
Several studies indicate that the use of imported wood pellets for electricity generation saves at least 50% of greenhouse gas emissions (Table 1), suggesting to a typical southern landowner that wood pellet export markets are long-term in nature and would lead to increased pulpwood prices in the region [7]. This further suggests that more land will come under loblolly pine at the expense of other competing land uses especially in Georgia, Florida, and Alabama as these southeastern states produce about 31.2% of total pulpwood in the United States [8].

Table 1.
Savings in greenhouse gas emissions from electricity derived from wood pellets relative to fossil-fuel based electricity.
There are several studies which have analyzed land use suitability at the field level in the context of sustainable bioenergy development [15]. An analysis of such studies suggests that most of them have analyzed suitability of marginal lands for bioenergy productions at global, regional, or national scales. We also found that the majority of existing site suitability studies for different bioenergy feedstocks focus outside the United States [16,17,18,19,20] and only a handful of studies have analyzed the site suitability of potential bioenergy feedstocks in the context of the United States in general, and the southern United States, in particular.
Ranney and Cushman [21] established a link between woody biomass productivity and land availability without accounting for transportation cost in the southern United States. Graham et al. [22] developed a GIS-based model for locating suitable sites for switchgrass in 11 southern states based on production cost and other factors like soil erosion, nutrient loss, runoff, and pesticide movement off the site. Across the 11 states, delivered feedstock costs ranged from $33 to $55 per dry metric ton to supply a facility requiring 100,000 metric tons of feedstock per year. Barney and DiTomaso [23] used CLIMEX to evaluate regions of North America suitable for switchgrass production based on climate and distribution in the native range. Model results showed that more than 8.7 million km2 of North America is suitable for switchgrass production. Evans et al. [24] developed a modeling approach to identify suitable areas for biofuel feedstock production for two major biofuel crops (corn and switchgrass) based on species distribution models. Dawson and Schlyter [25] assessed suitable areas of varying degree of suitability (high and low suitable) based on the factors like access to roads and ecological conditions. More recently, Nepal et al. [26] designed spatially explicit model to identify suitable sites for bioenergy crops in four counties of northern Kentucky. An area of 10,088 ha was found suitable and economically feasible for establishment of sweetgum for bioenergy purposes.
We also found that most existing studies focusing on site suitability of various potential bioenergy feedstocks use current land use change has an input to the suitability analysis, and typically, do not integrate the suitability analysis with the land use change modeling in a dynamic and spatially-explicit manner [16,17,18,19]. This missing link between site suitability and land use change must be evaluated to develop a holistic understanding about the overall sustainability of trans-Atlantic wood pellet trade as land use change is a primary factor in the study of global environmental change [27]. In this regard, we developed an innovative approach by integrating site suitability analysis with the historical land use change rate to determine potential changes in current land use overtime in a spatially explicit manner due to the rising demand for pulpwood (obtained from loblolly pine) for production of wood pellets in the southeastern United States.
2. Study Area
The selected watershed is in the northeastern corner of Oconee River Basin and occupies about 2439 km2, i.e., 17.7% area of the Oconee River Basin (13,798 km2). The watershed extends to 10 counties and has three wood-consuming mills, including a recently announced wood pellet mill which will consume about a million metric ton of pulpwood and mill residues for manufacturing wood pellets (Figure 1). In 2011, the land cover types present in the selected watershed were deciduous forests (34.8%), developed (21.5%), pasture/hay (21.1%), grassland (7.7%), and evergreen forest (7.6%) [28]. Between 2001 and 2011, the highest increase was observed for land cover types developed-low intensity (26.3%) followed by developed-open space (17.6%) whereas the highest decrease was observed for evergreen forest (12.6%) followed by deciduous forest (7.3%) and pasture/hay (6.9%). About 15.6, 1.1, and 0.1% of total area under shrubland, grassland, and pasture/hay has moved into evergreen forest since 2001, clearly indicating dynamics between pine forestlands and other land uses in the selected watershed (Table 2).
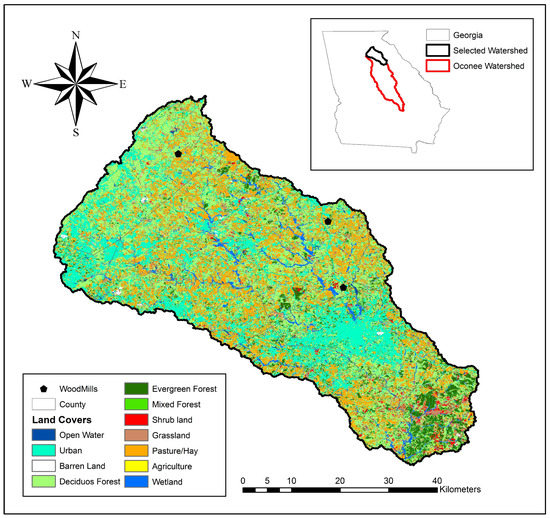
Figure 1.
Location of the selected watershed in the Oconee River Basin. The 2011 land cover map is derived from National Land Cover Dataset available at https://gdg.sc.egov.usda.gov/.

Table 2.
Transition matrix showing changes in land use types (%) between 2001 and 2011 in the watershed.
3. Materials and Methods
The overall modeling structure was divided into two distinct models: a suitability analysis model and a land use change model (Figure 2). We used suitability analysis to identify potential sites for loblolly pine based on five driving factors. The sites were categorized into three categories of High, Medium, and Low based on suitability analysis. Then, we determined the historical rate of change across four land use categories: shrubland, evergreen forest, hay/pasture, and grassland. Based on the historical rate of changes, we assumed future rate of land use changes across selected land uses and site suitability categories under two demand scenarios (High and Low) for wood pellets. Then, we integrated the output of suitability analysis with the projected rate of land use changes to determine land uses for 2016, 2021, and 2026 in a spatially explicit manner.
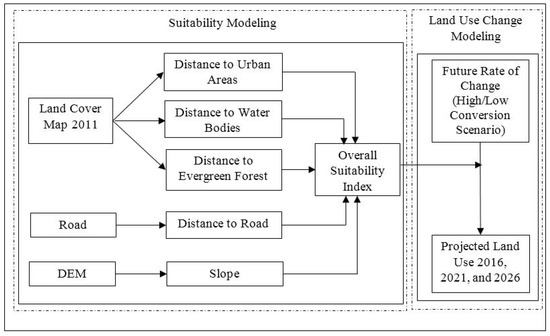
Figure 2.
Framework for integrating suitability analysis with land use change modeling. The 2011 land cover map (30 × 30 m) is derived from National Land Cover Dataset available at USDA/NRCS (https://gdg.sc.egov.usda.gov/). Road layer is obtained from Natural Resources Spatial Analysis Lab at the University of Georgia. The digital elevation model (30 × 30 m) is derived from National Elevation Dataset available at https://gdg.sc.egov.usda.gov/.
3.1. Suitability Modeling
The suitability model involved three steps: identifying suitability factors, scaling and normalizing suitability factors, and calculating Overall Suitability Index (OSI).
Identifying suitability factors: we considered five driving factors to determine the site suitability of loblolly pine in the selected watershed i.e., distance from existing evergreen forest (DisFor); distance from water resources (DisWater); distance from major roads and highways (DisRoads); distance from existing developed areas such as major towns (DisUrban), and slope (Slope). We also checked for suitability of various soil-types present in the selected watershed. However, all soil-types were found suitable for loblolly pine. As a result, we did not consider the soil-types as a driving factor.
Scaling suitability factors: we scaled and obtained normalized index (NI) value for each pixel (30 × 30 m) and for each suitability factor using the following equation
where, PAbs = Absolute pixel value and PMax and PMin are maximum and minimum pixel value for the corresponding suitability factors. The range of NIs was between 0 and 1.
NI = (PAbs − PMin)/(PMax − PMin)
Overall Suitability Index (OSI): we calculated the Overall Suitability Index (OSI) by using the equation
OSI = NIDisFor × 0.25 + NISlope × 0.25 + (1 − NIDisRoad) × 0.2 + (1 − NIDisUrban) × 0.2 + (1 − NIDisWater) × 0.1
The weights in the above equation were based on expert consultations at the University of Georgia’s Warnell School of Forestry and Natural resources. Higher weights for variables distance from existing forestlands and slope suggest these factors are more prominent in determining suitability of loblolly pine in the study area than distance from nearest water bodies. Pixels were further classified into three suitability categories of High, Medium, and Low based on natural breaks present in the OSI. Those pixels with OSI value above 0.56 were assigned to High Suitability category, whereas pixels with OSI value between 0.49 and 0.56 were assigned to Medium Suitability category. Similarly, pixels with OSI value less than 0.49 were assigned to Low Suitability category.
3.2. Historical and Future Changes in Land Use
The historical data contains the transition matrix (Table 2), which estimates the number (or percent) of pixels that have undergone change from one land use to another between 2001 and 2011. The transition matrix indicates that most of the conversion to evergreen forest came from shrublands, grasslands, and hay/pasture at the rate of 15.6, 1.1, and 0.1%, respectively indicating that when the demand of wood pellets would increase, these land uses are most likely to be converted to evergreen forest. The future dataset contains estimates of rate of change from 2012 to 2028. We determined the potential land use change under two demand scenarios of wood pellets (High and Low) with different transition rate for various site suitability classes present under a given land use category. Under a High Demand scenario, we increased the historical transition rates by 10, 20, and 30 times for Low, Medium, and High suitability categories, respectively. The increments were 5, 10, and 15 times for Low, Medium, and High suitability categories under the Low Demand scenario, respectively (Table 3).

Table 3.
Suitability category with their respective historical and future rate of change (%) on annual basis.
3.3. Projection of Land Use Changes
We projected land uses for 2016, 2021, and 2026 by integrating the output of suitability analysis with the future rate of changes. To prevent competition with food production and the conversion of natural forest, we restricted our analysis to the following land uses only: hay/pasture, shrubland, evergreen forest, and grassland. We followed Figure 3 for determining transition of selected land uses to evergreen forest over time. For example, depending upon a demand scenario, a fixed number of pixels (Table A1 and Table A2) move into shrubland from hay/pasture and grassland land uses each year and they will stay in the same land use category for next nine years. After that nine-year period, they move to the evergreen forestland category where they will stay till the harvest age of 25 years (a typical harvest age of loblolly pine in the southeastern states). Once harvested, these pixels will come back to the shrubland category for next nine years. This cycle is repeated over simulation years (2012–2028) for each transitioning pixel present in the watershed for selected land uses.
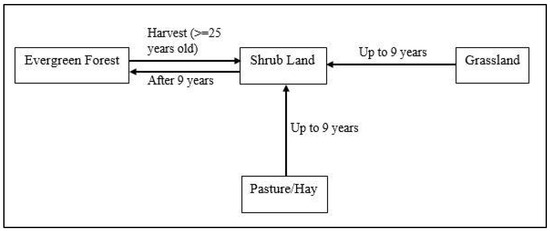
Figure 3.
Transition rules between selected land uses in the study. The National Land Cover Database defines shrubland as areas dominated by shrubs that are less than five meters tall with shrub canopy typically >20% of total vegetation [28]. We have assumed that loblolly pine attains the height of five meters by the age nine.
4. Results
4.1. Suitability Analysis
The majority of High Suitability sites are clustered in the southern part of the watershed due to their proximity to existing evergreen forest areas. High Suitability sites are also present in the northern part of the watershed as they are far from urban centers located in the watershed. Low Suitability sites are represented by water bodies and developmental areas (Figure 4a). The spatial distribution of land suitability for four selected land cover categories suggest that Medium Suitability sites are well dispersed across the watershed (Figure 4b). A total of 923 km2 (area under hay/pasture, shrubland, evergreen forest, and grassland categories) was taken into consideration for suitability analysis and land use change modeling in the selected watershed, representing represents 38% area of the selected watershed. Figure 5 shows the distribution of suitability classes under four land uses. High, Medium, and Low suitability sites were found to be 6.7% (162.5 km2), 22.6% (548.5 km2), and 8.6% (209.3 km2) of the total watershed area.
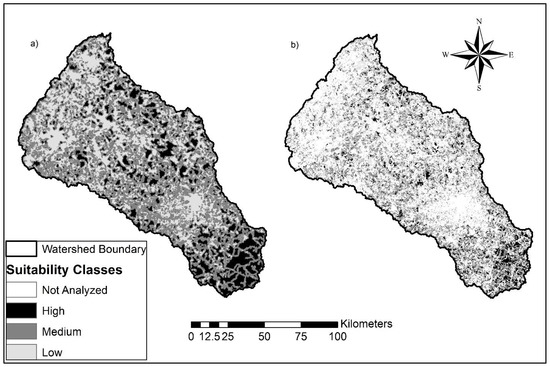
Figure 4.
Suitability map of loblolly pine under (a) all land uses and (b) selected land uses (evergreen forest, shrubland, grassland, and pasture/hay) in the watershed.
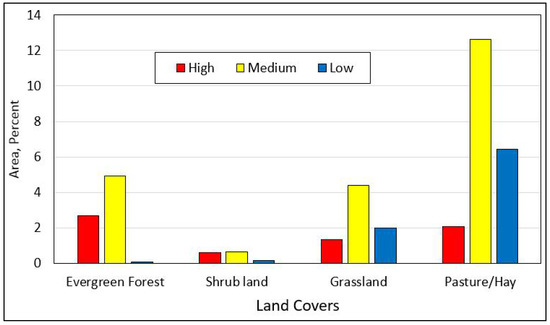
Figure 5.
Site Suitability distribution for loblolly pine under selected land uses (evergreen forest, shrubland, grassland, and pasture/hay).
4.2. Land Use Change
The spatial distribution of changed pixels show that the changes occurred on pixels which were located close to the announced wood pellet mill (Figure 6), as the allocation of pixels for conversion to evergreen forest was based on the distance from the wood pellet mill. Figure 7a shows the map of land uses of the selected watershed in 2011. The outputs of the land use change model, i.e., land use maps for 2016, 2021, and 2026 are shown in Figure 7b–d under High Demand Scenario and in Figure 7e–g under Low Demand Scenario, respectively. The change in shrubland and evergreen forest combined relative to 2011 under High Demand scenario were 7.6, 14.6, and 21.1% and 3.8, 7.5, and 11.1% under the Low Demand scenario for years 2016, 2021, and 2026, respectively.
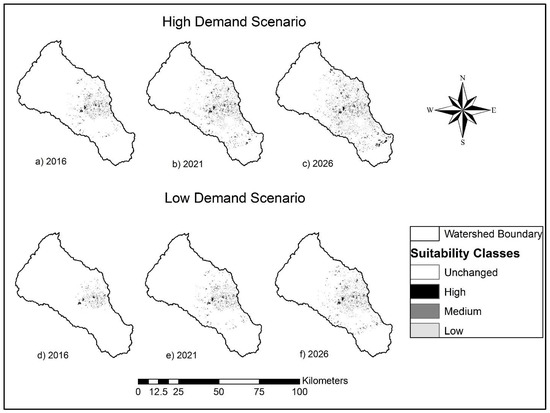
Figure 6.
Allocation of suitable sites for pine plantation under high and low demand scenarios.
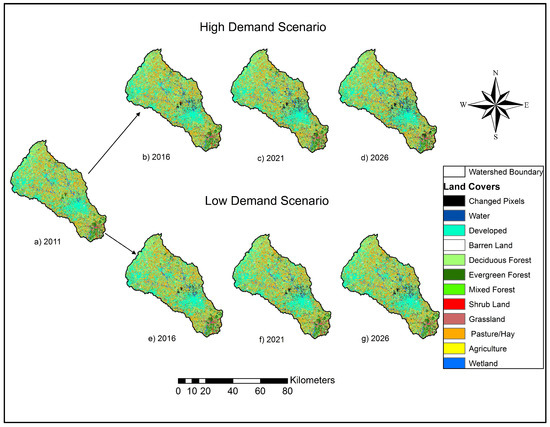
Figure 7.
Land use changes under high and low demand scenarios for wood pellet production.
5. Discussions
The majority of existing studies focusing on suitability of bioenergy feedstocks at a given spatial scale do not examine the possible impacts of bioenergy production on land uses over space and time. In fact, most them use land use as an input for the suitability analysis. In this regard, the methodology developed in this study analyzes the trade-off between land use and demand for wood-based energy products, in general and wood pellets, in particular to better understand the overall sustainability of emerging trans-Atlantic wood pellet trade in the context of land use change.
First, we developed a GIS-based suitability model to identify the suitable areas for loblolly pine plantation based on five relevant factors in a watershed located in the northeastern corner of the Oconee River Basin. We only considered four land cover classes covering an area of 923 km2, which represents 38% of the watershed area to avoid issues related to biodiversity conservation and food security. We also determined the future rate of land use change based on the historical transition rates of land use in the selected watershed. The final output of the suitability analysis was used as an input in a land use change model where it was combined with future rate of land use changes to simulate potential land use changes over space and time in the context of growing demand for wood pellets in the region. Based on the land use change model, we obtained land use maps for 2016, 2021, and 2026.
Our results suggest that, depending upon the expected demand for wood pellet production in the region, up to 20% of existing land could move into loblolly plantations in the selected watershed. We also found that most of land use change will happen on Medium Suitability sites since the total land under the Medium Suitability site category was highest to begin with in the selected watershed. Additionally, based on our modeling assumption, we found that the areas close to the announced pellet mill have higher chances of moving into loblolly pine than areas which are farther away from the pellet mill. This assumption is realistic in nature as landowners who are closer to the pellet mill will get a higher price for their feedstock than landowners who are farther away after accounting for biomass transportation costs.
6. Conclusions
The model developed in this study is as a general tool that can be applied to a modest size watershed in various geographical regions in a relatively short amount of time, thus it could potentially help in guiding research on sustainability of wood pellet-based bioenergy development. For example, the results of this study on potential land use changes could be integrated with watershed modeling to determine impacts of land use changes as driven by the demand for wood pellets on total water availability and water quality over time. The results of the study could also be used for sustainable landscape planning in the context of sustainable multifunctional bioenergy landscapes. We are hopeful that integration of the model developed in this study with other models which assess forest-based ecosystem services will help stakeholder groups like the European Union in determining the overall sustainability of trans-Atlantic wood pellet trade and will directly feed into sustainability standards of existing bioenergy certification schemes.
The main limitation of this developed approach is that we have not considered economic (production cost) or market constraints in this analysis. In future research, economic characteristics can be integrated to make the developed model more robust to successfully model the impact of bioenergy development on land use change. Additionally, two out of five suitability factors (distance from urban areas and distance from roads) are expected to change due to increase in populations, shift from rural to urban areas, and the development of new infrastructures, which will affect the future land use change. As a result, the location and the amount of land available for woody biomass production will be affected. However, we did not model the dynamics of these suitability factors over time in a spatially explicit manner due to lack of data regarding the trajectory of urban development in the region especially in the presence of strong demand for wood pellet.
We hope that the integrated model developed in the study will guide future research on wood-based bioenergy development in the region and give us an insight about the overall sustainability of wood-based bioenergy development at local, regional, and national levels.
Author Contributions
S.S. collected and analyzed the data, developed the model, and wrote the manuscript. P.D. conceptualized the research, developed the model, and wrote the manuscript.
Conflicts of Interest
The authors declare no conflict of interest.
Appendix

Table A1.
Total Number of Pixels Transitioning Each Year (High Demand Scenario).
Table A1.
Total Number of Pixels Transitioning Each Year (High Demand Scenario).
| Site Suitability Classes → | High | Medium | Low | |||||||||
|---|---|---|---|---|---|---|---|---|---|---|---|---|
| Land Covers → | 81 | 71 | 52 | 42 | 81 | 71 | 52 | 42 | 81 | 71 | 52 | 42 |
| Year | ||||||||||||
| 2012 | 99 | 727 | 133 | 3950 | 543 | 2308 | 115 | 3330 | 70 | 102 | 2 | 2 |
| 2013 | 99 | 712 | 132 | 3707 | 542 | 2263 | 114 | 3239 | 70 | 102 | 2 | 2 |
| 2014 | 99 | 697 | 131 | 3479 | 541 | 2218 | 114 | 3151 | 70 | 102 | 2 | 2 |
| 2015 | 99 | 683 | 130 | 3266 | 540 | 2175 | 113 | 3065 | 70 | 101 | 2 | 2 |
| 2016 | 99 | 669 | 129 | 3065 | 539 | 2132 | 112 | 2982 | 70 | 101 | 2 | 2 |
| 2017 | 98 | 656 | 128 | 2876 | 538 | 2090 | 111 | 2901 | 70 | 101 | 2 | 2 |
| 2018 | 98 | 642 | 126 | 2699 | 538 | 2050 | 110 | 2822 | 70 | 101 | 2 | 2 |
| 2019 | 98 | 629 | 125 | 2533 | 537 | 2009 | 110 | 2745 | 70 | 101 | 2 | 2 |
| 2020 | 98 | 616 | 124 | 2378 | 536 | 1970 | 109 | 2670 | 70 | 100 | 2 | 2 |
| 2021 | 98 | 604 | 123 | 2231 | 535 | 1931 | 108 | 2598 | 70 | 100 | 2 | 2 |
| 2022 | 98 | 591 | 122 | 2094 | 534 | 1894 | 107 | 2527 | 69 | 100 | 2 | 2 |
| 2023 | 97 | 579 | 121 | 1965 | 533 | 1856 | 107 | 2458 | 69 | 100 | 2 | 2 |
| 2024 | 97 | 568 | 120 | 1844 | 532 | 1820 | 106 | 2391 | 69 | 100 | 2 | 2 |
| 2025 | 97 | 556 | 119 | 1731 | 532 | 1784 | 105 | 2326 | 69 | 99 | 2 | 2 |
| 2026 | 97 | 545 | 118 | 1625 | 531 | 1749 | 105 | 2263 | 69 | 99 | 2 | 2 |
| 2027 | 97 | 533 | 117 | 1525 | 530 | 1715 | 104 | 2202 | 69 | 99 | 2 | 2 |
| 2028 | 97 | 523 | 116 | 1431 | 529 | 1681 | 103 | 2142 | 69 | 99 | 2 | 2 |
| 2029 | 96 | 512 | 115 | 1343 | 528 | 1649 | 102 | 2083 | 69 | 99 | 2 | 2 |
| 2030 | 96 | 501 | 114 | 1260 | 527 | 1616 | 102 | 2027 | 69 | 98 | 2 | 2 |
| Total | 1857 | 11,543 | 2343 | 45,002 | 10,165 | 36,910 | 2057 | 49,922 | 1321 | 1904 | 38 | 38 |
Land Cover Types: Evergreen Forest (42); Shrub/Scrub (52); Grassland/Herbaceous (71); Pasture/Hay (81). Pixels allocation under each suitability category is based on the rate of change assigned to each suitability category. The conversion of land uses 81, 71, and 42 is to land use 52. Similarly, the conversion of land use 52 is to land use 42.

Table A2.
Total Number of Pixels at Transition Each Year (Low Demand Scenario).
Table A2.
Total Number of Pixels at Transition Each Year (Low Demand Scenario).
| Site Suitability Classes → | High | Medium | Low | |||||||||
|---|---|---|---|---|---|---|---|---|---|---|---|---|
| Land Covers → | 81 | 71 | 52 | 42 | 81 | 71 | 52 | 42 | 81 | 71 | 52 | 42 |
| Year | ||||||||||||
| 2012 | 50 | 364 | 133 | 1975 | 272 | 1154 | 115 | 1665 | 35 | 51 | 2 | 1 |
| 2013 | 50 | 360 | 132 | 1915 | 271 | 1143 | 114 | 1642 | 35 | 51 | 2 | 1 |
| 2014 | 50 | 356 | 131 | 1856 | 271 | 1132 | 114 | 1620 | 35 | 51 | 2 | 1 |
| 2015 | 50 | 353 | 130 | 1799 | 271 | 1121 | 113 | 1598 | 35 | 51 | 2 | 1 |
| 2016 | 50 | 349 | 129 | 1743 | 271 | 1110 | 112 | 1576 | 35 | 51 | 2 | 1 |
| 2017 | 50 | 345 | 128 | 1690 | 271 | 1099 | 111 | 1555 | 35 | 51 | 2 | 1 |
| 2018 | 50 | 342 | 126 | 1638 | 270 | 1088 | 110 | 1534 | 35 | 51 | 2 | 1 |
| 2019 | 50 | 338 | 125 | 1588 | 270 | 1077 | 110 | 1513 | 35 | 51 | 2 | 1 |
| 2020 | 50 | 335 | 124 | 1539 | 270 | 1067 | 109 | 1492 | 35 | 51 | 2 | 1 |
| 2021 | 50 | 332 | 123 | 1491 | 270 | 1056 | 108 | 1472 | 35 | 51 | 2 | 1 |
| 2022 | 49 | 328 | 122 | 1446 | 269 | 1046 | 107 | 1452 | 35 | 51 | 2 | 1 |
| 2023 | 49 | 325 | 121 | 1401 | 269 | 1036 | 107 | 1432 | 35 | 51 | 2 | 1 |
| 2024 | 49 | 322 | 120 | 1358 | 269 | 1026 | 106 | 1413 | 35 | 51 | 2 | 1 |
| 2025 | 49 | 318 | 119 | 1316 | 269 | 1016 | 105 | 1393 | 35 | 51 | 2 | 1 |
| 2026 | 49 | 315 | 118 | 1276 | 269 | 1006 | 105 | 1375 | 35 | 51 | 2 | 1 |
| 2027 | 49 | 312 | 117 | 1236 | 268 | 996 | 104 | 1356 | 35 | 50 | 2 | 1 |
| 2028 | 49 | 309 | 116 | 1198 | 268 | 986 | 103 | 1337 | 35 | 50 | 2 | 1 |
| 2029 | 49 | 305 | 115 | 1162 | 268 | 976 | 102 | 1319 | 35 | 50 | 2 | 1 |
| 2030 | 49 | 302 | 114 | 1126 | 268 | 967 | 102 | 1301 | 35 | 50 | 2 | 1 |
| Total | 941 | 6310 | 2343 | 28,753 | 5124 | 20,102 | 2057 | 28,045 | 665 | 965 | 38 | 19 |
Land Cover Types: Evergreen Forest (42); Shrub/Scrub (52); Grassland/Herbaceous (71); Pasture/Hay (81). Pixels allocation under each suitability category is based on the rate of change assigned to each suitability category. The conversion of land uses 81, 71, and 42 is to land use 52. Similarly, the conversion of land use 52 is to land use 42.
References
- European Commission. Analysis of Options Beyond 20% GHG Emission Reductions: Member State Results. Commission Staff Working Paper. 2012. Available online: http://www.wire1002.ch/fileadmin/user_upload/Documents/COST_Office/2010_05_26_communication_en_1_.pdf (accessed on 10 March 2017).
- Goetzl, A. Developments in the Global Trade of Wood Pellets; Office of Industries Working Paper; U.S. International Trade Commission: Washington, DC, USA, 2015.
- Lamers, P.; Hoefnagels, R.; Junginger, M.; Hamelinck, C.; Faaij, A. Global solid biomass trade for energy by 2020: An assessment of potential import streams and supply costs to north-west Europe under different sustainability constraints. Glob. Chang. Biol. Bioenergy 2015, 7, 618–634. [Google Scholar] [CrossRef]
- Wong, P.; Bredehoeft, G. U.S. Wood Pellet Exports Double in 2013 in Response to Growing European Demand. 2014. Available online: http://www.eia.gov/todayinenergy/detail.cfm?id=16391 (accessed on 11 March 2017).
- USEIA. UK’s Renewable Energy Targets Drive Increases in U.S. Wood Pellet Exports. United States Energy Information Administration, 2015. Available online: https://www.eia.gov/todayinenergy/detail.cfm?id=20912 (accessed on 15 March 2017).
- Forisk. Wood Bioenergy Update and North American Pellet Capacity: Q3 2016. Available online: http://forisk.com/blog/2016/08/17/wood-bioenergy-update-north-american-pellet-capacity-q3-2016/ (accessed on 20 September 2017).
- Abt, K.L.; Abt, R.C.; Galik, C. Effect of bioenergy demands and supply response on markets, carbon, and land use. For. Sci. 2012, 58, 523–539. [Google Scholar] [CrossRef]
- Piva, R.J.; Bentley, J.W.; Hayes, S.W. National Pulpwood Production, 2010; Resource 346 Bulletin. NRS-89; United States Department of Agriculture Forest Service, Northern 347 Research Station, 2014; 74p, Available online: https://www.treesearch.fs.fed.us/pubs/45928 (accessed on 15 March 2017).
- Dwivedi, P.; Bailis, R.; Bush, T.G.; Marinescu, M. Quantifying GWI of wood pellet production in the Southern United States and its subsequent utilization for electricity production in The Netherlands/Florida. Bioenergy Res. 2011, 4, 180–192. [Google Scholar] [CrossRef]
- Dwivedi, P.; Khanna, M.; Bailis, R.; Ghilardi, A. Potential greenhouse gas benefits of transatlantic wood pellet trade. Environ. Res. Lett. 2014, 9, 11. [Google Scholar] [CrossRef]
- Galik, C.S.; Abt, R.C. Sustainability guidelines and forest market response: An assessment of European Union pellet demand in the Southeastern United States. Glob. Chang. Biol. Bioenergy 2016, 8, 658–669. [Google Scholar] [CrossRef]
- Nepal, P.; Wear, D.N.; Skog, K.E. Net change in carbon emissions with increased wood energy use in the United States. Glob. Chang. Biol. Bioenergy 2015, 7, 820–835. [Google Scholar] [CrossRef]
- Röder, M.; Whittaker, C.; Thornley, P. How certain are greenhouse gas reductions from bioenergy? Life cycle assessment and uncertainty analysis of wood pellet-to-electricity supply chains from forest residues. Biomass Bioenergy 2015, 79, 50–63. [Google Scholar]
- Wang, W.; Dwivedi, P.; Abt, R.; Khanna, M. Carbon savings with transatlantic trade in pellets: Accounting for market-driven effects. Environ. Res. Lett. 2015, 10, 114019. [Google Scholar] [CrossRef]
- Lewis, S.M.; Kelly, M. Mapping the potential for biofuel production on marginal lands: Differences in definitions, data and models across scales. ISPRS Intern. J. Geo-Inf. 2014, 3, 430–459. [Google Scholar] [CrossRef]
- Abolina, E.; Volk, T.A.; Lazdina, D. GIS based agricultural land availability assessment for the establishment of short rotation woody crops in Latvia. Biomass Bioenergy 2015, 72, 263–272. [Google Scholar] [CrossRef]
- Tang, Y.; Xie, J.-S.; Geng, S. Marginal land-based biomass energy production in China. J. Integr. Plant Biol. 2010, 52, 112–121. [Google Scholar] [CrossRef] [PubMed]
- Lu, L.; Jiang, D.; Zhuang, D.; Huang, Y. Evaluating the marginal land resources suitable for developing pistacia chinensis-based biodiesel in China. Energies 2012, 5, 2165–2177. [Google Scholar] [CrossRef]
- Pulighe, G.; Bonati, G.; Fabiani, S.; Barsali, T.; Lupia, F.; Vanino, S.; Nino, P.; Arca, P.; Roggero, P.P. Assessment of the Agronomic Feasibility of Bioenergy Crop Cultivation on Marginal and Polluted Land: A GIS-Based Suitability Study from the Sulcis Area, Italy. Energies 2016, 9, 895. [Google Scholar] [CrossRef]
- Miyake, S.; Smith, C.; Peterson, A.; McAlpine, C.; Renouf, M.; Waters, D. Environmental implications of using “underutilised agricultural land” for future bioenergy crop production. Agric. Syst. 2015, 139, 180–195. [Google Scholar] [CrossRef]
- Ranney, J.W.; Cushman, J.H. Regional evaluation of woody biomass production for fuels in the southeast. Biotechnol. Bioeng. 1980, 22, 109–120. [Google Scholar]
- Graham, R.L.; English, B.C.; Noon, C.E. A geographic information system-based modeling system for evaluating the cost of delivered energy crop feedstock. Biomass Bioenergy 2000, 18, 309–329. [Google Scholar] [CrossRef]
- Barney, J.N.; Di Tomaso, J.M. Bioclimatic predictions of habitat suitability for the biofuel switchgrass in North America under current and future climate scenarios. Biomass Bioenergy 2010, 34, 124–133. [Google Scholar] [CrossRef]
- Evans, J.M.; Fletcher, R.J.; Alavalapati, J. Using species distribution models to identify suitable areas for biofuel feedstock production. Glob. Chang. Biol. Bioenergy 2010, 2, 63–78. [Google Scholar] [CrossRef]
- Dawson, L.; Schlyter, P. Less is more: Strategic scale site suitability for concentrated solar thermal power in Western Australia. Energy Policy 2012, 47, 91–101. [Google Scholar] [CrossRef]
- Nepal, S.; Contreras, M.A.; Lhotka, J.M.; Stainback, G.A. A spatially explicit model to identify suitable sites to establish dedicated woody energy crops. Biomass Bioenergy 2014, 71, 245–255. [Google Scholar] [CrossRef]
- Houghton, R.A. The worldwide extent of land-use change. Bioscience 1994, 44, 305–313. [Google Scholar] [CrossRef]
- USDA/NRCS. Geospatial Data Gateway. United States Department of Agriculture Natural Resources Conservation Service, 2015. Available online: https://gdg.sc.egov.usda.gov/ (accessed on 20 March 2017).
© 2017 by the authors. Licensee MDPI, Basel, Switzerland. This article is an open access article distributed under the terms and conditions of the Creative Commons Attribution (CC BY) license (http://creativecommons.org/licenses/by/4.0/).