
Spatial Heterogeneity of Climate Change Effects on Dominant Height of Larch Plantations in Northern and Northeastern China


Abstract
:
1. Introduction
2. Materials and Methods
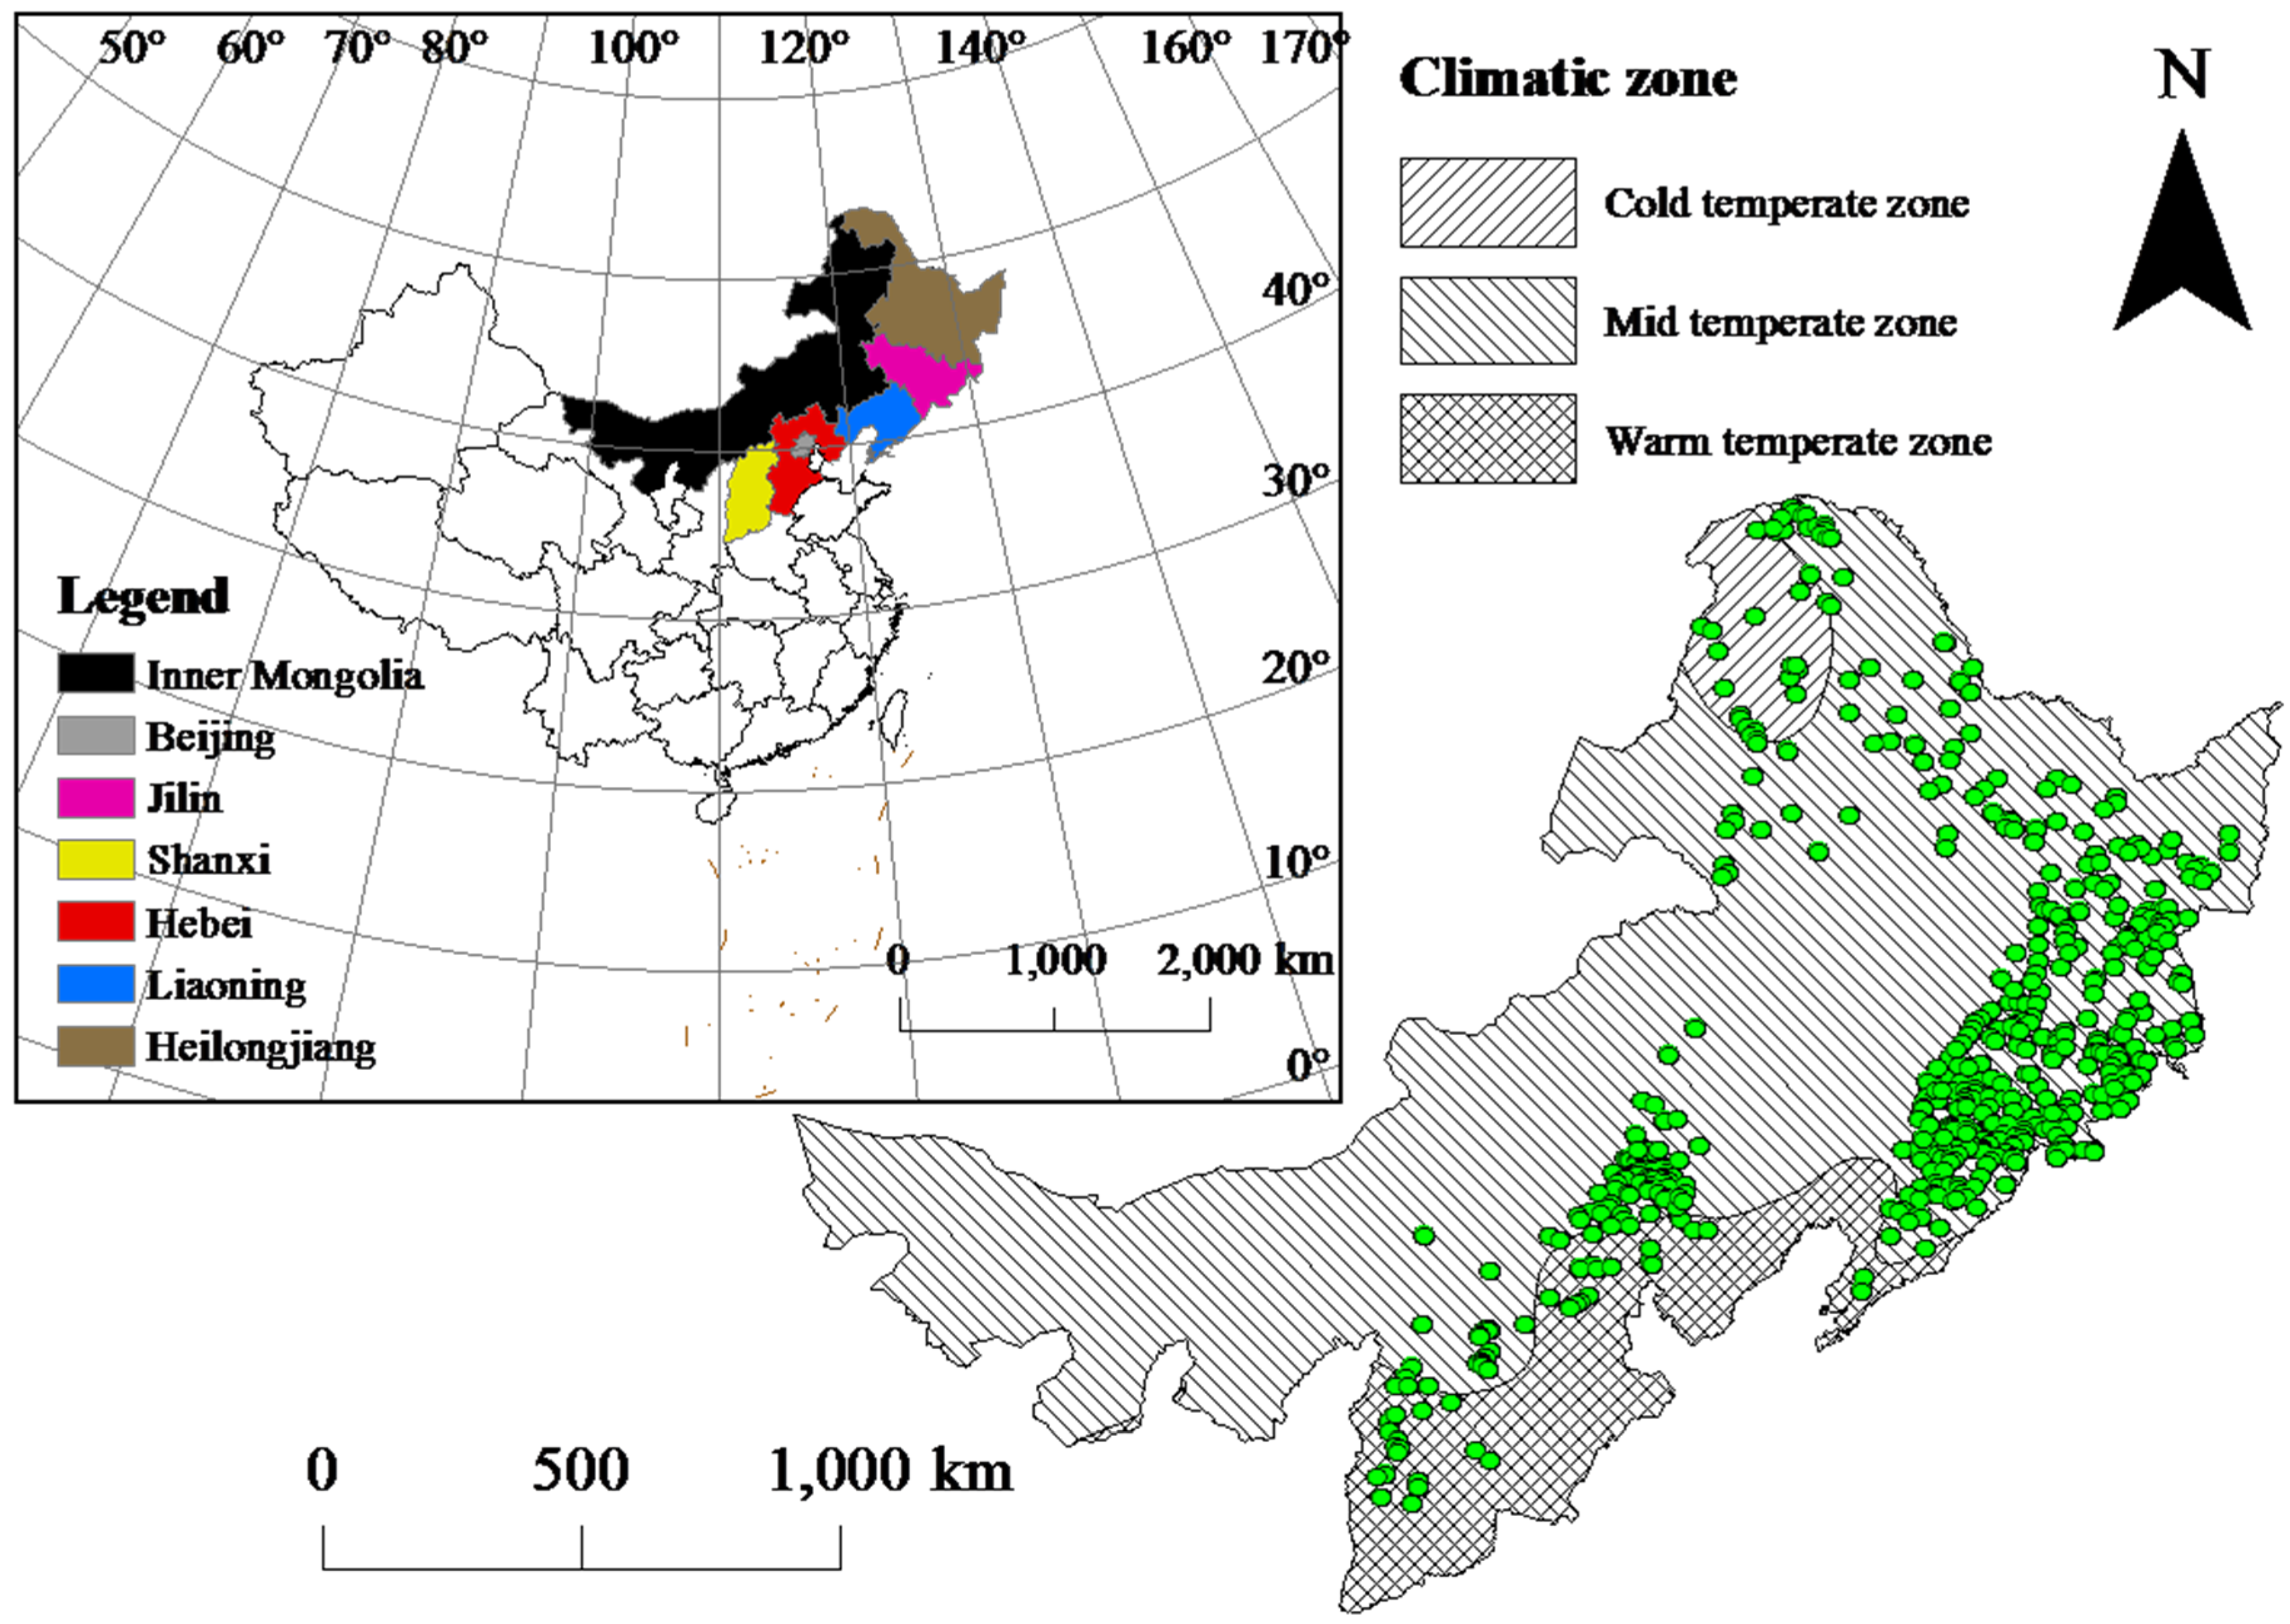
2.1. Plot Height-Age Data
2.2. Climate Data
2.3. Soil Data
2.4. Model Development
3. Results
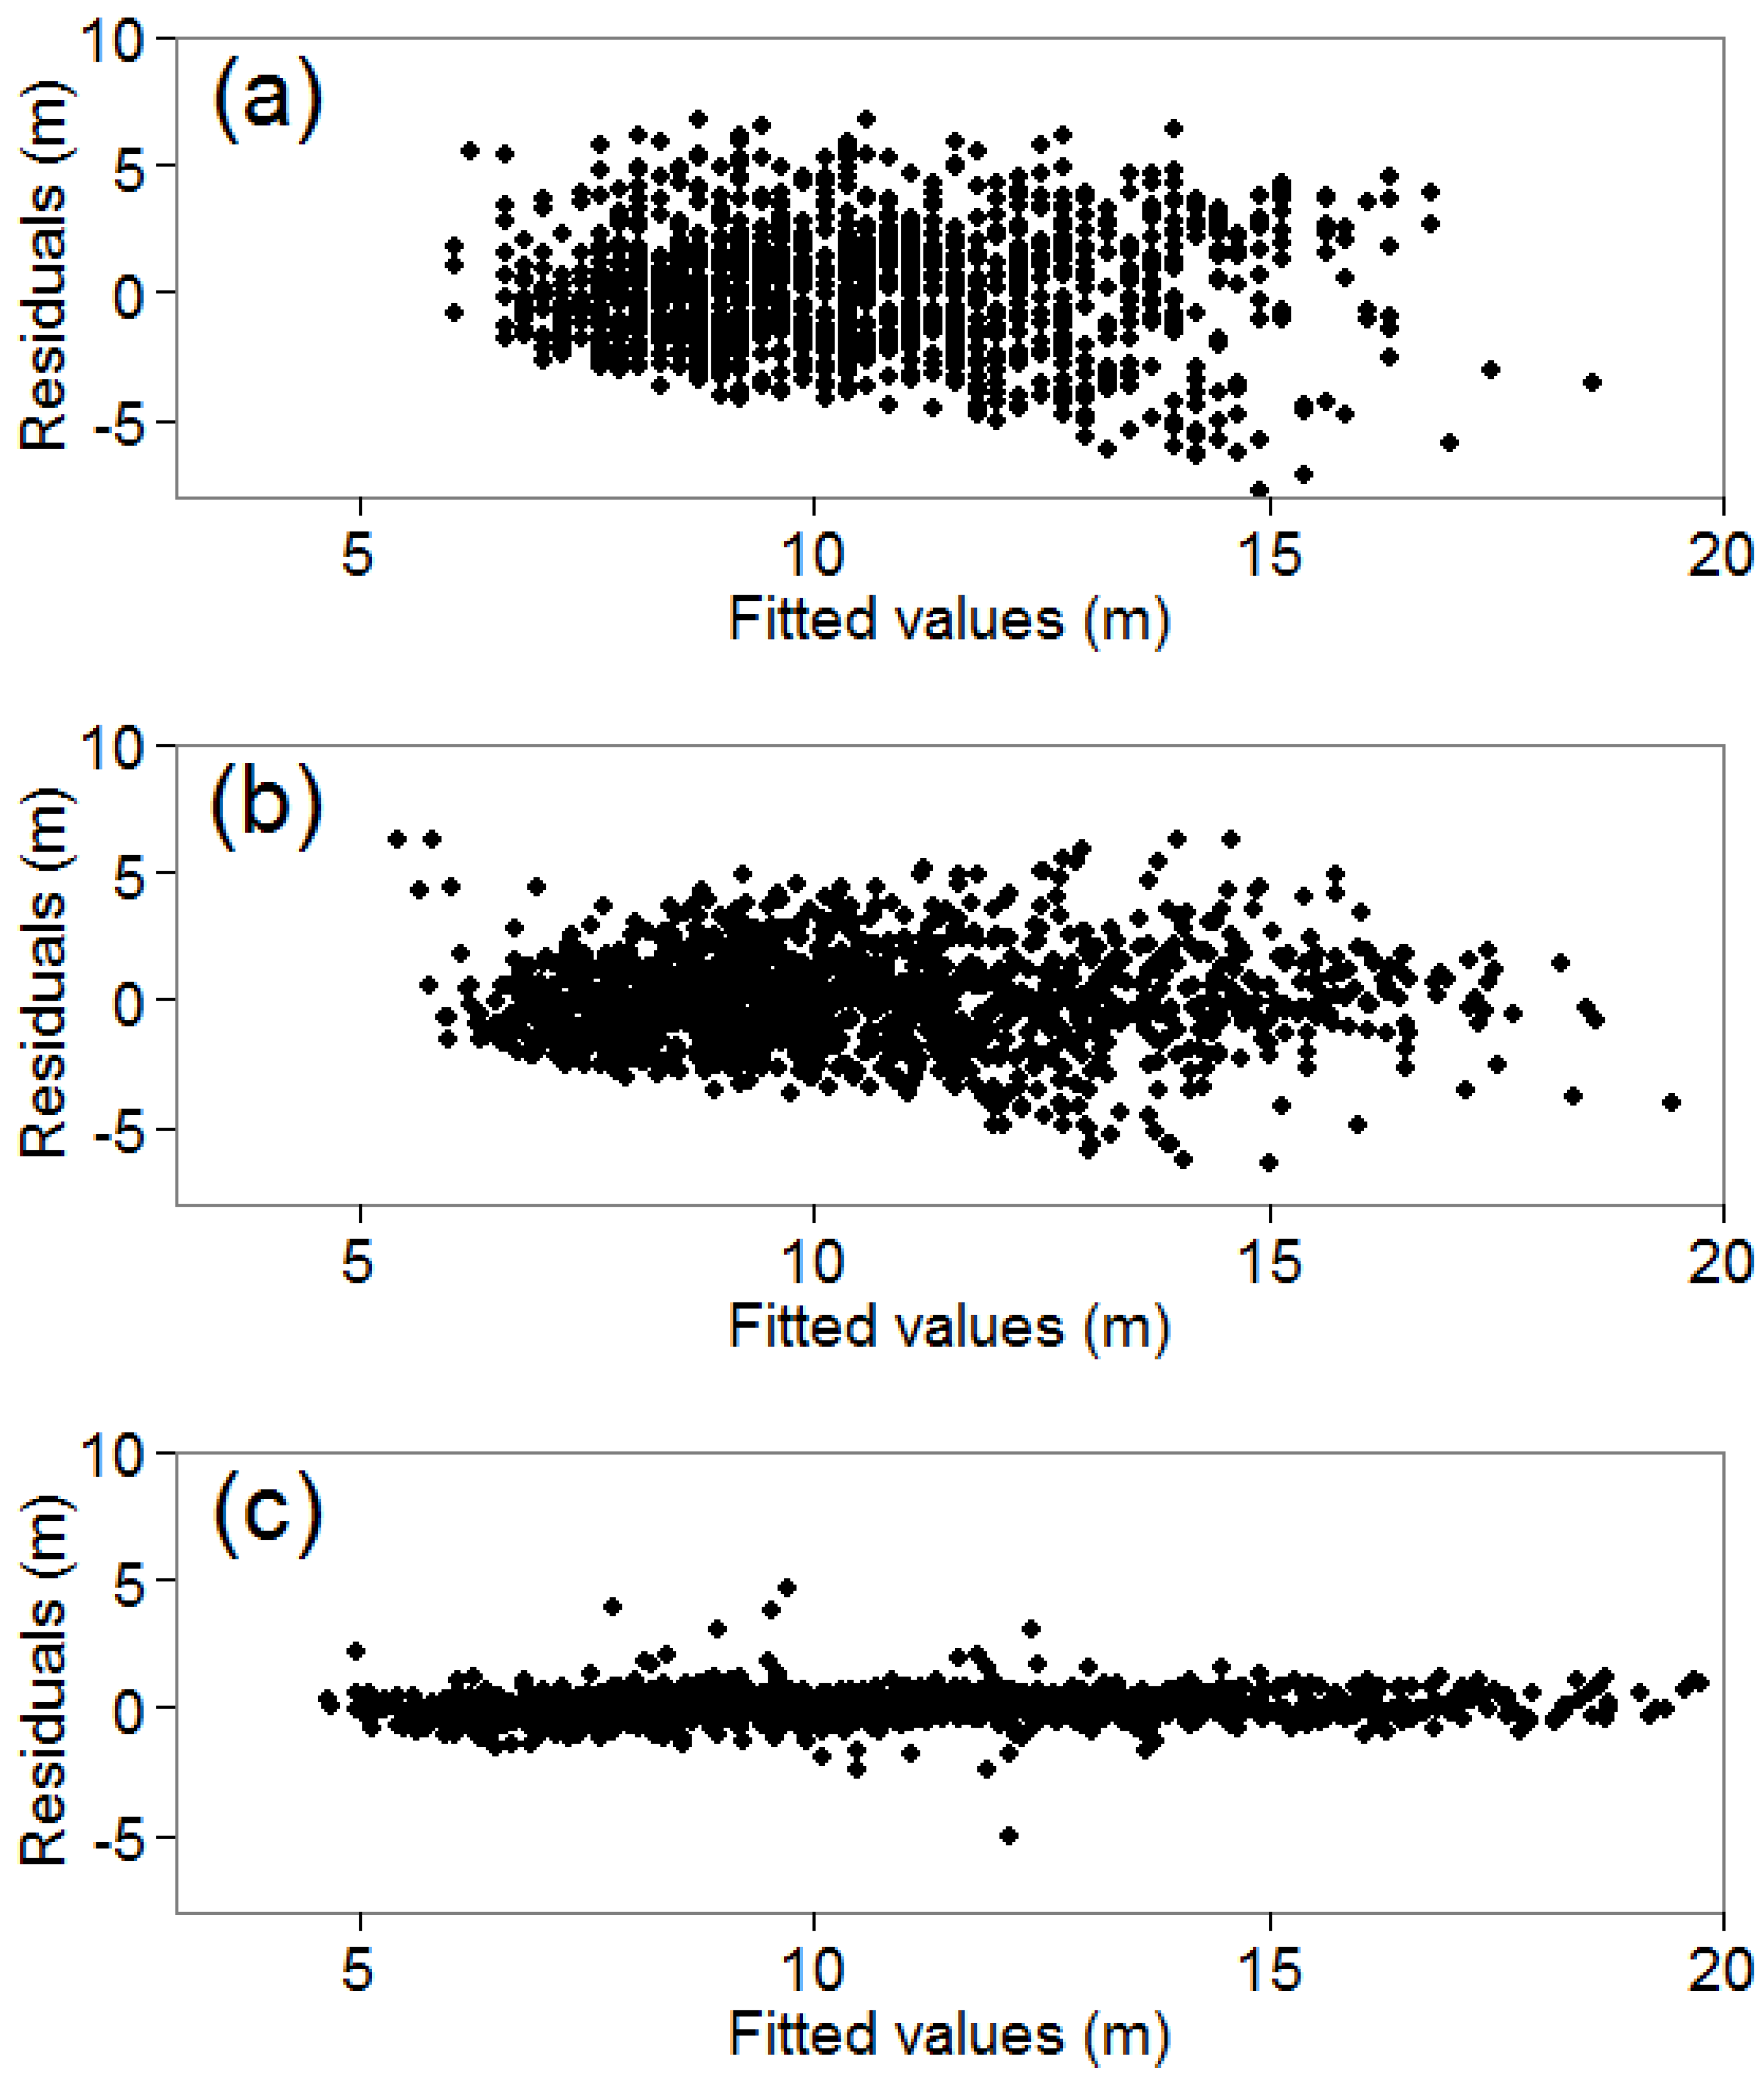
3.1. Model Development
3.2. Prediction of Dominant Height Growth under Future Climate Change
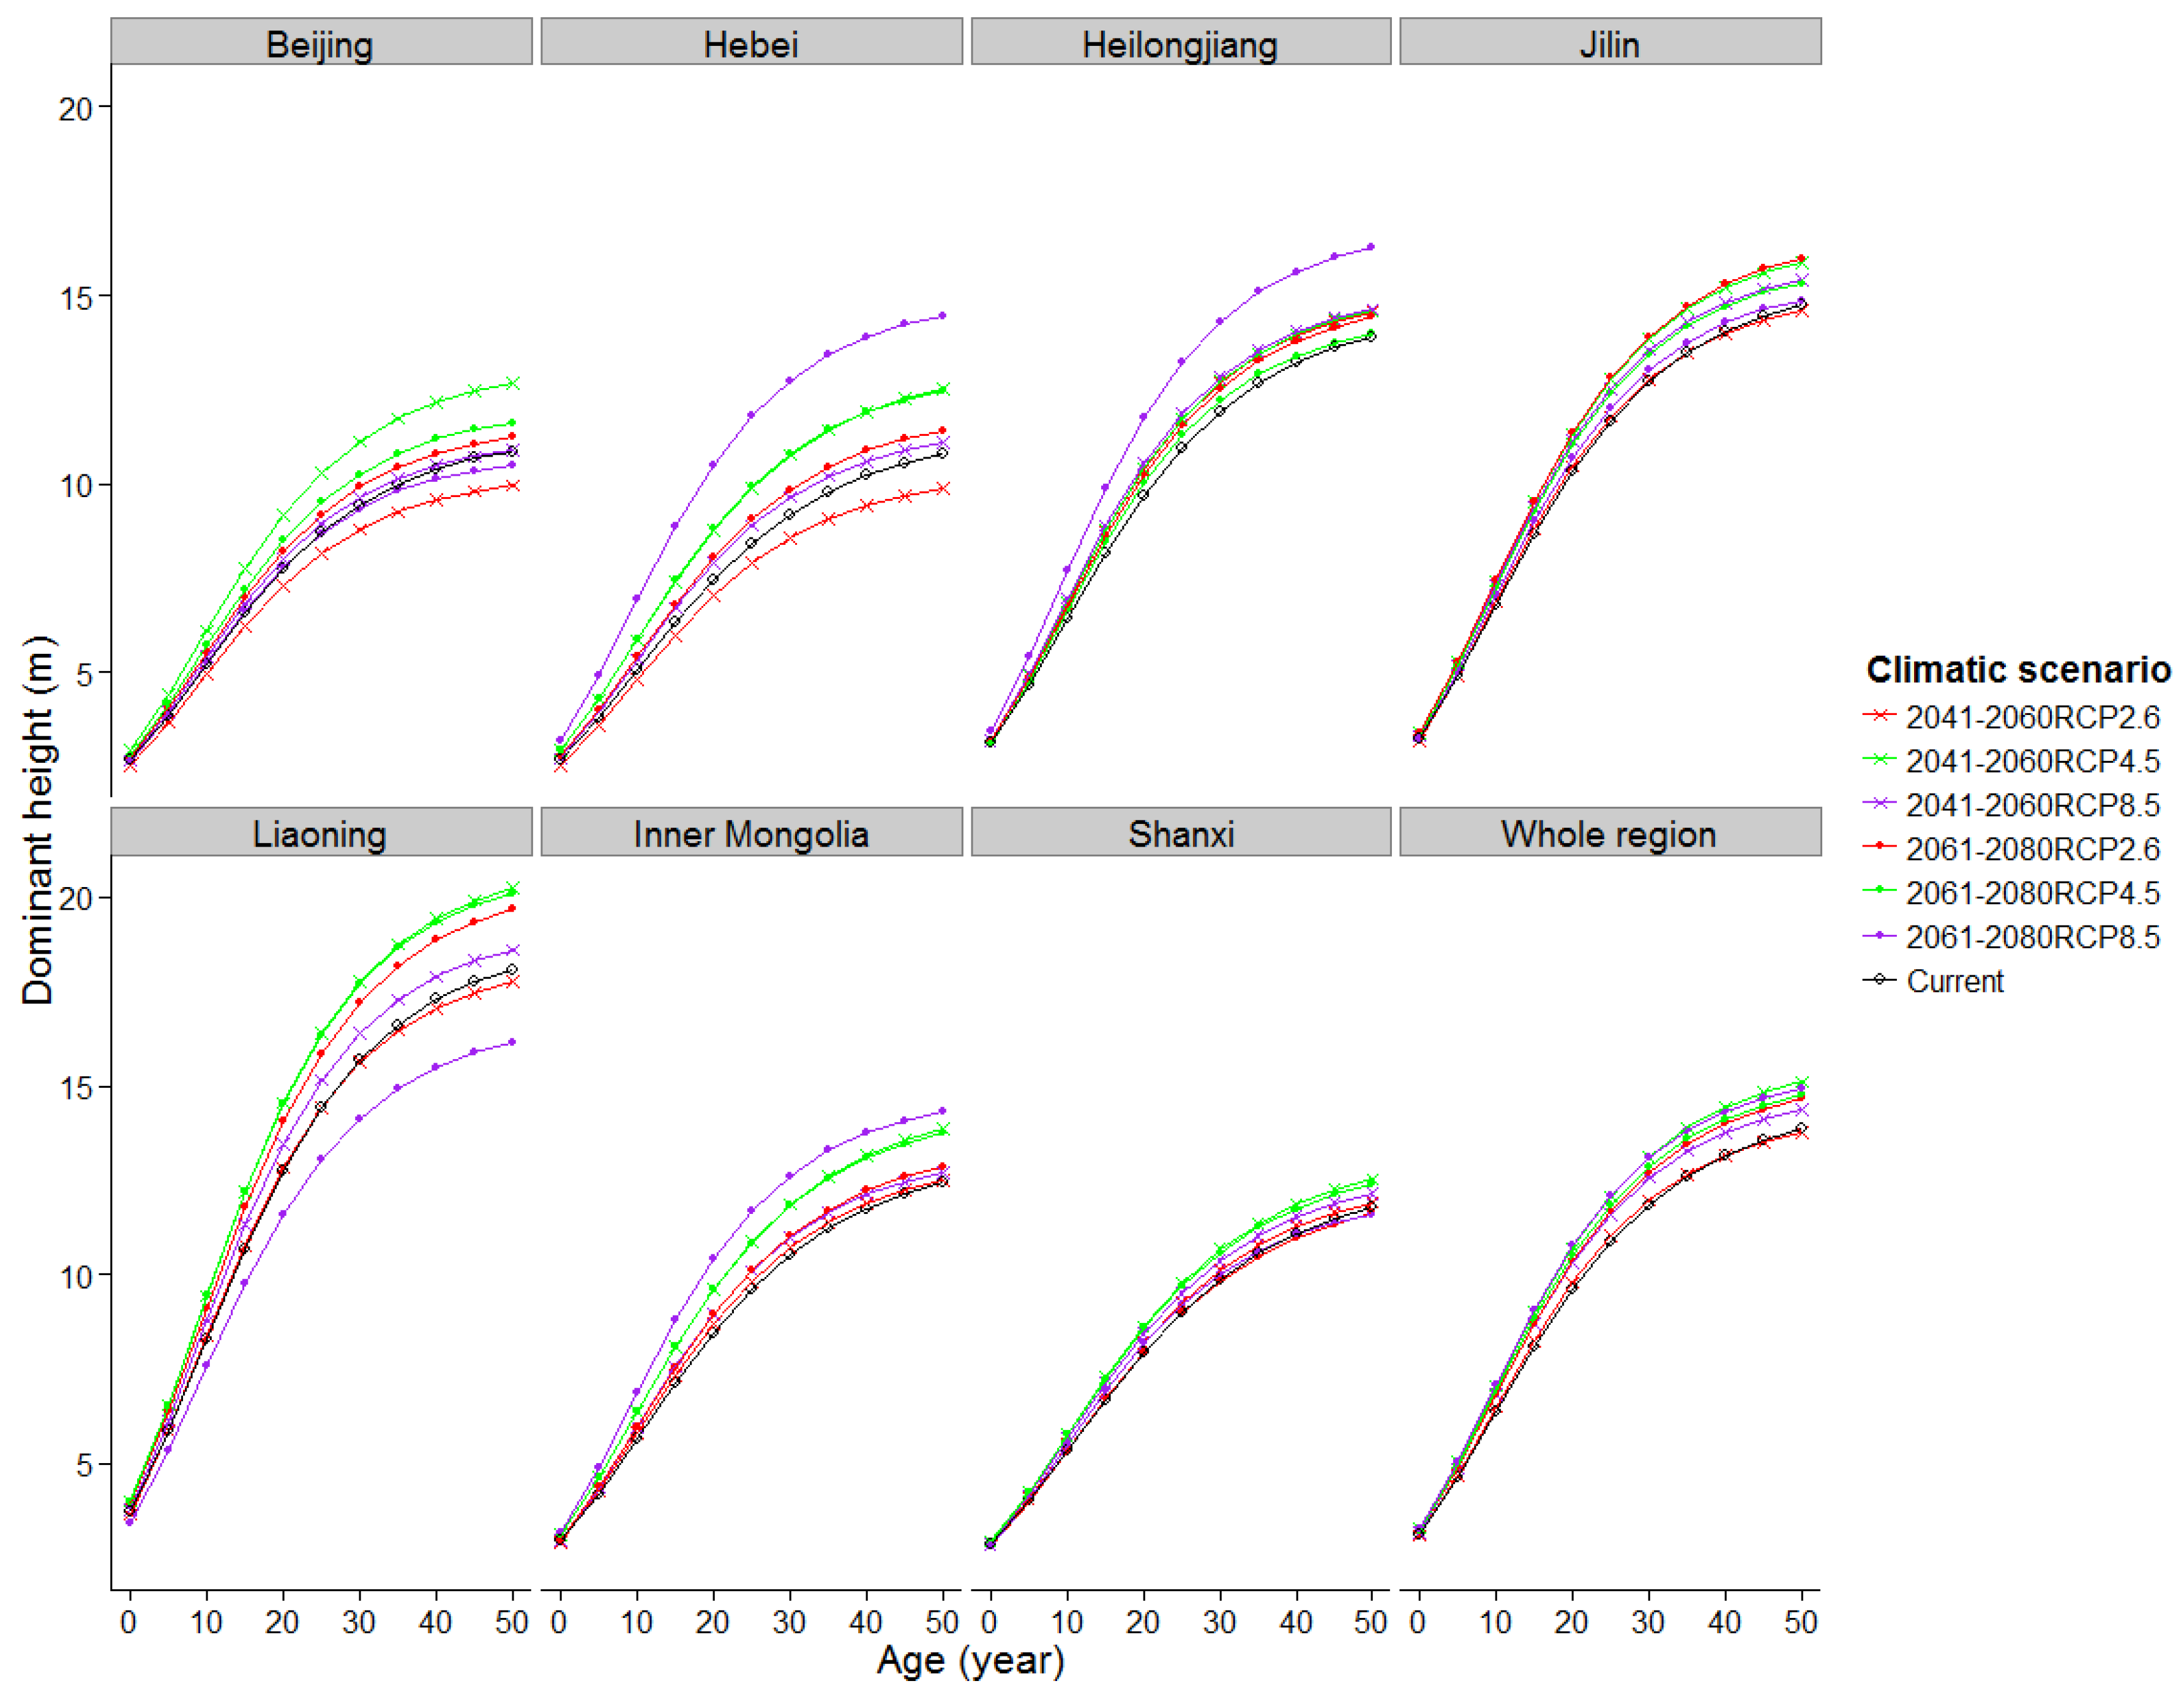
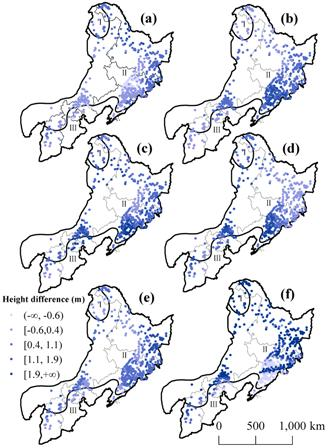
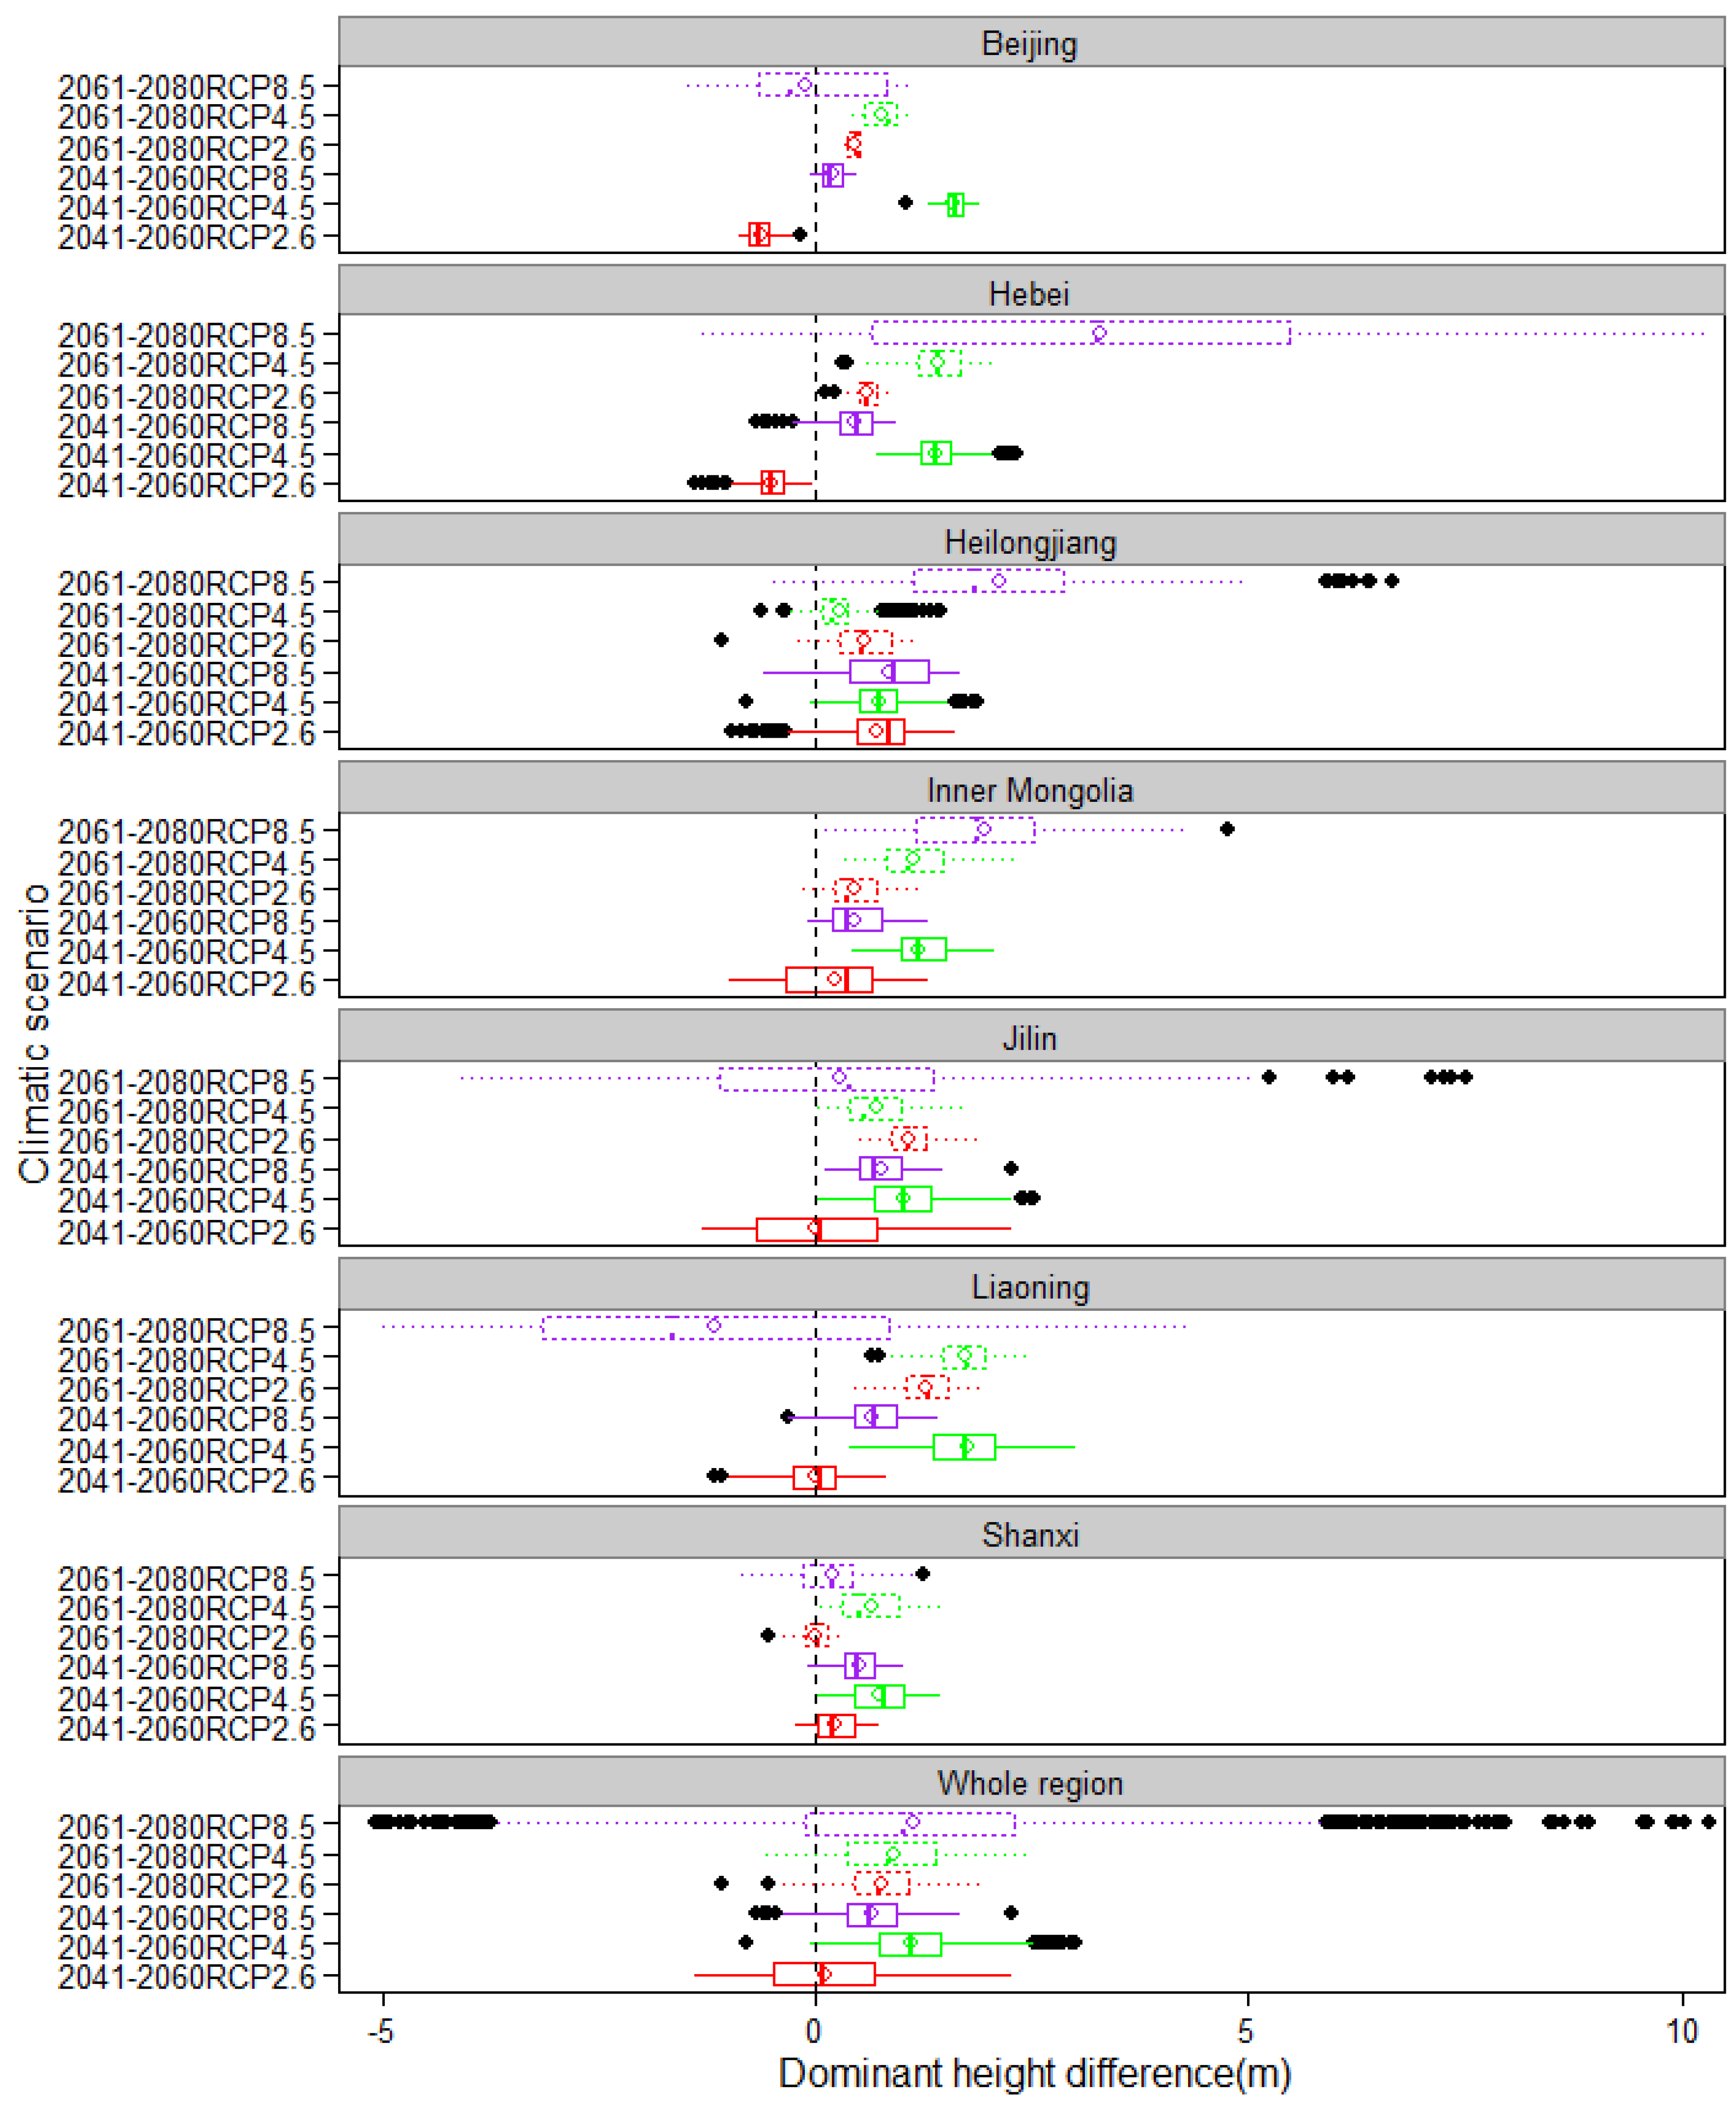
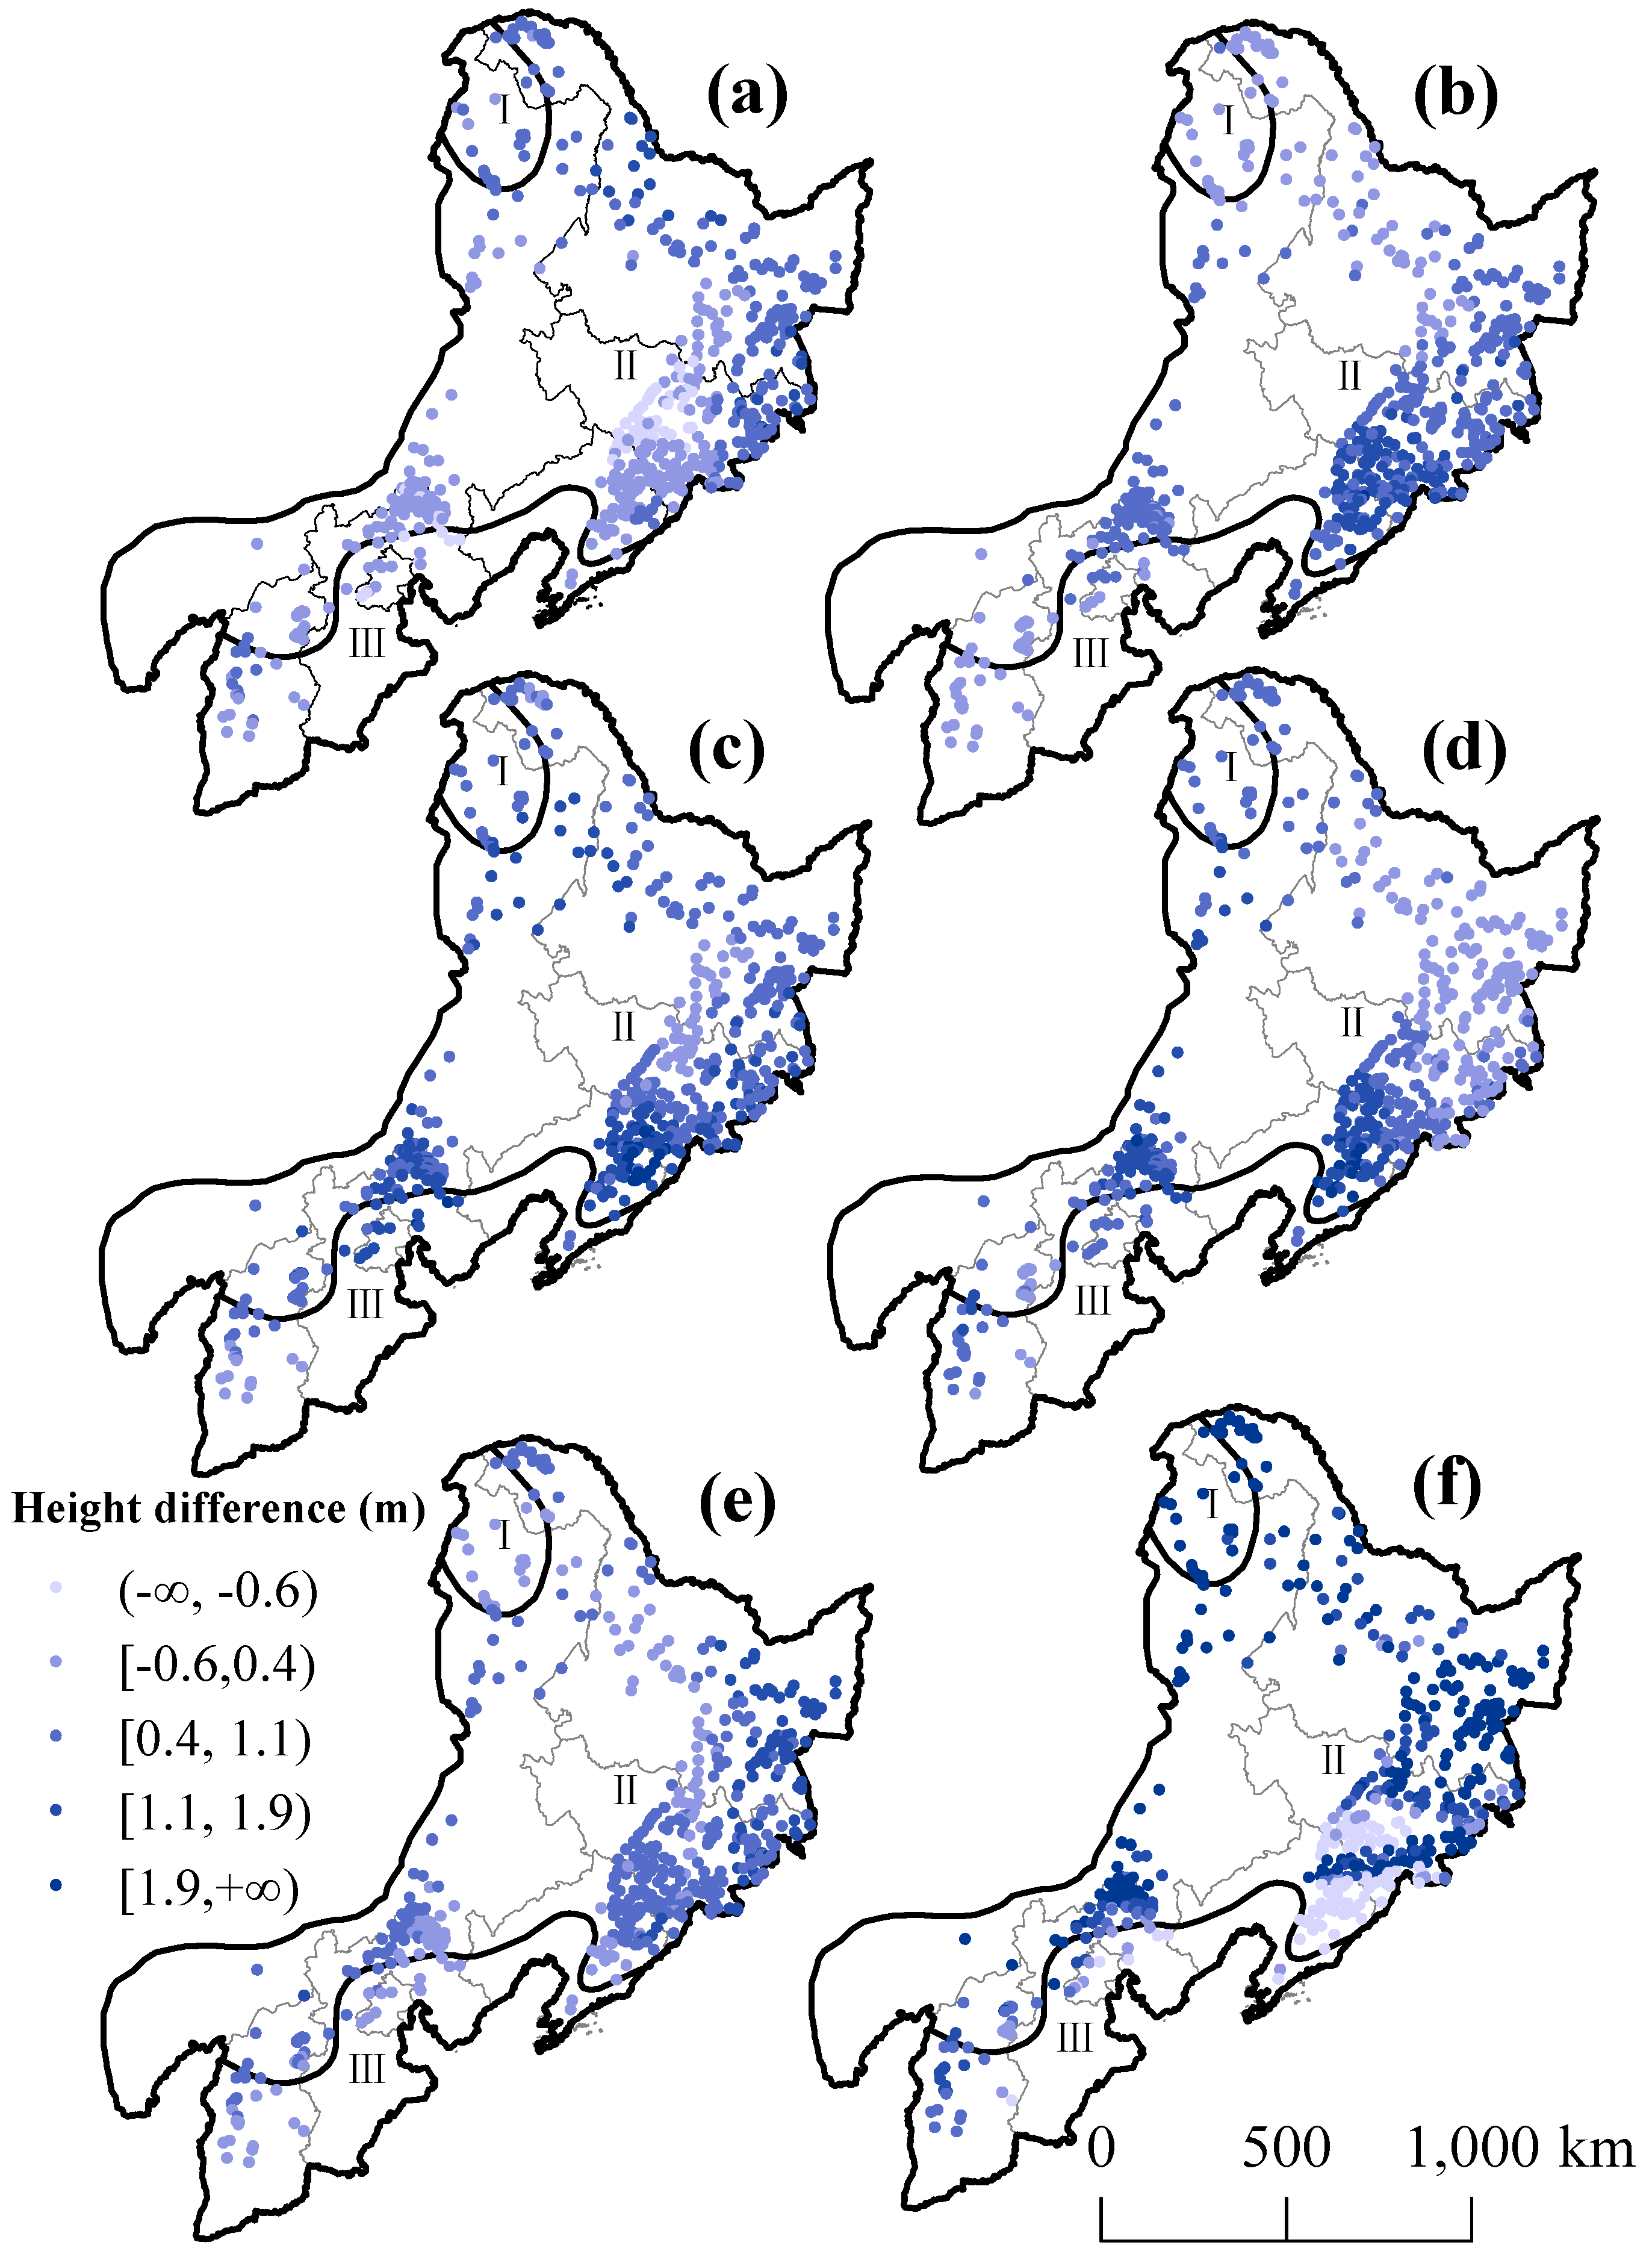
3.2.1. Growth Difference in Dominant Height across Different Provinces and Climate Zones under Future Climate Scenarios
3.2.2. Dominant Height Responses of Larch Plantations at Different Forest Stages to Climate Change
4. Discussion
4.1. Climate-Sensitive Dominant Height Growth Model
4.2. Projection of Dominant Height Growth under Future Climate Change
4.3. Management Implications for Larch Plantations
Supplementary Materials
Acknowledgments
Author Contributions
Conflicts of Interest
Abbreviations
| IPCC | Intergovernmental Panel on Climate Change |
| NFI | National forestry inventory |
| RCP | Representative concentration pathway |
| AIC | Akaike’s information criterion |
| Ra2 | Adjusted coefficient of determination |
| MAB | Mean absolute bias |
| RMSE | Root mean squared error |
| LL | Log-likelihood |
| VIF | Variance inflation factor |
| TWQ | Mean temperature of wettest quarter |
| PWM | Precipitation of wettest month |
References
- IPCC. Climate change 2014: Synthesis report. In Contribution of Working Groups I, II and III to the Fifth Assessment Report of the Intergovernmental Panel on Climate Change; Core Writing Team, Pachauri, R.K., Meyer, L.A., Eds.; IPCC: Geneva, Switzerland, 2014; p. 151. [Google Scholar]
- Toledo, M.; Poorter, L.; Peña-Claros, M.; Alarcón, A.; Balcázar, J.; Leaño, C.; Licona, J.C.; Llanque, O.; Vroomans, V.; Zuidema, P.; et al. Climate is a stronger driver of tree and forest growth rates than soil and disturbance. J. Ecol. 2011, 99, 254–264. [Google Scholar] [CrossRef]
- Nemani, R.R.; Keeling, C.D.; Hashimoto, H.; Jolly, W.M.; Piper, S.C.; Tucker, C.J.; Myneni, R.B.; Running, S.W. Climate driven increases in global terrestrial net primary production from 1982 to 1999. Science 2003, 300, 1560–1563. [Google Scholar] [CrossRef] [PubMed]
- Khaine, I.; Woo, S.Y. An overview of interrelationship between climate change and forests. For. Sci. Technol. 2015, 11, 11–18. [Google Scholar] [CrossRef]
- Bošeľa, M.; Máliš, F.; Kulla, L.; Šebeň, V.; Deckmyn, G. Ecologically based height growth model and derived raster maps of Norway spruce site index in the Western Carpathians. Eur. J. For. Res. 2013, 132, 691–705. [Google Scholar] [CrossRef]
- Sharma, R.P.; Brunner, A.; Eid, T.; Øyen, B.-H. Modelling dominant height growth from national forest inventory individual tree data with short time series and large age errors. For. Ecol. Manag. 2011, 262, 2162–2175. [Google Scholar] [CrossRef]
- Skovsgaard, J.P.; Vanclay, J.K. Forest site productivity: A review of the evolution of dendrometric concepts for even-aged stands. Forestry 2008, 81, 13–31. [Google Scholar] [CrossRef]
- Calama, R.; Montero, G. Interregional nonlinear height-diameter model with random coefficients for stone pine in Spain. Can. J. For. Res. 2004, 34, 150–163. [Google Scholar] [CrossRef]
- Gómez-García, E.; Fonseca, T.F.; Crecente-Campo, F.; Almeida, L.R.; Diéguez-Aranda, U.; Huang, S.; Marques, C.P. Height-diameter models for maritime pine in Portugal: A comparison of basic, generalized and mixed-effects models. iForest 2015, 9, 72–78. [Google Scholar] [CrossRef]
- Paulo, J.A.; Tomé, J.; Tomé, M. Nonlinear fixed and random generalized height-diameter models for Portuguese cork oak stands. Ann. For. Sci. 2011, 68, 295–309. [Google Scholar] [CrossRef]
- Soares, P.; Tomé, M. A tree crown ratio prediction equation for eucalypt plantations. Ann. For. Sci. 2001, 58, 193–202. [Google Scholar] [CrossRef]
- Cao, Q.V. Predicting parameters of a Weibull function for modeling diameter distribution. For. Sci. 2004, 50, 682–685. [Google Scholar]
- Newton, P.F.; Lei, Y.; Zhang, S.Y. Stand-level diameter distribution yield model for black spruce plantations. For. Ecol. Manag. 2005, 209, 181–192. [Google Scholar] [CrossRef]
- Adame, P.; del Río, M.; Cañellas, I. Modeling individual-tree mortality in Pyrenean oak (Quercus pyrenaica Willd.) stands. Ann. For. Sci. 2010, 67, 810. [Google Scholar] [CrossRef]
- Crecente-Campo, F.; Marshall, P.; Rodríguez-Soalleiro, R. Modeling non-catastrophic individual-tree mortality for Pinus radiata plantations in northwestern Spain. For. Ecol. Manag. 2009, 257, 1542–1550. [Google Scholar] [CrossRef]
- Crecente-Campo, F.; Marshall, P.; Rodríguez-Soalleiro, R. Modelling annual individual-tree growth and mortality of Scots pine with data obtained at irregular measurement intervals and containing missing observations. For. Ecol. Manag. 2010, 260, 1965–1974. [Google Scholar] [CrossRef]
- De-Miguel, S.; Guzmán, G.; Pukkala, T. A comparison of fixed- and mixed-effects modeling in tree growth and yield prediction of an indigenous neotropical species (Centrolobium tomentosum) in a plantation system. For. Ecol. Manag. 2013, 291, 249–258. [Google Scholar] [CrossRef]
- Pienaar, L.V.; Shiver, B.D. Basal area prediction and projection equations for pine plantations. For. Sci. 1986, 32, 626–633. [Google Scholar]
- Zhao, L.; Li, C. Stand basal area model for Cunninghamia lanceolata (Lamb.) Hook. plantations based on a multilevel nonlinear mixed-effect model across south-eastern China. South For. 2013, 75, 41–50. [Google Scholar]
- Fang, Z.; Bailey, R.L.; Shiver, B.D. A multivariate simultaneous prediction system for stand growth and yield with fixed and random effects. For. Sci 2001, 47, 550–562. [Google Scholar]
- Hall, D.B.; Clutter, M. Multivariate multilevel nonlinear mixed effects models for timber yield predictions. Biometrics 2004, 60, 16–24. [Google Scholar] [CrossRef] [PubMed]
- Wang, Y.; LeMay, V.M.; Baker, T.G. Modelling and prediction of dominant height and site index of Eucalyptus globulus plantations using a nonlinear mixed-effects model approach. Can. J. For. Res. 2007, 37, 1390–1403. [Google Scholar] [CrossRef]
- Bravo-Oviedo, A.; Tomé, M.; Bravo, F.; Montero, G.; del Río, M. Dominant height growth equations including site attributes in the generalized algebraic difference approach. Can. J. For. Res. 2008, 38, 2348–2358. [Google Scholar] [CrossRef]
- Sharma, M.; Subedi, N.; Ter-Mikaelian, M.; Parton, J. Modeling climatic effects on stand height/site index of plantation-grown jack pine and black spruce trees. For. Sci. 2015, 61, 25–34. [Google Scholar] [CrossRef]
- Aertsen, W.; Kint, V.; De Vos, B.; Deckers, J.; Van Orshoven, J.; Muys, B. Predicting forest site productivity in temperate lowland from forest floor, soil and litterfall characteristics using boosted regression trees. Plant Soil 2012, 354, 157–172. [Google Scholar] [CrossRef]
- Jiang, H.; Radtke, P.J.; Weiskittel, A.R.; Coulston, J.W.; Guertin, P.J. Climate- and soil-based models of site productivity in eastern US tree species. Can. J. For. Res. 2015, 45, 325–342. [Google Scholar] [CrossRef]
- McKenney, D.W.; Pedlar, J.H. Spatial models of site index based on climate and soil properties for two boreal tree species in Ontario, Canada. For. Ecol. Manag. 2003, 175, 497–507. [Google Scholar] [CrossRef]
- State Forestry Administration, The People’s Republic of China. National Forest Resources Statistics (2009–2013); State Forestry Administration: Beijing, China, 2014; p. 233. (In Chinese) [Google Scholar]
- Cook, E.R.; Kairiukstis, L.A. Methods of Dendrochronology: Applications in the Environmental Sciences; Kluwer Academic Publishers: Dordrecht, The Netherlands, 1989; pp. 25–26. [Google Scholar]
- Shen, C.; Lei, X.; Liu, H.; Wang, L.; Liang, W. Potential impacts of regional climate change on site productivity of Larix olgensis plantations in northeast China. iForest 2015, 8, 642–651. [Google Scholar] [CrossRef]
- Parks, C.G.; Bernier, P. Adaptation of forests and forest management to changing climate with emphasis on forest health: A review of science, policies and practices. For. Ecol. Manag. 2010, 259, 657–659. [Google Scholar] [CrossRef]
- Zang, H.; Lei, X.; Zeng, W. Height-diameter equations for larch plantations in northern and northeastern China: A comparison of the mixed effects, quantile regression and generalized additive models. Forestry 2016. [Google Scholar] [CrossRef]
- WorldClim-Global Climate Data. Available online: http://www.worldclim.org (accessed on 3 July 2016).
- Hijmans, R.J.; Cameron, S.E.; Parra, J.L.; Jones, P.G.; Jarvis, A. Very high resolution interpolated climate surfaces for global land areas. Int. J. Climatol. 2005, 25, 1965–1978. [Google Scholar] [CrossRef]
- Moss, R.; Babiker, M.; Brinkman, S.; Calvo, E.; Carter, T.; Edmonds, J.; Elgizouli, I.; Emori, S.; Erda, L.; Hibbard, K.; et al. Towards New Scenarios for Analysis of Emissions, Climate Change, Impacts, and Response Strategies; Intergovernmental Panel on Climate Change: Noordwijkerhout, The Netherlands, 2008; p. 14. [Google Scholar]
- Van Vuuren, D.P.; Edmonds, J.; Kainuma, M.; Riahi, K.; Thomson, A.; Hibbard, K.; Hurtt, G.C.; Kram, T.; Krey, V.; Lamarque, J.F.; et al. The representative concentration pathways: An overview. Clim. Chang. 2011, 109, 5–31. [Google Scholar] [CrossRef]
- Shangguan, W.; Dai, Y.; Liu, B.; Zhu, A.; Duan, Q.; Wu, L.; Ji, D.; Ye, A.; Yuan, H.; Zhang, Q.; et al. A China dataset of soil properties for land surface modeling. J. Adv. Model. Earth Syst. 2013, 5, 212–224. [Google Scholar] [CrossRef]
- Shangguan, W.; Dai, Y.; Liu, B.; Ye, A.; Yuan, H. A soil particle-size distribution dataset for regional land and climate modeling in China. Geoderma 2012, 171–172, 85–91. [Google Scholar] [CrossRef]
- Zeide, B. Analysis of growth equations. For. Sci. 1993, 39, 594–616. [Google Scholar]
- Johnson, J.W. A heuristic method for estimating the relative weight of predictor variables in multiple regression. Multivar. Behav. Res. 2000, 35, 1–19. [Google Scholar] [CrossRef] [PubMed]
- Yang, Y.; Huang, S.; Meng, S.X.; Trincado, G.; VanderSchaaf, C.L. A multilevel individual tree basal area increment model for aspen in boreal mixed wood stands. Can. J. For. Res. 2009, 39, 2203–2214. [Google Scholar] [CrossRef]
- Lindstrom, M.J.; Bates, D.M. Nonlinear mixed effects models for repeated measures data. Biometrics 1990, 46, 673–687. [Google Scholar] [CrossRef] [PubMed]
- Vonesh, E.F.; Chinchilli, V.M. Linear and Nonlinear Models for the Analysis of Repeated Measurements; Marcel Dekker: New York, NY, USA, 1997; p. 343. [Google Scholar]
- R Development Core Team. R: A Language and Environment for Statistical Computing; R Foundation for Statistical Computing: Vienna, Austria, 2015; Available online: http://www.r-project.org (accessed on 12 January 2016).
- Pinheiro, J.C.; Bates, D.M.; Debroy, S.; Sarkar, D.; EISPACK authors; R Core Team. Nlme: Linear and Nonlinear Mixed Effects Models; R Package Version 3.1–102; Available online: http://www.cran.r-project.org/web/packages/nlme/nlme.pdf (accessed on 12 January 2016).
- Nothdurft, A.; Wolf, T.; Ringeler, A.; Bohner, J.; Saborowski, J. Spatio-temporal prediction of site index based on forest inventories and climate change scenarios. For. Ecol. Manag. 2012, 279, 97–111. [Google Scholar] [CrossRef]
- Dulamsuren, C.; Hauck, M.; Bader, M.; Osokhjarga, D.; Oyungere, S.; Nyambayar, S.; Runge, M.; Leuschner, C. Water relations and photosynthetic performance in Larix sibirica growing in the forest-steppe ecotone of northern Mongolia. Tree Physiol. 2009, 29, 99–110. [Google Scholar] [CrossRef] [PubMed]
- Panyushkina, I.P.; Ovtchinnikov, D.V.; Adamenko, M.F. Mixed response of decadal variability in larch tree-ring chronologies from upper tree-lines of the Russian Altai. Tree-Ring Res. 2005, 61, 33–42. [Google Scholar] [CrossRef]
- Zhang, X.; He, X.; Li, J.; Davi, N.; Chen, Z.; Cui, M.; Chen, W.; Li, N. Temperature reconstruction (1750–2008) from Dahurian larch tree-rings in an area subject to permafrost in Inner Mongolia, Northeast China. Clim. Res. 2011, 47, 151–159. [Google Scholar] [CrossRef]
- Clark, D.A.; Piper, S.C.; Keeling, C.D.; Clark, D.B. Tropical rain forest tree growth and atmospheric carbon dynamics linked to inter-annual temperature variation during 1984–2000. Proc. Natl. Acad. Sci. USA 2003, 100, 5852–5857. [Google Scholar] [CrossRef] [PubMed]
- Clark, D.B.; Clark, D.B.; Oberbauer, S.F. Annual wood production in a tropical rain forest in NE Costa Rica linked to climatic variation but not to increasing CO2. Glob. Chang. Biol. 2010, 16, 747–759. [Google Scholar] [CrossRef]
- Fang, Z.; Bailey, R.L. Nonlinear mixed effects modeling for slash pine dominant height growth following intensive silvicultural treatments. For. Sci. 2001, 47, 287–300. [Google Scholar]
- Bergès, L.; Balandier, P. Revisiting the use of soil water budget assessment to predict site productivity of sessile oak (Quercus petraea Liebl.) in the perspective of climate change. Eur. J. For. Res. 2010, 129, 199–208. [Google Scholar] [CrossRef]
- Seynave, I.; Gégout, J.-C.; Hervé, J.-C.; Dhôte, J.-F.; Drapier, J.; Bruno, É.; Dumé, G. Picea abies site index prediction by environmental factors and understorey vegetation: A two-scale approach based on survey databases. Can. J. For. Res. 2005, 35, 1669–1678. [Google Scholar] [CrossRef]
- Albert, M.; Schmidt, M. Climatic-sensitive modeling of site-productivity relationships for Norway spruce (Picea abies (L.) Karst.) and common beech (Fagus sylvatica L.). For. Ecol. Manag. 2010, 259, 739–749. [Google Scholar] [CrossRef]
- Bravo-Oviedo, A.; Gallardo-Andrés, C.; del Río, M.; Montero, G. Regional changes of Pinus pinaster site index in Spain using a climate-based dominant height model. Can. J. For. Res. 2010, 40, 2036–2048. [Google Scholar] [CrossRef]
- Weiskittel, A.R.; Crookston, N.L.; Radtke, P.J. Linking climate, gross primary productivity and site index across forests of the western United States. Can. J. For. Res. 2011, 41, 1710–1721. [Google Scholar] [CrossRef]


| Data | Province | Number of Plots | H (m) | Age (Years) | N (Trees·ha−1) | BA (m2·ha−1) | ||||
|---|---|---|---|---|---|---|---|---|---|---|
| Mean | SD | Mean | SD | Mean | SD | Mean | SD | |||
| Fitting data | Beijing | 9 | 8.6 | 1.3 | 28 | 9.6 | 641 | 440.6 | 8.5 | 9.3 |
| Hebei | 79 | 8.0 | 1.7 | 24 | 8.3 | 1141 | 665.8 | 11.8 | 8.9 | |
| Heilongjiang | 118 | 10.7 | 3.2 | 26 | 9.4 | 681 | 627.1 | 6.8 | 6.5 | |
| Jilin | 149 | 11.4 | 3.1 | 26 | 10.0 | 1113 | 712.0 | 11.6 | 6.7 | |
| Liaoning | 59 | 13.3 | 3.1 | 24 | 10.1 | 989 | 534.0 | 13.8 | 8.3 | |
| Inner Mongolia | 44 | 9.3 | 2.5 | 25 | 8.1 | 1098 | 861.8 | 11.4 | 8.6 | |
| Shanxi | 37 | 8.6 | 2.0 | 24 | 8.8 | 1196 | 709.8 | 11.4 | 9.2 | |
| Validation data | Beijing | 1 | 10.9 | 0.5 | 40 | 5.0 | 1439 | 54.1 | 31.4 | 5.7 |
| Hebei | 6 | 8.3 | 1.4 | 25 | 9.0 | 1483 | 726.9 | 15.2 | 8.0 | |
| Heilongjiang | 15 | 10.0 | 3.0 | 28 | 8.6 | 567 | 599.7 | 5.0 | 5.4 | |
| Jilin | 15 | 12.6 | 2.8 | 29 | 10.2 | 1290 | 535.1 | 15.8 | 6.3 | |
| Liaoning | 9 | 11.9 | 2.3 | 17 | 4.7 | 1445 | 560.4 | 12.7 | 6.2 | |
| Inner Mongolia | 6 | 9.1 | 2.8 | 24 | 9.5 | 893 | 647.3 | 8.1 | 5.3 | |
| Shanxi | 3 | 6.9 | 1.5 | 18 | 6.6 | 1062 | 532.6 | 6.3 | 4.0 | |
| Parameter | Equation (1) | Equation (7) | Equation (8) | |
|---|---|---|---|---|
| β0 | 31.2967 (9.116) | 8.8033 (1.1544) | 5.2349 (0.6426) | |
| β1 | 0.0715 (0.008) | 0.0483 (0.0038) | ||
| β2 | 2.0924 (0.2257) | 1.7909 (0.0548) | 1.9798 (0.0566) | |
| β3 | 0.0209 (0.0054) | 0.0162 (0.0036) | 0.0372 (0.0095) | |
| β4 | 0.0008 (0.0002) | 0.0019 (0.0005) | ||
| δb2 | 2.6132 | |||
| δ2 | 0.6894 | |||
| Fitting | Ra2 | 0.46 | 0.65 | 0.97 |
| AIC | 6099 | 5507 | 4247 | |
| MAB (m) | 1.92 | 1.47 | 0.37 | |
| RMSE (m) | 2.38 | 1.90 | 0.56 | |
| Validation | MAB (m) | 2.29 | 1.69 | 0.34 |
| RMSE (m) | 2.67 | 2.06 | 0.52 | |
| Period | Climate Scenario | TWQ | PWM | Dominant Height | |||||||||
|---|---|---|---|---|---|---|---|---|---|---|---|---|---|
| Mean | SD | ΔTWQ | ΔTWQ% | Mean | SD | ΔPWM | ΔPWM% | Mean | SD | ΔH | ΔH% | ||
| 1950–2000 | Current | 18.5 | 2.32 | 0.00 | 0.0% | 164.6 | 37.73 | 0.00 | 0.0% | 10.5 | 3.09 | 0.00 | 0.0% |
| 2041–2060 | RCP2.6 | 20.8 | 2.34 | 2.32 | 12.5% | 159.8 | 37.53 | −4.80 | −2.9% | 10.6 | 3.16 | 0.10 | 1.0% |
| RCP4.5 | 20.8 | 2.24 | 2.27 | 12.3% | 189.1 | 45.96 | 24.49 | 14.9% | 11.6 | 3.28 | 1.11 | 11.1% | |
| RCP8.5 | 21.8 | 2.24 | 3.23 | 17.5% | 172.1 | 38.52 | 7.50 | 4.6% | 11.1 | 3.22 | 0.65 | 6.4% | |
| 2061–2080 | RCP2.6 | 20.4 | 2.29 | 1.84 | 10.0% | 179.9 | 47.67 | 15.36 | 9.3% | 11.2 | 3.38 | 0.76 | 7.1% |
| RCP4.5 | 21.4 | 2.34 | 2.88 | 15.5% | 180.6 | 45.92 | 16.04 | 9.8% | 11.4 | 3.21 | 0.89 | 9.1% | |
| RCP8.5 | 22.5 | 2.16 | 3.96 | 21.4% | 182.8 | 46.79 | 18.19 | 11.1% | 11.6 | 3.42 | 1.13 | 13.3% | |
| Period | Climate Scenarios | Statistics | Young Forest | Middle-Aged Forest | Pre-Mature Forest | Mature Forest |
|---|---|---|---|---|---|---|
| 2041–2060 | RCP2.6 | ΔH (m) | 0.19 | 0.14 | −0.08 | 0.01 |
| ΔH % | 2.0% | 1.1% | −0.6% | −0.1% | ||
| RCP4.5 | ΔH (m) | 0.98 | 1.17 | 1.18 | 1.32 | |
| ΔH % | 11.9% | 11.4% | 9.9% | 9.7% | ||
| RCP8.5 | ΔH (m) | 0.58 | 0.70 | 0.68 | 0.69 | |
| ΔH % | 7.0% | 6.7% | 5.5% | 4.8% | ||
| 2061–2080 | RCP2.6 | ΔH (m) | 0.62 | 0.77 | 0.90 | 0.97 |
| ΔH % | 7.3% | 7.1% | 7.0% | 6.5% | ||
| RCP4.5 | ΔH (m) | 0.84 | 0.95 | 0.92 | 0.80 | |
| ΔH % | 10.4% | 9.4% | 7.6% | 5.9% | ||
| RCP8.5 | ΔH (m) | 0.94 | 1.27 | 1.34 | 0.80 | |
| ΔH % | 13.7% | 14.4% | 12.8% | 7.1% |
© 2016 by the authors; licensee MDPI, Basel, Switzerland. This article is an open access article distributed under the terms and conditions of the Creative Commons Attribution (CC-BY) license (http://creativecommons.org/licenses/by/4.0/).
Share and Cite
Zang, H.; Lei, X.; Ma, W.; Zeng, W. Spatial Heterogeneity of Climate Change Effects on Dominant Height of Larch Plantations in Northern and Northeastern China. Forests 2016, 7, 151. https://doi.org/10.3390/f7070151
Zang H, Lei X, Ma W, Zeng W. Spatial Heterogeneity of Climate Change Effects on Dominant Height of Larch Plantations in Northern and Northeastern China. Forests. 2016; 7(7):151. https://doi.org/10.3390/f7070151
Chicago/Turabian StyleZang, Hao, Xiangdong Lei, Wu Ma, and Weisheng Zeng. 2016. "Spatial Heterogeneity of Climate Change Effects on Dominant Height of Larch Plantations in Northern and Northeastern China" Forests 7, no. 7: 151. https://doi.org/10.3390/f7070151