1. Introduction
In recent years, specialty license plates have become a popular way to raise public awareness and show of support for a multitude of causes or issues with which the plate is linked. The plates also provide a powerful tool for individuals or groups to express their affinity for a particular subject matter to relay that message to others, and to provide a revenue source to the issues or causes that the motorist has chosen to display For example, Alabama’s “forest forever” plate generates net revenues ($41.25 per plate) by sales of this license plate, which are distributed to the Alabama Forests Forever Foundation. That foundation expends the proceeds for management and education of the public on forestry’s importance. The $50 additional fee represents a charitable contribution from the purchaser to the Alabama Forests Forever Foundation. These plates seldom face political challenges because they are purchased on a voluntary basis. Natural resources-related plates have been politically favorable and have been popular for motorists to purchase. Forestry-based specialty license plates are used to help underwrite educational programs that directly benefit trees [
1].
Understanding the factors that influence unit sales of forestry-related specialty plates can help us understand how many people are actively willing to show their support for forestry practices and organizations. For example, forestry organizations like Alabama Forest Forever Foundation, Alabama Treasure Forest Association (The Alabama TREASURE Forest Association (ATFA) is an organization of stewardship-minded men and women dedicated to improving the forest land of Alabama. Our forests are managed in a way to ensure the next generation will enjoy the same benefits we receive today), Mississippi Forestry Association, International Society of Arboculture (Florida Chapter), Trees South Carolina (Trees SC is a collaboration of individuals, organizations, and agencies dedicated to our state’s trees. Together, we work to foster the stewardship of South Carolina’s urban and community forests through education, advocacy, and networking), and Texas Urban Forestry Council sponsor special license plates that are approved by the Department of Revenue and issued by each state’s Department of Motor Vehicles. These organizations promote professional management of forest and associated resources and help increase awareness about the services forests perform to our environment and economy.
These specialty plates, when sold, generate revenues for their respective provider and/or designer organizations [
2]. Therefore, if sales of these plates can be increased, it can increase the revenue of their respective forestry-based organizations. Another way of generating increased revenue is increasing the price of those specialty plates, but doing so may not be feasible since the specialty license plate prices are already higher than those of regular plates. Furthermore, increasing the price of specialty plates individually (which is issue-specific) may also be difficult legislatively because there are so many interest groups actively involved in administering various specialty plates. Therefore, increasing revenue is likely more easily done by increasing unit sales; in order to do so, identification and knowledge of factors that influence the sales of forestry-related specialty plates is necessary.
The Southern United States is rich in forests and active in forestry practices, and this study was conducted to explore forestry specialty license plate sales in states (Alabama, Florida, Mississippi, South Carolina, and Texas) within this region that had relatively well-established forestry license plate programs and accessible records associated with their sales. Approximately 68% of Alabama, 50% of Florida, 65% of Mississippi, 68% of South Carolina, and 37% of Texas is designated as timberland [
3,
4,
5,
6,
7]. The forest products industries in these states employee 34,655, 25,934, 19,240, 25,727, 45,266 in Alabama, Florida, Mississippi, South Carolina, and Texas job market respectively [
8]. In this study, the number of specialty plates sold in the “Alabama Forest Forever” and “I’d Rather be in the Woods”, “Trees are Cool”, “First in Forestry”, “Trees SC” and “Texas Trees” in the counties of Alabama, Florida, Mississippi, South Carolina, and Texas, respectively.
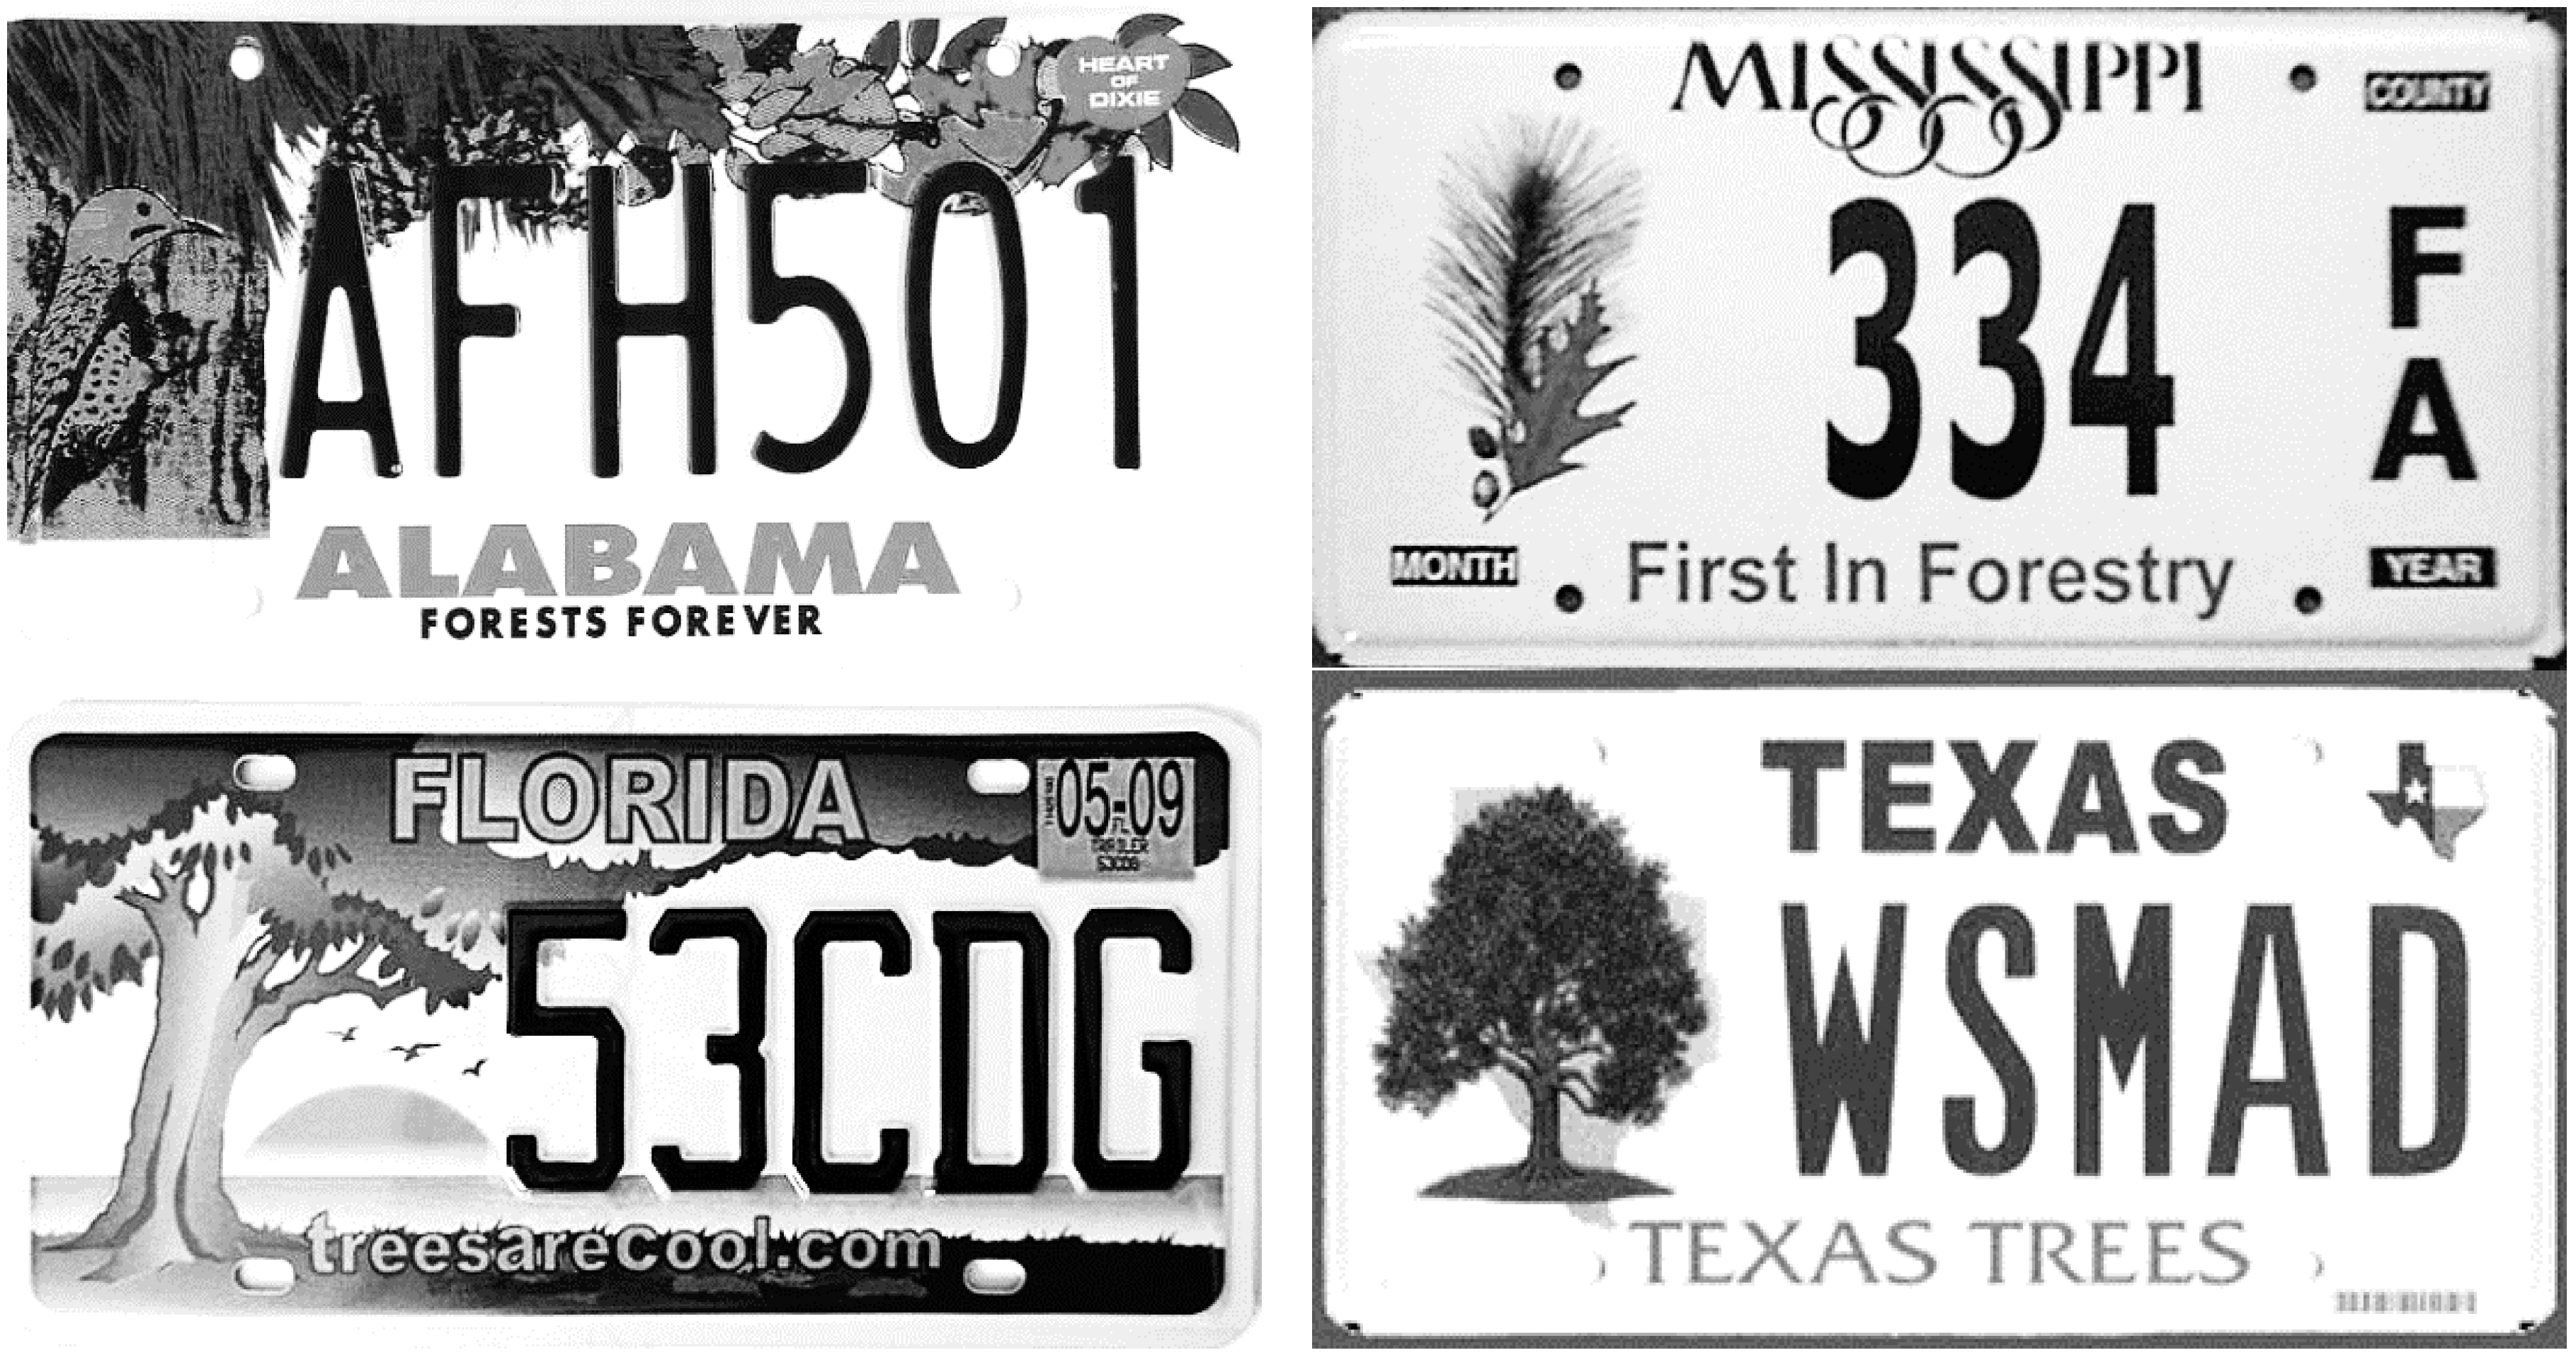
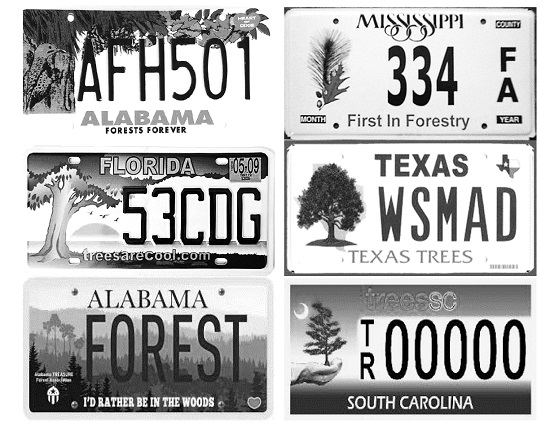
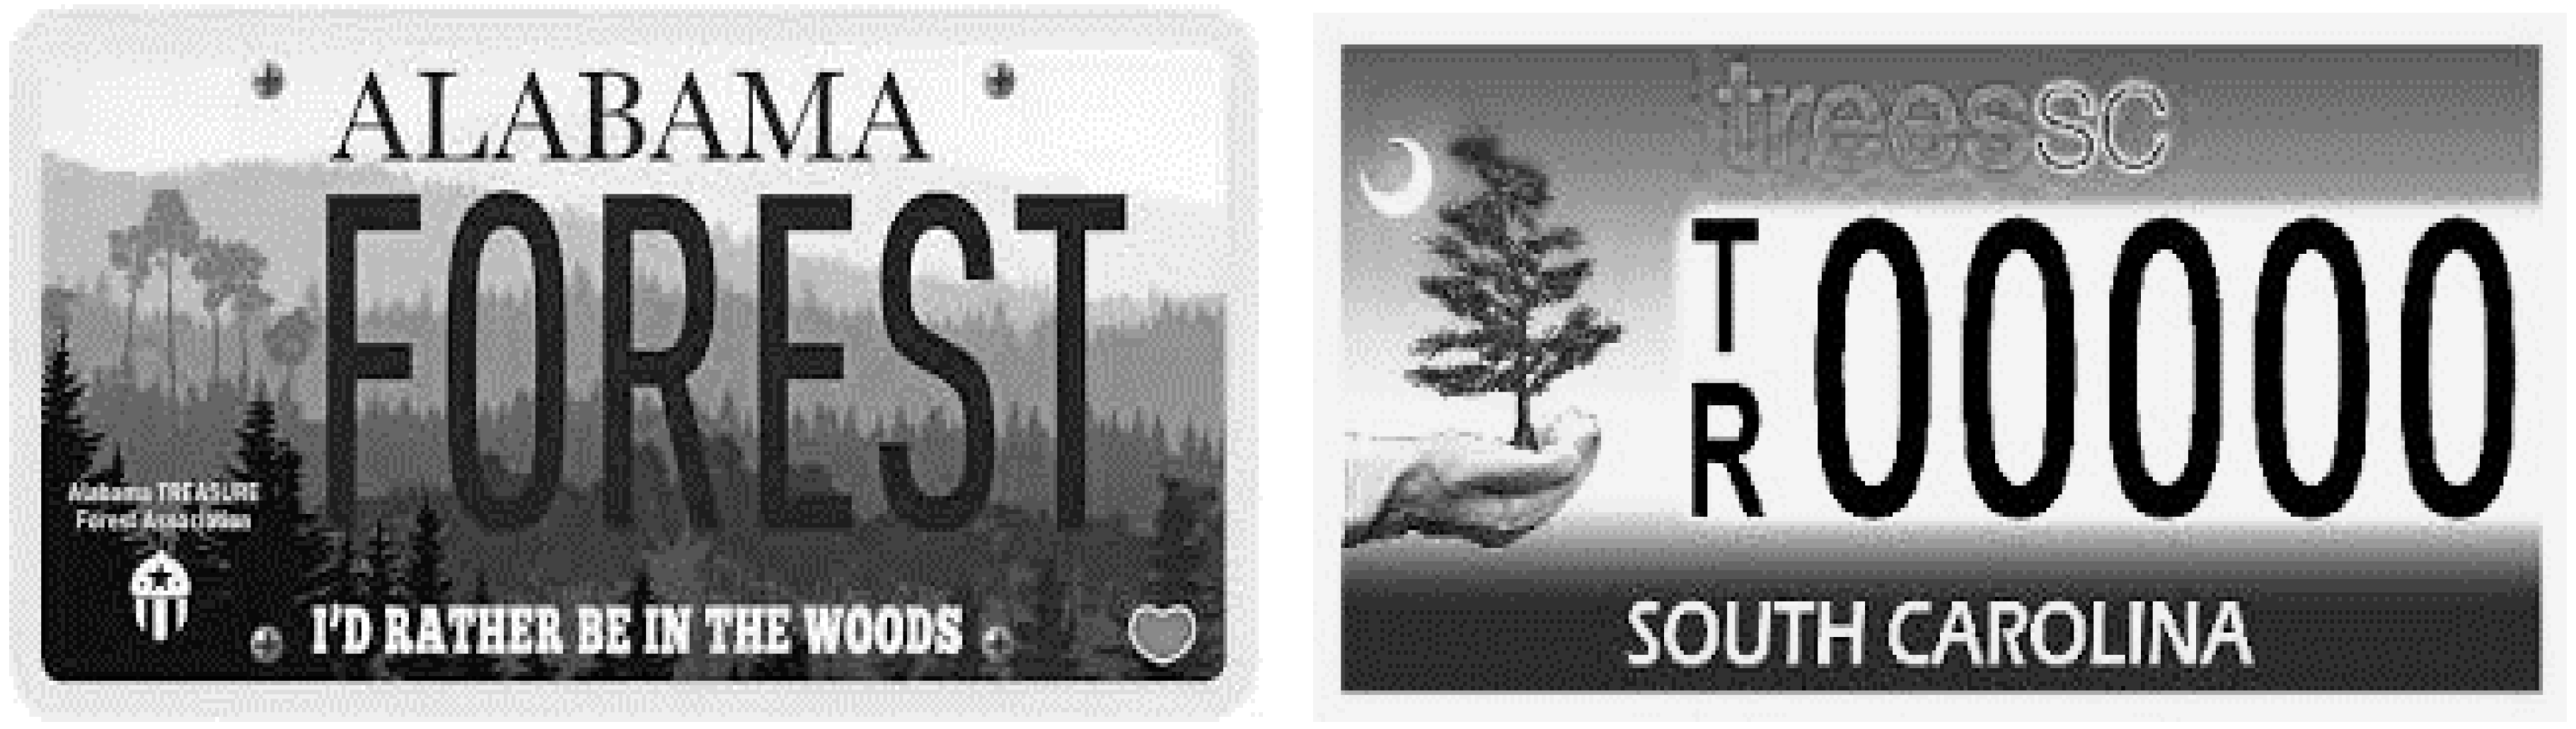
Figure 1 illustrates the respective plates. Data on demographic characteristics (population, housing unit, etc.), forestry employment, income information (income per capita, household median income, etc.), and percentage of forested land and private forestland were used to explain the purchases of forest-related license plates.
2. Literature Review
Previous studies on the topic of specialty plates have focused heavily on demand for personalized vanity license plates (The reader will see the words “vanity” plates and “specialty” plates in the manuscript. Vanity plates refer to personalized messages on the plate—names, clever phrases, etc. Specialty plates refer to the issue associated with the type of plate purchased—sports team, a particular college, etc.). These analyses used state-level data to estimate price elasticities for guidance in determining whether current vanity plate prices maximize revenues [
2,
9,
10]. The studies consistently found that vanity plate prices do not maximize revenues. The lone exception was Biddle [
11], who looked for evidence of bandwagon effects with respect to sales of personalized license plates. Swinton [
12] examined the own-price elasticity of demand for Florida’s Save the Manatee plate and found a generally positive relationship between sales of wildlife plates and income per capita. That study also found that sale of wildlife plates was strongly positively affected by the percentage of the population greater than 16 years old that engages in hunting and fishing. In a study of wildlife plates, it was observed that plate sales were positively correlated with the percent of individuals who engage in wildlife-related recreation [
13]. Their study also showed that the demand of wildlife plates was relatively insensitive to price and that sales were higher in the southern states than other states in USA.
To our knowledge, this study is the first attempt to empirically identify factors that influence sales of forestry license plates. The most similar research has been on the sales and demand predictors of wildlife-themed plates, and we draw on those studies to aid in empiricizing sales for forestry plates. The results presented in this study may be used to assist forestry and other natural resource advocacy groups with their marketing strategies and capture higher profits by anticipating or manipulating changes in the variables playing key roles in plate sales. There is anecdotal evidence to suggest this possibility. When one of the investigators of this study phoned the Alabama Treasure forest representative, the organizations representative requested that the results of this study be shared with their organization to better market their plates. Specialty plate sales can also be used to augment financial resources that the local, state, and federal policymakers disburse for the provision of natural resources, so there are policy implications with respect to our findings. We are specifically interested in whether the presence and/or relative importance of certain county characteristics and demographic factors within each county are correlated with forestry plate sales within that county. Prior studies of this nature have used state-level factors, which reflects the presence and/or relative importance of these demographic characteristics typically aggregated at the state level. We are unaware of any other study that examines plate sales and their determinants at the county level.
The conceptual model implied, based on the previous literature, is that the numbers of plates sold in a geographic area are a function of the county characteristics and demographic variables of that area (see Equation (1)):
where FLP is the forestry-based specialty license plates sold in a county in the period
t;
Xc
t is the characteristics of the county in the period
t, and
Yc
t is the characteristics of the population within that county in the period
t.
In this study, county-level data was collected for five states—Alabama, Florida, Mississippi, South Carolina, and Texas. County characteristics, Xct, were comprised of area of county, area in timber production and area in nonindustrial private forest within the county. Population characteristics, Yct were comprised of population size, number of housing units, income per capita, and median house income in those counties.
Specialty plates are considered to be a normal good, so the demand of plates is expected to increase with rising income per capita [
2,
11]. Further, higher incomes are associated with an increase in the consumption of environmental services [
14,
15,
16]. Household median income was initially considered, but later removed from the main model, due to correlation with income per capita. To compare these two parameters, we analyzed models with household median income instead of income per capita. Demand was also hypothesized to be higher with increasing population [
11]. We hypothesized that plate sales were positively correlated with the number of people that are able to buy the plates because with more people in an area, there would be more likely consumption of goods and services increases in that area. Relatedly, the number of housing units in the county was also considered.
Alper et al. [
2] suggested that for vanity plates demand goes down after a certain age. To test that, we added the percentage of people who are 65 or above to test that hypothesis. An additional justification for inclusion of this age group is that according to the National Woodland Owners Survey (NWOS), approximately 94% of non-industrial private forestland (NIPF) owners are 65 or older, so there could be a positive relationship in this case that runs counter to Alper’s findings.
Although demand is a decreasing function of price, price of the license plates were excluded since previous studies showed that price holds no influence over revenue [
2,
10,
11] or plate sales [
14]. Even though those studies were performed at the state level and in this study the unit of observation is county level data, we assumed that price has no influence over revenue.
Novel to our analysis, we included certain specific agriculture and natural resource variables at the county level to determine what, if any, effect it has on forestry plate sales. Initially we considered acres of timberland and acres of non-industrial private individual timberland; we felt that individuals in areas where timberland was prevalent may be more aware of aspects of forestry in their county, if not the state, but settled on the percentages of forest variables to mute any effects of overall county size.
Additionally, we tested whether the presence of the forest industry in the county (logging, wood products industries, pulp and paper industries) affected plate sales. The reasoning for testing the effects of this parameter was an expectation that as the number of people associated with forestry practices increases, purchases of forestry specialty plate sales increase. We added a variable to test the hypothesis that the number of people associated with forestry in the county has a positive effect over the plate sales. We proxy this effect with the number of mills and whether or not a mill was operational in the county in 2014.
3. Data and Methodology
Five southeastern states were included in this analysis due to data availability. Arkansas and Kentucky, to our knowledge, have not issued nor attempted to issue a forestry-focused specialty plate. Virginia (2012) and Tennessee (2009) attempted to issue plates but were not able to meet the state required minimum thresholds. Georgia has one that is not issued by any state agency but by their forestry commission, is only for use on the front of the vehicle, and is only available to commission members for $5.00. North Carolina has a forestry specialty plate, of which approximately 250 were issued in 2014, but it did not have county-level breakdowns for the data when the authors made requests to the Department of Motor vehicles for that state (Oklahoma was unable to provide county level breakdowns of the data as well, but do issue a forestry related plate) (Louisiana also has a forestry license plate that was first issued in February of 2013, but the authors have been unable to get inquires about statistics returned, despite assurances that the data is accessible, as of publication of this document). We also found that Alabama has two plates issued by forestry organizations, both of which are included in this study (Alabama forests forever plate and the Alabama treasure forest plate [
17,
18].
We restricted our analysis to the Southeast due to its large presence of forestry business activity and private forest ownership relative to the rest of the country. It was our assumption that any relationships would be more profound in these states. Further, very few states outside of the Southeast were found to have forestry-specific license plates, including heavily forested states (i.e., Maine, Oregon, Wisconsin, and Minnesota). The fact that most states (despite the amount of forest cover in the state) do not issue forestry plates may be a function of the lack of a strong forestry association or presence of a forestry industry to pursue issuing a forestry-specific plate.
The empirical models examined in this study were linear Ordinary Least Square (OLS) models and Count (Poisson and Negative Binomial) models where the number of forestry specialty license plates sold in each county is a function of the demographic variables of that county. Since there has been no previous scholarly work on forestry license plates, we borrowed from the only other similar study of Laband et al. [
13] for the selection of dependent variables (mentioned above in the introduction section), which was done on wildlife license plates in 39 states. Using that, we modeled the state-wide sales of forestry plates (summed across counties), as Function (2):
These county-level data were collected from public sources like U.S. Department of Commerce, Bureau of the Census, and Bureau of Labor Statistics for all states. Number of forestry specialty license plates sold in each county in 2014 was collected from the Department of Revenue of each state if statistics were tabulated or the Department of Motor Vehicles if data were unavailable through the revenue department, in which case phone inquiries were made as to the availability of data by county. Population size (including population data from different age groups), total county area in acres, and number of housing units came from year 2010 [
19]. Income per capita and household median income were also from 2010 inflation-adjusted dollars. Area of timberland and nonindustrial private forest in 2014 was collected from Forest Inventory Analysis section of the Forest Service) [
20], see
Table 1 for variable definitions for variables included in the analysis.
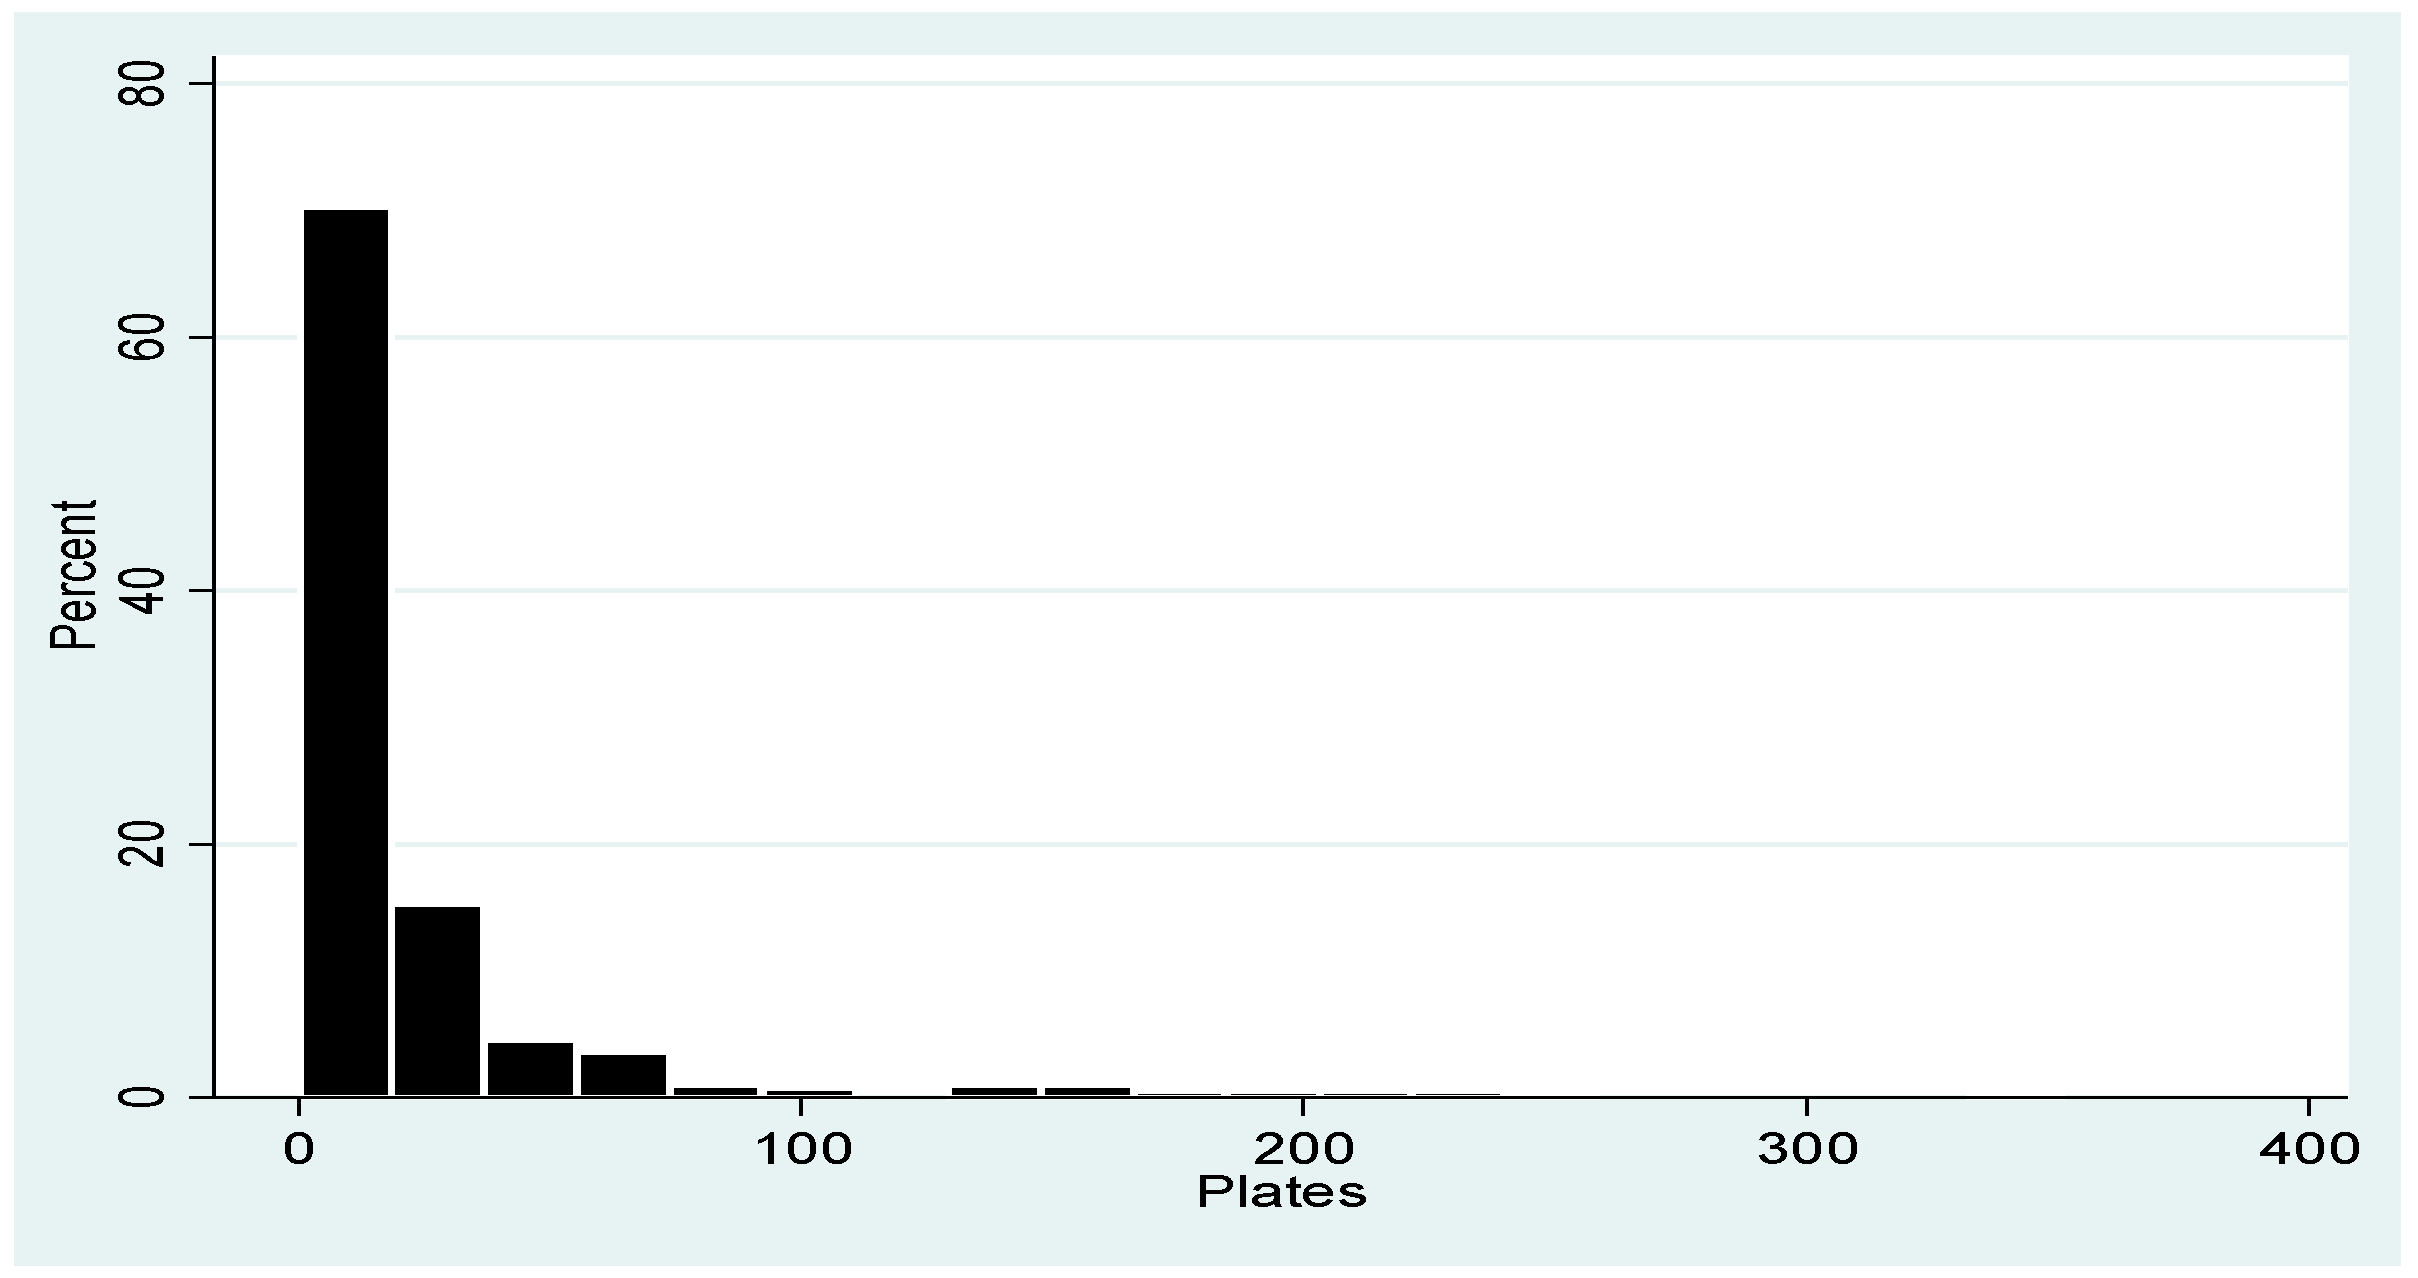
Initially, we examined Ordinary Least squares (OLS), but quickly settled on count modeling (Poisson and Negative Binomial) specification given the behavior of the dependent variable [
21,
22] (Given the count nature of the dependent variable it is possible to arrive at inefficient outcomes. With OLS, classical BLUE (best linear unbiased estimators) assumptions say dependent variables and the errors have normal distributions. However, the normal distribution assumption is only suitable for continuous random variables and count data is not necessarily continuous. [
22]. With count data, OLS might be acceptable in some cases as it will still be unbiased, but if our dependent variable has extreme skew, it violates the normality assumption of OLS regression) (see
Figure 2), as such we report the results and draw inference for the discussion from our count models. As the OLS models indicated heteroscedasticity, we ran robust regressions in all models [
23,
24] (For our OLS specification, we performed a Breusch-Pagan and Cook-Weisberg test for and found that the variance of the error term was not constant. We use the vce (robust) option to obtain robust standard errors for the parameter estimates as recommended by Cameron and Trivedi (2009) to control for mild violation of underlying assumptions. All statistical analysis were performed with STATA 12 (Stata Press, College Station, TX, USA).
It became clear as we conducted pairwise correlations by state that two groupings emerged within the six plates investigated. One group were those plates with the phrasing of “trees” in the plate design and the other group were those with “forestry” phrasing in their plate design. In our opinion it is not coincidental that these groupings also correspond to the organizations that sponsored them. Those with the “tree” language were urban forestry education oriented organizations and those with “forests” were those sponsored by forestry associations.
Lastly, Texas represented a different challenge from the other states in the analysis, with such a robust forest economy in much of eastern Texas but virtually no tree cover in other parts, we decided to cull some of the counties from the analysis. If the forest cover in the county was zero according to the Forest Inventory Analysis but was not considered an urban county, we removed it from the analysis (Urban as classified by the Census bureau is 500 people per square mile). The logic was that if there were no trees due to land use conversion we would leave the county in the analysis and remove it otherwise, as it represented a county that simply was not a forested ecosystem. This led us to exclude 188 (out of 254) counties from the study.
4. Results
Alabama sold the highest number of forestry-based specialty license plate in the year 2014, with Florida a close second (
Table 2), both with an average of plate sales across all counties of approximately 50 by county. South Carolina sold the lowest number of specialty plates, but it also had the most recently issued plate (2011). Texas had very low average plates sold, but it also had 36 counties with no plates sold. First, 23 counties in Texas have no designated forestland. Second, the average forestland per country was only 33.6%, even after excluding the counties mentioned above in the methodology. The average timberland per county in Texas is approximately 186,000 acres where it is about 340,585 in Alabama.
In determining which count model was appropriate, we examined the standard deviation in relation to the mean of the dependent variable, in most cases there was overdispersion (Negative binomial regression can be used for over-dispersed count data, which is when the conditional variance exceeds the conditional mean. It can be considered as a generalization of Poisson regression since it has the same mean structure as Poisson regression and it has an extra parameter to model the over-dispersion. If the conditional distribution of the outcome variable is over-dispersed, the confidence intervals for the Negative binomial regression are likely to be narrower as compared to those from a Poisson regression model). Relatedly, in cases with excessive zeros a zero-inflated count model is recommended and was used for statistical inference (see
Table 3).
Table 4 shows the descriptive statistics for the explanatory variables used in the regression outputs in
Table 5. Income per capita ranged from $11,500 (Holmes, MS, USA) to $37,360 (Collin, TX, USA) with an average of $20,440 at the county level. With regard to population density, the ranges were quite broad with very rural classifications of slightly over five people per square mile (Issaquena, MS to just over 5230.5 (Pinellas, FL, USA). Counties ranged from no forest acreage reported (several urban locations in Texas) to almost completely forested (95.3% in Taylor, FL, USA) with 81 counties at > 80% forested, a great majority of those acres classified as privately owned forests (approximately 81%). Industry presence averaged two mills per county (all types included) (Mills that had closed prior to 2014 were not counted in the analysis) 129 counties had no reported open or mills under construction, with three counties reporting double digit mill locations (Angelina and Nacodoches, TX both with 11, and Newberry, SC reporting 10). The typical county had approximately 15% of the population 65 or older wit Sumter County the clear leader at 43.4%. Its closest rival at 34.1% was also a county in South Carolina (Charlotte, SC, USA). Denton, TX was at the opposite end with 6.9% (only 20 counties reported in single digits).
Empirical Model Results
Table 5 shows the impact of each explanatory variable on the number of forestry based specialty license plates sold in all four states combined. As mentioned earlier, the plates formed two groupings; one for “forest” plates (models 1 and 2) and one for “tree” plates (models 3 through 6). In both cases, the number of specialty plates sold was found to be positively related to income per capita and population density. For the urban “tree” plates, these were the only two variables that were significant, whereas variables associated with forestry land base and the presence of industry did not have a significant effect in any of the models. For the rural “forestry” plate, for both models one and two (Forests Forever—AL and First in Forestry—MS, respectively), the percentage of total acres in the county that were forested showed significant positive correlation with plate sales. Relatedly, the number of those forested acres that were owned by non-industrial private landowners also had a positive and significant correlation with plate sales. Similar to the findings of Alper et al. [
2], we found a negative, though non-significant, relationship (except for model 6—Trees SC) between plate sales and percentage of people who are 65 or older.
All coefficients are presented as incidence rate ratios (IRR), meaning that it represents estimated rate ratio for a one unit increase in the regressor, given the other variables are held constant in the model. Examining the coefficient of income per capita for model 1, we interpret as if we have a one unit increase (positive coefficient sign) in income per capita (a thousand dollars), our rate of plate sales would increase 1.04 times (or 4%). As the rates are multiplicative and not additive, a two unit increase in income per capita (two thousand dollars) would result in a 16% increase in plate purchases in the county.
In the case of percent forest, the coefficient is 2.43. Thus, plate sales increase 2.43 times (or 143%) for every percentage increase in percent forest cover. Calculating the percentages are as Equation (3):
For completeness the only variable that has an IRR of less than one is the Percent of ≥ 65 variable, although not significant, the interpretation here is that a one percent increase (since it is in percentage form) leads to a 3% decrease in plate sales, ceteris paribus.
5. Discussion
Firstly, it is clear from our results that income per capita has significant positive correlation with plates sales in all cases, which is supported by both anecdotal evidence as well as previous literature [
14,
25]. This result was expected, as a literature on the subject of income effects and consumption and environmental amenities indicate that wealthier citizens purchase more environmental goods and services [
14]. In this case, it appears that not only do wealthier people purchase more of those goods and services in the case of forestry license plates (on average), they display those purchases.
Likewise, as another large, but contentious body of literature points out, younger individuals tend to value environmental amenities to older individuals [
26,
27]. Both of those findings show up in our results. The larger the 65 years and older demographic in our study, the fewer plates sold. One could make the argument that this is because urban areas tend to attract younger people for any number of reasons, but we control for that effect with our population density variable which we know turn our attention. However, our ability to support this is limited as only one state (Texas) showed a statistically significant result, the others showed no statistically significant relationship.
Secondly, it is clear that population density has a statistically positive relationship with plate sales, again, across all states. While we expect that as population grows in a county, purchases of all goods and services increase, ceteris paribus our result here indicates further nuance. As an area urbanizes, forestry plate sales increase. This result may in fact be an indicator of a larger pattern of behavior, as environmental amenities become more scarce people place higher values on them.
For instance according to Tyrväinen and Miettinen (2000), their estimation results show that a one kilometer increase in the distance to the nearest forested area leads to an average 5.9% decrease in the market price of the dwelling [
28]. Relatedly, a 10% increase in tree cover within 100 m increases average home sale price by $1371 and within 250 m increases sale price by $836 [
29]. Dwellings with a view onto forests are on average 4.9% more expensive than dwellings with otherwise similar characteristics [
28]. The study was designed to measure the use-values of urban wooded recreation areas, and the residents’ willingness to pay for small forest parks contributing to the quality of the housing environment. Results suggest that most visitors were willing to pay to prevent the conversion of forested parks to another land-use [
30]. In our analysis, increased urbanization appears to entice more forestry plates to be sold.
For urban “plate” purchases, it appears that the percentage of the county that is forested (private or generally) does not matter. Originally, we felt that exposure and access to the resource (in this case forests) might provide individuals an affinity for the services it provides. In the case of the “rural” plates, the significant result for forested acres (private) may indicate that as forests increase in the county, plate sales increase as a result of more individuals associated with forestry ownership in the county. However, the fact that those older than 65 have a negative relationship with plate sales draws this inference into question given that most forest landowners are over 65 years of age. Additionally, we examined the presence of the forestry industry in the county and found that it has a positive correlation with plate sales. This finding reinforces the interpretation that as association of individuals with forestry increases, the rate of forestry plate sales increases.
We consider that the name of the specialty plate has played an important role in these results., For example, Florida had a caption that could possibly be more relatable to a broader cross section of people than “First in Forestry” in Mississippi (
Figure 1). However, this can cut both ways as a plate more focused to one group is more likely to not lose purchases to alternative plate designs. Interestingly though, states with large forest land bases may not need to choose one over the other. Alabama has two plates that both have robust sales that cater to different audiences according to the results, with one plate capturing “urban” purchases and the other capturing “rural” purchases. While both are positively correlated with per-capita income and population density, the urban plate results are stronger (
z-statistic not reported), though both were statistically significant at the 1% probability level.
6. Conclusions
Forestry plate sales are of interest from a forest policy and marketing standpoint. These are completely voluntary purchases that support forestry or forest-related resources, and it is important to understand what drives the choice of purchasing specialty forestry plates to facilitate their generating continued or increased revenue for organizations that support forestry and forest resources. While we cannot speculate on “individual” motivations for plate purchases with our study, we can examine where those plates are most likely to be sold with a parsimonious model. This provides an opportunity for forestry organizations that wish to sell the plates in order to better target advertising strategies. In an environment of increasing budget shortfalls in state and municipal budgets, utilizing voluntary support for the provision and maintenance of forestry resources can be an ally in the goal of sustainable forestry.
A key finding is that the message matters in terms of where the plate will have the best success in terms of sales. Our models indicate that the plates cleave into groups depending on whether forestry is in the name or a more general message of trees (woods) is presented. Relatedly, and perhaps more importantly, states may be able to follow the example set in Alabama and offer both a plate focusing on “trees” and one focusing on “forestry” in order to better saturate and partition the market. South Carolina may be an ideal location to test this as they currently are issuing an urban plate in a state with very few truly urban counties. This may explain, in part, the low sales of their plate at this time and Trees SC may want to offer a more “rural” themed plate.
However, organization should be careful to whom/how they market the plates depending on the theme. If a group with a more urban networks attempts to market a “forestry” plate instead of a “trees” plate it may not have as much success in terms of revenue generation or getting the requisite signatures to offer the plate at the respective Department of Motor Vehicles, as they would not have marketed to the correct audience. Partnering with a forestry association would be advised in this circumstance.
An unresolved issue at this stage is how sensitive consumer demand is to the price of the plate. A larger, multi-state analysis that reflects more variation in plate prices may allow researchers to address the appetite among consumers for increases in specialty plate prices. Alternatively, but relatedly, a Willingness-to-pay analysis could be used to query both those who already own the plates if they would pay more for the plates and to allow a more robust demand-side analysis to be conducted, although the necessary survey response may be difficult to achieve for a particular plate type.
In addition to forestry license plates, there are several other specialized license plates offered for sale in a given state that might appeal to individuals who appreciate nature, the environment, working outdoors, etc. (Agriculture, Cattlemen’s, Ducks Unlimited, Wildlife, Cahaba River, Environmental, Forever Wild). The general analysis conducted thus far provides limited insights with respect to variables that the forestry groups can influence in an effort to increase overall sales of the plates other than targeted marketing. A key question for further exploration of forestry plate sales is that given that someone is willing to spend money on an outdoors/natural resources specialty plate, why do they choose a forestry plate over one of the other outdoors/natural resources specialty plates available?


