Article

Multiple Patterns of Forest Disturbance and Logging Shape Forest Landscapes in Paragominas, Brazil

1
CIRAD, UPR Forests and Societies, Campus International de Baillarguet, TA C-105/D, 34398 Montpellier Cedex 5, France
2
National Institute for Space Research (INPE), Amazon Regional Center (CRA), Science and Technology Park of Guamá, Perimetral Avenue, 2651, 66077-830 Belém, Pará, Brazil
3
EMBRAPA Amazônia Oriental, Trav. Dr. Enéas Pinheiro, Bairro Marco, CEP, 66095-903 Belém, Pará, Brazil
*
Author to whom correspondence should be addressed.
Forests 2016, 7(12), 315; https://doi.org/10.3390/f7120315
Submission received: 19 September 2016 / Revised: 2 December 2016 / Accepted: 6 December 2016 / Published: 13 December 2016

Abstract

:
In the Brazilian Amazon, multiple logging activities are undergoing, involving different actors and interests. They shape a disturbance gradient bound to the intensity and frequency of logging, and forest management techniques. However, until now, few studies have been carried out at the landscape scale taking into account these multiple types of logging and this disturbance gradient. Here we address this issue of how to account for the multiple logging activities shaping the current forest landscape. We developed an inexpensive and efficient remote sensing methodology based on Landsat imagery to detect and track logging activity based on the monitoring of canopy openings. Then, we implemented a set of remote sensing indicators to follow the different trajectories of forest disturbance through time. Using these indicators, we emphasized five major spatial and temporal disturbance patterns occurring in the municipality of Paragominas (State of Pará, Brazilian Amazon), from well-managed forests to highly over-logged forests. Our disturbance indicators provide observable evidence for the difference between legal and illegal patterns, with some illegal areas having suffered more than three explorations in fifteen years. They also clearly underlined the efficiency of Reduced Impact Logging (RIL) techniques applied under Forest Stewardship Council (FSC) guidelines to reduce the logging impacts in terms of canopy openings. For these reasons, we argue the need to promote legal certified logging to conserve forests, as without them, many actors mine the forest resources without any concerns for future stocks. Finally, our remote tracking methodology, which produces easy to interpret disturbance indicators, could be a real boon to forest managers, including for conservationists working in protected areas and stakeholders dealing with international trade rules such as RBUE (Wood regulation of European Union) or FLEGT (Forest Law for Enforcement, Governance and Trade).

1. Introduction

Selective logging is one of the most prevalent land uses in the tropics, with more than 400 million hectares of natural tropical forest devoted to timber production [1]. In the Brazilian Amazon, each year, selective logging can extend over as much forested area as does deforestation [2], with logged areas ranging from 12,075 to 19,823 square kilometers per year (±14% for 1999 to 2002) [3].
Although selective logging is often regarded as a source of forest degradation and anthropogenic disturbance [4,5,6], most impact studies show that compared to other forms of production, selective logging remains the least impactful activity since selectively logged forests remain in terms of ecological and functional properties closest to primary forests [1,7,8].
However, logging impacts vary strongly depending of the intensity and frequency of timber activities. Indeed, illegal unsustainable logging is still very important in most part of the tropics and in the Brazilian Amazon [9,10]. Logging can vary from very low intensity (1 to 2 trees·ha−1) with few impacts, to more intensive and repeated logging, often occurring with ground fire [11]. Moreover, within the same forest landscape, logging concerns multiple actors and different areas of forest management are being juxtaposed, such as areas of forestry companies, forest concessions (currently only in five National Forests), but also areas in private and community-owned forests, for example in Legal Forest Reserve (Reserva Legal) of big farm (fazenda) or smallholder areas (assentamento) [12,13]. For these reasons, logged forests must be characterized by a disturbance gradient bound to (1) intensity of logging; (2) frequency of logging activities through time; and (3) forest management techniques (i.e., conventional management (CNV), Reduced Impact Logging (RIL), or no management techniques in case of illegal logging). These three variables have a critical influence on forest environmental services and forest resilience [14,15].
Until now, few studies have been carried out at the landscape scale taking into account these multiple types of logging and this disturbance gradient to understand the state of the forest. The aim of this study is to remotely measure canopy openness after logging at the landscape scale and to associate disturbance indicators synthetizing logging impacts information in terms of intensity and frequency. This association could provide an efficient monitoring tool for forest managers and local stakeholders.
To move forward with answering this question, we developed an inexpensive and uncomplicated remote sensing methodology to detect and track logging activity in terms of considering canopy openings and a set of disturbance indicators. In this paper, we first review remote methodologies for monitoring logging that are already available and emphasize the need to develop more operational tools and indicators to detect and track logging activities. Second, we describe our innovative semi-automatic remote sensing methodology to detect forest disturbance using multi-temporal Landsat images. Third, we propose a set of indicators of forest disturbance that characterize the evolution of impacts through time. Fourth, we test this methodology on the Brazilian Amazon in the municipality of Paragominas in the State of Pará, an area that has a complex history of deforestation and timber exploitation, at the scale of the proprieties using the Rural Environmental Cadastre (CAR—Cadastro Ambiental Rural). Lastly, we compare the disturbance impacts of different forest management types and identify the diverse spatial and temporal disturbance patterns occurring in the studied region.

2. State of the Art: Implementing Operational Remote Sensing Indicators to Monitor Logging Activities through Time

During the last few decades, the high diversity of remote sensing sensors and spatial scales of analysis has opened new perspectives for the characterization of forest degradation.
Most advanced studies use moderate spatial resolution imagery such as the free Landsat archive. For example, previous studies [3,16,17] developed an automatic tool named Carnegie Landsat Analysis System (CLAS) based on spectral mixture analysis (SMA) to map forest degradation with Landsat imagery at a resolution of 30 m. The authors used it to quantify the amount of selective logging in the five major timber-production states of the Brazilian Amazon, which represented areas logged per year that ranged in size from 12,075 to 19,823 km2 between 1999 and 2002. They also confirmed the importance of the degradation process during logging activities, showing that during the 1999–2004 period, at least 76% of all timber harvest practices resulted in high levels of canopy damage sufficient to leave forests susceptible to drought and fire. To enhance the degradation signal on the unmixed images, Souza et al. [6] developed a normalized difference fraction index (NDFI) that they used on Landsat imagery to map forest degradation. This method detects forest degradation that results in >25% canopy openings. In the same perspective, the Brazilian National Institute for Space Research (INPE) uses imagery of CBERS and LANDSAT and spectral mixture analysis to develop two projects for monitoring the forest degradation in the Brazilian Amazon: the DETEX project (Selective Logging Detection Project) and the DEGRAD project (Brazilian Amazon Forest Degradation Project). Using spectral indices and morphological filters, Bourbier et al. [18] developed an automatic tool implemented with Orfeo ToolBox [19] to detect logging roads on Landsat imagery. Some studies also used SPOT 4–5 multi-spectral imagery. For example, Souza [20] applied a spectral mixture analysis (SMA) model to a Satellite SPOT 4 image to map different classes of degraded forest in the eastern Amazon (from intact forest to logged forest, degraded forest, and forest in regeneration). Studies by Gond and Guitet and Pithon et al. [21,22] developed a remote sensing methodology to monitor post-logging impacts in French-Guyana with SPOT 5 images using a combined manual and Gaussian statistical approach to estimate the segmentation thresholds between intact forest and canopy gaps and skid trails. All these studies show the good potential of moderate spatial resolution imagery such as Landsat and Spot 4–5 to detect forest degradation in tropical forests.
Some studies also tested high resolution optical sensors and light detection and ranging (LiDAR) to detect forest degradation and carbon stocks at a fine spatial scale. For example, coupling LiDAR and the CLAS method on Landsat imagery, Asner et al. [23] produced high-resolution maps of forest carbon stocks and emissions in the Peruvian Amazon. However, these data have a huge cost and such analyses can be difficult to implement on large areas.
In considering a different perspective, Moderate-Resolution Imaging Spectroradiometer (MODIS) with low spatial resolution but high temporal resolution (250 m to 1 km resolution every 16 days) and TRMM (Tropical Rainfall Measuring Mission) are used to detect forest degradation at a large spatial scale. For example, Leisher et al. [24] used the Terra-i dataset [25] developed by CIAT (International Center for Tropical Agriculture) to detect land and forest degradation inside protected areas in Latin America.
It is important to notice that operational systems of near-real time alerts for tree cover monitoring in tropical regions have already been implemented using these sensors with low spatial but high temporal resolution. For example, the Brazilian National Institute for Space Research (INPE) has been developing and employing the DETER system (Real Time Deforestation Detection System) to detect forest degradation in the Brazilian Amazon since 2004. Furthermore, recently the Regional Center of the Amazon (RCA) from INPE, launched the DETER-B system, which uses images of ResourceSat-2 (sensor AWiFS (Advanced Wide Field Sensor) with 56 m resolution) and CBERS-4 (sensor WFI (Wide Field Imager) with 60 m resolution), capable of distinguishing eight classes of forest alteration, including different levels of degradation, fire forest scars, and two types of selective logging [26]. Another example is the Global Forest Watch platform (GFW) [27], that has integrated the FORMA (FORest Monitoring for Action), Terra-I, and GLAD (Global Land Analysis & Discovery) alerts about tree cover loss and habitat change, and has also developed an Open Data portal to track the spread of logging roads across the Congo Basin region [28].
This review of recent remote sensing methodologies to detect and monitor forest degradation and logging impacts emphasizes the variety of data sources available. However, if it illustrates the trade-off between resolution mapping, cost, and area covered, it also highlights that most operational tools currently used to track forest degradation are using low spatial resolution (250 m to 1 km resolution). This low spatial resolution makes these tools difficult to employ to monitor logging activities at the local scale, such as the scale used by a forestry company. In this sense, there is a need to develop operational tools at a better spatial resolution in order to track logging activities at the local scale and to monitor the different patterns of forest disturbance shaping the forest landscapes. Such operational tools should report applied data about intensity, frequency, and spatial extent of the logging impacts through time. In order to guide decisions about forest landscape management and to help track logging activity, these data should be synthetized in a set of easy to interpret indicators.

3. Materials and Methods
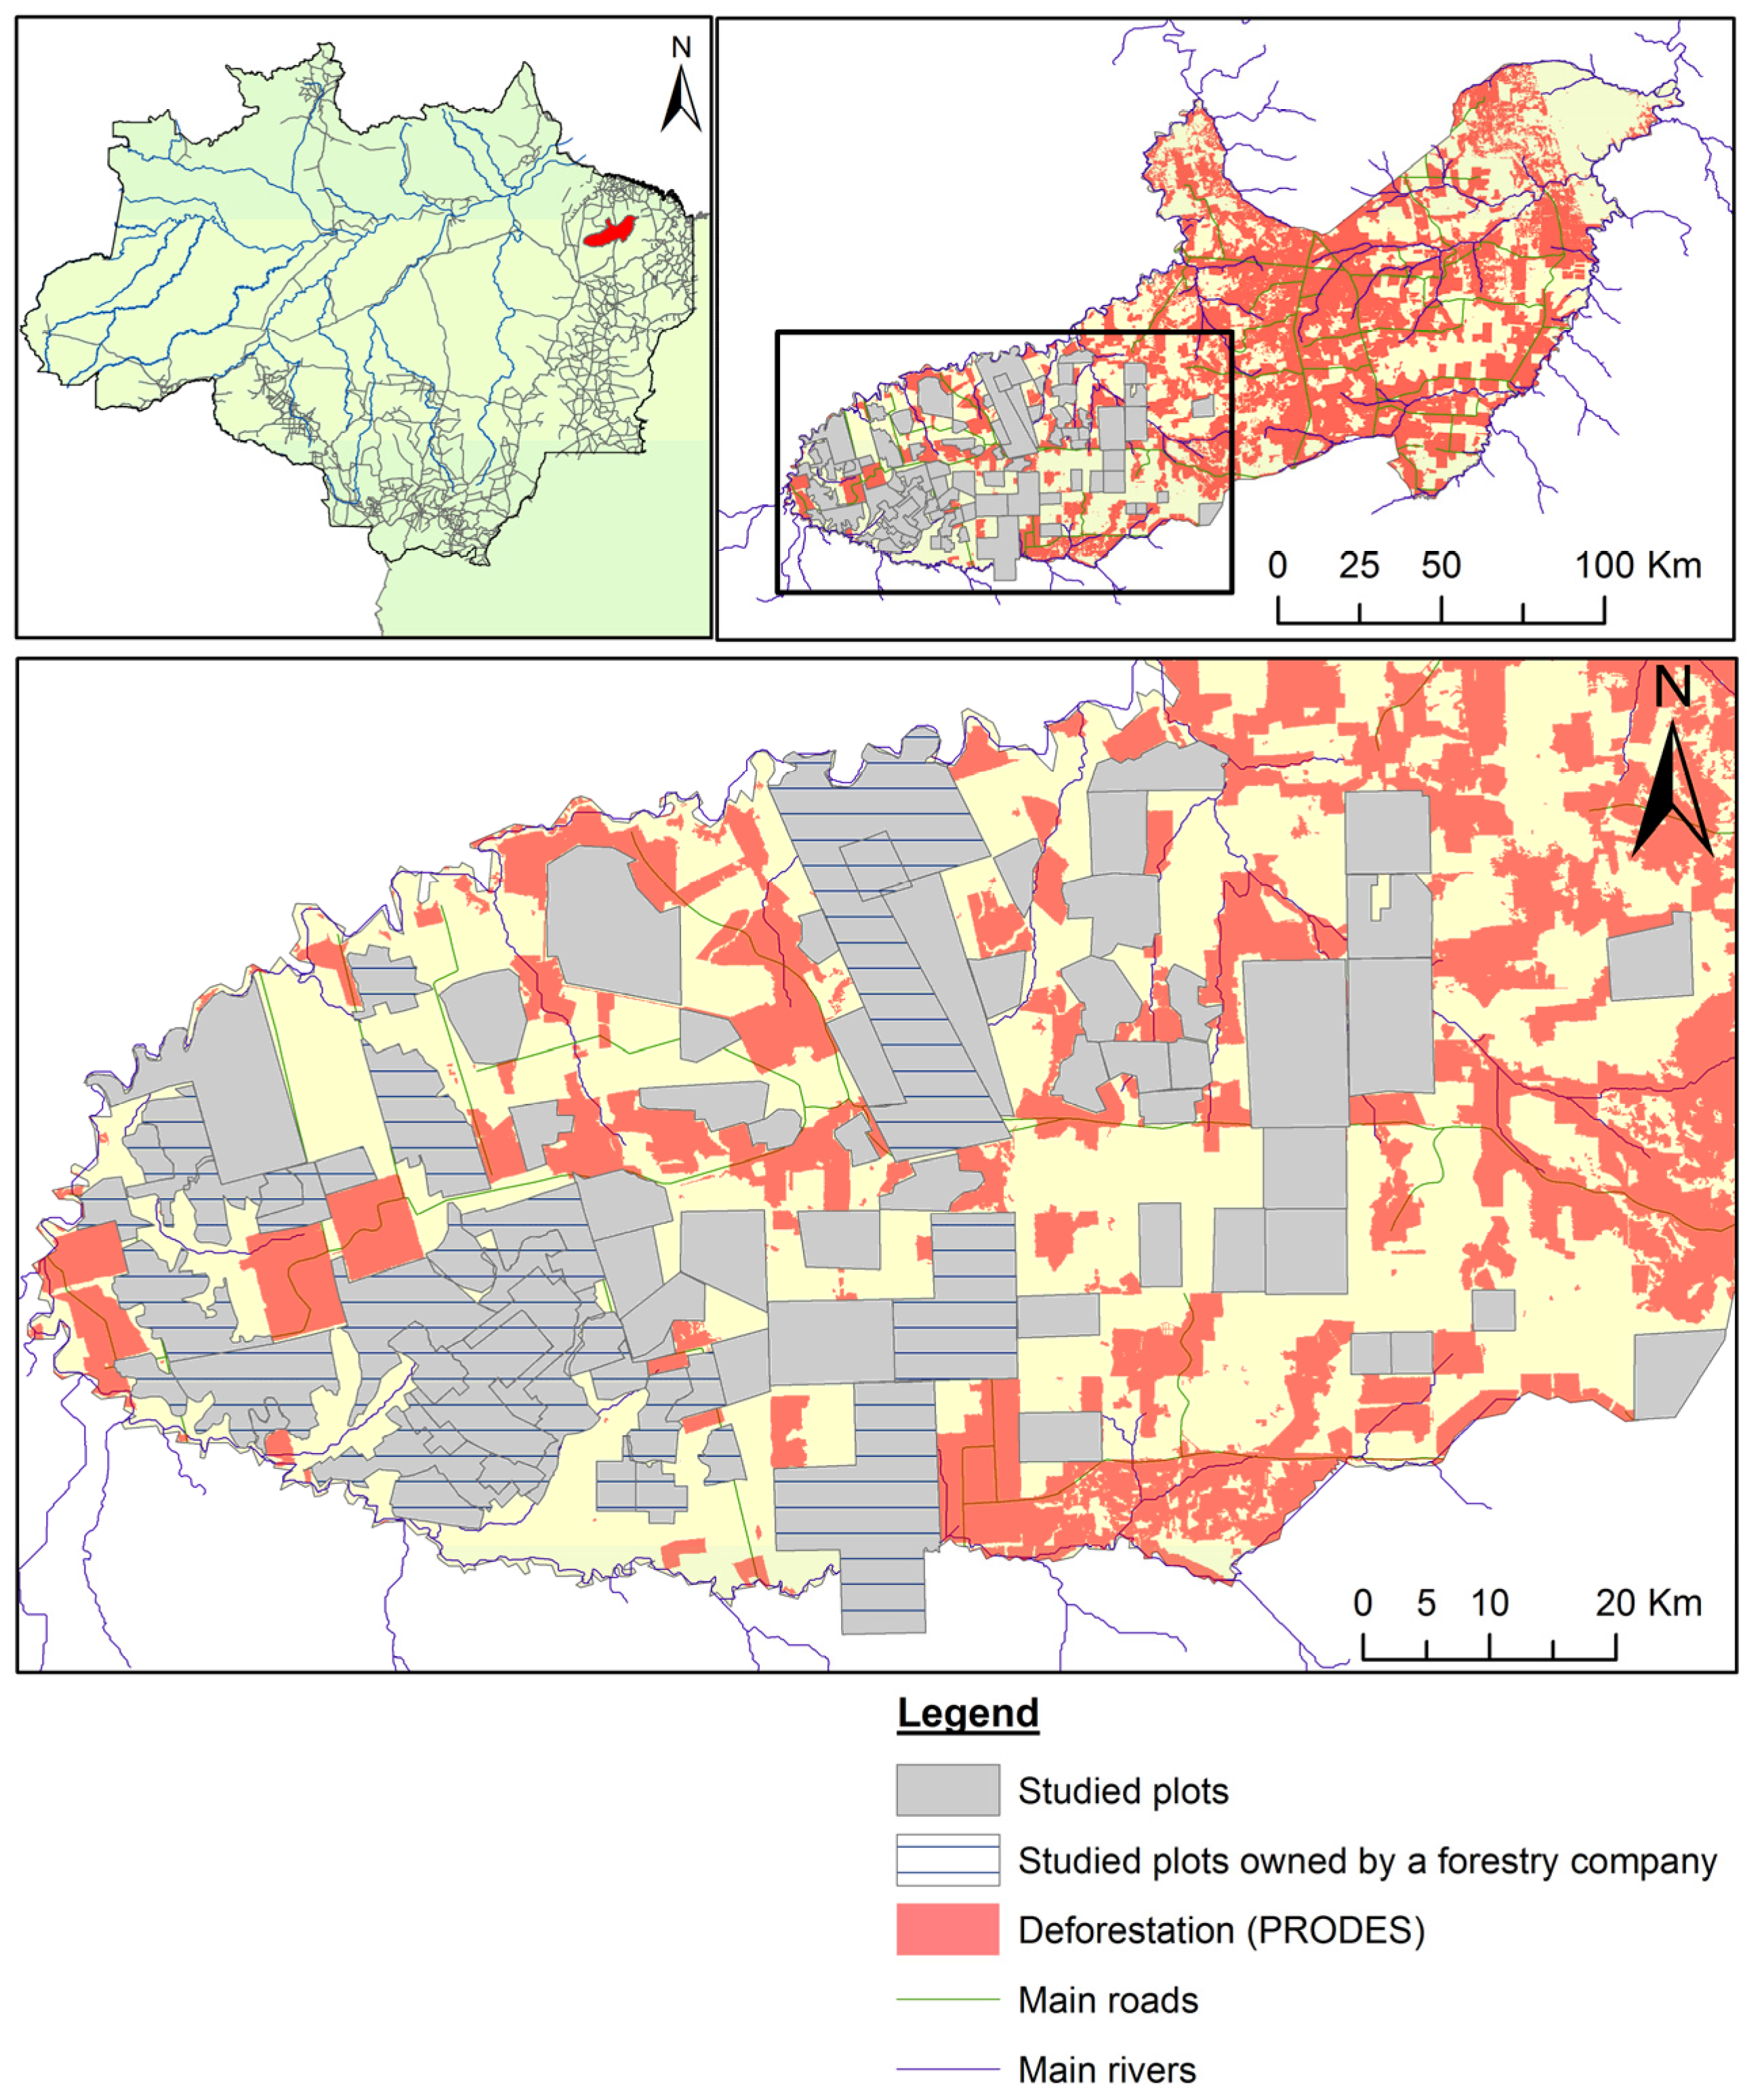
3.1. Study Site

We studied the municipality of Paragominas—Pará, a municipality in eastern Brazilian Amazonia located 217 km south from Pará’s capital, Belém. The municipality of Paragominas has suffered from deforestation and forest degradation due to charcoal and timber extraction. It was founded in 1965 along the Belém—Brasília highway (BR 010), and access to land and credit were promoted, specifically for cattle ranching on behalf of the large-scale colonization process of the Brazilian Amazon begun in the 1960s [29]. It became one of the main timber producing regions in the country in the late 1980s, as well as an important agricultural region of cattle ranching, and soybean and corn production. In 2008, the municipality was added to the Red List of Deforestation, published by Brazil’s federal government, which includes the municipalities with the highest rates of deforestation in the Amazon, and imposes severe restrictive measures such as embargos, credit restrictions, and fines for illegal activities [13]. Consequently, the Paragominas municipality faced strong pressures to slow down deforestation and illegal timber and charcoal production and launched the “Green Municipality project”. This is a novel governance arrangement that mainly aims to stop illegal deforestation and to geo-reference the land use of each rural property under the Rural Environmental Cadastre (CAR—Cadastro Ambiental Rural) and Rural Environmental Licensing (LAR—Licenciamento Ambiental Rural) acts [30]. By 2010, Paragominas has been removed from the Red List and has since become a template for “Green Municipalities” across Brazil [31].
Paragominas is home to the Cikel Brasil Verde Madeiras Ltda, a forestry company that is among the first major timber companies operating in the Brazilian Amazon, which is located to the southwestern of the municipality in the Rio Capim Forest (Figure 1). The Cikel’s Rio Capim forest covers 140,658 hectares and has been certified by the Forest Stewardship Council (FSC) since 2001 (see [32] for more details about the area). Various investments have been made for the transition from the conventional logging system to Sustainable Forest Management (SFM), such as human resources training and acquisition of new equipment, particularly skidders whose use should reduce impacts on the forest ecosystem. Additionally, the Cikel’s Rio Capim forest is a partner of the scientific Tropical managed Forests Observatory (TmFO) network, with permanent plots data available [33].
For all these reasons, the municipality of Paragominas is a pilot study site to characterize the logged forests at the landscape scale, mixing a gradient of forest management, from illegal logging to FSC certified forest management.

Selection of Forested Plots in Paragominas

We analyzed the evolution of forest disturbances across 15 years in 81 plots located to the southwestern of the municipality of Paragominas, where most of the remaining forest of the municipality is concentrated and where the landscape is predominantly forested (Figure 1). The plots represent a variety of forested areas managed by different landholders. They were defined according to the Rural Environmental Cadastre (CAR) of Paragominas and the forest management plan of the Cikel with the annual logging plots. The size of the plots varies from 565 ha (small to medium landholder) to 28,100 ha, with a mean area of 3576 ha (Standard deviation (sd) 3979 ha). They represent a total area of 289,648 ha.
Almost half of the plots are located on land managed by the Cikel forestry company (36 plots, with a mean area of 3930 ha), and half outside the Cikel managed area in private forested rural properties registered in the CAR (45 plots with a mean area of 3292 ha). Among the plots managed by the Cikel forestry company, 17 have been conventionally logged (before the point at which the forest management had been certified by the FSC) and 19 have been logged with reduced impact logging following the FSC requirement. Among the plots outside the Cikel managed area, we did not previously know the forest management practices. Some could have government-sanctioned authorizations (Autorização de Exploração Florestal—AUTEX) to explore their Legal Forest Reserve following an annual forest management plan, others not.

3.2. Data Processing

We considered a non-permanent opening in the canopy as the main indicator of forest disturbance due to logging. To detect these canopy openings, we used the freely available Landsat archive, which presents a good trade-off between spatial resolution, area covered and cost. As illustrated in Figure 2, Landsat resolution is sufficient to detect logging activity, and to analyze the spatial arrangements of the impacts (Figure 2) and their evolution through time.

3.2.1. Remote Sensing Images Selection and Calibration

In this study, we used images from Landsat 5-TM and 7-ETM+ (30 m resolution), orbit 223/063 and 223/062, covering the period 1994–2009. Landsat images were selected based on cloud cover and season: only images with less than 10% cloud cover were used, and also only images during the dry season (June to September) when the logging activities take place. Thus, for the period of 1994 to 2009, we obtained one image for each year from the United States Geological Survey (USGS) database [34]. The radiometric calibration and atmospheric corrections were made using Carnegie Landsat Analysis System—Lite (CLASlite) [16]. In order to consider only current forest stands and not all the forests which had been degraded before being cleared, all areas deforested before 2009 have been hidden using the 2009 mask of PRODES (Amazon Deforestation Monitoring Project) [35].

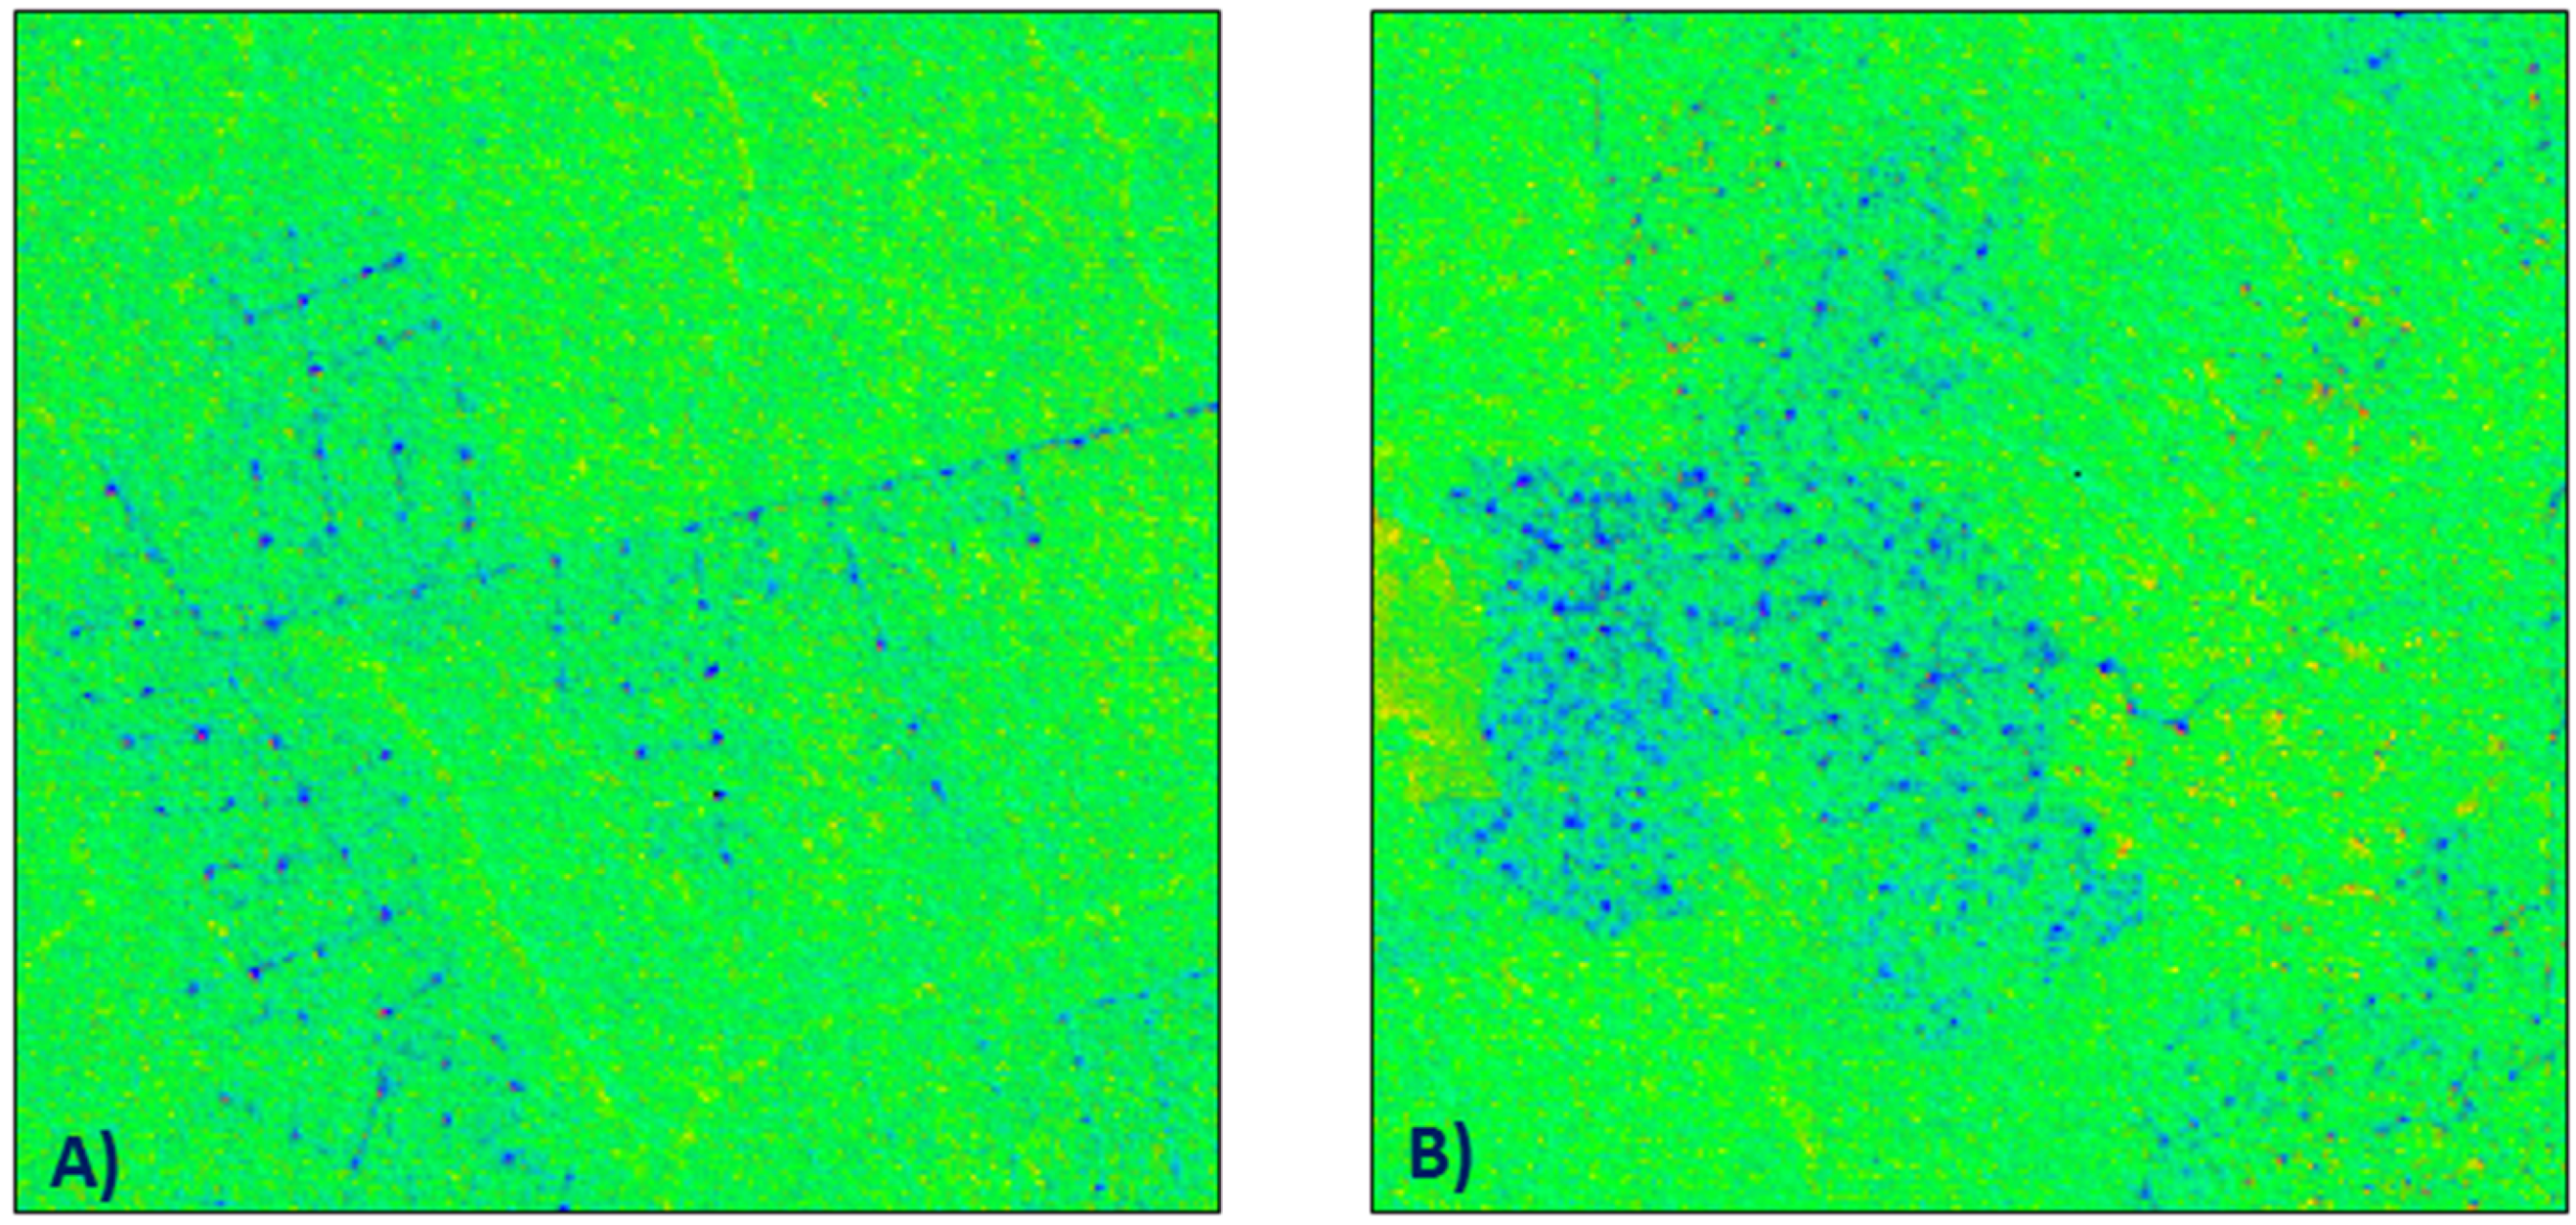
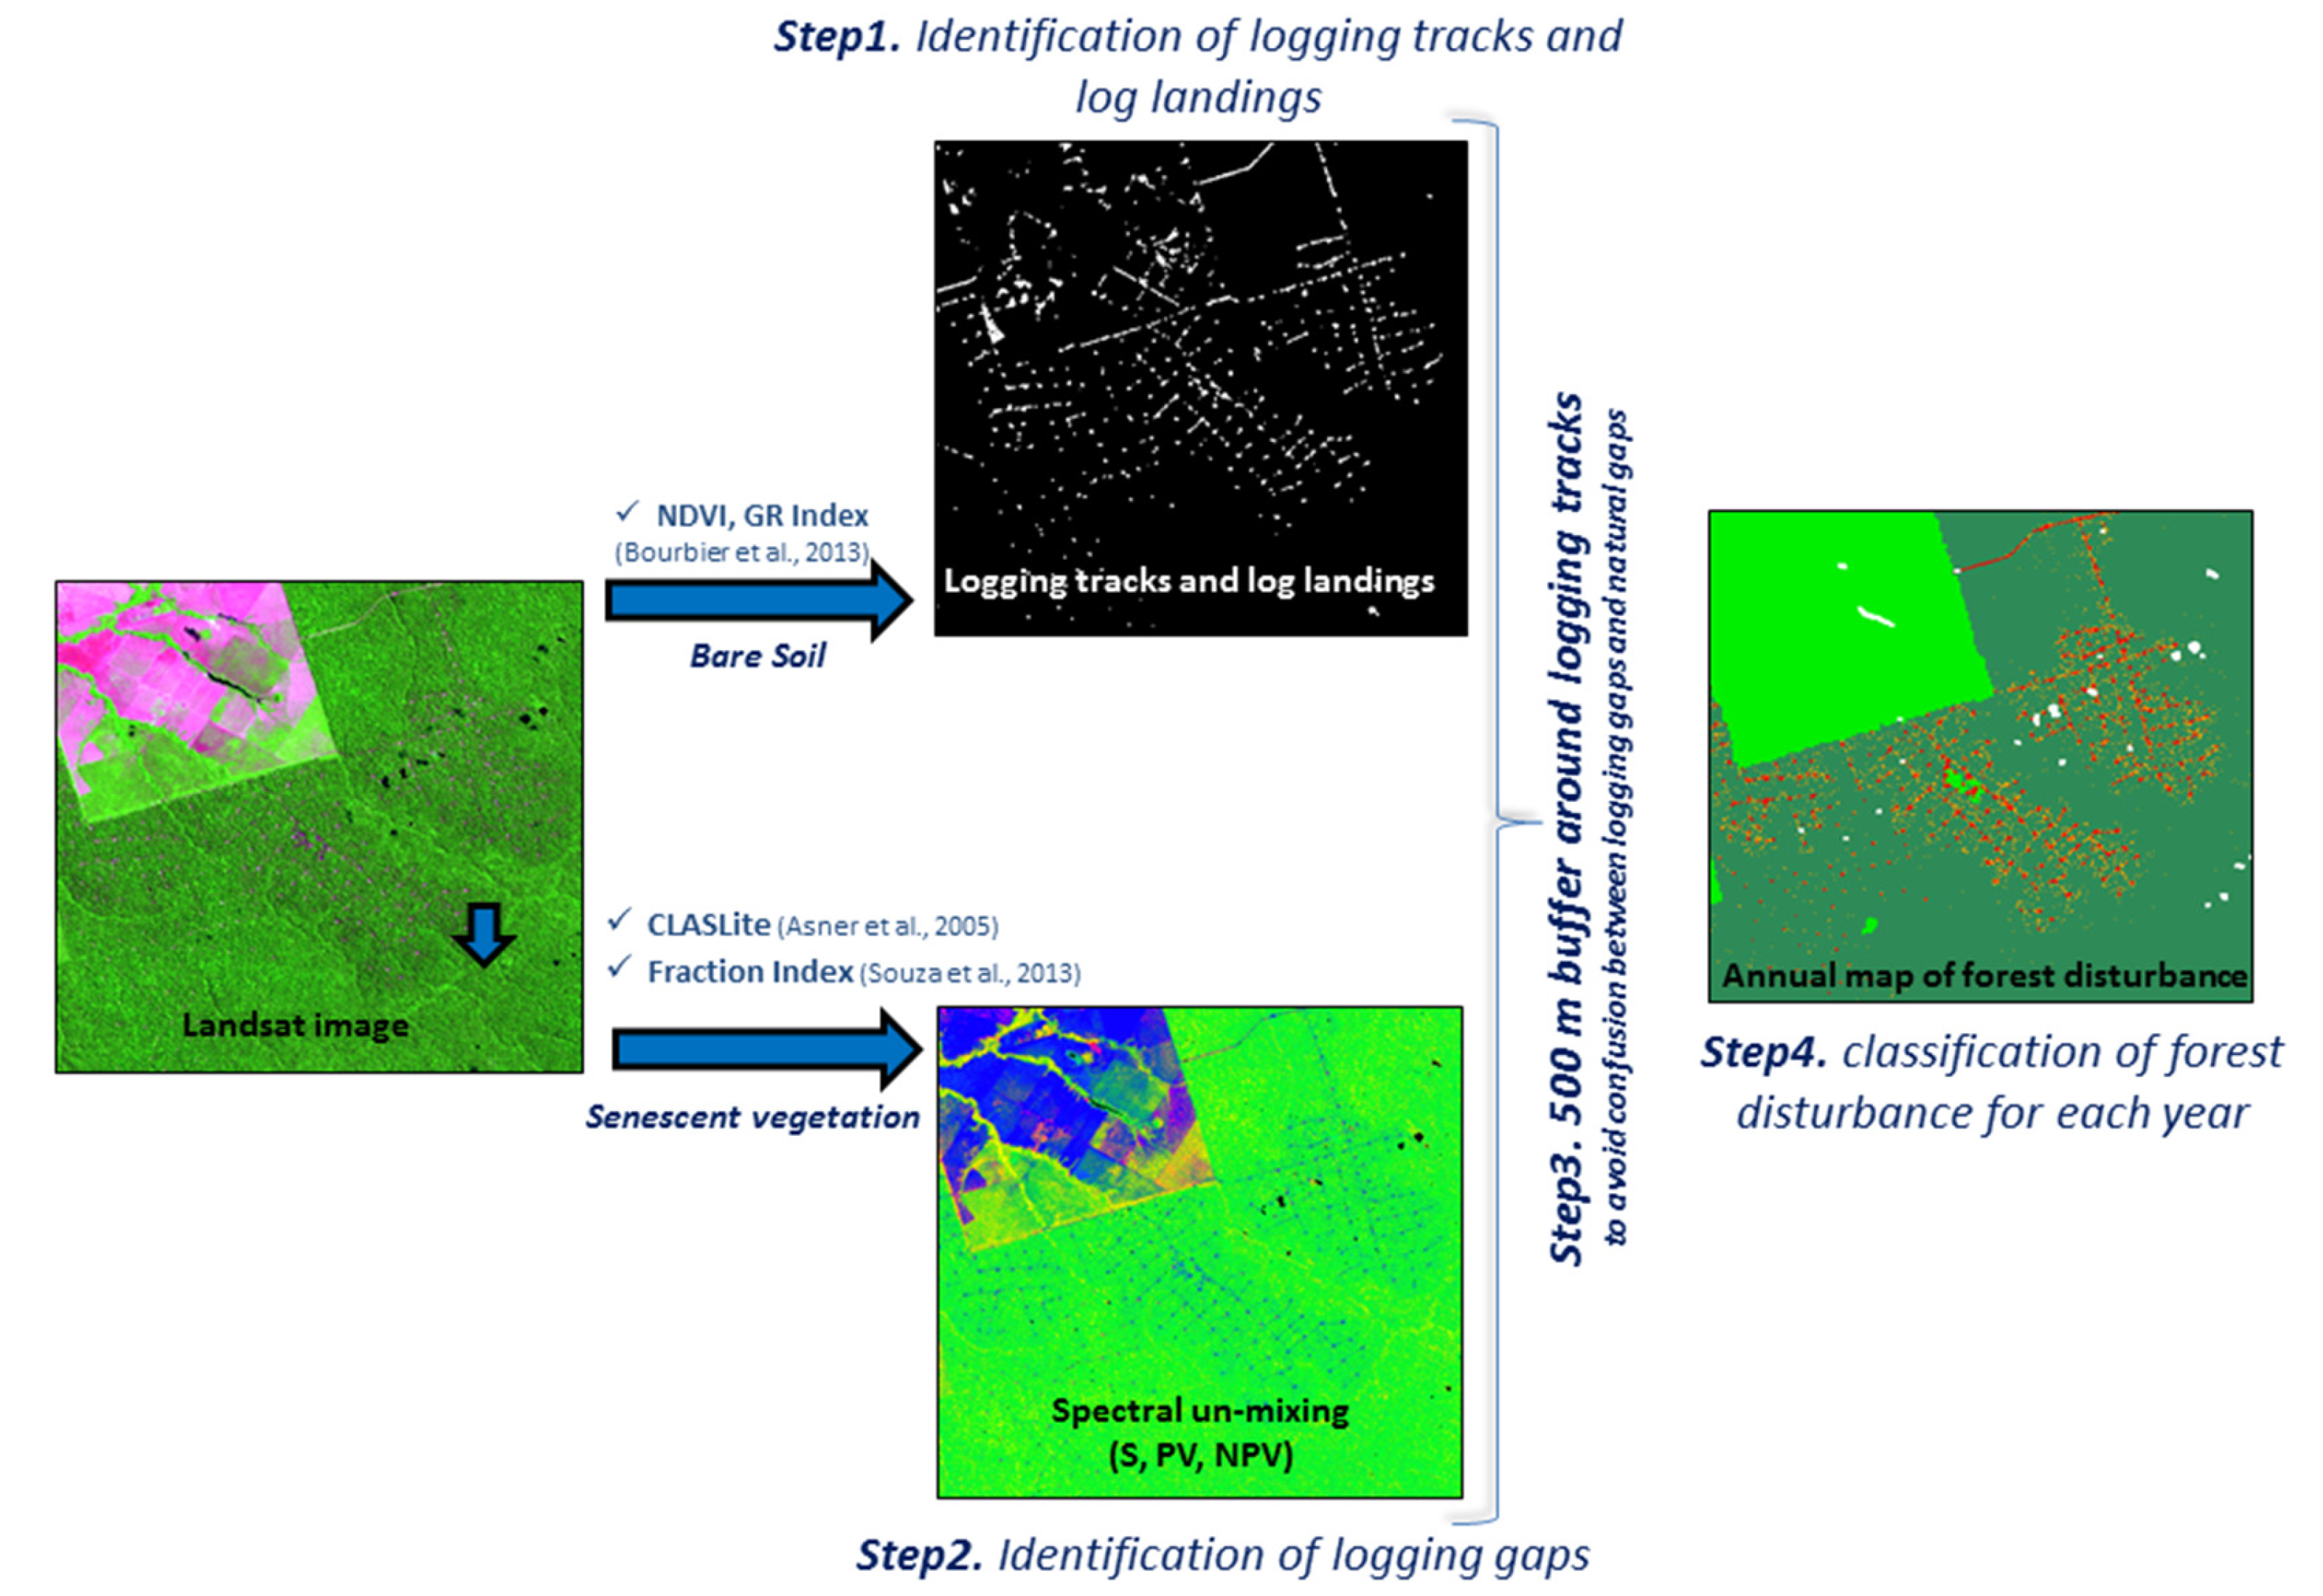
3.2.2. Remote Sensing Steps to Detect the Impacts of Logging

We relied on different available algorithms to detect the areas of disturbed forests. First, using the automatic algorithm from Bourbier et al. [18] implemented with the open source C++ library Orfeo ToolBox [19], for each year we identified the logging tracks and log landings which are characterized by higher proportion of bare soil. This algorithm uses spectral indices such as the NDVI (NDVI = NIR-R/NIR + R) and GREEN-RED (GR = Green − Red/Green + Red) index to strengthen the spectral contrasts between bare soil and forest cover and morphological filters. This algorithm also identifies clouds and rivers and produces a mask image with logging tracks and log landings (Figure 3).
Second, using the ClasLite algorithm developed by Asner et al. [16] and a fraction Index [36] (Figure 3), we identified the logging gaps, which are characterized by a higher proportion of senescent vegetation (wood and leaves fragments) than other intact areas. To do this, we resorted to Spectral Mixture Analysis (SMA) (linear spectral unmixing). This analysis identifies for each Landsat pixel its fraction of soil (S), active photosynthetic vegetation (PV), and non-photosynthetic vegetation (senescent) (NPV). We carried out the SMA of the Landsat images using CLASlite [16], based on the AutoCMU algorithm and a spectral library containing more than 250,000 endmembers. Then, an index similar to the Normalized Difference Fraction Index (NDFI) [36] was calculated (Fraction Index = PV − (NPV + S)/PV + NPV + S) to enhance the contrast between the forest and the senescent vegetation. We identified a threshold in the Fraction Index of <0.56, which allows for the accurate identification of logging gaps.
Third, to avoid confusion between logging gaps and natural gaps (for example, due to windfalls), we considered that for the optimization of the logistical logging operations of timber extraction by skidder, the logging activities are carried out within a maximum radius of 500 m around logging tracks and log landings. So, a 500 m buffer around each logging track and log landing identified in step 1 was applied, and only the gaps inside this buffer were considered as logging gaps.
Finally, we gathered all these data and obtained for each year a forest disturbance map of the study area in terms of canopy openings (logging tracks, log landing, and logging gaps). To validate the identification, we used Cikel forest management plan and Global Positioning System (GPS) ground controls points taken in Paragominas in May 2015 which characterize the gradient of disturbed forest.

3.3. Development of Indicators of Forest Disturbance through Time Due to Logging

We used the R package “SpatialEco” (Spatial Analysis and Modelling) to calculate landscape metrics of forest disturbance in terms of canopy openings for each plot and each year drawing on the metrics used in landscape ecology (i.e., number of disturbed patches, patch density, average size of patches, edge density, shape factor, etc.). Then, to monitor each plot’s evolution of logging impacts through time, we developed temporal indicators which synthetize the evolution of these landscape metrics during the whole study period (1994–2009). As the level of disturbance of the forest depends strongly on the spatial extent and the occurrence of the logging impacts, we implemented spatial and temporal indicators that inform about both the intensity and the frequency of the impacts during the study period. We have selected four indicators that better describe the observed evolution of forest disturbance.
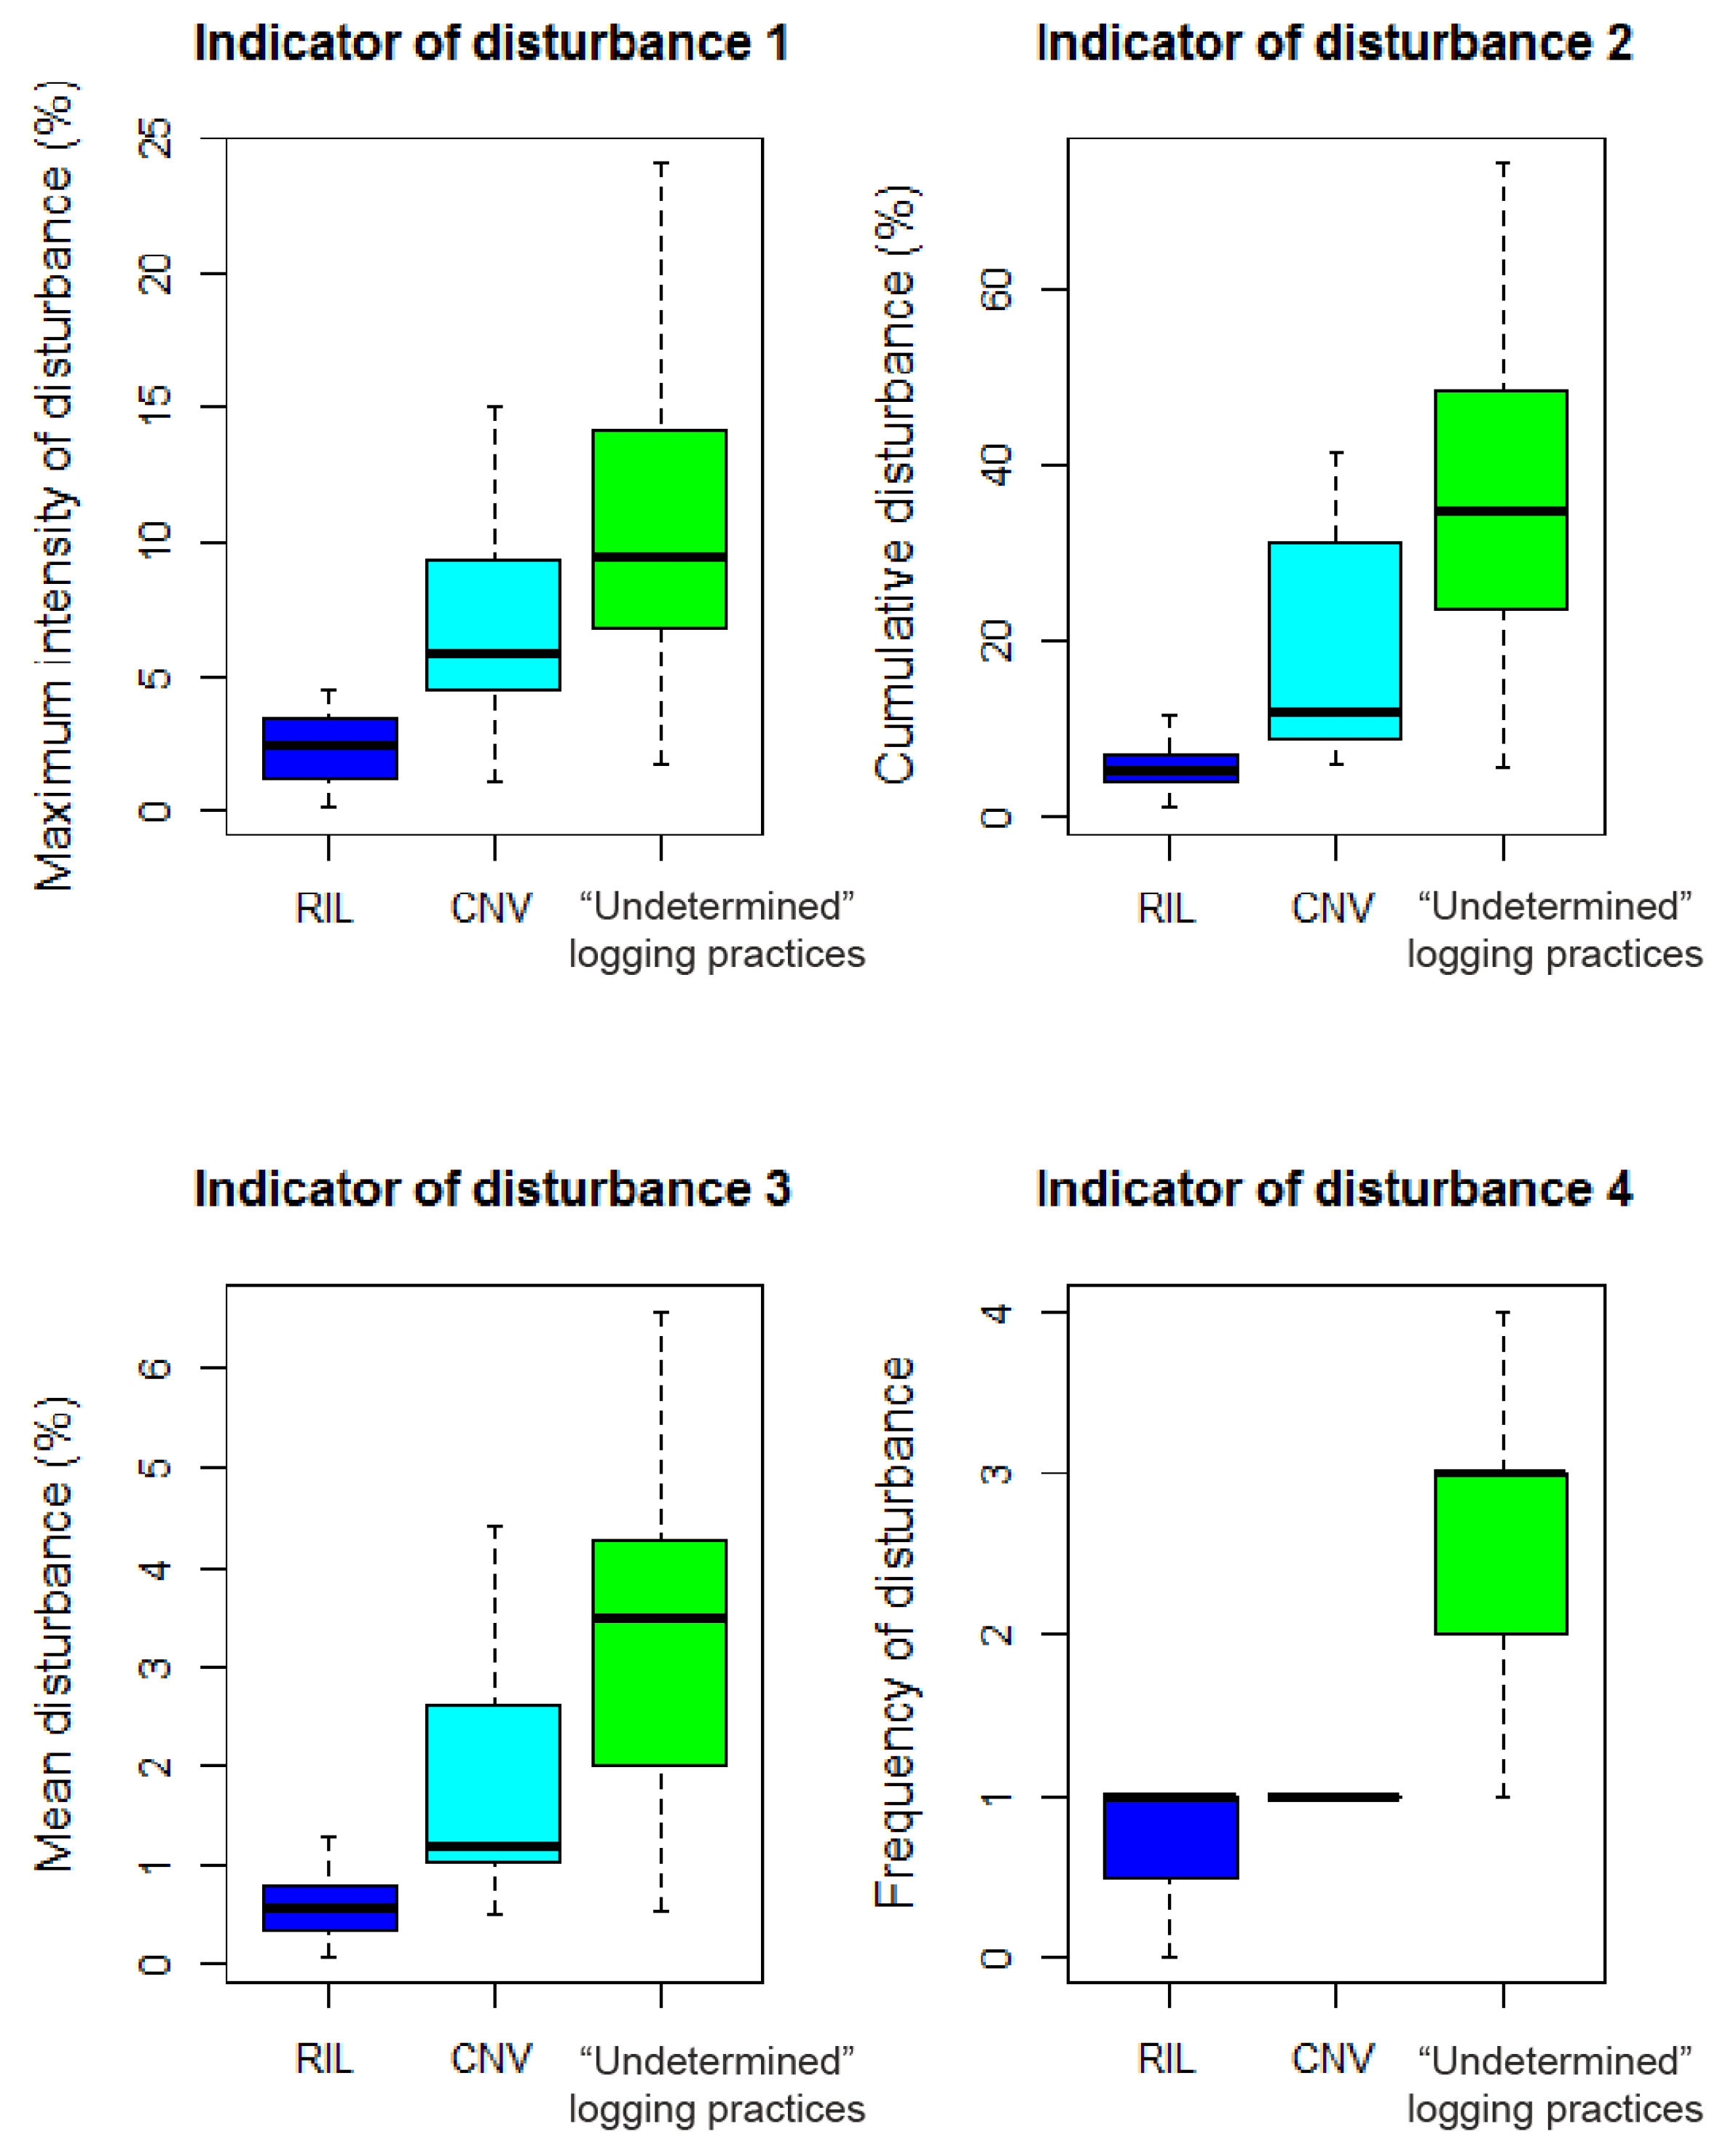
  • Maximum intensity of disturbance (%): maximum area of the plots which has been disturbed in one year during the study period (in proportion to the plot’s total area);
  • Cumulative disturbance (%): sum of the area disturbed each year during the whole study period (in proportion to the plot’s total area);
  • Mean disturbance (%): mean area disturbed over the study period (in proportion to the plot’s total area);
  • Frequency of disturbance: how many times the forest cover underwent a disturbance impact of more than 1% of the total plot extent over the study period.

3.4. Statistical Analysis

To describe the different patterns of forest disturbance through time in function of the disturbance indicators, we used Principal Component Analysis (PCA) on the R free software (R Development Core Team, 2016). Then we classified the studied plots using cluster analysis (Ascending Hierarchical clustering (AHC) with the Ward criterion (R package FactoMineR, Ade4, and Cluster)). In order to understand how each cluster is different from the others, we used the “catdes” function of the package FactoMineR which describes the different clusters by the variables (i.e., the mean in the category, the overall mean, sd in category, and overall sd).

4. Results

4.1. Distinct Disturbance Patterns in Function of Forest Management Types

We compared the disturbance indicators over a fifteen year period for 81 forested plots representing three distinct forest management types: the CNV annual logging plots (17 plots), the RIL logging plots (19 plots), and the plots without information of forest management practices (45 plots), located in private forested rural property. The four indicators of disturbance were higher in the logging plots without information of forest management practices than in the CNV and RIL plots (Figure 4).
For example, indicator 2, cumulative disturbance during the fifteen year period, was on average only 5% in RIL logging plots, while it was 12% in CNV logging plots, and it reached 35% in “undetermined” logging practices plots (Figure 4, indicator 2). During the 15 year period, RIL and CNV plots were logged only once (frequency of disturbance = 1), while during the same period, logging plots with “undetermined” logging practices were logged almost three times (Figure 4, indicator 4). This clearly indicated that these plots were illegally logged.
In the plots managed by the forestry company Cikel, the comparison of the four indicators in plots logged under CNV and those under RIL (certified forest management) clearly shows the positive effect of RIL techniques in reducing the impacts of logging in terms of canopy openings: the three main indicators of disturbance (maximum intensity, mean disturbance, and cumulative disturbance) were lower in RIL plots. However, the logging techniques (CNV and RIL) had no effects on the frequency of disturbance (indicator 4), demonstrating that the forestry company follows the forest regulation in terms of rotation length or harvest cycle (Figure 4).

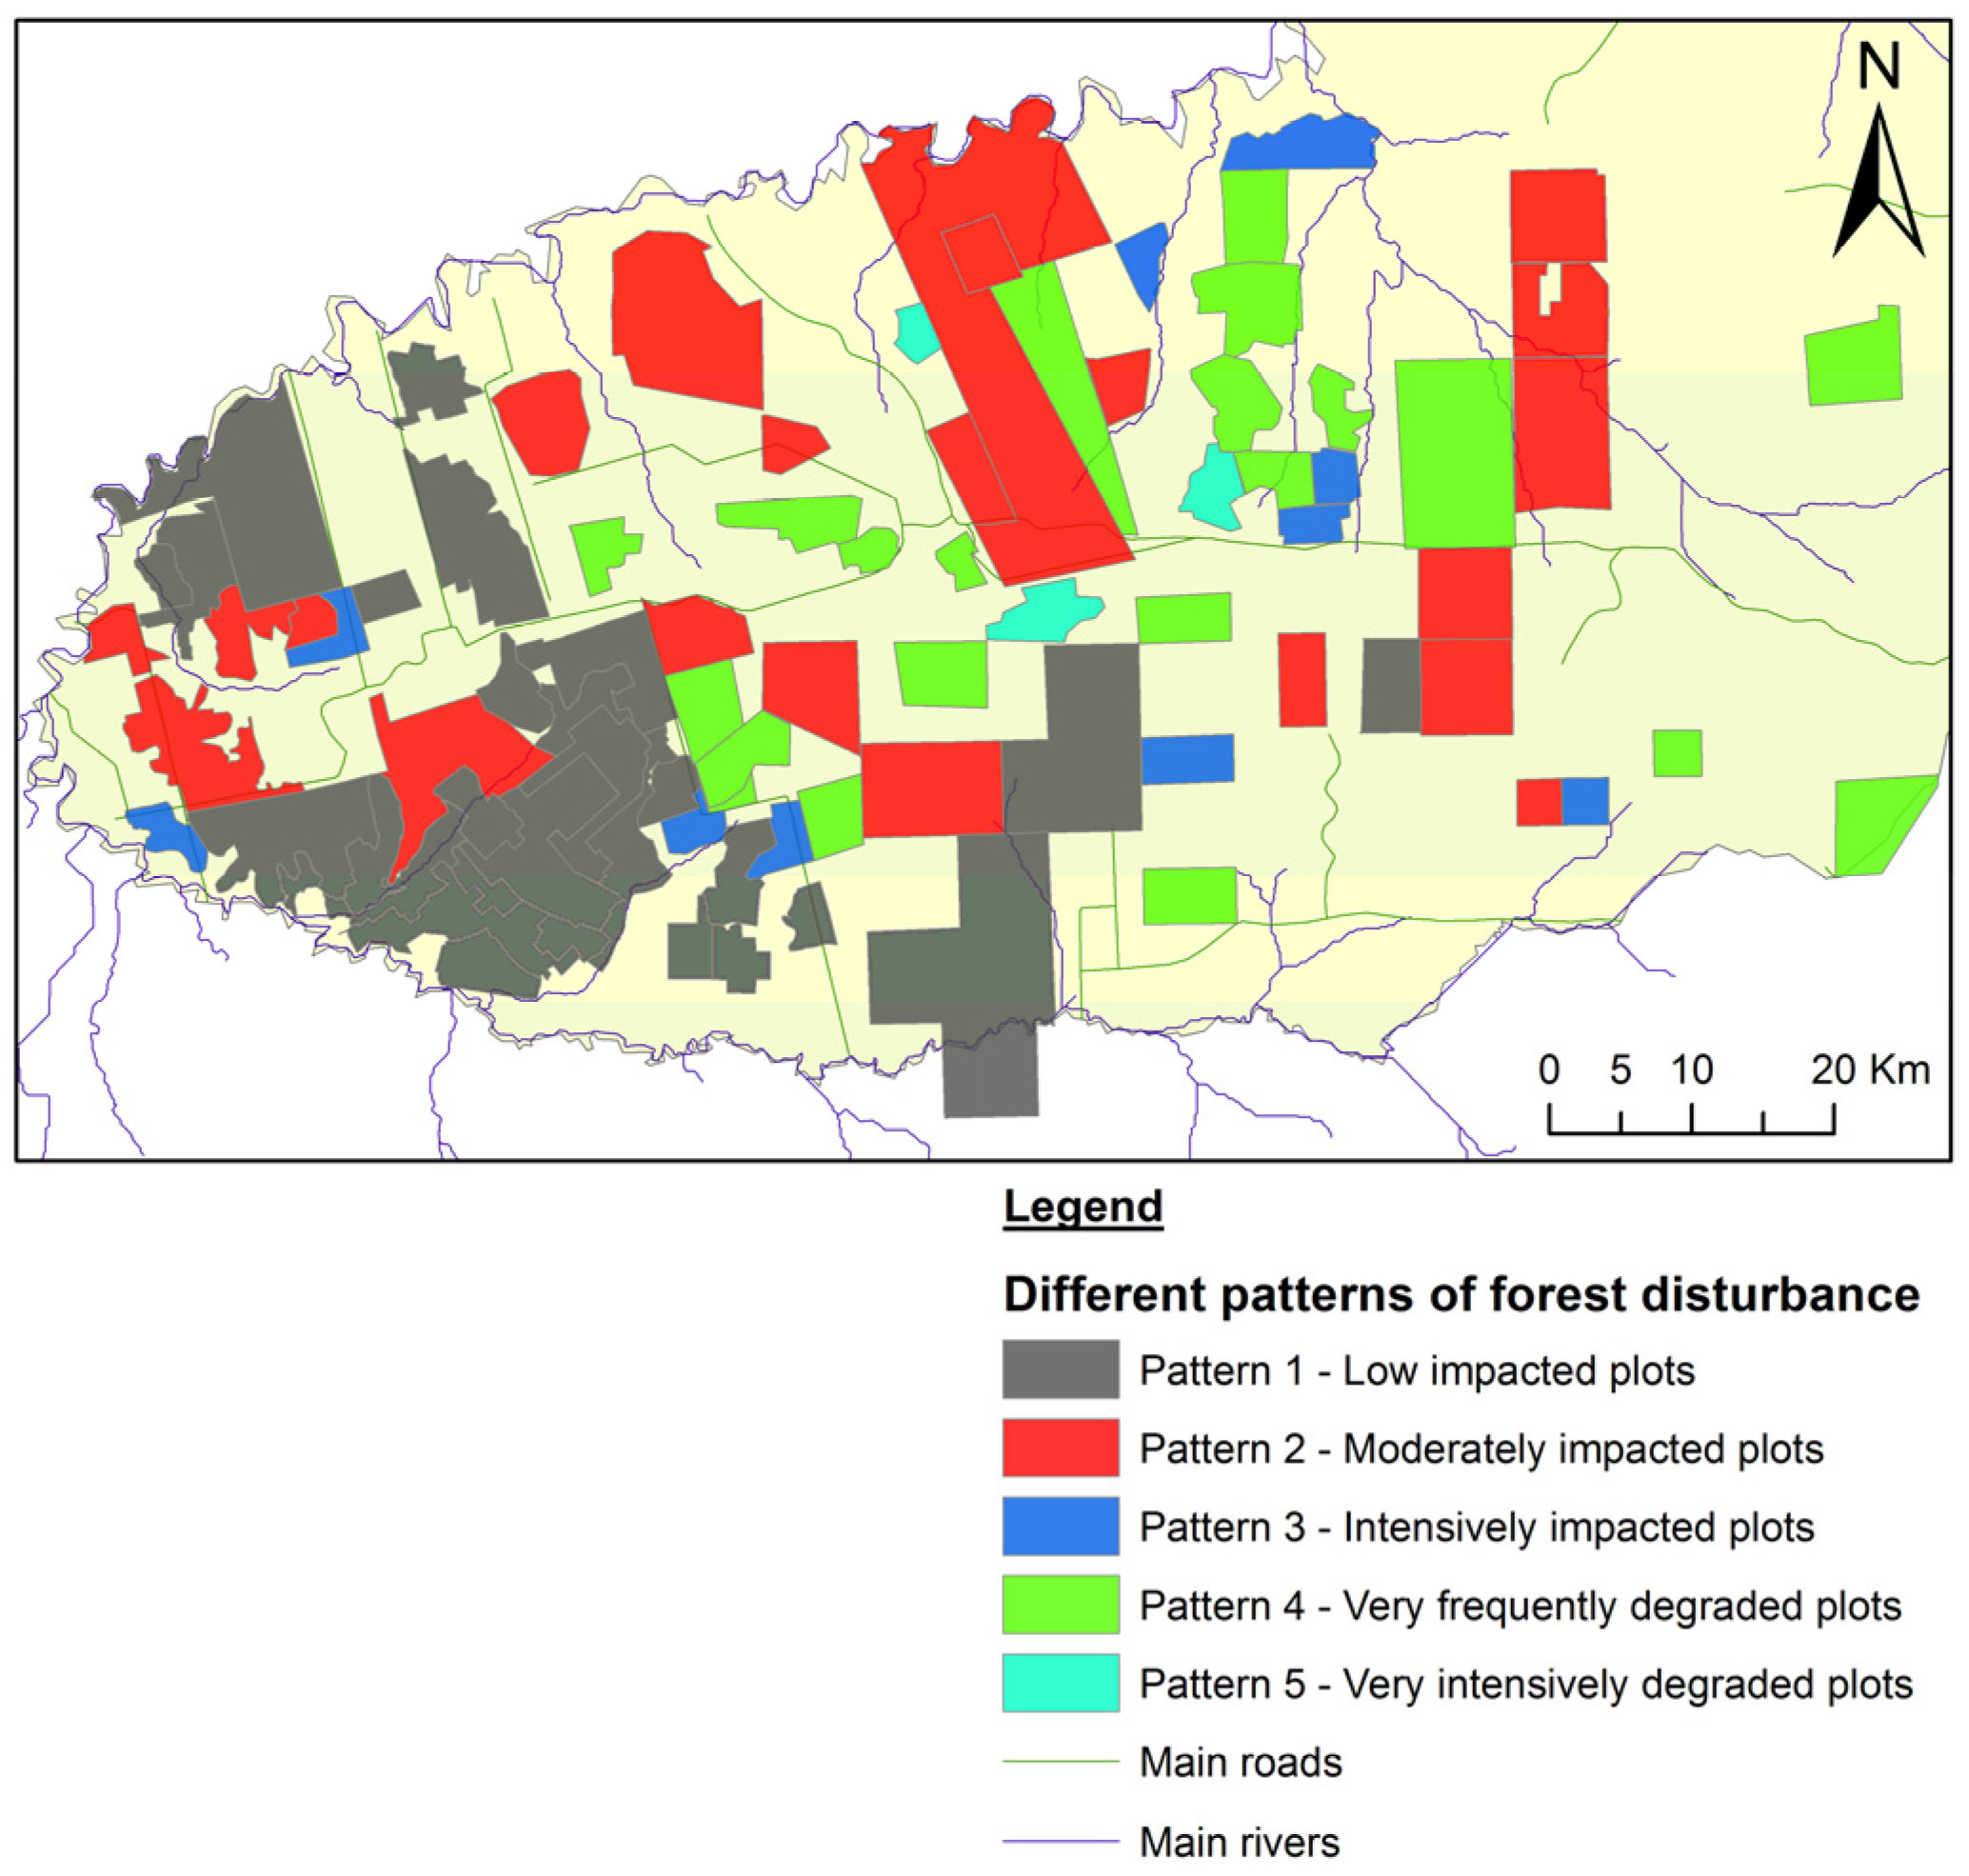
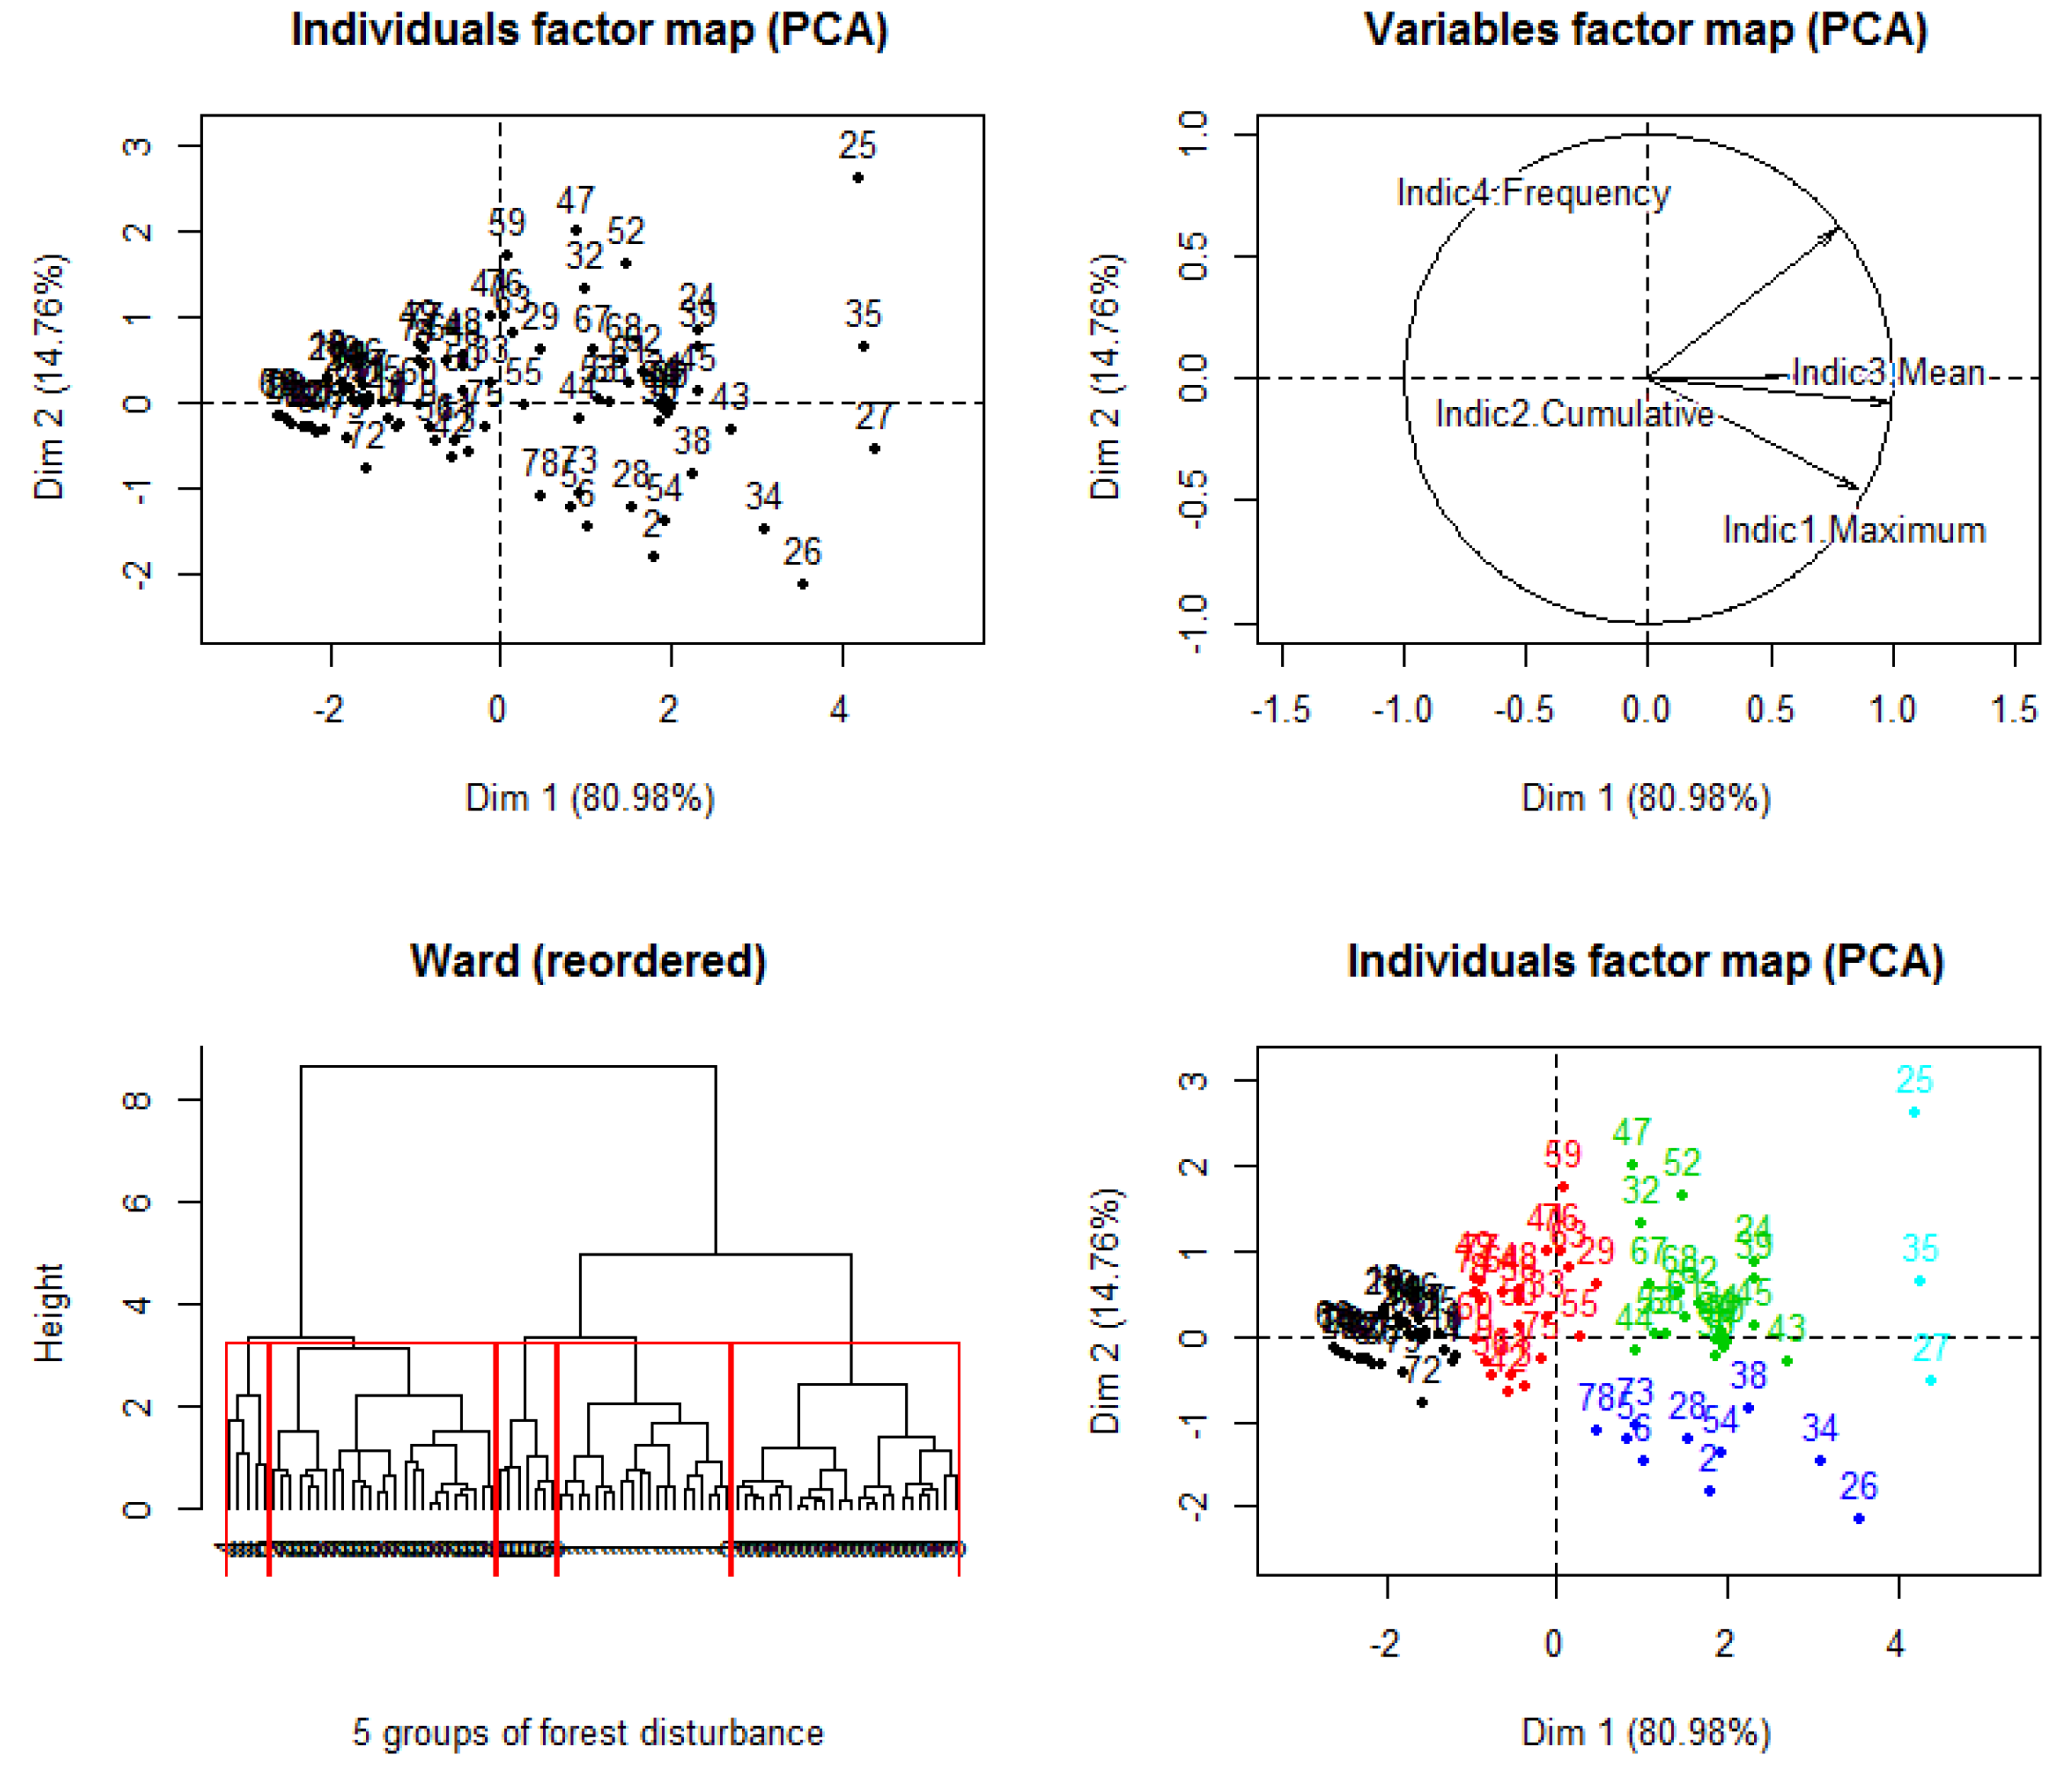
4.2. Different Patterns of Forest Disturbance Occurring in Paragominas

Independent of forest management techniques, we seek to characterize the different spatial and temporal patterns of forest disturbance occurring in the studied plots through time. Thus, we can address the heterogeneity of the forest management practices happening in the plots with “undetermined” logging practices. We performed principal component analyses according to the four mains indicators of disturbance and made a hierarchical cluster analysis with the Ward’s minimum variance criterion, which minimizes the total within-cluster variance (Figure 5).
The analysis identified five groups which are statistically different and which correspond to distinct patterns of forest disturbance in the plots over the 15 year period (Figure 5):
  • Pattern 1 “Low impacted plots” (dark group, n = 27 plots): These plots are characterized by lower scores for all the disturbance indicators. Over the fifteen year period, the average maximum disturbance was 2.6%, with a cumulative disturbance of 5.8% and a mean disturbance of 0.6%. These kinds of values suggest that these plots have been managed with RIL techniques, producing small canopy openings which are quickly closed.
  • Pattern 2 “Moderately impacted plots” (red group, n = 22 plots): These plots have suffered more disturbance than the plots of pattern 1, but they are still characterized by lower mean values than the overall mean. For example, the average maximum of disturbance was only 6.0% and the cumulative disturbance over the fifteen year period was 20.2%. These kinds of values suggest that these plots have been managed with conventional logging techniques.
  • Pattern 3 “Intensively impacted plots” (dark blue group, n = 10 plots): These plots are different from the others due to their higher score for the maximum disturbance indictor (average maximum of disturbance of the group was 19.2%). As such, these plots have suffered one intensive timber harvest with high damages in the canopy cover. Due to these damages, the recovery was low, and so the cumulative disturbance over the fifteen year period was high (average cumulative disturbance of the group was 40.2%).
  • Pattern 4 “Very frequently degraded plots” (green group, n = 19 plots): These plots are different from the others due to their higher score for the frequency of disturbance indicator. On average, these plots have suffered three exploitations during the fifteen years period. However, the average maximum disturbance was lower than in pattern 3 with 10.8%, but due to the high frequency of disturbance, the cumulative disturbance over the period was higher (45.6%). These kinds of disturbance values shape a pattern of very frequent small to medium disturbances, typical of extractive timber practices for different purposes.
  • Pattern 5 “Very intensively degraded plots” (cyan group, n = 3 plots): These plots are different from the others due to their higher score for all the disturbance indicators. On average, they have suffered five impacts during the period, with a cumulative disturbance of 71.2%. These plots have been intensively degraded and regular harvests have occurred to exploit any wood resources, decreasing the forest resilience to surrounding fires.
This typology of forest disturbance patterns highlights the multiple types of logging and the disturbance gradient that occurred within a forest landscape. The spatial arrangement of the plots from each different forest disturbance pattern is illustrated in Figure 6.
We can see in Figure 6 that most of the forestry company plots correspond with patterns 1 and 2 of “low impacted” and “moderately impacted” forests. Actually, most of the plots classified in the “moderately impacted” pattern correspond to plots that have been logged before the FSC certification. Yet, for the plots with “undetermined” logging practices, the situation is very different. On one hand, it must be highlighted that almost one third of the plots correspond with pattern 2 of “moderately impacted”. Even if many improvements could be done in this type of forestry management (for example, in terms of the optimization of logging track networks and supervision in the falling direction of trees), it means that these plots are probably conventionally managed and concerned with a registered forest management plan and authorization (AUTEX). On the other hand, two thirds of these plots are very intensively and frequently logged (mix of patterns 3, 4, and 5), forming a mosaic of very disturbed forests with negative associated impacts to forest resilience and forest environmental services (e.g., biodiversity, carbon storage, and also protection of water courses).
Finally, only one plot with “undetermined” logging practices has been classified as “low impacted”, corroborating the results of Richardson and Peres [10] that sustainable and reduced impact logging is still far from widely implemented.

5. Discussion

These remote sensing disturbance indicators help with understanding the multiple types of logging activities occurring through time within a forest landscape. They clearly show an important disturbance gradient from well-preserved forests, forests managed with RIL techniques, to illegally over-logged forests.
We emphasized alarming results, identifying two patterns of very heavy forest degradation, with some forested plots having suffered more than three exploitations in fifteen years. The forest is repeatedly impacted: during the first logging event, bigger and more valuable commercial species are harvested, and then during the next harvests, smaller trees are harvested, as well as non-commercial timber species, for example, for charcoal or wooden post construction for cattle ranching. This pattern has also been identified by Richardson and Peres [10] who showed that in the State of Pará, the most prized and sought after timber species have been repeatedly mined to the point of subregional demographic collapse, in function of local demand conditions, physical access, land-tenure systems, and timber market prices. In the same sense, Ahmed and Ewers [37] showed that in the northwest of Pará State, in considering a total of 11 genera (Dicorynia, Goupia, Hymenaea, Hymenolobium, Manilkara, Mora, Nectandra, Peltogyne, Swartzia, Swietenia, and Tabebuia) the species with commercial value had become less common,. Moreover, in addition to the overexploitation of some timber species, such frequent disturbance events affect the integrity of canopy, soil, fauna, and the water cycle, and thus the resilience of the forest lowers leading to an impoverishment of the forest’s environmental services and a higher vulnerability to surrounding fires. There are also increased rates of hunting [38]. Local stakeholders should be aware of the low environmental value of these degraded forest landscapes and the risk to reach a stage of “arrested succession”, a tipping-point where ecological processes that underlie forest dynamics are severely constrained and external intervention is required to recover successional dynamics [39].
At the opposite end of the spectrum, the indicators evidenced two patterns of low disturbances, corresponding to well-managed forests with RIL. This showed the efficiency of the RIL techniques and the FSC certification requirements to reduce the impacts of logging in terms of canopy openings [40]. In terms of maintenance of species of different taxonomic groups, according to Chaudhary et al. [41]—who made a review of 287 published studies containing 1008 comparisons around the world—RIL is also the more effective logging forest management regime for the preservation of birds, arthropods, plants, and amphibians, although it somewhat reduced the presence of mammals. However, one should keep in mind that the rapid closure of the canopy detected from remote sensing images is due to rapid growth species with high photosynthetic activity. For the above ground biomass, the forest will need several years to recover [42].
Finally, our indicators showed that the patterns of forest disturbance through time are much more favorable for forest cover inside a logging company with a FSC certified forest management plan than outside, where many actors mine the forest resources without any concerns for future stocks. This figure emphasizes the need to promote legal logging activities with RIL and sustainable forest management plans to keep the forests from others’ predatory uses. However, one should keep in mind that the promotion of legal logging activities should be tied to the real improvement of environmental governance and law enforcement efforts [43] in order to ensure the compliance of forest management plans. In fact, some studies have noted that the attribution of government-sanctioned authorizations for annual logging harvest (AUTEX) do not ensure compliance [10,44,45]. For example, the volume of high commercial value species could be overestimated in the inventories, so that legal logging areas could act as centers for laundering logs extracted in an illegal fashion from other areas, even protected areas. For these reasons, efforts should be pursued to track and reprehend illegal logging activities.
In this sense, the inexpensive and efficient remote sensing methodology that we developed represents a step forward as it produces easy to interpret indicators, which clearly differentiate the patterns of legal logging from illegal logging. Therefore, it could help pilot the environmental monitoring and controls of illegal logging. In relation to approved forest management plans, it could help monitor for compliance by focusing the in situ audit and inspections in the places where logging intensity looks higher than authorized. It could also help stakeholders dealing with international trade rules such as RBUE (wood regulation of European Union) and FLEGT licenses (Forest Law for Enforcement, Governance and Trade) which are aimed to combat illegal logging and associated trade.

6. Conclusions

The indicators of forest disturbance provide keys to understand the different patterns of forest disturbance of a given landscape and the current conditions of each disturbed forest. When associated with Geographic Information System (GIS) data, such as the Brazilian Rural Environmental Cadastre (CAR), it offers an applied tool to understand the impacts and corresponding responsibilities of different land use practices and actors on the modelling of the current forest landscape. Approaches using cell grids could also represent an interesting manner in which to characterize spatial and temporal patterns of forest degradation at a landscape scale without having knowledge of the local land tenure [46].
The set of indicators we developed is adequate to monitor forest disturbances through time and to provide guidance to policy-makers for the better management of forest resources. As these indicators are operational and inexpensive, they could provide a useful tool to monitor forest disturbance, whether for certification compliance audits or for local actors to make them aware of the patterns of disturbance of their forest over a specific time period.
Finally, the recent launch of the Sentinel 2 sensor, which offers better spatial and temporal resolution and freely available data, opens up opportunities to up-scale the method at a regional level. Thereby, we could better understand the different patterns of forest disturbance shaping the forest landscapes at the regional level, which is essential not only for the promotion of integrated landscape management, but also for better addressing the carbon losses linked to the process of forest degradation. As carbon losses caused by forest degradation depend on the intensity and persistence of human-induced disturbances through time [47], it seems essential that future research on the relationships between forest degradation and carbon losses foster discussion and analysis of spatial and temporal patterns of forest degradation [46].

Acknowledgments

The authors wish to thank the Tropical managed Forests Observatory (TmFO) project funded by the Forest, Tree and Agroforestry (FTA) research program of the Consultative Group on International Agricultural Research (CGIAR), the project ECOTERA, funded by the French National Agency for Research (ANR) (grant agreement ANR-13-AGRO-0003), and the GUIAMAFLOR project, funded by the Guyamazon program. They are also grateful to the two anonymous reviewers for their constructive comments, which helped to improve the manuscript.

Author Contributions

All authors contributed to the conceptual development and methodology for the paper.

Conflicts of Interest

The authors declare no conflict of interest.

References

  1. Edwards, D.P.; Tobias, J.A.; Sheil, D.; Meijaard, E.; Laurance, W.F. Maintaining ecosystem function and services in logged tropical forests. Trends Ecol. Evol. 2014, 29, 511–520. [Google Scholar] [CrossRef] [PubMed]
  2. Asner, G.P.; Rudel, T.K.; Aide, T.M.; Defries, R.; Emerson, R. A Contemporary Assessment of Change in Humid Tropical Forests. Conserv. Biol. 2009, 23, 1386–1395. [Google Scholar] [CrossRef] [PubMed]
  3. Asner, G.P.; Knapp, D.E.; Broadbent, E.N.; Oliveira, P.J.C.; Keller, M.; Silva, J.N. Selective logging in the Brazilian Amazon. Science 2005, 310, 480–482. [Google Scholar] [CrossRef] [PubMed]
  4. Barlow, J.; Lennox, G.D.; Ferreira, J.; Berenguer, E.; Lees, A.C.; Mac Nally, R.; Thomson, J.R.; Ferraz, S.F.; Louzada, J.; Oliveira, V.H.; et al. Anthropogenic disturbance in tropical forests can double biodiversity loss from deforestation. Nature 2016, 535, 144–147. [Google Scholar] [CrossRef] [PubMed]
  5. Lewis, S.L.; Edwards, D.P.; Galbraith, D. Increasing human dominance of tropical forests. Science 2015, 349, 827–832. [Google Scholar] [CrossRef] [PubMed]
  6. Souza, C., Jr.; Siqueira, J.V.; Sales, M.H.; Fonseca, A.V.; Ribeiro, J.G.; Numata, I.; Cochrane, M.A.; Barber, C.P.; Roberts, D.A.; Barlow, J. Ten-Year Landsat Classification of Deforestation and Forest Degradation in the Brazilian Amazon. Remote Sens. 2013, 5, 5493–5513. [Google Scholar] [CrossRef]
  7. Gibbs, H.K.; Ruesch, A.S.; Achard, F.; Clayton, M.K.; Holmgren, P.; Ramankutty, N.; Foleyl, J.A. Tropical forests were the primary sources of new agricultural land in the 1980s and 1990s. Proc. Natl. Acad. Sci. USA 2010, 107, 16732–16737. [Google Scholar] [CrossRef] [PubMed]
  8. Putz, F.E.; Zuidema, P.A.; Synnott, T.; Peña-Claros, M.; Pinard, M.A.; Sheil, D.; Vanclay, J.K.; Sist, P.; Gourlet-Fleury, S.; Griscom, B.; et al. Sustaining conservation values in selectively logged tropical forests: The attained and the attainable. Conserv. Lett. 2012, 5, 296–303. [Google Scholar] [CrossRef]
  9. Bustamante, M.M.C.; Roitman, I.; Aide, T.M.; Alencar, A.; Anderson, L.O.; Aragão, L.; Asner, G.P.; Barlow, J.; Berenguer, E.; Chambers, J.; et al. Toward an integrated monitoring framework to assess the effects of tropical forest degradation and recovery on carbon stocks and biodiversity. Glob. Chang. Biol. 2016, 22, 92–109. [Google Scholar] [CrossRef] [PubMed]
  10. Richardson, V.A.; Peres, C.A. Temporal Decay in Timber Species Composition and Value in Amazonian Logging Concessions. PLoS ONE 2016, 11, e0159035. [Google Scholar] [CrossRef] [PubMed]
  11. Gerwing, J.J. Degradation of forests through logging and fire in the eastern Brazilian Amazon. For. Ecol. Manag. 2002, 157, 131–141. [Google Scholar] [CrossRef]
  12. Pacheco, P.; Mejía, E.; Cano, W.; de Jong, W. Smallholder Forestry in the Western Amazon: Outcomes from Forest Reforms and Emerging Policy Perspectives. Forests 2016, 7, 193. [Google Scholar] [CrossRef]
  13. Piketty, M.-G.; Drigo, I.; Sablayrolles, P.; de Aquino, E.A.; Pena, D.; Sist, P. Annual Cash Income from Community Forest Management in the Brazilian Amazon: Challenges for the Future. Forests 2015, 6, 4228–4244. [Google Scholar] [CrossRef] [Green Version]
  14. Sist, P.; Rutishauser, E.; Peña-Claros, M.; Shenkin, A.; Herault, B.; Blanc, L.; Baraloto, C.; Baya, F.; Benedet, F.; Da Silva, K.E.; et al. The Tropical managed Forests Observatory: A research network addressing the future of tropical logged forests. Appl. Veg. Sci. 2015, 18, 171–174. [Google Scholar] [CrossRef]
  15. Rutishauser, E.; Hérault, B.; Baraloto, C.; Blanc, L.; Descroix, L.; Sotta, E.D.; Ferreira, J.; Kanashiro, M.; Mazzei, L.; d’Oliveira, M.V.N.; et al. Rapid tree carbon stock recovery in managed Amazonian forests. Curr. Biol. 2015, 25, 787–788. [Google Scholar] [CrossRef] [PubMed]
  16. Asner, G.P.; Knapp, D.E.; Balaji, A.; Páez-Acosta, G. Automated mapping of tropical deforestation and forest degradation: CLASlite. J. Appl. Remote Sens. 2009, 3, 033543. [Google Scholar] [CrossRef]
  17. Asner, G.P.; Broadbent, E.N.; Oliveira, P.J.C.; Keller, M.; Knapp, D.E.; Silva, J.N.M. Condition and fate of logged forests in the Brazilian Amazon. Proc. Natl. Acad. Sci. USA 2006, 103, 12947–12950. [Google Scholar] [CrossRef] [PubMed]
  18. Bourbier, L.; Cornu, G.; Pennec, A.; Brognoli, C.; Gond, V. Large-scale estimation of forest canopy opening using remote sensing in Central Africa. Bois For. Trop. 2013, 1, 3–9. [Google Scholar]
  19. French Space Agency (CNES). Orfeo ToolBox, Open Source Processing of Remote Sensing Images. Available online: https://www.orfeo-toolbox.org (accessed on 1 February 2016).
  20. Souza, C. Mapping forest degradation in the Eastern Amazon from SPOT 4 through spectral mixture models. Remote Sens. Environ. 2003, 87, 494–506. [Google Scholar] [CrossRef]
  21. Gond, V.; Guitet, S. Elaboration d’un diagnostic post-exploitation par télédétection spatiale pour la gestion des forets de Guyane. Bois For. Trop. 2009, 299, 6–9. [Google Scholar]
  22. Pithon, S.; Jubelin, G.; Guitet, S.; Gond, V. A statistical method for detecting logging-related canopy gaps using high-resolution optical remote sensing. Int. J. Remote Sens. 2013, 34, 700–711. [Google Scholar] [CrossRef]
  23. Asner, G.P.; Powell, G.V.N.; Mascaro, J.; Knapp, D.E.; Clark, J.K.; Jacobson, J.; Kennedy-Bowdoina, T.; Balajia, A.; Paez-Acostaa, G.; Victoriac, E.; et al. High-resolution forest carbon stocks and emissions in the Amazon. Proc. Natl. Acad. Sci. USA 2010, 107, 16738–16742. [Google Scholar] [CrossRef] [PubMed]
  24. Leisher, C.; Touval, J.; Hess, S.M.; Boucher, T.M.; Reymondin, L. Land and Forest Degradation inside Protected Areas in Latin America. Diversity 2013, 5, 779–795. [Google Scholar] [CrossRef]
  25. International Center for Tropical Agricuture. Terra-I, an Eye on Habitat Change. Available online: http://www.terra-i.org (accessed on 8 September 2016).
  26. Diniz, C.G.; de Almeida Souza, A.A.; Santos, D.C.; Dias, M.C.; da Luz, N.C.; de Moraes, D.R.V.; Maia, J.S.; Gomes, A.R.; da Silva Narvaes, I.; Valeriano, D.M.; et al. DETER-B: The New Amazon near Real-Time Deforestation Detection System. IEEE J. Sel. Top. Appl. Earth Obs. Remote Sens. 2015, 8, 3619–3628. [Google Scholar] [CrossRef]
  27. World Resources Institute. Global Forest Watch: Monitoring Forests in Near Real Time. Available online: http://www.globalforestwatch.org (accessed on 8 September 2016).
  28. Logging Roads. Available online: http://loggingroads.org/ (accessed on 8 September 2016).
  29. Tritsch, I.; Le Tourneau, F.-M. Population densities and deforestation in the Brazilian Amazon: New insights on the current human settlement patterns. Appl. Geogr. 2016, 76, 163–172. [Google Scholar] [CrossRef]
  30. Guimarães, J.; Veríssimo, A.; Amaral, P.; Demachki, A. Municípios Verdes: Caminhos Para a Sustentabilidade, 2nd ed.; Imazon: Belém, Brazil, 2011. [Google Scholar]
  31. Viana, C.; Coudel, E.; Barlow, J.; Ferreira, J.; Gardner, T.; Parry, L. From Red to Green: Achieving an Environmental Pact at the Municipal Level in Paragominas (Pará, Brazilian Amazon). Available online: http://agritrop-prod.cirad.fr/567220/1/document_567220.pdf (accessed on 10 July 2016).
  32. Sist, P.; Ferreira, F.N. Sustainability of reduced-impact logging in the Eastern Amazon. For. Ecol. Manag. 2007, 243, 199–209. [Google Scholar] [CrossRef]
  33. Tropical Managed Forests Observatory. Available online: http://www.tmfo.org/ (accessed on 2 October 2016).
  34. United States Geological Survey. GLOVIS: The USGS Global Visualization Viewer. Available online: https://www.glovis.usgs.org (accessed on 9 September 2015).
  35. Instituto Nacional de Pesquisas Espaciais (INPE). Projeto PRODES: Monitoramento da Floresta Amazônica Brasileira por Satélite. Available online: http://www.obt.inpe.br/prodes/index.php (accessed on 10 February 2016).
  36. Souza, C.M.; Roberts, D.A.; Cochrane, M.A. Combining spectral and spatial information to map canopy damage from selective logging and forest fires. Remote Sens. Environ. 2005, 98, 329–343. [Google Scholar] [CrossRef]
  37. Ahmed, S.E.; Ewers, R.M. Spatial Pattern of Standing Timber Value across the Brazilian Amazon. PLoS ONE 2012, 7, e36099. [Google Scholar] [CrossRef] [PubMed]
  38. Matricardi, E.A.T.; Skole, D.L.; Pedlowski, M.A.; Chomentowski, W. Assessment of forest disturbances by selective logging and forest fires in the Brazilian Amazon using Landsat data. Int. J. Remote Sens. 2013, 34, 1057–1086. [Google Scholar] [CrossRef]
  39. Ghazoul, J.; Burivalova, Z.; Garcia-Ulloa, J.; King, L. Conceptualizing Forest Degradation. Trends Ecol. Evol. 2015, 30, 622–632. [Google Scholar] [CrossRef] [PubMed]
  40. Putz, F.E.; Sist, P.; Fredericksen, T.; Dykstra, D. Reduced-impact logging: Challenges and opportunities. For. Ecol. Manag. 2008, 256, 1427–1433. [Google Scholar] [CrossRef]
  41. Chaudhary, A.; Burivalova, Z.; Koh, L.P.; Hellweg, S. Impact of Forest Management on Species Richness: Global Meta-Analysis and Economic Trade-Offs. Sci. Rep. 2016, 6, 23954. [Google Scholar] [CrossRef] [PubMed]
  42. Kleinschroth, F.; Healey, J.R.; Sist, P.; Mortier, F.; Gourlet-Fleury, S. How persistent are the impacts of logging roads on Central African forest vegetation? J. Appl. Ecol. 2016, 53, 1127–1137. [Google Scholar] [CrossRef]
  43. Tritsch, I.; Arvor, D. Transition in environmental governance in the Brazilian Amazon: Emergence of a new pattern of socio-economic development and deforestation. Land Use Policy 2016, 59, 446–455. [Google Scholar] [CrossRef]
  44. Greenpeace. The Amazon’s Silent Crisis; Greenpeace: São Paulo, Brazil, 2014; p. 56. Available online: http://www.stuttgart.greenpeace.de/sites/www.stuttgart.greenpeace.de/files/amazon_silent_crisis_all.pdf (accessed on 3 September 2016).
  45. Casseb, B.S. Uso de Geotecnologia para Controle e Monitoramento de Extração de Madeira no Estado do Pará: Estudo de Caso dos Municípios de Paragominas e Santarém; Trabalho de Conclusão de Curso, Universidade Federal Rural da Amazônia: Belém, Brazil, 2016; p. 45. [Google Scholar]
  46. Pinheiro, T.F.; Escada, M.I.S.; Valeriano, D.M.; Hostert, P.; Gollnow, F.; Müller, H. Forest Degradation Associated with Logging Frontier Expansion in the Amazon: The BR-163 Region in Southwestern Pará, Brazil. Earth Interact. 2016, 20, 1–26. [Google Scholar] [CrossRef]
  47. Herold, M.; Skutsch, M. Monitoring, reporting and verification for national REDD + programmes: Two proposals. Environ. Res. Lett. 2011, 6, 14002. [Google Scholar] [CrossRef]
Figure 1. Localization of the studied plots in the municipality of Paragominas.
Forests 07 00315 g001
Figure 2. Extract of a spectral un-mixed Landsat image (30 m spatial resolution) illustrating two different patterns of forest disturbance (displayed in color composite Red Green Blue: Soil; Active Photosynthetic Vegetation; Non-photosynthetic Vegetation). (A) Illustrates a pattern of conventional logging with a symmetric spatial arrangement of the impacts organized around primary and secondary logging roads; (B) represents a pattern of illegal logging with an anarchical spatial organization and high damage in the canopy cover.
Forests 07 00315 g002
Figure 3. Remote sensing methodology to detect forest disturbance in terms of canopy openings. First, the logging tracks and log landings are identified using spectral indices to enhance bare soil. Second, logging gaps are identified using spectral un-mixing and fraction indices to enhance senescent vegetation. Third, to avoid confusion between logging gaps and natural gaps, only gaps situated within a maximum distance of 500 m around logging tracks and log landings are considered as logging gaps. Finally, all these data are gathered to obtain a forest disturbance map of the study area for each year.
Forests 07 00315 g003
Figure 4. Disturbance indicators in function of forest management techniques for a 15 year period. (i) In dark blue: plots with Reduced Impact Logging (RIL) practices; (ii) in cyan: plots with conventional management (CNV) practices; and (iii) in green: plots with “undetermined” logging practices (the plots are situated in private forested rural properties registered in the CAR (Rural Environmental Cadastre—Cadastro Ambiental Rural).
Forests 07 00315 g004
Figure 5. Principal component analysis (PCA) and hierarchical cluster analysis with the Ward’s minimum variance criterion according to the four main indicators of disturbance for the 81 plots and the identification of five groups of forest disturbance.
Forests 07 00315 g005
Figure 6. Map of the five different patterns of forest disturbance occurring in the 81 studied plots to the southwestern of the municipality of Paragominas.
Forests 07 00315 g006

