Article

Soil CO2 Efflux and Root Productivity in a Switchgrass and Loblolly Pine Intercropping System

1
Department of Plant and Soil Science, University of Vermont, 230 Jeffords Hall, Burlington, VT 05405, USA
2
Department of Forest Resources and Environmental Conservation, Virginia Tech, 313 Cheatham Hall, Blacksburg, VA 24061, USA
3
Production Forestry Research Manager and Senior Scientist, Weyerhaeuser Company, Northern Timberlands Strategy and Technology, Springfield, OR 97478, USA
4
Department of Forestry and Environmental Resources, North Carolina State University, 3122 Jordan Hall, Raleigh, NC 27607, USA
*
Author to whom correspondence should be addressed.
Forests 2016, 7(10), 221; https://doi.org/10.3390/f7100221
Submission received: 1 August 2016 / Revised: 13 September 2016 / Accepted: 23 September 2016 / Published: 30 September 2016

Abstract

:
Switchgrass intercropped with loblolly pine plantations can provide valuable feedstock for bioenergy production while providing ancillary benefits like controlling competing vegetation and enhancing soil C. Better understanding of the impact of intercropping on pine and switchgrass productivity is required for evaluating the long-term sustainability of this agroforestry system, along with the impacts on soil C dynamics (soil CO2 efflux; RS). RS is the result of root respiration (RA) and heterotrophic respiration (RH), which are used to estimate net C ecosystem exchange. We measured RS in intercropped and monoculture stands of loblolly pine (Pinus taeda L.) and switchgrass (Panicum virgatum L.). The root exclusion core technique was used to estimate RA and RH. The results showed pure switchgrass had significantly higher RS rates (July, August and September), root biomass and length relative to intercropped switchgrass, while there were no significant changes in RS and roots between intercropped and monoculture loblolly pine stands. A significant decrease in switchgrass root productivity in the intercropped stands versus monoculture stands could account for differences in the observed RS. The proportions of RS attributed to RA in the intercropped stand were 31% and 22% in the summer and fall respectively, indicating that the majority of the RS was heterotrophic-driven. Ancillary benefits provided by planting switchgrass between unutilized pine rows can be considered unless the goal is to increase switchgrass production.

1. Introduction

Economic and national security concerns as a result of dependence on fossil fuels have led to the development of alternative sources of renewable energy, including bioenergy and biofuels. The U.S. Department of Energy (DOE), partnering with the U.S. Department of Agriculture (USDA), selected switchgrass (Panicum virgatum L.) as the model feedstock to be used for bioenergy production, particularly in the southeastern U.S. [1], where the favorable climate of the region could lead to high productivity of this native, perennial crop. Switchgrass is a fast growing crop that can be harvested annually as a sustainable source for renewable transportation fuel and/or biomass-derived electricity production [2]. Switchgrass accumulates high biomass, both below- and aboveground. It has low phosphorus requirements [3,4], high nitrogen (N) and water use efficiency, and tolerates diverse climatic conditions [5]. As a result, managing switchgrass stands can be less intensive with respect to fertilization and energy consumption compared to corn, which is currently the primary source of biofuel [6].
The southeastern U.S. is a major producer of wood and forest products [7], with 130,000 km2 of land currently dedicated to pine plantations comprised predominantly of loblolly pine (Pinus taeda L.) [8]. Early in stand development, the space and resources between the pine rows are largely unused. The interrow or interbed space offers a unique opportunity to manage additional commodity crops such as switchgrass [9], without significant changes to existing land-use. Income is diversified from the sale of wood and bioenergy products [10], while offering several environmental advantages. Switchgrass can help control competing, less valuable woody species, including volunteer loblolly pine. Switchgrass, by exploiting additional soil volume through its significant quantities of fine roots at depths of 1–2 m, contributes to soil organic C deeper in the profile [11,12]. Furthermore, soluble N losses can be prevented via switchgrass uptake during stages of stand development when the young pine trees may fail to capture all the available nutrients from the system.
One of the ecosystem services performed by intensively managed plantations is that they act as net sinks of C despite large fluxes of C out of the system during ecosystem respiration and as a result of fossil fuel C consumed during their management and harvest [13]. A large proportion of these respiratory losses originate from soil CO2 efflux (RS)—which comprises the second largest flux in the global C cycle [14], the magnitude of which strongly influences C storage within individual stands. RS is the sum of CO2 released by heterotrophic respiration (RH) and autotrophic root and mycorrhizal respiration (RA; [15,16,17]).
The magnitude of RS and the relative proportion of RH versus RA influences net ecosystem productivity (NEP). Such an understanding is critical in order to estimate C budgets under the different management scenarios in loblolly pine plantations. NEP is modeled from net primary production (NPP), but separate estimates of RA and RH are necessary (i.e., NEP = NPP-RH) [18]. However, estimating their relative contribution accurately has been one of the more difficult challenges in contemporary quantifications of the C cycle. Some extensively used methods to separate RS are trenching [15,19], or tree girdling [20], but they are time- and labor-intensive, result in large disturbances, and cannot be replicated easily within a site [15,21]. As an alternative to such techniques, Vogel and Valentine [22] designed small diameter (15.2 cm) root exclusion core inserts for separation of RS in spruce forests. This technique causes minimum land disturbance and is easy to replicate across a site. Similar to the premise of girdling, the core excludes the supply of new photosynthate to roots within the core, ultimately reducing RA. They found RA estimates within 1 to 3 weeks within the exclusion cores comparable to those made with trenched plots that had been in place for nearly 10 months.
The long-term effects of intercropping on the sustainability of managed forest ecosystems must also be evaluated through consistent monitoring of pine and switchgrass productivity (not to mention regrowth). The switchgrass lifespan is approximately 10 years [23], which coincides with the time generally required for pines to reach canopy closure [24] and reduce the amount of light reaching the forest floor. Although switchgrass is expected to be less competitive nearing crown closure, the specific timing of that shift should be monitored [25].
The specific objectives of this study were to quantify: (1) RS (and its components) in pine, switchgrass, and intercropped stands; (2) root dynamics (species-level biomass, surface area, length), and (3) the relationships between root parameters and respiratory components. Doing so will allow us to better predict the ecosystem C balance of these systems under alternate bioenergy management scenarios.

2. Materials and Methods

2.1. Site Description and Experimental Design

This study site is located near Dover on the lower Coastal Plain of North Carolina (35°15′ N, 77°28′ W), with a mean annual temperature of 17.3 °C, and mean annual precipitation of 1259 mm (US Climate Data, [26]). The research site is a 28 ha field experiment maintained by Weyerhaeuser Company. The soils are mapped as the Pantego (fine-loamy, siliceous, semiactive, thermic Umbric Paleaquults) and/or Rains series (fine-loamy, siliceous, semiactive, thermic Typic Paleaquults), which are very deep, poorly drained, moderately permeable soils [10]. The soil is medium to coarse textured (sandy loam to sandy clay loam). The site was partially drained in the 1970s through ditching to lower the water table and subsequently improve hydrologic conditions for pine establishment and growth. Loblolly pine trees were planted in the winter of 2008 on raised beds, and switchgrass (cultivar Alamo) was planted in summer 2009 (on land previously under loblolly pine stands). Prior to planting, different site preparation methods were undertaken depending on specific treatments. These included V-shearing and bedding in the pure pine and intercropped plots, and V-shearing and root raking in the pure switchgrass plots. Non-merchantable biomass, specifically any coarse woody debris (CWD) greater than 5 cm was removed by a grapple-claw excavator and piled along the 15 m outer buffer strips, while V-shearing and root raking removed most harvesting residuals from the switchgrass plots. All pines trees were hand planted in straight bedded rows at 1100 trees ha−1 (435 trees ac−1), and a spacing distance of 6 m was maintained between rows. Switchgrass was machine planted at 9 kg pure live seed ha−1 in rows spaced 40 cm apart to a depth of 0.6 cm and covered with soil [10].
Switchgrass in pure and intercropped stands was fertilized in the second (June 2010) and the fourth (April 2012) growing season at same rate per acre using Weyerhaeuser’s coated urea fertilizer (Arborite®, Seattle, WA, USA), supplying 65.6 kg N ha−1, 6.6 kg P ha−1 and 0.2 kg B ha−1 [10]. See Albaugh et al. (2012) for complete details on site preparation and establishment [10]. Switchgrass was harvested for biomass in December 2012 during the course of our sampling period, as part of Weyerhaeuser’s standard operating practice.
The study design is a completely randomized block with three treatments replicated across four blocks: (1) traditional bedded pine (P-B); (2) flat planted switchgrass (SG); and (3) bedded pine intercropped with switchgrass (PSG) in the interbed area. Three different locations were measured within the PSG treatment: (1) on the bedded pine row (PSG-B); (2) in the middle of the switchgrass planted in the interbed (PSG-I); and (3) on the edge, or transitional boundary between pine and switchgrass (PSG-E) (See Supplementary Materials S1 for a conceptual diagram). Thus, there were a total of five separate microsites or treatments utilized in this study (i.e., P-B, PSG-B, PSG-E, PSG-I, and SG) to provide different contrasts based on our stated objectives. Each treatment plot is 0.8 ha in size with 0.4 ha measurement plots, surrounded by a 15 m buffer. Stand age (4 years) was uniform across treatments and blocks.

2.2. Sampling and Data Collection

2.2.1. In Situ Soil CO2 Efflux

RS was measured at roughly 6-week intervals from January 2012 to March 2013 using a portable LI-6200 infrared gas analyzer (Li-Cor, LI-6200, Lincoln, NE, USA) equipped with a Li-Cor 6000-09S chamber (with a 926 cm3 volume) covering 72 cm2 of soil surface. The gas analyzer was zeroed and spanned with 359 ppm CO2 reference prior to any field measurements. Three subsample locations were measured in each block in five of the microsites (P-B, SG, PSG-B, PSG-E, PSG-I). All measurements were conducted between 9 a.m. and 4 p.m., one block at a time. The CO2 concentration in the cuvette chamber was allowed to equilibrate with the ambient CO2 concentration near the soil surface, which generally ranged between 370 and 430 ppm [27]. A vegetation-free spot was chosen to place the chamber, with the exception of mosses, which sometimes covered the forest floor beneath the litter layer, and care was taken to ensure a good seal between the chamber and soil surface. Sampling began when the CO2 concentrations steadily rose for at least a 30 s period. Soil temperature was measured at a depth of 7.5 cm using a digital thermometer and volumetric soil moisture in the top 12.0 cm was measured using a Hydrosense meter (Campbell Scientific, Logan, UT, USA). These measurements were taken concurrently in each of the sample locations.

2.2.2. Partitioning of Autotrophic and Heterotrophic Respiration

A technique based on root carbohydrate depletion [15,22] was used to partition autotrophic and heterotrophic respiration by installing 35 cm long, 10 cm inner diameter galvanized steel cores [21] into the ground. It was assumed that a 35 cm depth was sufficient for the majority of the root biomass, and it has been shown that RS contribution from depths below 30 cm is low [28]. Cores were installed in March at the three microsites in the intercrop stands: PSG-B, PSG-E, and PSG-I. Three subsamples were randomly located at each of the microsites. RS was measured on the exact spot prior to core installation, four times (roughly every 4 to 6 weeks between 30 March and 11 July) over a period of 103 days after installation directly over the exclusion cores, and immediately outside the cores. On a few occasions, aboveground vegetation that had grown inside the cores was clipped before taking a respiration measurement. A total of 36 cores were installed (3 treatments × 3 subsamples × 4 blocks). As described above, soil temperature at a depth of 7.5 cm was measured using a digital thermometer and volumetric soil moisture in the top 12 cm was also measured. Soil moisture and temperature were not measured inside the deep cores to avoid disturbing the system, except on two occasions: May sampling and the final sample date prior to the destructive harvest. The proportion of RS attributed to RH was calculated by dividing the flux rate from inside the cores by the flux rate from outside the cores (Inside RS/Outside RS) on day 103.
The cores were extracted in July after 103 days and returned to the laboratory for later analysis and root sampling.

2.2.3. Root Analysis from Exclusion Cores and Fresh Cores

Following the last CO2 efflux measurement, the soil cores were removed and soil was collected for subsequent root analysis. Fresh soil cores were also collected immediately adjacent to the root exclusion cores at the exact location where soil CO2 efflux measurements outside the pipe were recorded. In addition, fresh soil cores were extracted from the P-B and SG treatments (3 subsamples per treatment plot). All cores were separated into 0–15 cm and 15–35 cm depth increments.
Soil from extracted cores was washed through a 1 mm mesh screen. The mixture of roots, coarse woody debris and any solid particulates left behind on the sieve were collected. Roots were sorted into loblolly pine roots and switchgrass roots. Other “grass-like” roots obtained from P-B, where no switchgrass was known to be planted or observed aboveground, were categorized as “other” herbaceous grass roots. Coarse woody debris was collected, oven dried at 60 °C for at least 72 h and weighed. WinRhizo (Regent Instruments, Inc., Ville de Québec, QC, Canada) image analysis software was used to scan roots for projected root length (cm) and root surface area (cm2) for different root diameter size classes (<1 mm, 1–2 mm, 2–4 mm, >4 mm). After scanning, the roots were oven dried at 60 °C for 48 h and weighed for determination of root biomass. Final root parameters are expressed on a per volume basis (e.g., root biomass in g·m−3, root length in cm·dm−3, and root surface area in cm2·dm−3).

2.3. Statistical Analysis

The average of the subsamples in each treatment plot was used as the experimental unit. The effects of treatments on soil CO2 efflux, soil temperature and soil moisture were analyzed using repeated measures (Proc mixed model) analysis in SAS 9.2 software (SAS Institute Inc., Cary, NC, USA). Differences in treatments means were examined using the Tukey-Kramer Honestly Significant Difference (HSD) test. The response of soil CO2 efflux to environmental parameters was tested using multiple regression analysis. Further, independent models were created for each treatment to test whether the sensitivity of RS to environmental variables like soil temperature and soil moisture differed among the five treatments. First, a stepwise regression method was used in JMP Pro 10 (SAS Institute Inc., Cary, NC, USA) to select only those environmental variables that would best describe the RS model across the entire data set. Variables that were included in the regression model at the starting point were RS, soil moisture and soil temperature, various transformations of each variable (e.g., natural log, square root and inverse) and soil moisture by temperature interactions. Soil moisture and the interaction factor between soil moisture and temperature did not have significant effects on RS and were removed from the model. The model for the relationship between log-transformed RS and soil temperature provided the best fit. Once this model was selected, slopes and intercepts of the models were tested for treatment differences using analysis of covariance.
Treatment effects on various root parameters in the three different depth categories (0–15 cm, 15–35 cm and 0–35 cm soil depth) were studied using one way analysis of variance (ANOVA), and statistical analyses were carried out using JMP Pro 10. When necessary, data transformations were carried out in the form of log and square root transformation to fulfill the assumption of normality and equal variance required by ANOVA.
RH was calculated for each subsample from the efflux values on day 103 and then averaged per plot. Treatment differences in log-transformed RH were analyzed by one-way ANOVA. Spearman’s correlation was carried out between root parameters and associated RA and RS. Spearman’s correlation was run for each of the different depth categories from which roots were collected (0–15 cm, 15–35 cm and total depth). Only the depth(s) showing significant correlations were included.

3. Results

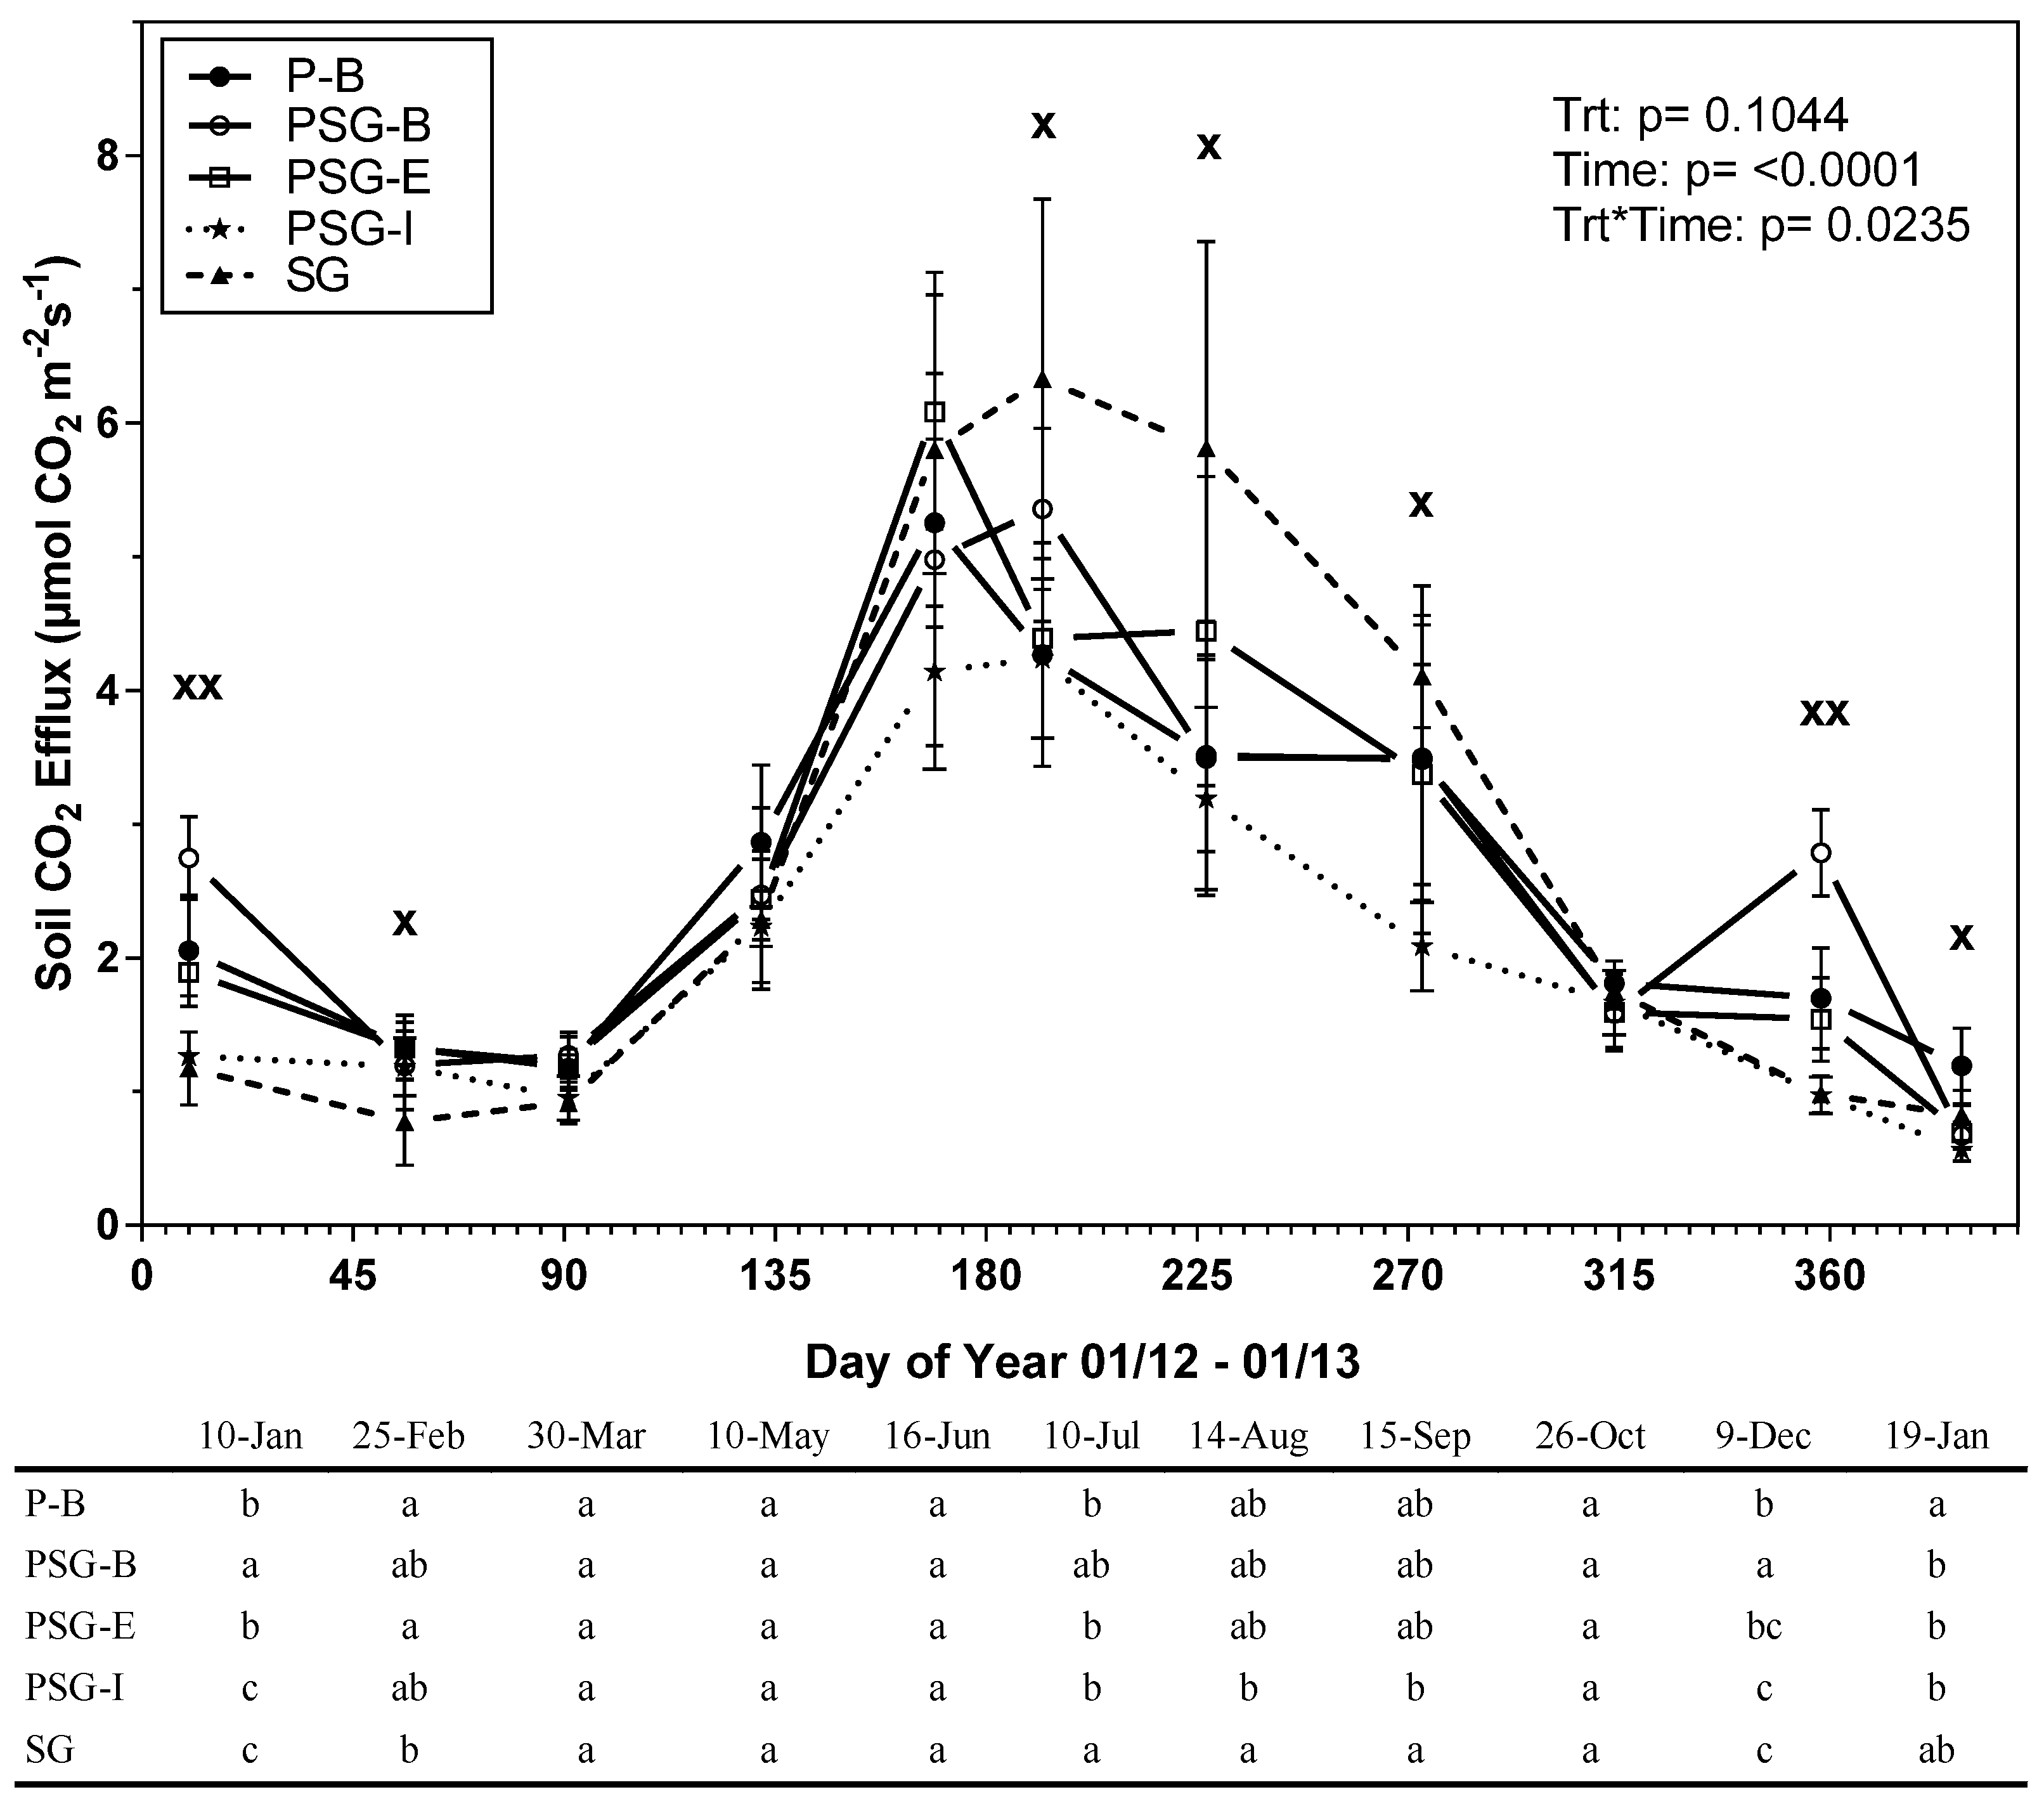
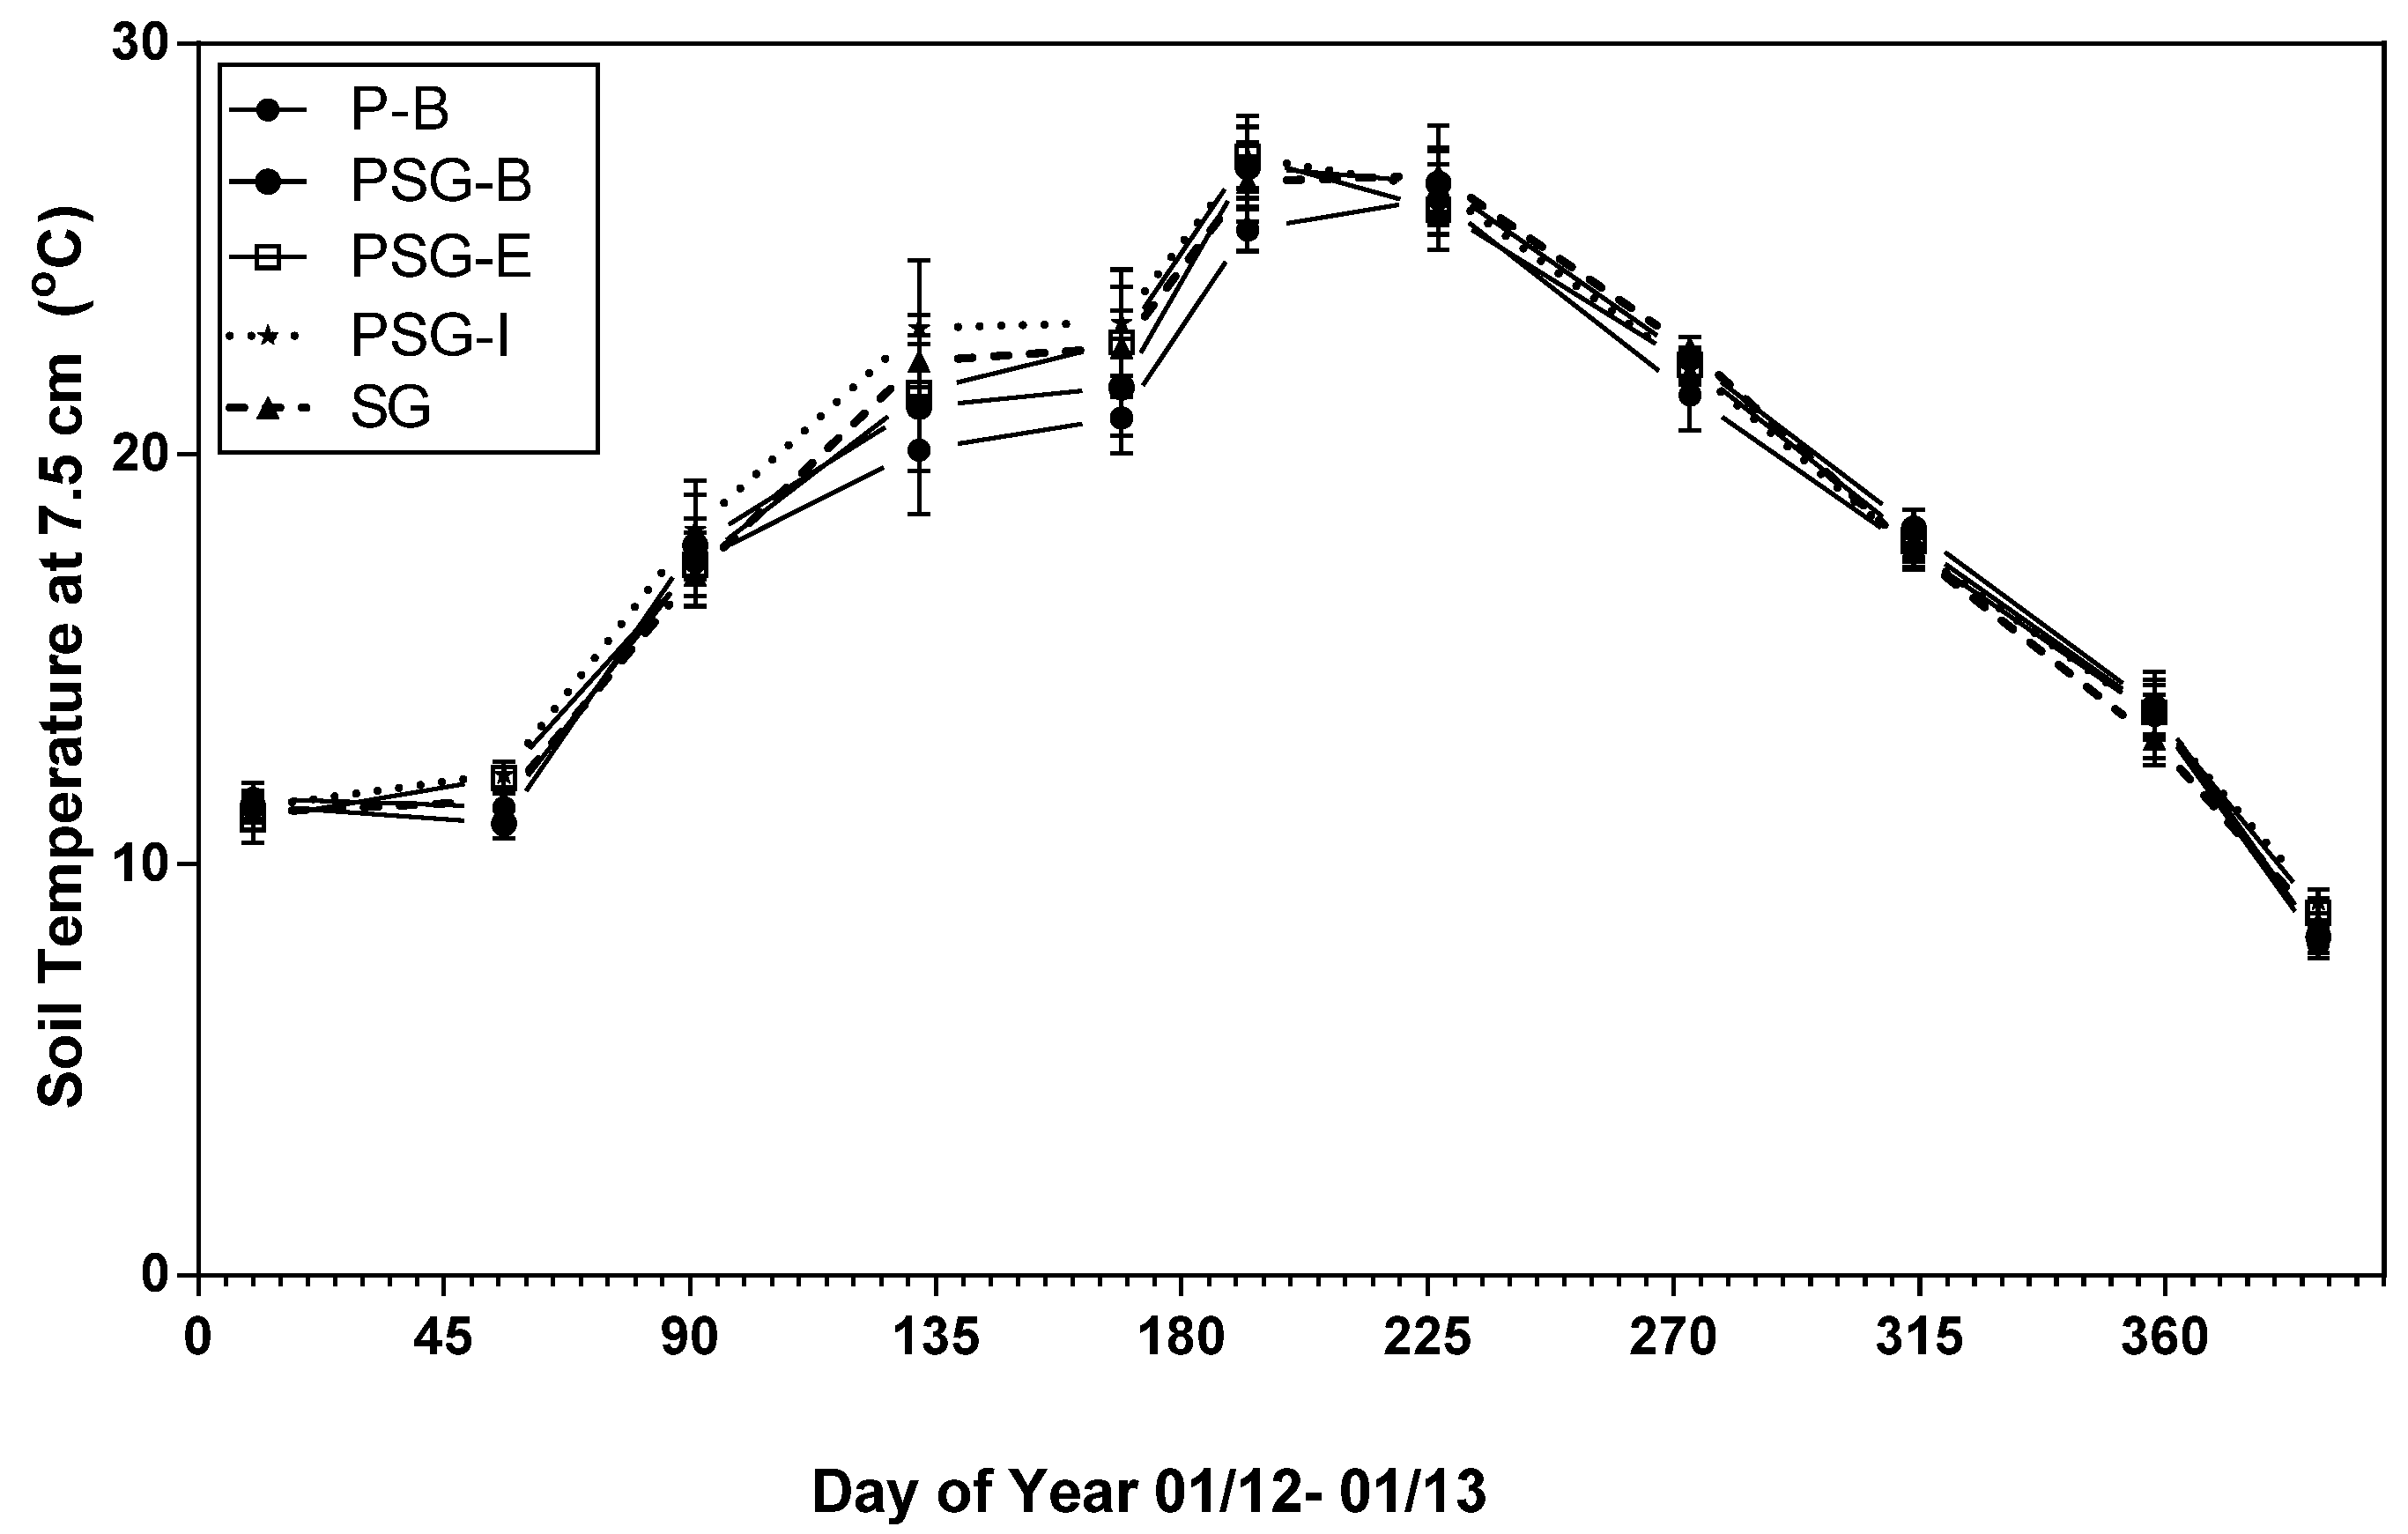
3.1. Treatment Effects on Soil CO2 Efflux, Soil Temperature and Soil Moisture

RS showed a strong seasonal pattern (Figure 1) that closely followed patterns in soil temperature (Figure 2). The highest RS rates occurred during the summer months in SG (Figure 1) where significant differences between SG and PSG-I were observed during July (p = 0.0793), August (p = 0.0859) and September (p = 0.0934) (Figure 1). RS did not significantly differ consistently between other treatments at other times of the year, although notably, RS was lower in the presence of switchgrass (SG and PSG-I) in some winter months (January and December 2012) (Figure 1).
Soil temperature and moisture showed dramatically different patterns. Soil temperature exhibited strong seasonal patterns but few treatment differences (Figure 2). Conversely, soil moisture did not show seasonal trends but was consistently lower on the elevated beds (P-B and PSG-B) relative to the PSG-E, PSG-I or SG treatments (See Supplementary Materials S2 for additional detail).

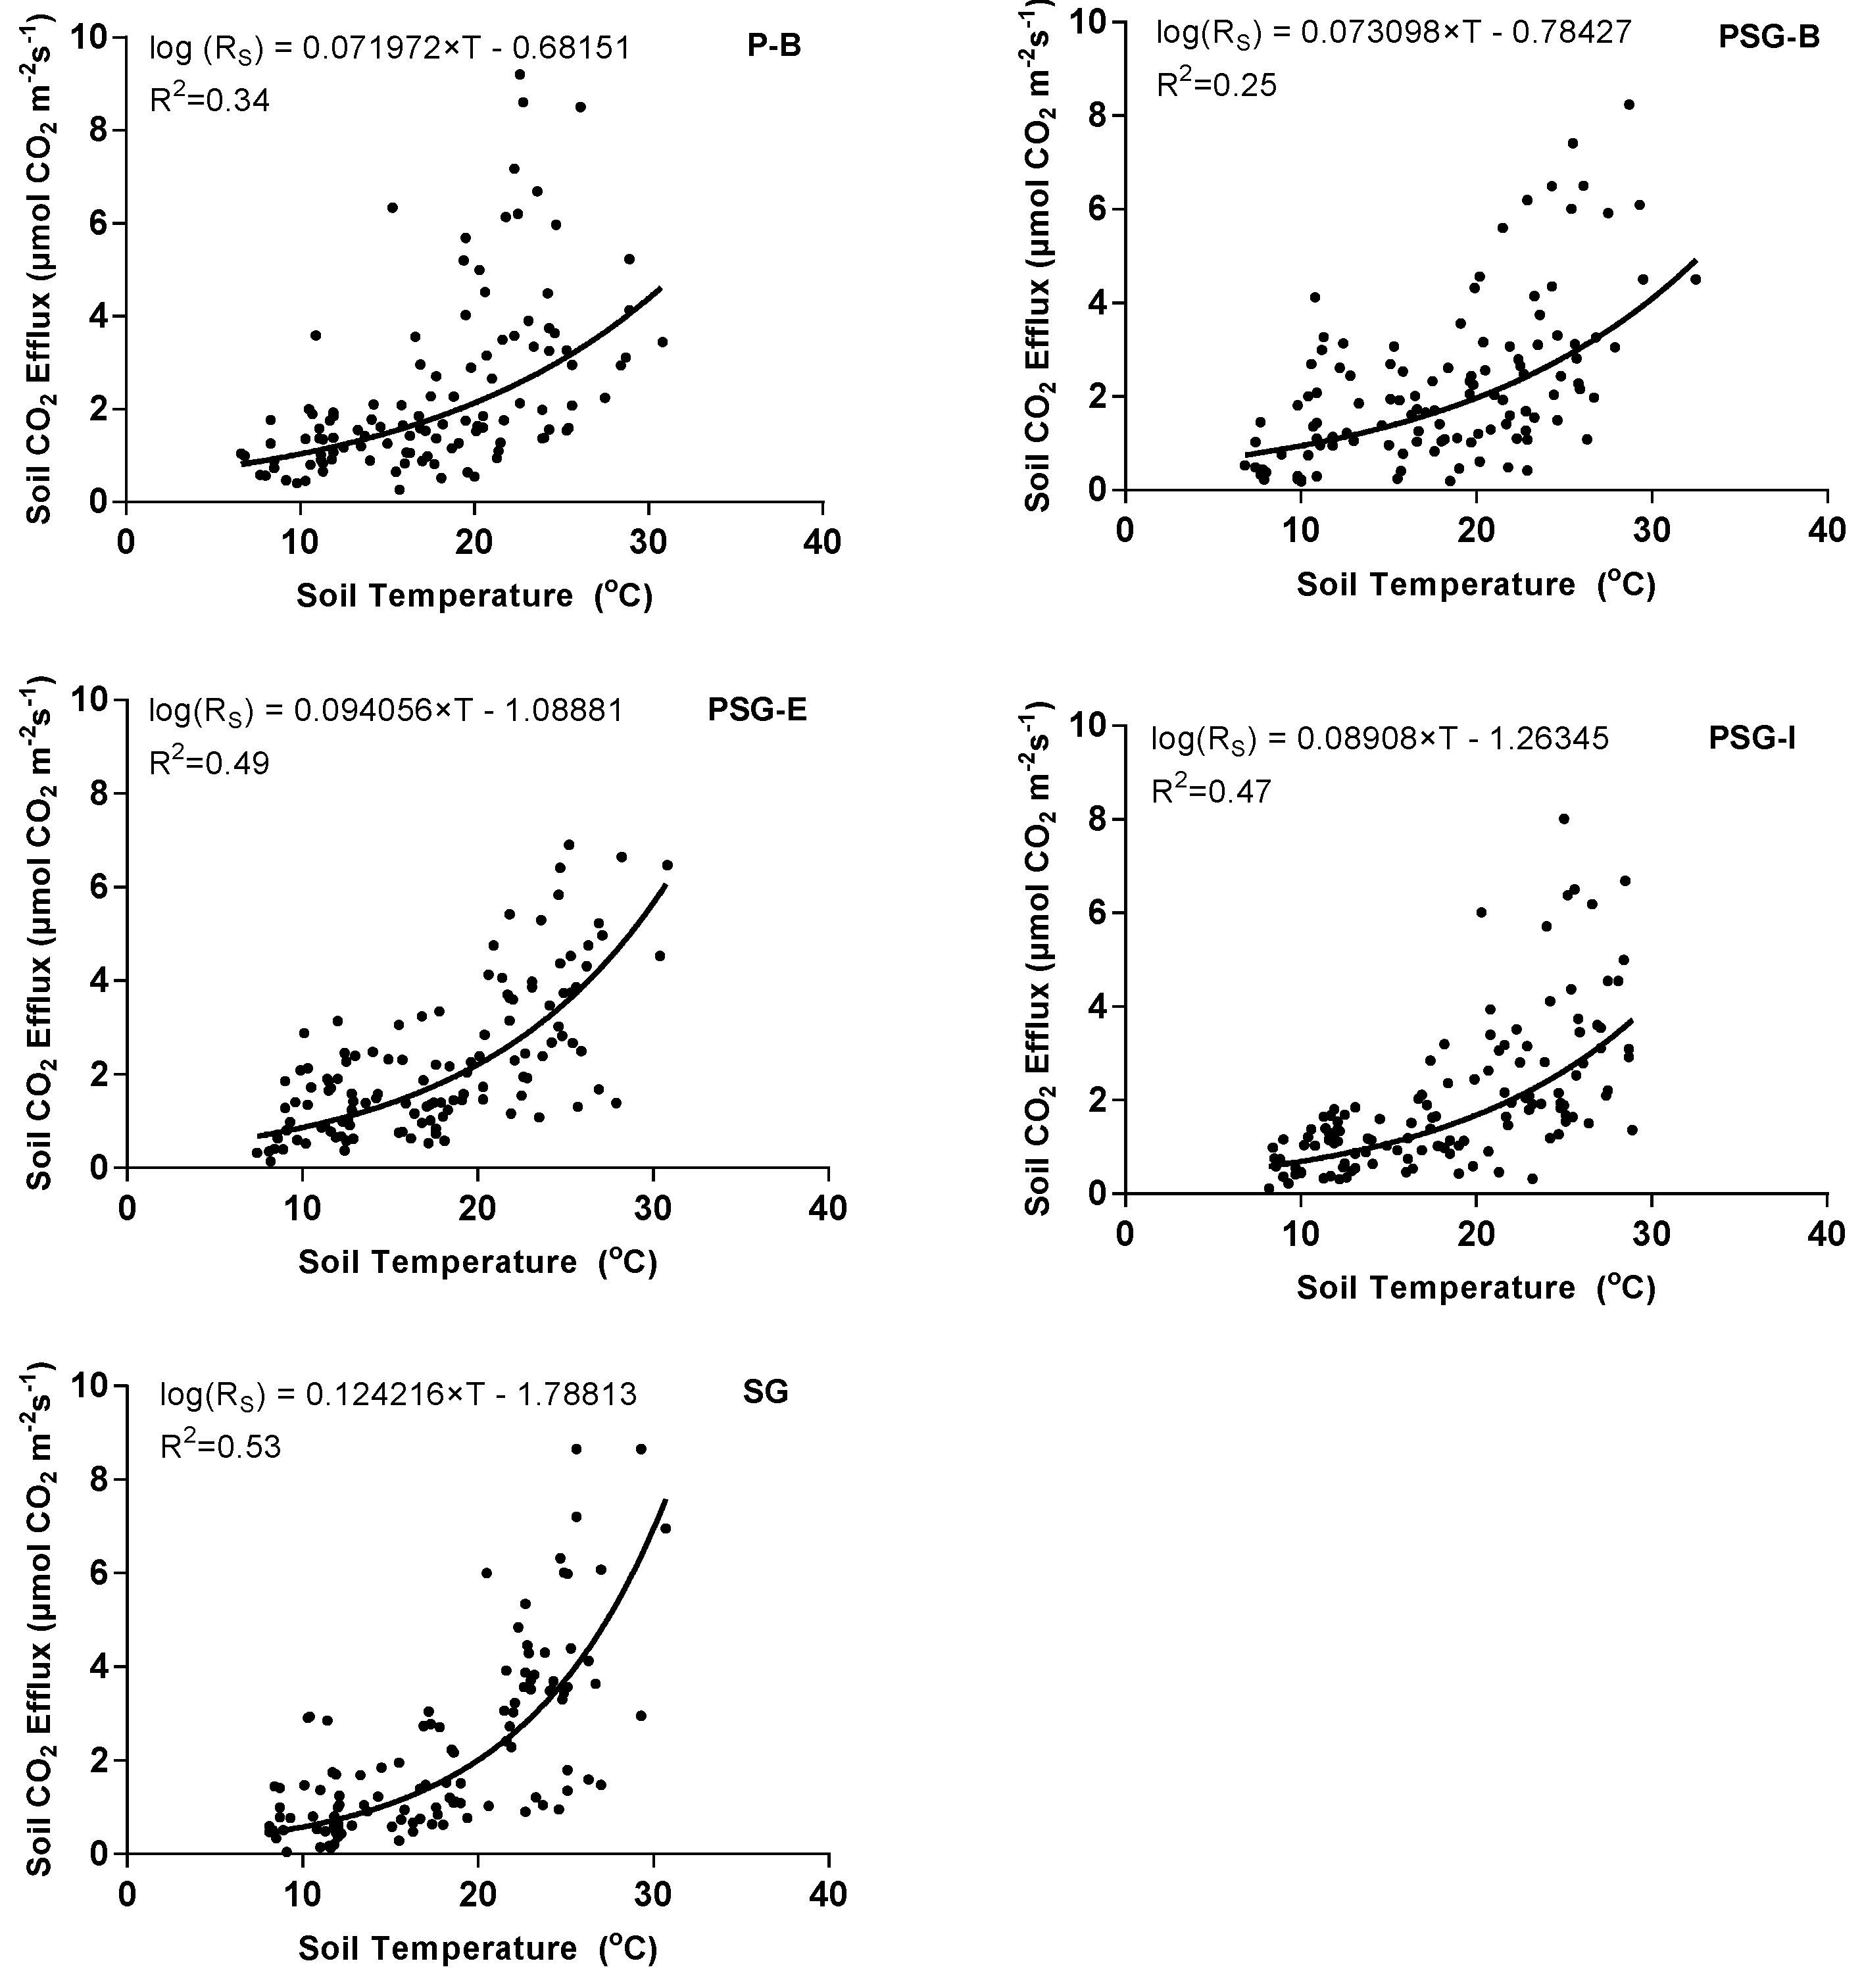
3.2. Collective and Individual Treatment Response of Soil CO2 Efflux to Temperature Change

A significant and positive effect of soil temperature on RS was noted for all five treatments (p < 0.0001) where temperature explained 43% of the variation in the log-transformed RS. Soil moisture and the interaction between soil moisture and temperature did not have a significant effect on RS.
In order to determine whether log RS responded to temperature similarly in each treatment, we created prediction equations for each of the treatments separately (Figure 3). Based on the analysis of covariance used to test for differences in the regression slopes and intercepts, the regression parameters for SG were significantly different from all other treatments (Table 1). PSG-I also had significantly different intercepts relative to the bedded treatments (P-B and PSG-B).

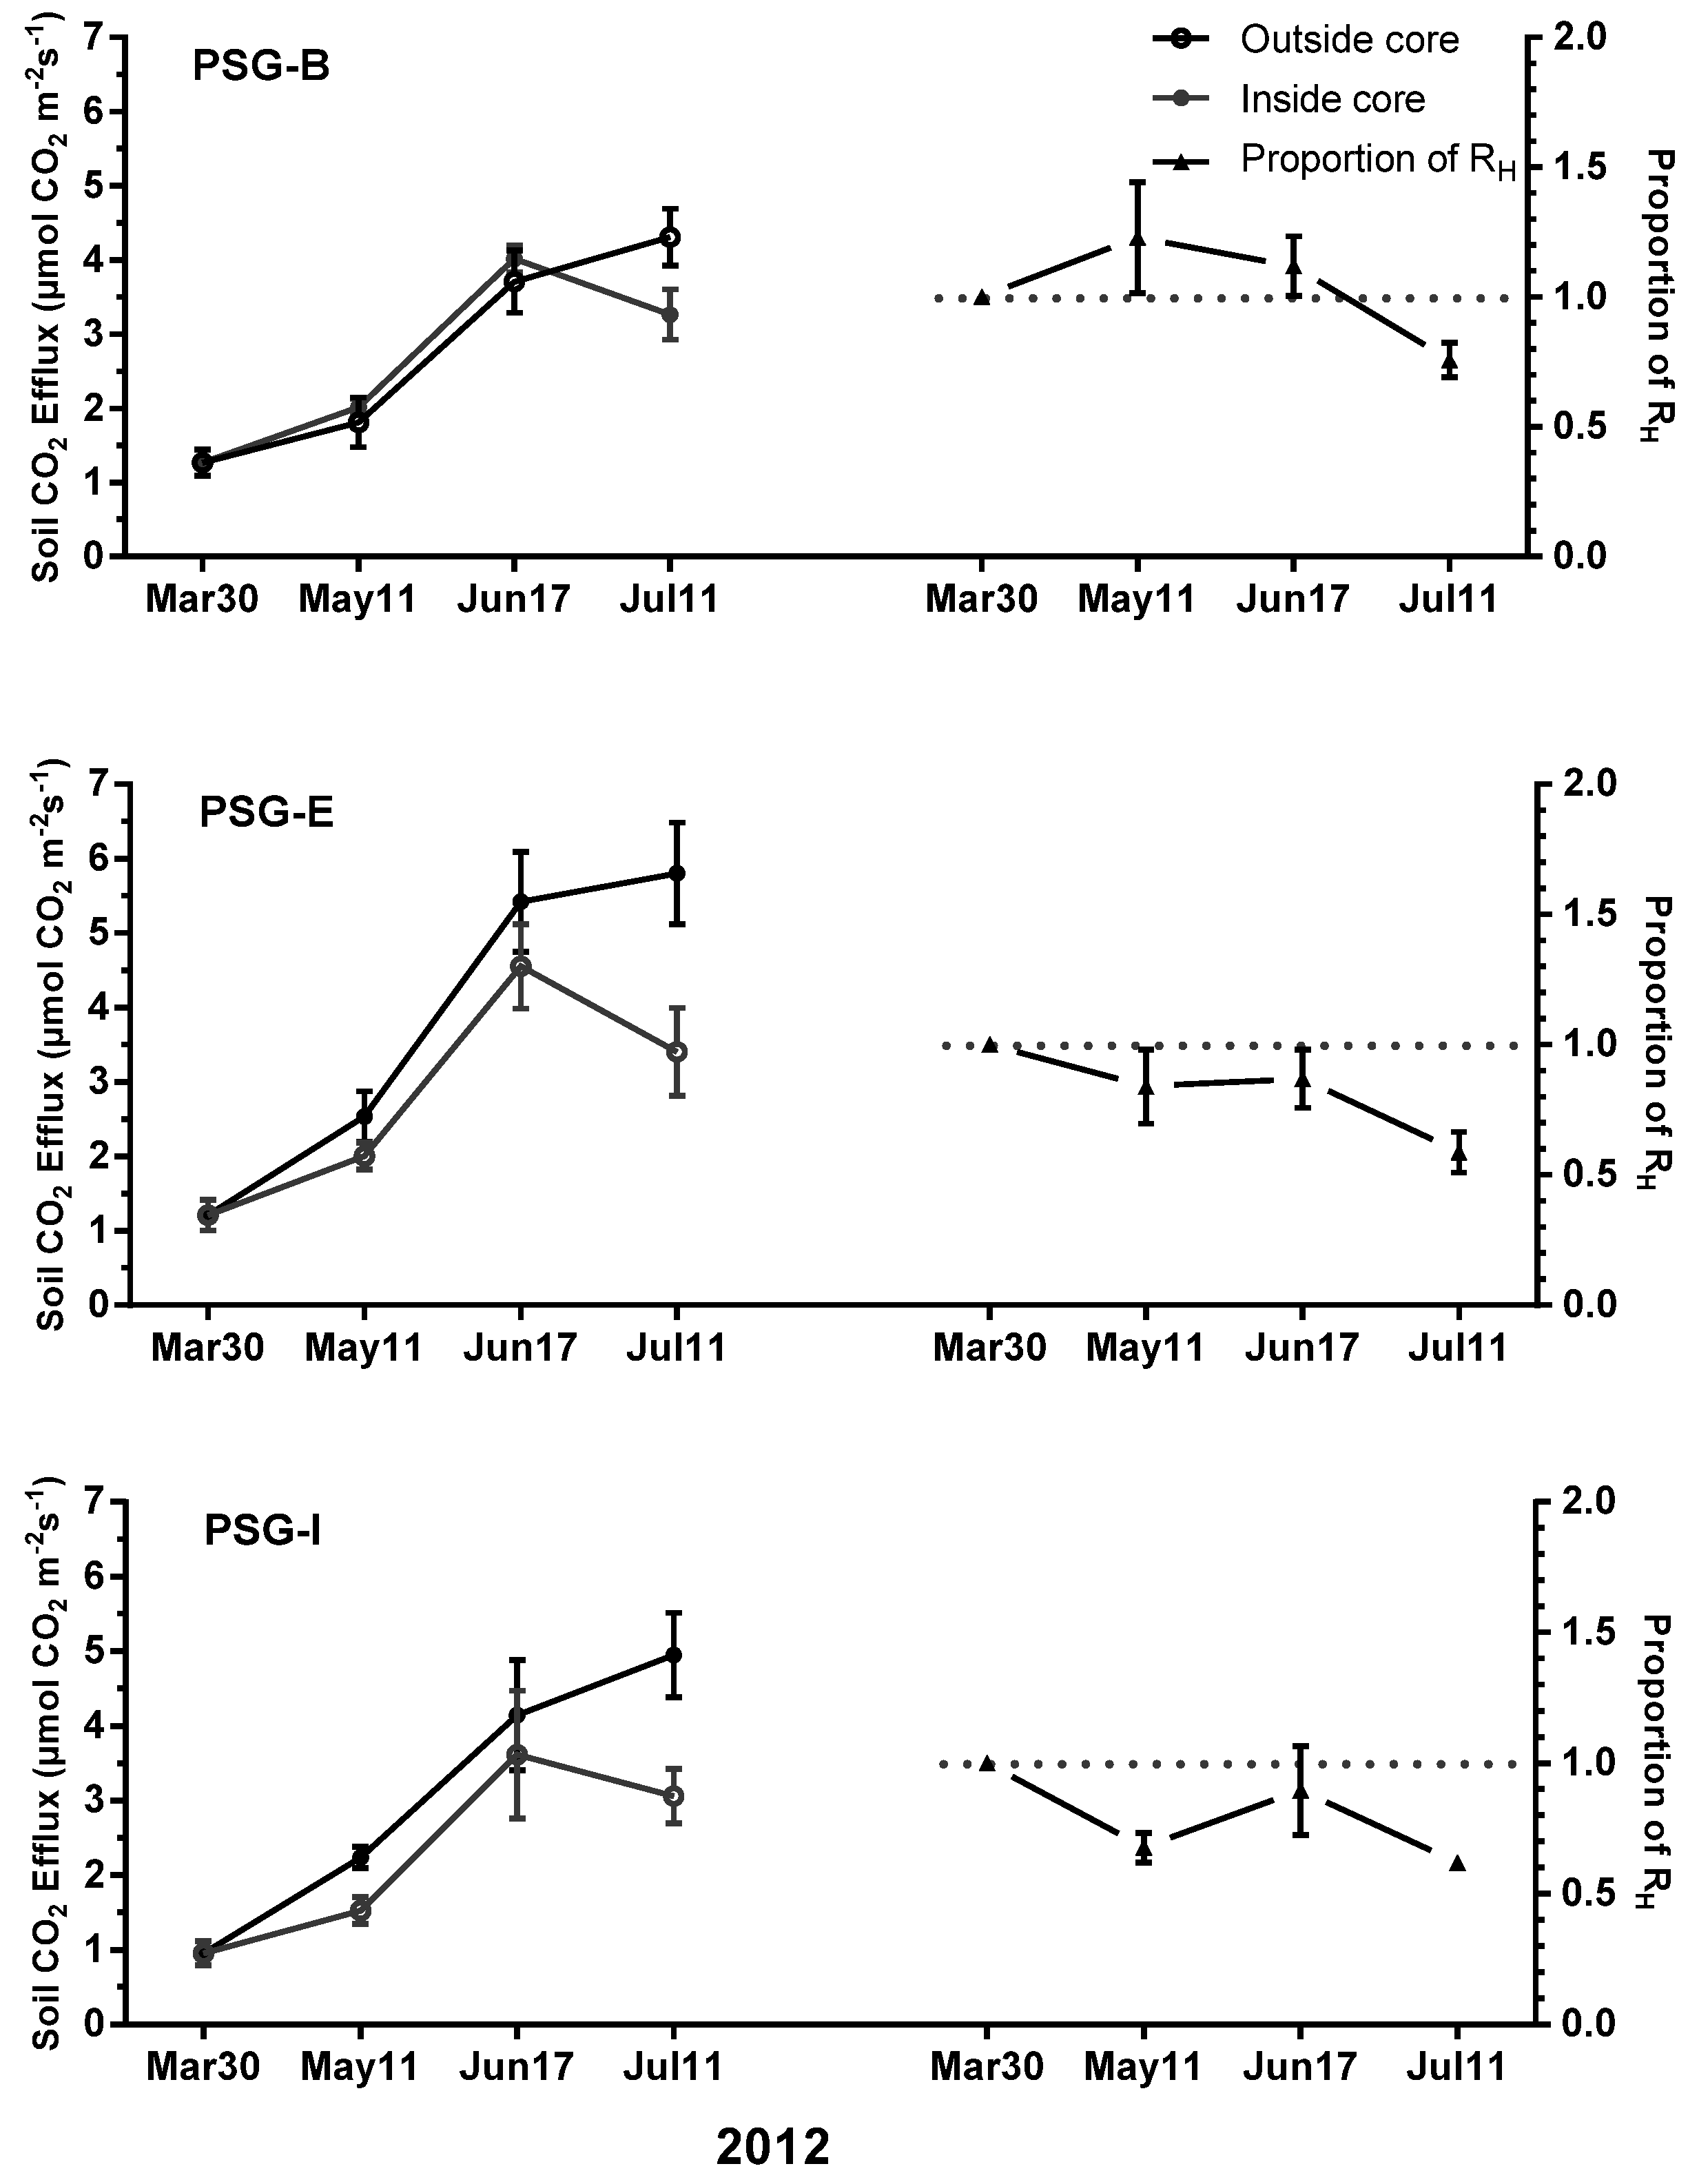
3.3. Soil CO2 Efflux Partitioning

By 11 July 2012 (cores installed in 30 March 2012), measured RS was lower inside the cores than outside in all treatments (Figure 4). Based on these data, the estimated proportion of RS due to RH was 76% ± 7%, 64% ± 8% and 67% ± 2% in PSG-B, PSG-E, and PSG-I (Figure 4) respectively, with no significant differences in RH between the three treatments. Thus, averaged across all the treatments, 69% ± 4% of RS was attributed to RH.
Trends in soil moisture inside and outside the cores showed different patterns. There were no observed differences in temperature with respect to the root exclusion cores. When soil moisture was measured directly inside the cores following RS measurements in May and July, the moisture content was higher inside the cores relative to outside the cores (Table 2).

3.4. Root Biomass, Length and Surface Area in Fresh and Exclusion Cores

Data from fresh cores in July showed that total (0–35 cm) switchgrass root biomass was highest in SG relative to the other treatments (Table 3). At the surface (0–15 cm), switchgrass root biomass declined significantly across the following treatments: SG, PSG-I, PSG-E, and PSG-B. At depth (15–35 cm), fewer significant differences in switchgrass root biomass were found, although SG remained the highest. Trends for switchgrass root length and surface area were similar to those observed for biomass (Table 3).
Total (0–35 cm) pine root biomass was highest on bedded locations (P-B and PSG-B), irrespective of intercropping, followed by the location immediately adjacent to the beds (PSG-E) (Table 3). Trends within the surface (0–15 cm) depth increment were less clear, although the subsurface (15–35 cm) depth increment seemed to drive the total pine root biomass observations. Trends for pine root length and surface area were similar to those observed for biomass (Table 3).
Overall analysis of roots from the fresh cores showed that pine roots were more evenly distributed between the depths while switchgrass roots were more concentrated in the 0–15 cm depth (Table 3). This pattern can be seen for all the root variables. Total switchgrass root biomass (5359 g·m−3) in the SG treatment exceeded the total pine root biomass value (3262 g·m−3) in the pine bed (Table 3).
Based on a comparison between the fresh and exclusion cores, switchgrass roots showed an average biomass reduction of 57%, and length and surface area reduction of 96% within the exclusion cores at the edge and interbed locations (Table 3 and Table 4). For loblolly pine roots within the exclusion cores, there was average biomass reduction of 60% on the bed and 30% at the edge and interbed locations. Pine root length and surface area were reduced by 92%–95% across all locations (Table 3 and Table 4).

4. Discussion

4.1. Soil CO2 Efflux

Rates of RS are often highly and positively correlated with NPP [17,29,30,31]. The observed RS differences in the pure and mixed stands of switchgrass (SG and PSG-I, respectively) could be a reflection of the differences in productivity as a result of intercropping switchgrass with loblolly pine. This is corroborated by the observed switchgrass root proliferation in the pure and mixed stands. Data from the fresh cores showed a significantly greater root biomass (72% greater) in the top 35 cm in SG relative to PSG-I (Table 3). Root biomass, length, and surface area were all consistently higher in SG than PSG-I at both depths, with varying levels of significance. Nevertheless, increased switchgrass root proliferation in SG compared to PSG-I in the upper 35 cm of the soil horizon could greatly influence RS [32] by directly contributing to the RA component of total efflux, and/or indirectly by influencing rhizodeposition processes, which strongly affect the activities of microbial communities [33]. Microbial respiration or activity, which drives the RH component of total efflux, is fueled by the allocation of belowground C inputs via root exudation and fine-root senescence and turnover, and this mechanism is tightly coupled with plant productivity [33].
RS from these four-year old loblolly pine stands (mixed and pure) were within the ranges (1–5 µmol CO2 m−2·s−1; Figure 1) observed for loblolly pines growing across diverse sites, with no significant differences in pure and mixed stand pinebeds. A study by Gough et al. [34] reported seasonal RS rates between 1 and 5 µmol CO2 m−2·s−1 in a four-year-old loblolly pine stand on the Virginia Piedmont. Another study by Wiseman and Seiler [35] reported maximum RS of 4 µmol CO2 m−2·s−1 in 1- to 2-year-old loblolly pine stands and 7 µmol CO2 m−2·s−1 in 20- to 25-year-old loblolly pine stands located on the Virginia Piedmont. It is important to quantify RS fluxes from soils in intensively managed forest systems because studies have suggested that managed forests may store more soil C than natural forests, and this difference in belowground C sink ability may hinge upon soil CO2 efflux processes [36,37]. Continuing to assess soil C fluxes will better elucidate the role of forest management in altering terrestrial C dynamics.

4.2. Partitioning of Soil CO2 Efflux

Estimates from root exclusion cores indicated that the RH contribution to total soil CO2 efflux was 69% ± 4% averaged across the three treatments (following 103 days of root severing). A study by Heim et al. [21], which utilized the exact root exclusion cores as in this study, estimated RH contribution of 79% ± 4% from a weed-free Pinus taeda L. forest ecosystem. Additionally, this is very similar to the percent RH estimate obtained from our P-B treatment, which was 76% ± 7%. Other studies conducted in temperate forests have also reported much higher RH contributions to RS relative to RA [12,21,38,39].
In contrast to the edge and interbed treatments, the total RS inside exclusions was initially greater compared to outside RS, resulting in estimates of RH proportion greater than 1. However, conditions seemed to have stabilized, and differences in the total RS between the inside and outside cores narrowed over time, and eventually RS from the exclusion cores dropped significantly below the outside RS. It is typical to observe initial RS spikes from inside exclusions, similar to those of tree girding or trenching, and this is a well-recognized limitation [19,22]. It is important to recognize the difficulties of estimating RH. All methods have experimental limitations such as changes in soil moisture status [40], disturbance, and fine root and mycorrhizal death [41].
We attribute the reduction in exclusion core RS observed from all treatments to the declining RA component of RS. Analysis of roots from inside and outside cores showed over 50% and 45% reduction in switchgrass and pine root biomass, respectively, while root length and surface area showed approximately 95% reduction for both species inside cores (Table 4). This is likely a consequence of root decay, or a halt in root growth and new root production, which reduces root respiration, or root growth increasing during the season outside the core relative to inside. Though the autotrophic root component comprised only one third of the total RS from this young four-year-old intercrop system, RA contribution may be expected to increase as the roots continue to develop with stand age. For instance, Bowden et al. [38] identified studies with higher RA contribution from older forest systems- 62% from a twenty-nine-year-old slash pine (Pinus elliottii Engelm) plantation in Florida, and 47%–51% from an eighty-year-old pine (Pinus densiflora) forest in Japan. This site, in particular, originally existed as a wetland before any land management conversion took place in the early 1970s [10], and consists of highly organic soil (≈4%–7% in the top 35 cm). The abundance of soil organic matter could also lead to increased RH contribution to RS as opposed to a system limited by soil organic C [18,42].

4.3. Switchgrass Root Productivity and Related RS in SG versus PSG-I

Roots from the fresh cores were used to compare the belowground productivity of switchgrass during its fourth growing season when intercropped with loblolly pine, compared to pure switchgrass stands. A significant reduction in switchgrass root biomass and surface area proliferation was observed in the mixed stands, while pine roots were unaffected by intercropping. The decreased light availability due to shading from the maturing loblolly pine trees could be the primary reason for reduced productivity of switchgrass. Shading results in reduced height, leaf area and light use efficiency, which are factors that compromise plant growth [43]. Although not measured experimentally in this study, switchgrass was observed to be growing more densely throughout the measurement plots in pure SG stands. Albaugh et al. measured switchgrass productivity from May to October 2010 on the same treatment plots and reported significantly taller switchgrass in SG plots relative to PSG-I plots (114 ± 2 cm vs. 98 ± 1 cm, respectively) at the end of the growing season [10]. However, no significant treatment effect was observed for any of the other measured variables such as percent cover, leaf area index or aboveground biomass approximately one year after the initial establishment of this intercropped system. Unlike pure stands, mixed stands tend to have a heterogeneous environment [44], where variation in light levels due to shading by taller species, variation in sprout timing of the intercropped species causing early blooming species to establish faster, or differences in individual plant growth rate and nutrient requirements leading to competition for available resources can together affect the productivity of the intercropped species differently compared to pure stands where such stressors may be absent.
One of the controls on the contribution of RA and RH to RS is the amount and activity of fine roots [45]. We studied traditional root parameters (biomass, length, surface area) within the exclusion and fresh cores to better understand belowground processes driving RS and its components. Higher RS and RH are positively correlated with increased root growth, organic C additions and root exudates in general [17,46]. Fresh core root data taken from PSG-I and SG showed significantly lower switchgrass root surface area (both depths) and biomass (total and lower depth) in the PSG-I treatment (Table 3). There was also a significant correlation between RA and switchgrass roots in the upper 35 cm of soil (r = 0.37, p = 0.0013; Table 5). Therefore, lower amounts of switchgrass roots present in PSG-I likely contributed to the overall lower RS in this system. Our data showed that although switchgrass roots alone did not significantly correlate with RS, total root biomass did (r = 0.2938, p = 0.0867; Table 5), and the fact that the majority of the roots in the SG and PSG-I plots were comprised of switchgrass roots may have influenced RS in those plots.

4.4. Soil Moisture and Temperature Influence on Soil CO2 Efflux

Soil temperature was highly correlated with RS (p < 0.001), as shown by others [47,48], while soil moisture was not. Unlike soil temperature, which almost always exhibits a positive relationship with RS, the influence of soil moisture on RS is equivocal [32,49]. Though soil moisture helps to increase the predictive power of the RS model by interacting with temperature [50], it may only become increasingly important below or above a certain threshold in driving down RS rates, such as in very dry (desert) and very wet (bogs) environments. The poor relationship between soil moisture and RS in our study could be the result of a relatively small seasonal range or variation in soil moisture content during sampling periods, and more intensive sampling across a wider range may be necessary to determine how soil moisture interacts with temperature to affect RS or its components.
Among the treatments, SG RS responded most dramatically to temperature increases. In contrast to our study, Jenkins and Adams [51] measured RS in grassland and woodland soils (root free) in a laboratory incubation over seven temperature points (5, 10, 15, 20, 25, 30, 35, and 40 °C) and found grassland soils responded less dramatically to increases in soil temperature than woodland soils. Their observations were, however, based on root-free soil and were ex situ. This suggests that the greater temperature sensitivity of RS in SG may be due primarily to the RA component. Higher temperature sensitivity of SG RS rates suggest that increasing temperature will increase RS from SG at relatively higher rates compared to other treatments. Direct temperature responses alone may not drive the seasonality in RS but rather, seasonal variation in belowground C allocation (e.g., roots, root exudates). Belowground C allocation has strong seasonality with greater allocation in summer [20]. Roots from fresh cores obtained in July showed the highest amount of total root biomass in SG plots relative to the other treatments (Table 3), which could influence temperature sensitivity of RS and therefore contribute to higher RS in summer in this treatment.

5. Conclusions

In this four-year-old system, our root biomass data indicate that intercropping switchgrass and loblolly pine lowered switchgrass root productivity compared to pure switchgrass plots. The primary reason for this could be shading from the loblolly pines. Loblolly pines were unaffected by intercropping. Future research should monitor light availability under the different management scenarios along with determining soil conditions such as drainage, fertility, and pH to evaluate productivity. Summer total RS was also significantly lower in intercropped switchgrass compared to pure switchgrass. This could be due to the decreased root proliferation in the intercropped stands, lowering the RA component of RS. Overall, the estimated contribution from heterotrophic respiration comprised over two-thirds of total RS (69% ± 4 %) in this young intercropped system. Although the majority of the RS is currently driven by heterotrophs, RA contribution to RS is expected to increase as roots continue to develop with stand age.

Supplementary Materials

The following are available online at www.mdpi.com/1999-4907/7/10/221/s1. Figure S1: A conceptual diagram representing main treatments: (A) pure pine: bed (P-B); (B) pine + switchgrass intercrop: bed (PSG-B), edge (PSG-E), interbed (PSG-I); (C) pure switchgrass (SG). Figure S2: Mean soil moisture (in the top 12 cm) between 10 January 2012 to 19 January 2013 in a four-year-old switchgrass and loblolly pine agroforestry system on the lower coastal plain of North Carolina.

Acknowledgments

Funding for this research was provided in part by USDA NIFA-AFRI Sustainable Bioenergy grant number 2011-67009-20089 and the Virginia Agricultural Experiment Station and the Program McIntire Stennis of the National Institute of Food and Agriculture, U.S. Department of Agriculture. We thank Catchlight Energy, LLC and Weyerhaeuser NR Company for establishing this long-term research experiment and for field support during data collection. Thanks are also extended to Samuel A. Frye for his help with the field data collection, Nelish Pradhan, Lara K. Nichols, David Mitchem and John Peterson for additional field and laboratory support, and Micky Allen for statistical counseling.

Author Contributions

P.S., J.S., B.S., E.S. and Z.L. conceived and designed the experiments. P.S. performed the experiments. P.S., J.S. and B.S. analyzed the data and wrote the paper.

Conflicts of Interest

The authors declare no conflict of interest.

References

  1. Ma, Z.; Wood, C.W.; Bransby, D.I. Carbon dynamics subsequent to establishment of switchgrass. Biomass Bioenergy 2000, 18, 93–104. [Google Scholar] [CrossRef]
  2. Sanderson, M.A.; Reed, R.L.; McLaughlin, S.B.; Wullschleger, S.D.; Congcr, B.V.; Parrish, D.J.; Wolf, D.D.; Taliaferro, C.; Hopkins, A.A.; Ocumpaugh, W.R.; Hussey, M.A.; Read, J.C.; Tischler, C.R. Switchgrass as a sustainable bioenergy crop. Bioresource Technol. 1996, 56, 83–93. [Google Scholar] [CrossRef]
  3. Kering, M.K.; Biermacher, J.T.; Butler, T.J.; Mosali, J.; Guretzky, J.A. Biomass yield and nutrient responses of switchgrass to phosphorus application. Bioenergy Res. 2012, 5, 71–78. [Google Scholar] [CrossRef]
  4. Muir, J.P.; Sanderson, M.A.; Ocumpaugh, W.R.; Jones, R.M.; Reed, R.L. Biomass production of “Alamo” switchgrass in response to nitrogen, phosphorus, and row spacing. Agron. J. 2001, 93, 896–910. [Google Scholar] [CrossRef]
  5. McLaughlin, S.; Bouton, J.; Bransby, D.; Conger, B.; Ocumpaugh, W.; Parrish, D.; Taliaferro, C.; Vogel, K.; Wullschleger, S. Developing Switchgrass as a Bioenergy Crop; ASHS Press: Alexandria, VA, USA, 1999. [Google Scholar]
  6. McLaughlin, S.B.; Walsh, M.E. Evaluating environmental consequences of producing herbaceous crops for bioenergy. Biomass Bioenergy 1998, 14, 317–324. [Google Scholar] [CrossRef]
  7. Fox, T.T.; Jokela, E.J.; Allen, H.L. The development of pine plantation silviculture in the southern United States. J. For. 2007, 105, 337–344. [Google Scholar]
  8. Munsell, J.F.; Fox, T.R. An analysis of the feasibility for increasing woody biomass production from pine plantations in the southern United States. Biomass Bioenergy 2010, 34, 1631–1642. [Google Scholar] [CrossRef]
  9. Blazier, M. Perfect pair for biofuel: Switchgrass and trees. In Louisiana Agriculture Magazine; Benedict, L.F., Ed.; Louisiana Agricultural Experiment Station: Baton Rouge, LA, USA, 2009; pp. 22–23. [Google Scholar]
  10. Albaugh, J.M.; Sucre, E.B.; Leggett, Z.H.; Domec, J.C.; King, J.S. Evaluation of intercropped switchgrass establishment under a range of experimental site preparation treatments in a forested setting on the Lower Coastal Plain of North Carolina, U.S.A. Biomass Energy 2012, 46, 673–682. [Google Scholar] [CrossRef]
  11. Anderson-Teixeira, K.J.; Davis, S.C.; Masters, M.D.; Delucia, E.H. Changes in soil organic carbon under biofuel crops. Glob. Chang. Bioenergy 2009, 1, 75–96. [Google Scholar] [CrossRef]
  12. Tufekcioglu, A.; Raich, J.W.; Isenhart, T.M.; Schultz, R.C. Fine root dynamics, coarse root biomass, root distribution, and soil respiration in a multispecies riparian buffer in Central Iowa, USA. Agrofor. Syst. 1999, 44, 163–174. [Google Scholar] [CrossRef]
  13. Gonzalez-Benecke, C.A.; Martin, T.A.; Cropper, W.P., Jr.; Bracho, R. Forest management effects on in situ and ex situ slash pine forest carbon balance. For. Ecol. Manag. 2010, 260, 795–805. [Google Scholar] [CrossRef]
  14. Schlesinger, W.H.; Andrews, J.A. Soil respiration and the global carbon cycle. Biogeochemistry 2000, 48, 7–20. [Google Scholar] [CrossRef]
  15. Bond-Lamberty, B.; Bronson, D.; Bladyka, E.; Gower, S.T. A comparison of trenched plot techniques for partitioning soil respiration. Soil Biol. Biochem. 2011, 43, 2108–2114. [Google Scholar] [CrossRef]
  16. Boone, R.D.; Nadelhoffer, K.J.; Canary, J.D.; Kaye, J.P. Roots exert a strong influence on the temperature sensitivity of soil respiration. Nature 1998, 396, 570–572. [Google Scholar] [CrossRef]
  17. Raich, J.W.; Schlesinger, W.H. The global carbon dioxide flux in soil respiration and its relationship to vegetation and climate. Tellus 1992, 44, 81–99. [Google Scholar] [CrossRef]
  18. Bond-Lamberty, B.; Wang, C.; Gower, S.T. A global relationship between the heterotrophic and autotrophic components of soil respiration. Glob. Chang. Biol. 2004, 10, 1756–1766. [Google Scholar] [CrossRef]
  19. Hanson, P.J.; Edwards, N.T.; Garten, C.T.; Andrews, J.A. Separating root and soil microbial contributions to soil respiration: A review of methods and observations. Biogeochemistry 2000, 48, 115–146. [Google Scholar] [CrossRef]
  20. Hogberg, P.; Nordgren, A.; Buchmann, N.; Taylor, A.F.S.; Ekbald, A.; Hogberg, M.N.; Nyberg, G.; Lofvenius, M.O.; Read, D.J. Large scale forest girdling shows that current photosynthesis drives soil respiration. Nature 2001, 411, 789–791. [Google Scholar] [CrossRef] [PubMed]
  21. Heim, B.R.; Seiler, J.R.; Strahm, B.D. Root nonstructural carbohydrates and their relationship with autotrophic respiration of loblolly pine (Pinus taeda L.). Commun. Soil Sci. Plant Anal. 2015, 46, 888–896. [Google Scholar] [CrossRef]
  22. Vogel, J.G.; Valentine, D.W. Small root exclusion collars provide reasonable estimates of root respiration when measured during the growing season of installation. Can. J. For. Res. 2005, 35, 2112–2117. [Google Scholar] [CrossRef]
  23. Walsh, M.E. The Cost of Producing Switchgrass as Dedicated Energy Crop; Oak Ridge National Laboratory Working Paper: Washington, DC, USA, 1994; pp. 35–36. [Google Scholar]
  24. Doran, F.S.; Dangerfield, C.W.; Cubbage, F.W.; Johnson, J.E.; Pease, J.E.; Johnson, L.A.; Hopper, G.M. Tree Crops for Marginal Farmland: Loblolly Pine. Available online: https://pubs.ext.vt.edu/446/446-604/446-604_pdf.pdf (accessed on 15 July 2016).
  25. Minick, K.J.; Strahm, B.D.; Fox, T.R.; Sucre, E.B.; Leggett, Z.H. Microbial nitrogen cycling response to forest-based bioenergy production. Ecol. Appl. 2015, 25, 2366–2381. [Google Scholar] [CrossRef] [PubMed]
  26. U.S. Climate Data. Available online: http//www.usclimatedata.com/climate/north-carolina/united-states/3203 (accessed on 15 July 2013).
  27. Tyree, M.C.; Seiler, J.R.; Aust, M.W.; Sampson, D.A.; Fox, T.R. Long-term effects of site preparation and fertilization on total soil CO2 efflux and heterotrophic respiration in a 33-year-old Pinus taeda L. plantation on the wet flats of the Virginia Lower Coastal Plain. For. Ecol. Manag. 2006, 234, 363–369. [Google Scholar] [CrossRef]
  28. Warembourg, F.R.; Paul, E.A. The use of 14CO2 canopy techniques for measuring carbon transfer through the plant-soil system. Plant Soil 1973, 38, 331–345. [Google Scholar] [CrossRef]
  29. Knoepp, J.D.; Coleman, D.C.; Crossley, D.A.; Clark, J.S. Biological indices of soil quality, an ecosystem case study of their use. For. Ecol. Manag. 2000, 138, 357–368. [Google Scholar] [CrossRef]
  30. Raich, J.W.; Nadelhoffer, K.J. Belowground carbon allocation in forest ecosystems, global trends. Ecology 1989, 70, 1346–1354. [Google Scholar] [CrossRef]
  31. Schlesinger, W.H. Biogeochemistry, an Analysis of Global Change; Elsevier: San Diego, CA, USA, 1997. [Google Scholar]
  32. Maier, C.A.; Kress, L.W. Soil CO2 evolution and root respiration in 11 year-old loblolly pine (Pinus taeda) plantations as affected by moisture and nutrient availability. Can. J. For. Res. 2000, 30, 347–359. [Google Scholar] [CrossRef]
  33. Paul, E.A. Soil Microbiology, Ecology and Biochemistry, 4th ed.; Academic Press: Cambridge, MA, USA, 2015. [Google Scholar]
  34. Gough, C.M.; Seiler, J.R.; Wiseman, P.E.; Maier, C.A. Soil CO2 efflux in loblolly pine (Pinus taeda L.) plantations on the Virginia piedmont and South Carolina coastal plain over a rotation-length chronosequence. Biogeochemistry 2005, 73, 127–147. [Google Scholar] [CrossRef]
  35. Wiseman, E.P.; Seiler, J.R. Soil CO2 efflux across four age classes of plantation loblolly pine (Pinus taeda L.) on the Virginia Piedmont. For. Ecol. Manag. 2004, 192, 297–311. [Google Scholar] [CrossRef]
  36. Liski, J.; Perruchoud, D.; Karjalainen, T. Increasing carbon stocks in the forest soils of western Europe. For. Ecol. Manag. 2002, 169, 159–175. [Google Scholar] [CrossRef]
  37. Valentini, R.; Matteucci, G.; Dolman, A.J.; Schulze, E.D.; Rebmann, C.; Moors, E.J.; Granier, A.; Gross, P.; Jensen, N.O.; Pilegaard, K.; et al. Respiration as the main determinant of carbon balance in European forests. Nature 2000, 404, 861–864. [Google Scholar] [CrossRef] [PubMed]
  38. Bowden, R.D.; Davidson, E.; Savage, K.; Arabia, C.; Steudler, P. Chronic nitrogen additions reduce total soil respiration and microbial respiration in temperature forest soils at the Harvard forest. For. Ecol. Manag. 2004, 196, 43–56. [Google Scholar] [CrossRef]
  39. Hogberg, P.; Singh, B.; Lofvenius, M.O.; Nordgren, A. Partitioning of soil respiration into its autotrophic and heterotrophic components by means of tree-girdling in old boreal spruce forest. For. Ecol. Manag. 2009, 257, 1764–1767. [Google Scholar] [CrossRef]
  40. Díaz-Pinés, E.; Schindlbacher, A.; Pfeffer, M.; Jandl, R.; Zechmeister-Boltenstern, S.; Rubio, A. Root trenching: A useful tool to estimate autotrophic soil respiration? A case study in an Austrian mountain forest. Eur. J. For. Res. 2010, 129, 101–109. [Google Scholar] [CrossRef] [Green Version]
  41. Scott-Denton, L.E.; Rosenstiel, T.N.; Monson, R.K. Differential controls by climate and substrate over the heterotrophic and rhizospheric components of soil respiration. Glob. Chang. Biol. 2006, 12, 205–216. [Google Scholar] [CrossRef]
  42. Ekbald, A.; Nordgren, A. Is growth of soil microorganisms in boreal forests limited by carbon or nitrogen availability? Plant Soil 2002, 242, 115–122. [Google Scholar] [CrossRef]
  43. Albaugh, J.M.; Albaugh, T.J.; Heiderman, R.R.; Leggett, Z.H.; Stape, J.L.; King, K.; O’Neil, K.P.; King, J.S. Evaluating changes in switchgrass physiology, biomass, and light-use efficiency under artificial shade to estimate yields if intercropped with Pinus taeda L. Agrofor. Syst. 2014, 88, 489–503. [Google Scholar] [CrossRef]
  44. Xu, B.C.; Li, F.M.; Shan, L. Switchgrass and milkvetch intercropping under 2,1 row-replacement in semiarid region, northwest China, aboveground biomass and water use efficiency. Eur. J. Agron. 2008, 28, 485–492. [Google Scholar] [CrossRef]
  45. Samuelson, L.J.; Mathew, R.; Stokes, T.; Feng, Y.; Aubrey, D.; Coleman, M. Soil and microbial respiration in a loblolly pine plantation in response to seven years of irrigation and fertilization. For. Ecol. Manag. 2009, 258, 2431–2438. [Google Scholar] [CrossRef]
  46. Raich, J.W.; Potter, C.S. Global patterns of carbon dioxide emissions from soils. Glob. Biogeochem. Cycles 1995, 9, 23–26. [Google Scholar] [CrossRef]
  47. Lin, G.; Ehleringer, J.R.; Gygiewicz, P.T.; Johnson, M.G.; Tingey, D.T. Elevated CO2 and temperature impacts on different components of soil CO2 efflux in Doughlas-fir terracosms. Glob. Chang. Biol. 1999, 5, 157–168. [Google Scholar] [CrossRef]
  48. Pang, X.; Bao, W.; Zhu, B.; Cheng, W. Responses of soil respiration and its temperature sensitivity to thinning in a pine plantation. Agric. For. Meteorol. 2013, 171, 57–64. [Google Scholar] [CrossRef]
  49. Maier, C.A.; Albaugh, T.J.; Allen, H.L.; Dougherty, P.M. Respiratory carbon use and carbon storage in mid-rotation loblolly pine (Pinus taeda L.) plantations, the effect of site resources on the stand carbon balance. Glob. Chang. Biol. 2004, 10, 1335–1350. [Google Scholar] [CrossRef]
  50. Davidson, E.A.; Belk, E.; Boone, R.D. Soil water content and temperature as independent or confounded factors controlling soil respiration in a temperate mixed hardwood forest. Glob. Chang. Biol. 1998, 4, 217–227. [Google Scholar] [CrossRef]
  51. Jenkins, M.E.; Adams, M.A. Respiratory quotients and Q10 of soil respiration in sub-alpine Australia reflect influences of vegetation types. Soil Biol. Biochem. 2011, 43, 1266–1274. [Google Scholar] [CrossRef]
Figure 1. Mean soil CO2 efflux rates (µmol·m−2·s−1) from 10 January 2012 to 19 January 2013 in a four-year-old switchgrass and loblolly pine intercropping system on the lower Coastal Plain of North Carolina. Error bars represent ± 1 standard error of the mean. Stars indicate sampling dates with significant differences between treatments as determined using repeated measures analysis (α = 0.1). The accompanying matrix represents mean separation using Tukey-Kramer HSD where different letters for each treatment date indicate significant differences. Terms with a single asterisks (*) are significant at the p < 0.1 level, double asterisks (**) at p < 0.05. P = pine, SG = flat planted switchgrass, and PSG = pine intercropped with switchgrass. Additional treatment designations indicate the microtopographical position of the sample location where B = bedded row, I = interbed space, and E = edge where an aboveground transition from switchgrass to pine was observed.
Forests 07 00221 g001
Figure 2. Mean soil temperature (°C at 7.5 cm) from 10 January 2012 to 19 January 2013 in a four-year-old switchgrass and loblolly pine agroforestry system on the lower coastal plain of North Carolina. Error bars represent ± 1 standard error of the mean. P = pine, SG = flat planted switchgrass, and PSG = pine intercropped with switchgrass. Additional treatment designations indicate the microtopographical position of the sample location where B = bedded row, I = interbed space, and E = edge where an aboveground transition from switchgrass to pine was observed.
Forests 07 00221 g002
Figure 3. Temperature response of log-transformed soil CO2 efflux measured approximately every 6 weeks from 10 January 2012 to 20 January 2013 in a four-year-old switchgrass and loblolly pine intercropped system on the lower Coastal Plain of North Carolina. P = pine, SG = flat planted switchgrass, and PSG = pine intercropped with switchgrass. Additional treatment designations indicate the microtopographical position of the sample location where B = bedded row, I = interbed space, and E = edge where an aboveground transition from switchgrass to pine was observed.
Forests 07 00221 g003
Figure 4. RS rates measured inside and outside cores and the proportion of RS attributed to RH (RS inside core/RS outside core) following installation of 35 cm root exclusion cores in a four-year-old switchgrass and loblolly pine agroforestry system on the lower coastal plain of North Carolina. Error bars represent ± 1 standard error of the mean. The PSG treatment represents pine intercropped with switchgrass. Additional treatment designations indicate the microtopographical position of the sample location where B = bedded row, I = interbed space, and E = edge where an aboveground transition from switchgrass to pine was observed.
Forests 07 00221 g004
Table 1. p-values representing differences between intercept and slope estimates for the response of log RS to temperature influenced by treatment and microtopographical position in a four-year-old switchgrass and loblolly pine intercropping system on the lower Coastal Plain of North Carolina.
Treatment 1P-BPSG-BPSG-EPSG-ISG
Differences between slopes
P-B-0.93680.12280.22510.0002
PSG-B-0.13220.24360.0002
PSG-E-0.71810.0305
PSG-I-0.0106
SG-
Differences between intercepts
P-B-0.69720.12780.02950.00004
PSG-B-0.24600.06780.0001
PSG-E-0.51020.0085
PSG-I-0.0477
SG-
1 P = pine, SG = flat planted switchgrass, and PSG = pine intercropped with switchgrass. Additional treatment designations indicate the microtopographical position of the sample location where B = bedded row, I = interbed space, and E = edge where an aboveground transition from switchgrass to pine was observed.
Table 2. Volumetric soil moisture content from 0 to 12 cm measured inside and outside cores in a four-year-old switchgrass and loblolly pine intercropping system on the lower Coastal Plain of North Carolina. Measurements inside cores were conducted in May and July only. Different letters indicate significant differences between inside and outside core moisture within a treatment at p < 0.05 based on a t-test. Means are followed by ± 1 standard errors in parentheses.
Measurement Date1 PSG-BPSG-EPSG-I
Inside CoreOutside CoreInside CoreOutside CoreInside CoreOutside Core
May1122.3a (3.2)14.8b (2.0)38.9a (3.7)26.3b (1.0)35.9a (2.4)26.8b (1.6)
Jul1120.8a (3.6)9.9b (1.2)35.1a (4.7)17.6b (3.6)29.8a (1.9)25.6b (0.3)
1 PSG = pine intercropped with switchgrass and additional treatment designations indicate the microtopographical position of the sample location where B = bedded row, I = interbed space, and E = edge where an aboveground transition from switchgrass to pine was observed. When interaction exists between different statistical factors, different letters reveal significant differences.
Table 3. July switchgrass and loblolly pine root biomass (g·m−3), average root length (cm·dm−3), and average root surface area (cm2·dm−3) in the fresh cores from 0–15 cm, 15–35 cm soil depth and total depth in a four-year-old switchgrass and loblolly pine intercropped system on the lower coastal plain of North Carolina. Means are followed by ± 1 standard errors in parentheses. Different letters following the means indicate significant differences between treatments for a particular depth at p < 0.05.
Root Variable1 TreatmentPineSwitchgrass
0–15 cm15–35 cmTotal0–15 cm15–35 cmTotal
Biomass (g·m−3)P-B1080a (217.7)2182a (519.6)3262a (501.1)NANANA
PSG-B996.8a (290.2)2838a (644.4)3835a (628.7)116.9c (22.37)65.94b (30.59)182.8b (51.36)
PSG-E1161a (292.0)505.2b (176.3)1666b (197.0)736.7b (195.1)510.0ab (302.6)1247b (424.4)
PSG-I241.6ab (61.59)84.39b (25.70)325.9c (56.28)1308ab (405.6)173.1b (17.37)1481b (418.7)
SG138.5b (95.20)272.5b (89.09)411.0c (178.2)3620a (1358)1739a (524.6)5359a (1842)
Length (cm·dm−3)P-B1297a (252.7)1038a (303.0)2335a (532.0)NANANA
PSG-B630.7a (105.5)414.0ab (78.23)1045b (170.7)864.59c (238.5)285.0a (115.6)1150c (330.1)
PSG-E721.2a (93.42)122.9bc (41.29)844.1bc (60.38)2568b (533.4)373.0a (132.4)2941bc (565.7)
PSG-I258.6ab (57.44)53.41c (9.668)312.0cd (56.65)4029ab (990.7)473.3a (190.3)4503ab (1163)
SG80.07b (67.52)78.32bc (13.33)158.4d (76.94)6581a (905.58)1084a (300.3)7665a (640.9)
Surface Area (cm2·dm−3)P-B16.76a (2.619)19.10a (4.884)35.76a (7.287)NANANA
PSG-B10.25ab (1.938)9.252ab (1.616)19.50ab (3.457)7.662c (2.048)2.808b (0.9621)10.47c (2.787)
PSG-E13.32ab (2.392)2.708bc (0.9730)16.03bc (1.712)26.35bc (5.689)5.150b (1.467)31.50bc (6.147)
PSG-I5.035bc (1.295)1.153c (0.1758)6.188cd (1.239)36.67b (8.667)5.352b (1.252)42.02b (9.801)
SG1.236c (0.989)1.664bc (0.3909)2.900d (1.270)71.53a ( 4.495)18.89a (6.992)90.41a (4.807)
1 P = pine, SG = flat planted switchgrass, and PSG = pine intercropped with switchgrass. Additional treatment designations indicate the microtopographical position of the sample location where B = bedded row, I = interbed space, and E = edge where an aboveground transition from switchgrass to pine was observed. When interaction exists between different statistical factors, different letters reveal significant differences.
Table 4. July switchgrass and loblolly pine root biomass (g·m−3), average root length (cm·dm−3), and average root surface area (cm2·dm−3) in the exclusion cores from 0–15 cm, 15–35 cm soil depth and total depth in a four-year-old switchgrass and loblolly pine intercropped system on the lower coastal plain of North Carolina. Means are followed by ± 1 standard errors in parentheses. Different letters following the means indicate significant differences between treatments for a particular depth at p < 0.05.
Root Variable1 TreatmentPineSwitchgrass
0–15 cm15–35 cmTotal0–15 cm15–35 cmTotal
Biomass (g·m−3)PSG-B439.48ab (140.9)971.71a (390.4)1411.19a (460)nanana
PSG-E597.86a (56.2)512.94a (195.3)1110.80ab (215)393.43a (124.2)94.26a (36.9)487.69a (112.4)
PSG-I182.07b (49.3)46.16a (16.3)228.23b (41)549.33a (91.5)146.96a (34.3)696.29a (112)
Length (cm·dm−3)PSG-B36.26ab (9.65)43.90a (7.66)80.17a (16.82)nanana
PSG-E55.21a (9.42)18.43b (4.16)73.64a (12.5)98.20a (22.25)32.9a (6.66)131.14a (25.75)
PSG-I9.86b (1.32)5.55b (0.69)15.4b (1.6)103.33a (33.42)21.50a (1.10)124.82a (33.78)
Surface Area (cm2·dm−3)PSG-B0.66ab (0.14)1.26a (0.33)1.92a (0.46)nanana
PSG-E1.03a (0.17)0.34b (0.08)1.36ab (0.24)1.09a (0.22)0.4a (0.09)1.5a (0.28)
PSG-I0.19b (0.01)0.13b (0.02)0.3b (0.02)1.25a (0.39)0.39a (0.07)1.64a (0.45)
1 PSG = pine intercropped with switchgrass. Additional treatment designations indicate the microtopographical position of the sample location where B = bedded row, I = interbed space, and E = edge where an aboveground transition from switchgrass to pine was observed. When interaction exists between different statistical factors, different letters reveal significant differences.
Table 5. Spearman’s correlation coefficients (r, left) and p-values (in parentheses, right) between root parameters at 0–35 cm soil depth and total RS 1 and proportion of autotrophic respiration to RS (RA) 2 in a four-year-old switchgrass and loblolly pine agroforestry system on the lower coastal plain of North Carolina.
RSRA
Pine biomass0.1395 (0.4242)−0.2408 (0.0416**)
Grass biomass0.0591 (0.7359)0.3707 (0.0013**)
Total root biomass0.2938 (0.0867*)−0.0521 (0.6640)
Fine root surface area0.1824 (0.2944)0.2645 (0.0248xx)
Medium root surface area0.0381 (0.8280)0.1991 (0.0936x)
Fine root length0.2515 (0.1449)0.0388 (0.7463)
Medium root length0.0588 (0.7371)−0.0913 (0.4457)
Coarse woody debris0.0958 (0.5841)−0.0985 (0.4104)
1 Roots correlated with RS involve roots collected from fresh cores in PSG-B, PSG-E and PSG-I; 2 Roots correlated with RA involve roots from exclusion cores in PSG-B, PSG-E and PSG-I. Terms with a single asterisks (*) are significant at the p < 0.1 level, double asterisks (**) at p < 0.05.

