Article

Forest Management Influences Aboveground Carbon and Tree Species Diversity in Myanmar’s Mixed Deciduous Forests

1
Nature and Wildlife Conservation Division, Forest Department, Ministry of Natural Resources and Environmental Conservation, Office No. 39, Zaburithiri Township, 15011, Nay Pyi Taw, Myanmar
2
Faculty of Science, School of Ecosystem and Forest Sciences, The University of Melbourne, Water Street, Creswick, Victoria 3363, Australia
*
Author to whom correspondence should be addressed.
Forests 2016, 7(10), 217; https://doi.org/10.3390/f7100217
Submission received: 19 August 2016 / Revised: 17 September 2016 / Accepted: 23 September 2016 / Published: 29 September 2016

Abstract

:
Declines in the global extent and condition of tropical forests have reduced carbon storage potential and caused biodiversity loss. However, the magnitude of these problems within individual countries may depend on the extent of the reserved forest estate, and the particular rules put in place to manage resource use in these areas. To test this hypothesis, aboveground carbon stocks and indices of tree diversity were derived for two reserved (highly regulated) sites and a protected public (less regulated) site in the mixed deciduous forests of Myanmar. Aboveground tree carbon stocks were around three times higher in the reserved forests than in the public forest, a difference driven by the near absence of trees >40 cm DBH at the public forest site. The species composition of large (≥20 cm DBH) trees differed substantially between all three sites. In contrast, the species composition of small (<20 cm DBH) trees differed between the reserved and public forest in the case of one reserved site but not the other. Both species richness and diversity of large (≥20 cm DBH) trees was about five times higher in the reserved forest than in the public forest. This was not the case for small (<20 cm DBH) trees, where estimates of both richness and diversity were similar at all three sites. These findings suggest that both carbon storage potential and large-tree diversity are influenced by forest protection status. This has important implications for national carbon storage estimates as forest protection status is not currently considered as part of the standard carbon accounting procedure.

1. Introduction

Climate change has become one of the largest global concerns of the 21st century, threatening human societies, political and economic systems, forest ecosystems, and other natural resources [1]. Forests can help reduce the rate and magnitude of global climate change due to their capacity to sequester carbon, yet between 12% to 20% of global greenhouse gas emissions are caused by the degradation of forests and their conversion to other land uses [2,3]. Forests are also critical repositories for terrestrial biodiversity [4], and their conversion and degradation are contributing to biodiversity loss globally [5,6,7].
While forest cover is increasing in some parts of the world, it is declining in the tropics [8]. Over 50% of primary tropical forests have been substantially altered and those that remain are under threat [9], resulting in negative consequences for both greenhouse gas emissions and biodiversity. For example, deforestation and forest degradation of tropical forests releases 1–2 billion tonnes of carbon annually [10], and the loss of primary tropical forests results in biodiversity declines for a range of taxa, with species in Asia identified as particularly vulnerable [11].
Forests cover around 44% of the land surface in Myanmar [12,13] and are a globally important biodiversity resource [14]. Mixed deciduous forests compose 38% of the forested area and are the dominant forest type in the country [15]. These forests are important for timber production [16], due principally to the presence of teak (Tectona grandis L. f.) and Burmese iron-wood, pyinkado (Xylia xylocarpa (Roxb.) Taub.), species renowned for their strength and durability [17]. However, forest area has declined since 1990 with recent data indicating an 8.6% reduction between 2010 and 2015, placing Myanmar among the top ten countries with the highest annual deforestation rate within this period [13]. The main causes of forest loss include the conversion to agricultural land use, fuel-wood extraction, logging, plantation development, urbanization, and infrastructure development [15,18,19].
In Myanmar, forest exploitation is controlled by law, with the government allowing rural communities to use some forest products but not others [15]. The extent of forest exploitation, however, depends on forest protection status with different rules applying to public and reserved areas. The reserved forest system was introduced in 1865, principally to improve forest conservation and teak resources [20]. Continued support from forest administrators has seen the reserved forest estate expand to cover more than 30% of the country, with a 7.6% annual increase in the amount of land designated for biodiversity conservation between 1990 and 2015 [13,15].
Forest protection typically reduces the conversion of natural land cover types to alternative uses [21] and often results in positive outcomes (including reduced deforestation rates and the maintenance of cover) compared to unprotected sites [22]. However, the potential benefits of forest protection for carbon storage and biodiversity in Myanmar have not been assessed. In addition, the REDD+ Scheme (Reducing Emissions from Deforestation and Degradation) has potential as a mechanism for reducing forest degradation, mitigating greenhouse gas emissions, and conserving biodiversity in many developing countries [23]. For Myanmar, however, a current barrier to its participation in REDD+ is the lack of data on forest carbon storage, preventing the calculation of carbon credits associated with forest conservation actions. Forest protection may play a crucial role for an efficient REDD+ program, as protected forests are usually associated with lower deforestation rates and higher levels of forest cover.
The objectives of this study were to estimate aboveground carbon stocks and indices of tree biodiversity in both reserved and public mixed deciduous forests in Myanmar. We expected both carbon stocks and biodiversity indices to be lower in the public forest due to fewer restrictions on the use of forest resources compared to reserved areas.

2. Materials and Methods
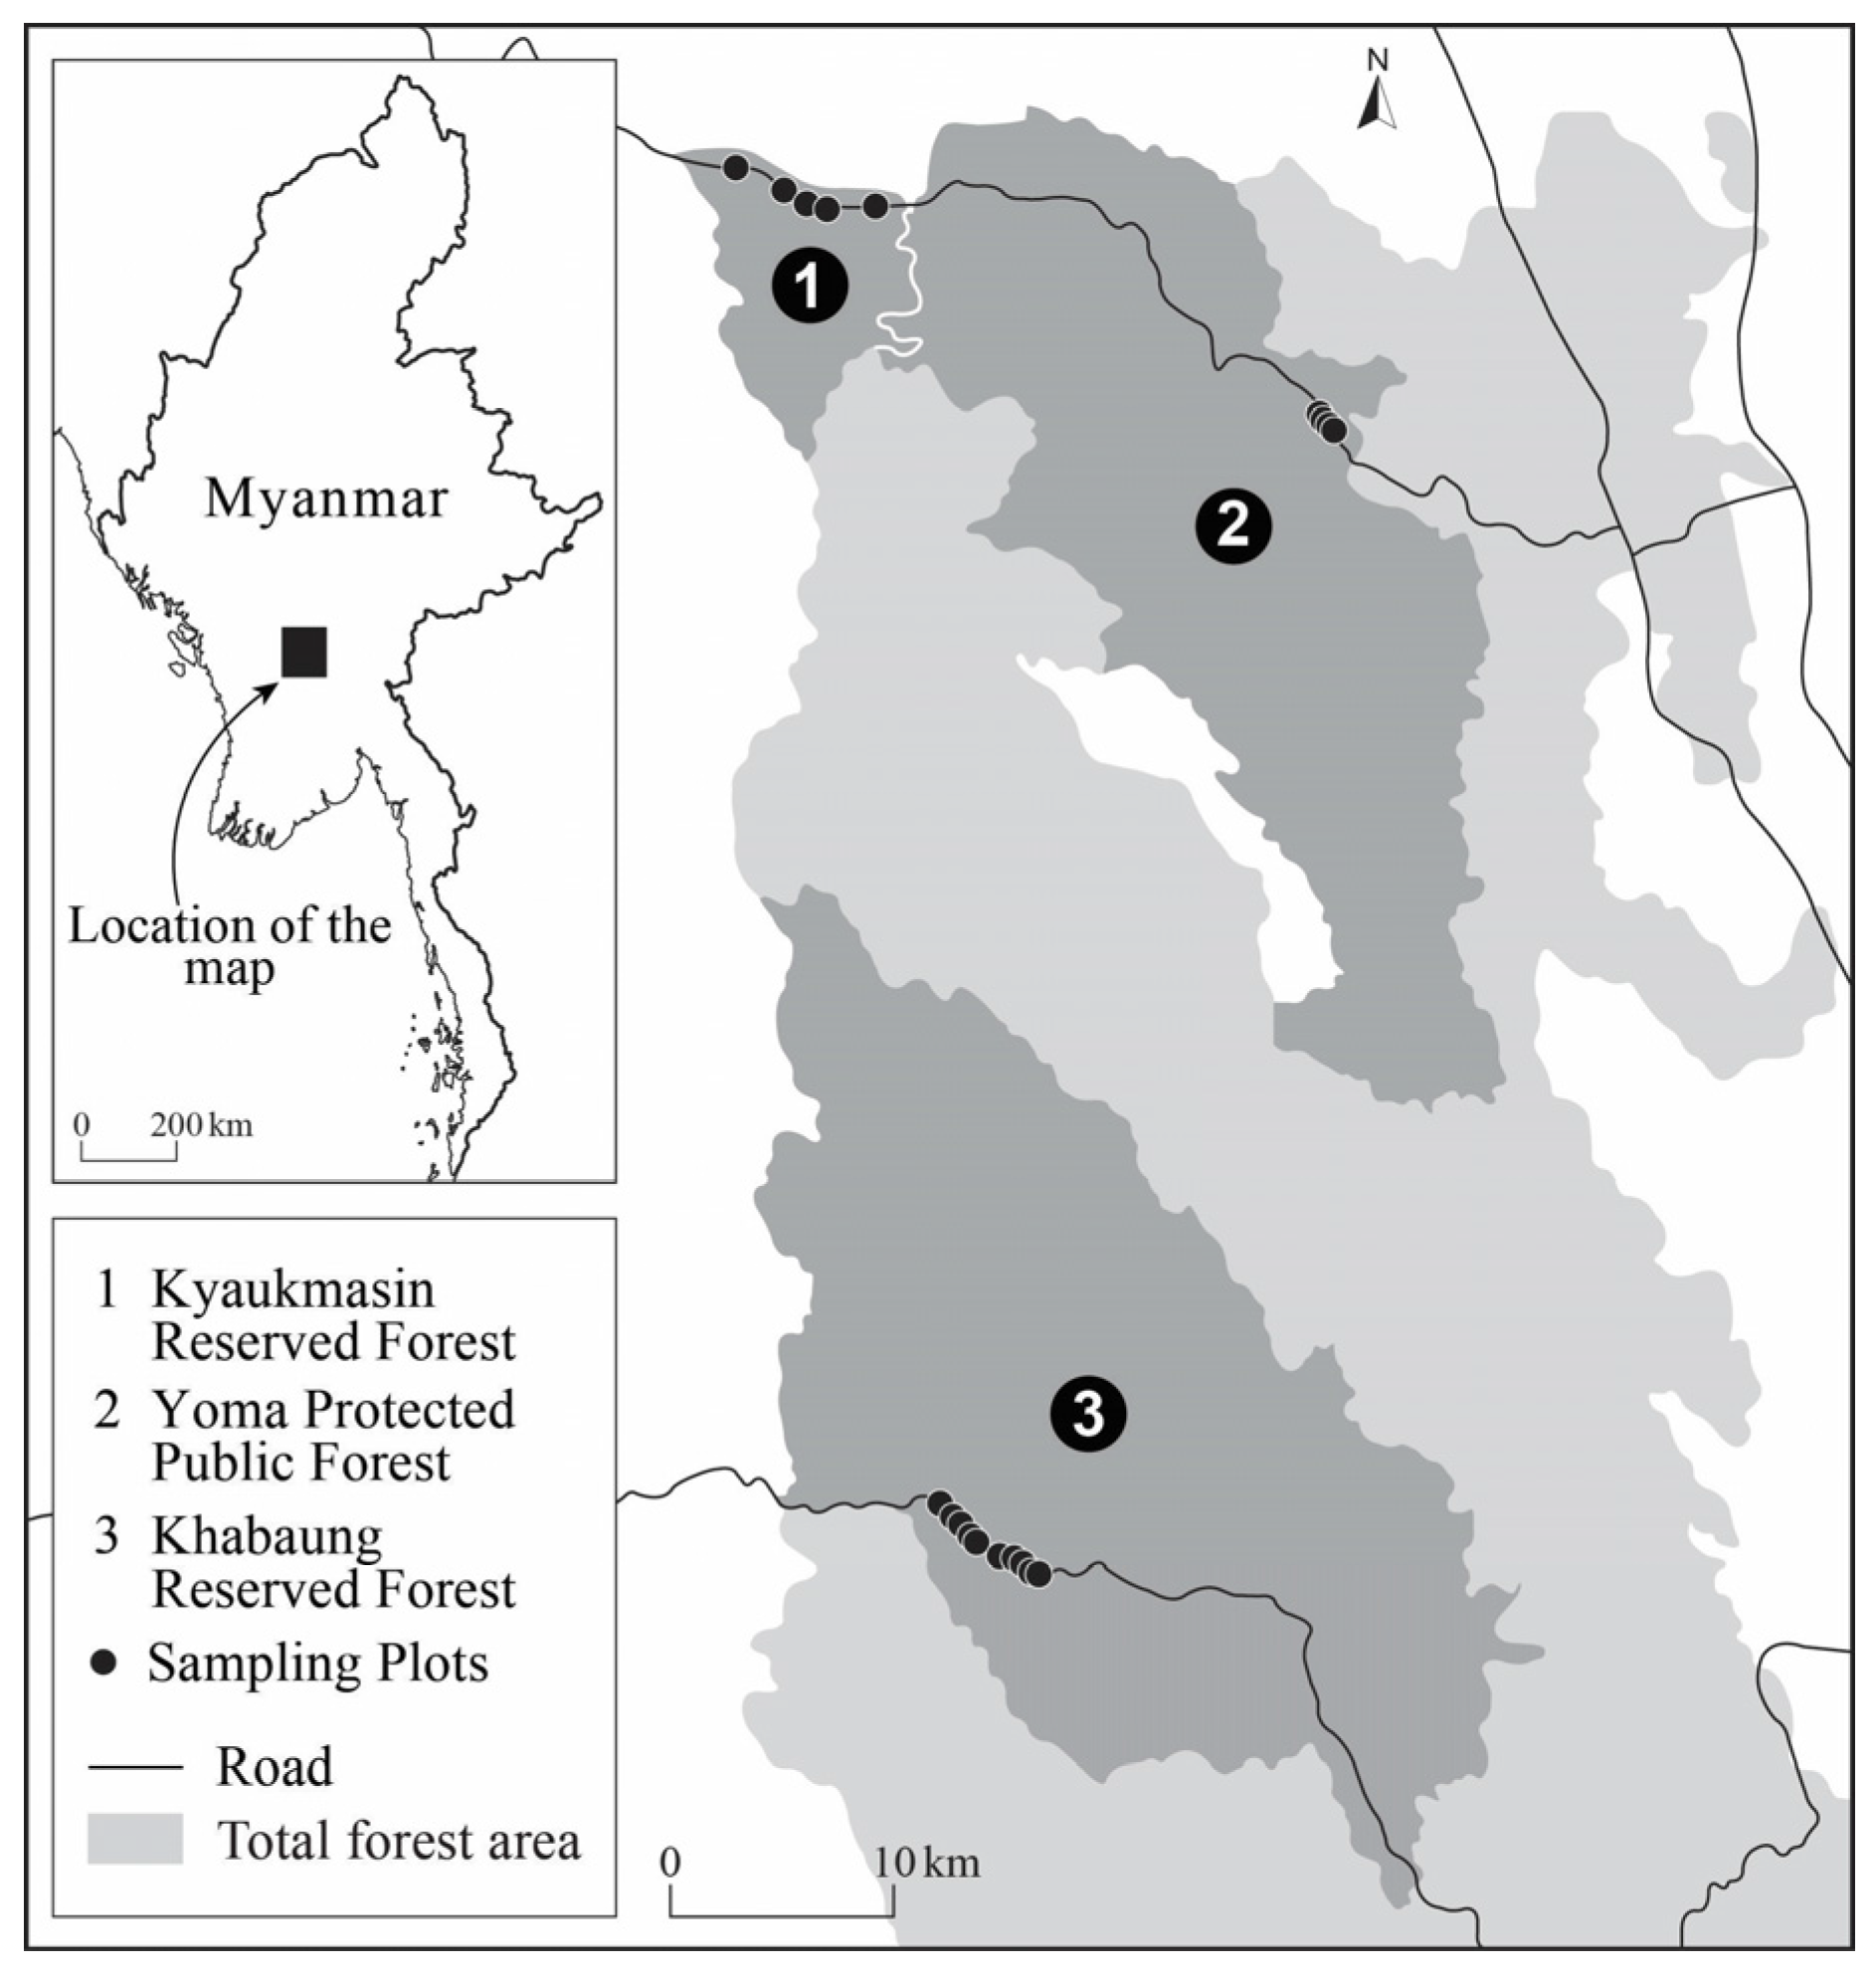
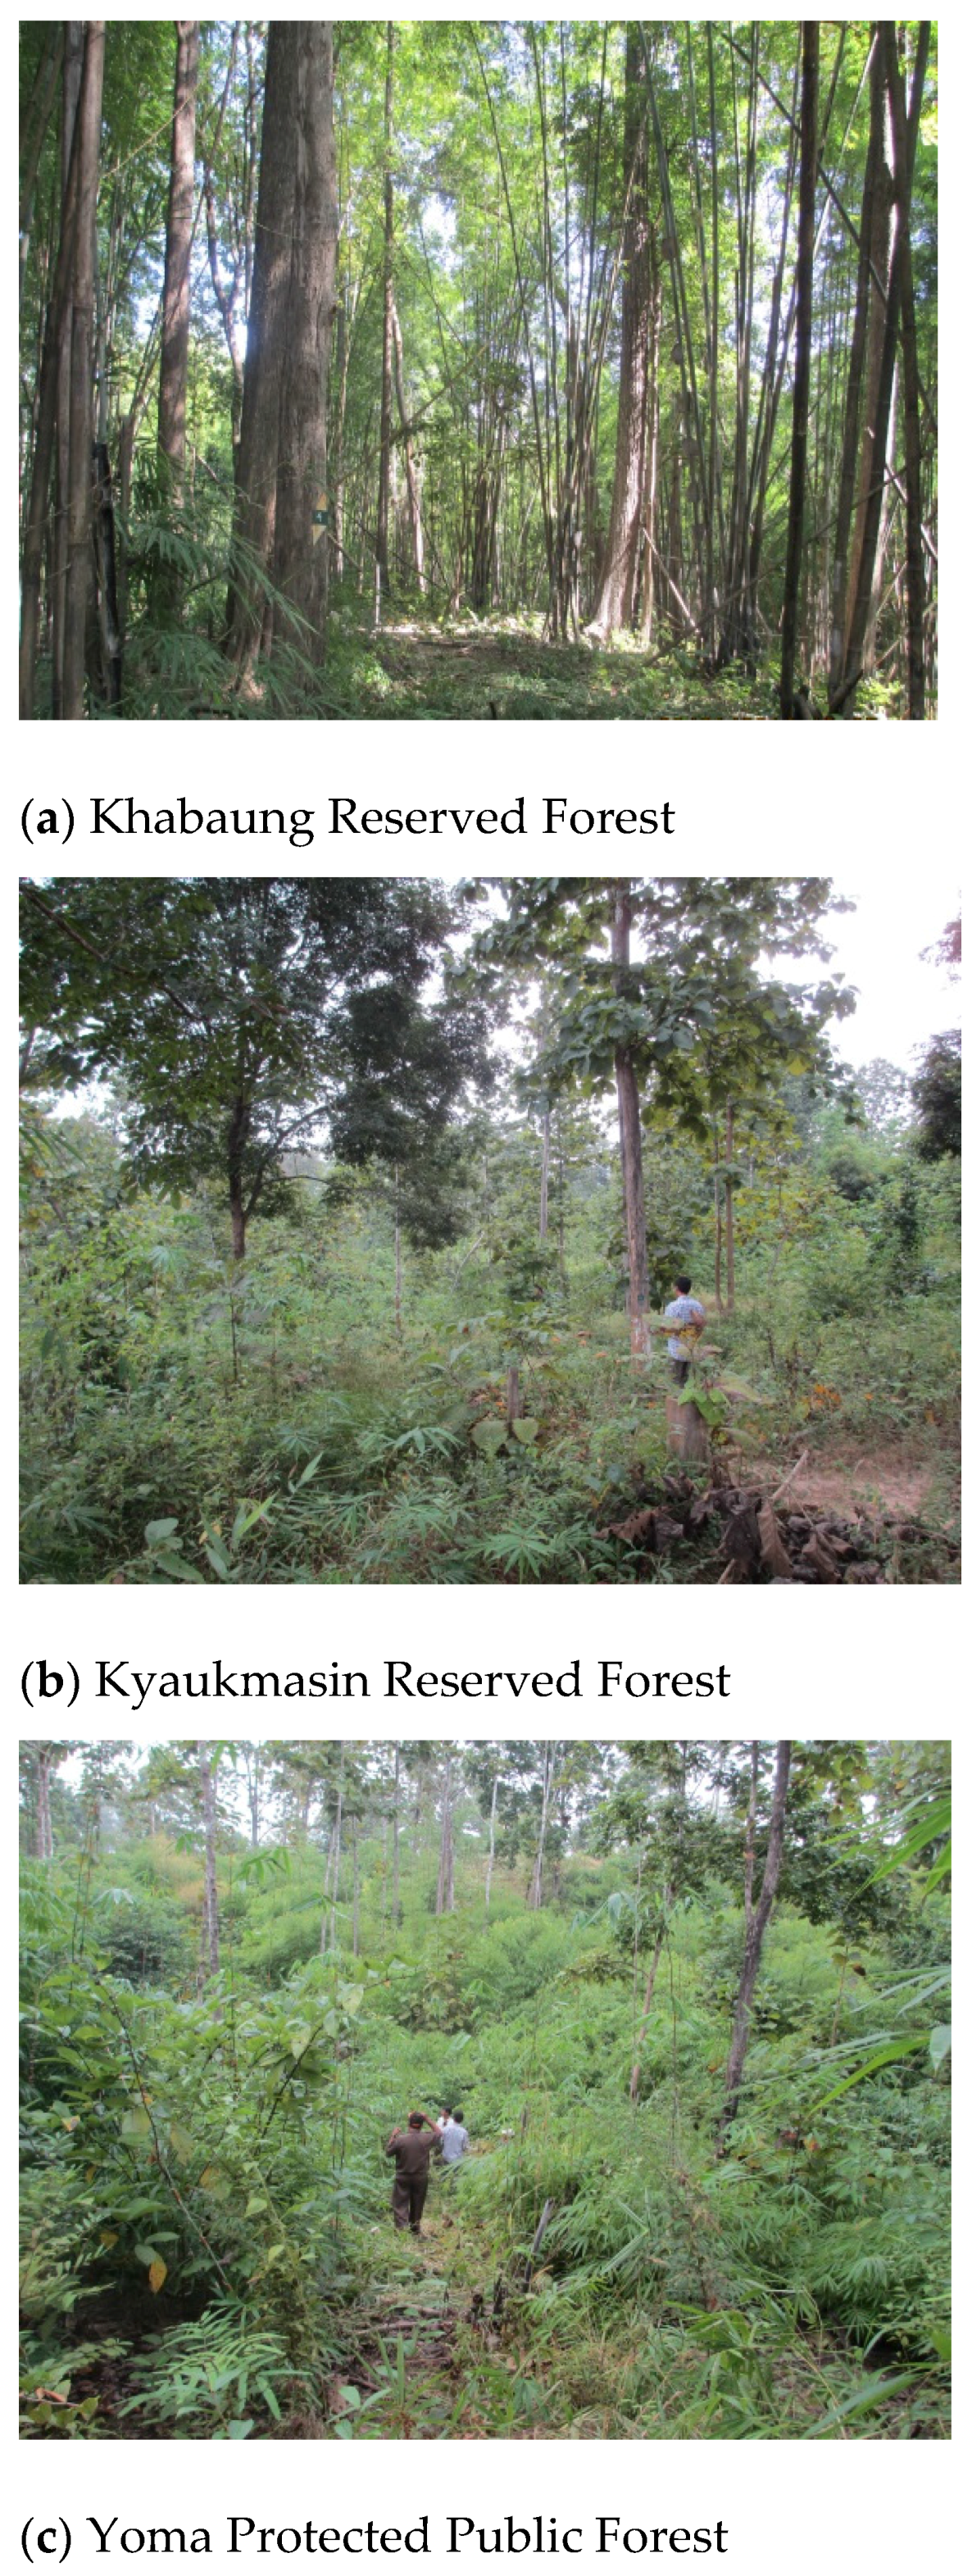
2.1. Study Area

The study was conducted in the mixed deciduous forests of the Bago Yo Ma Mountain Range, Taungoo District, Myanmar (19°9′24″ N, 95°59′40″ E; Figure 1). The region has a tropical monsoon climate with a rainy season and distinct dry season. The rainy season runs from May to October with heavy rainfall in July and August. The dry season lasts from November to May. Mean annual rainfall is 1776 mm, mean monthly temperature is approximately 27.5 °C, and relative humidity is 73% [24]. Dominant tree species include teak, pyinkado, padauk (Pterocarpus macrocarpus Kurz.), and taukkyan (Terminalia alata (Heyne) Roth.). Dominant understory species include kathit (Erythrina suberosa Roxb.), yindaik (Dalbergia cultrata Grah.), pyinma (Lagerstroemia speciosa (L.) Pers.), and thitya (Shorea obtusa Wall.).
Sampling was undertaken at three sites: Khabaung Reserved Forest, Kyaukmasin Reserved Forest, and Yoma Protected Public Forest (Figure 1 and Figure 2). Reserved forests have had restricted access since 1992, and public harvesting of forest products such as firewood, use of the land for agriculture, and activities such as camping and fishing are prohibited. Nevertheless, regulated selective logging with felling cycles designed to maintain a sustainable harvest [16] occurred until 2012. In contrast, public forests were established for public use and were therefore available for recreation and the collection of firewood and non-timber forest products. Regulated logging had occurred in public forests in the past, but records of these activities are limited. Local foresters report a long history of logging at Yoma, although the timing and extent of these operations is unknown.
Soils at Khabaung Reserved Forest have been characterized as loamy to sandy-clay loam, acidic (pH 5.9); with N content of 0.09% and organic matter of 4.3% in top soils (Forest Research Institute of Myanmar, unpublished). Soils have not been formally characterized at the other two sites, but appeared similar.

2.2. Plot Establishment

Nineteen sampling plots were established in 2013 by the Forest Department of Myanmar with the help of the International Tropical Timber Organization (ITTO): 10 plots in Khabaung Reserved Forest, 5 plots in Kyaukmasin Reserved Forest, and 4 plots in Yoma Protected Public Forest (Figure 1). Within each site plots were placed 100 to 2500 m from each other and at least 90 m from roads. Plot locations were chosen to facilitate accessibility but were considered generally representative of the broader area.
In each plot all trees with a diameter at breast height over-bark (1.3m, hereafter DBH) ≥5 cm were identified to species according to Kress et al. [25], and their height and diameter recorded. Trees with a diameter ≥20 cm were measured in a 50 m × 50 m plot, while smaller trees (diameter between 10 and 20 cm and <10 cm) were identified within nested 25 m × 25 m and 12.5 m × 12.5 m sub-plots, respectively.

2.3. Tree Biomass and Carbon Content

An allometric equation (Equation 1) for the dominant species, teak (T. grandis), was used for estimating aboveground tree biomass for all trees [26]:
B t   =   0.0543 × DBH 2.579
where Bt is tree biomass (kg) and DBH is the diameter at breast height (cm). Biomass was converted to carbon by multiplying by 0.47 [27].

2.4. Tree Species Composition and Diversity

Non-metric multidimensional scaling with a Bray-Curtis similarity measure was used to examine differences in tree species composition between the two reserved forests and the public forest. Two separate ordinations were run on log(x + 1) transformed species counts: one representing large trees (≥20 cm DBH) and another representing smaller trees (<20 cm DBH). ANOSIM (analysis of similarities) and SIMPER (similarity percentage analysis) were conducted after each ordination to quantify the magnitude of the differences between the sites and to identify species driving the differences. Differences between sites were represented using the effect size measure R. R ranges between approximately 0 and 1, where 0 represent complete similarity between sites and 1 represents complete dissimilarity between sites. In the small-tree analysis, one plot from Khabaung Reserved Forest differed substantially from all other plots due to the only detection of Grewia glabra L. in the dataset. Important patterns among the remaining sites were obscured in the resulting ordination diagram, so we present a diagram generated without this plot for visual clarity. However, ANOSIM and SIMPER were performed on the full data set. All analyses were conducted in Primer 6 [28].
Species diversity at each site and for each data set (large and small trees) was calculated using the effective number of species derived from the Shannon diversity index, H. Values are calculated as exp (H) and define the number of equally common species that give the original index value. The effective number of species can be used to compare the diversity of biotic communities on a linear scale; a community with a value of 5 is half as diverse as a community with a value of 10 [29].
Unless otherwise specified, results are presented as means ± 95% confidence intervals. Formal statistical tests were not applied due to the small sample size; with this in mind, inferences were made conservatively, focusing on large observed effects.

3. Results

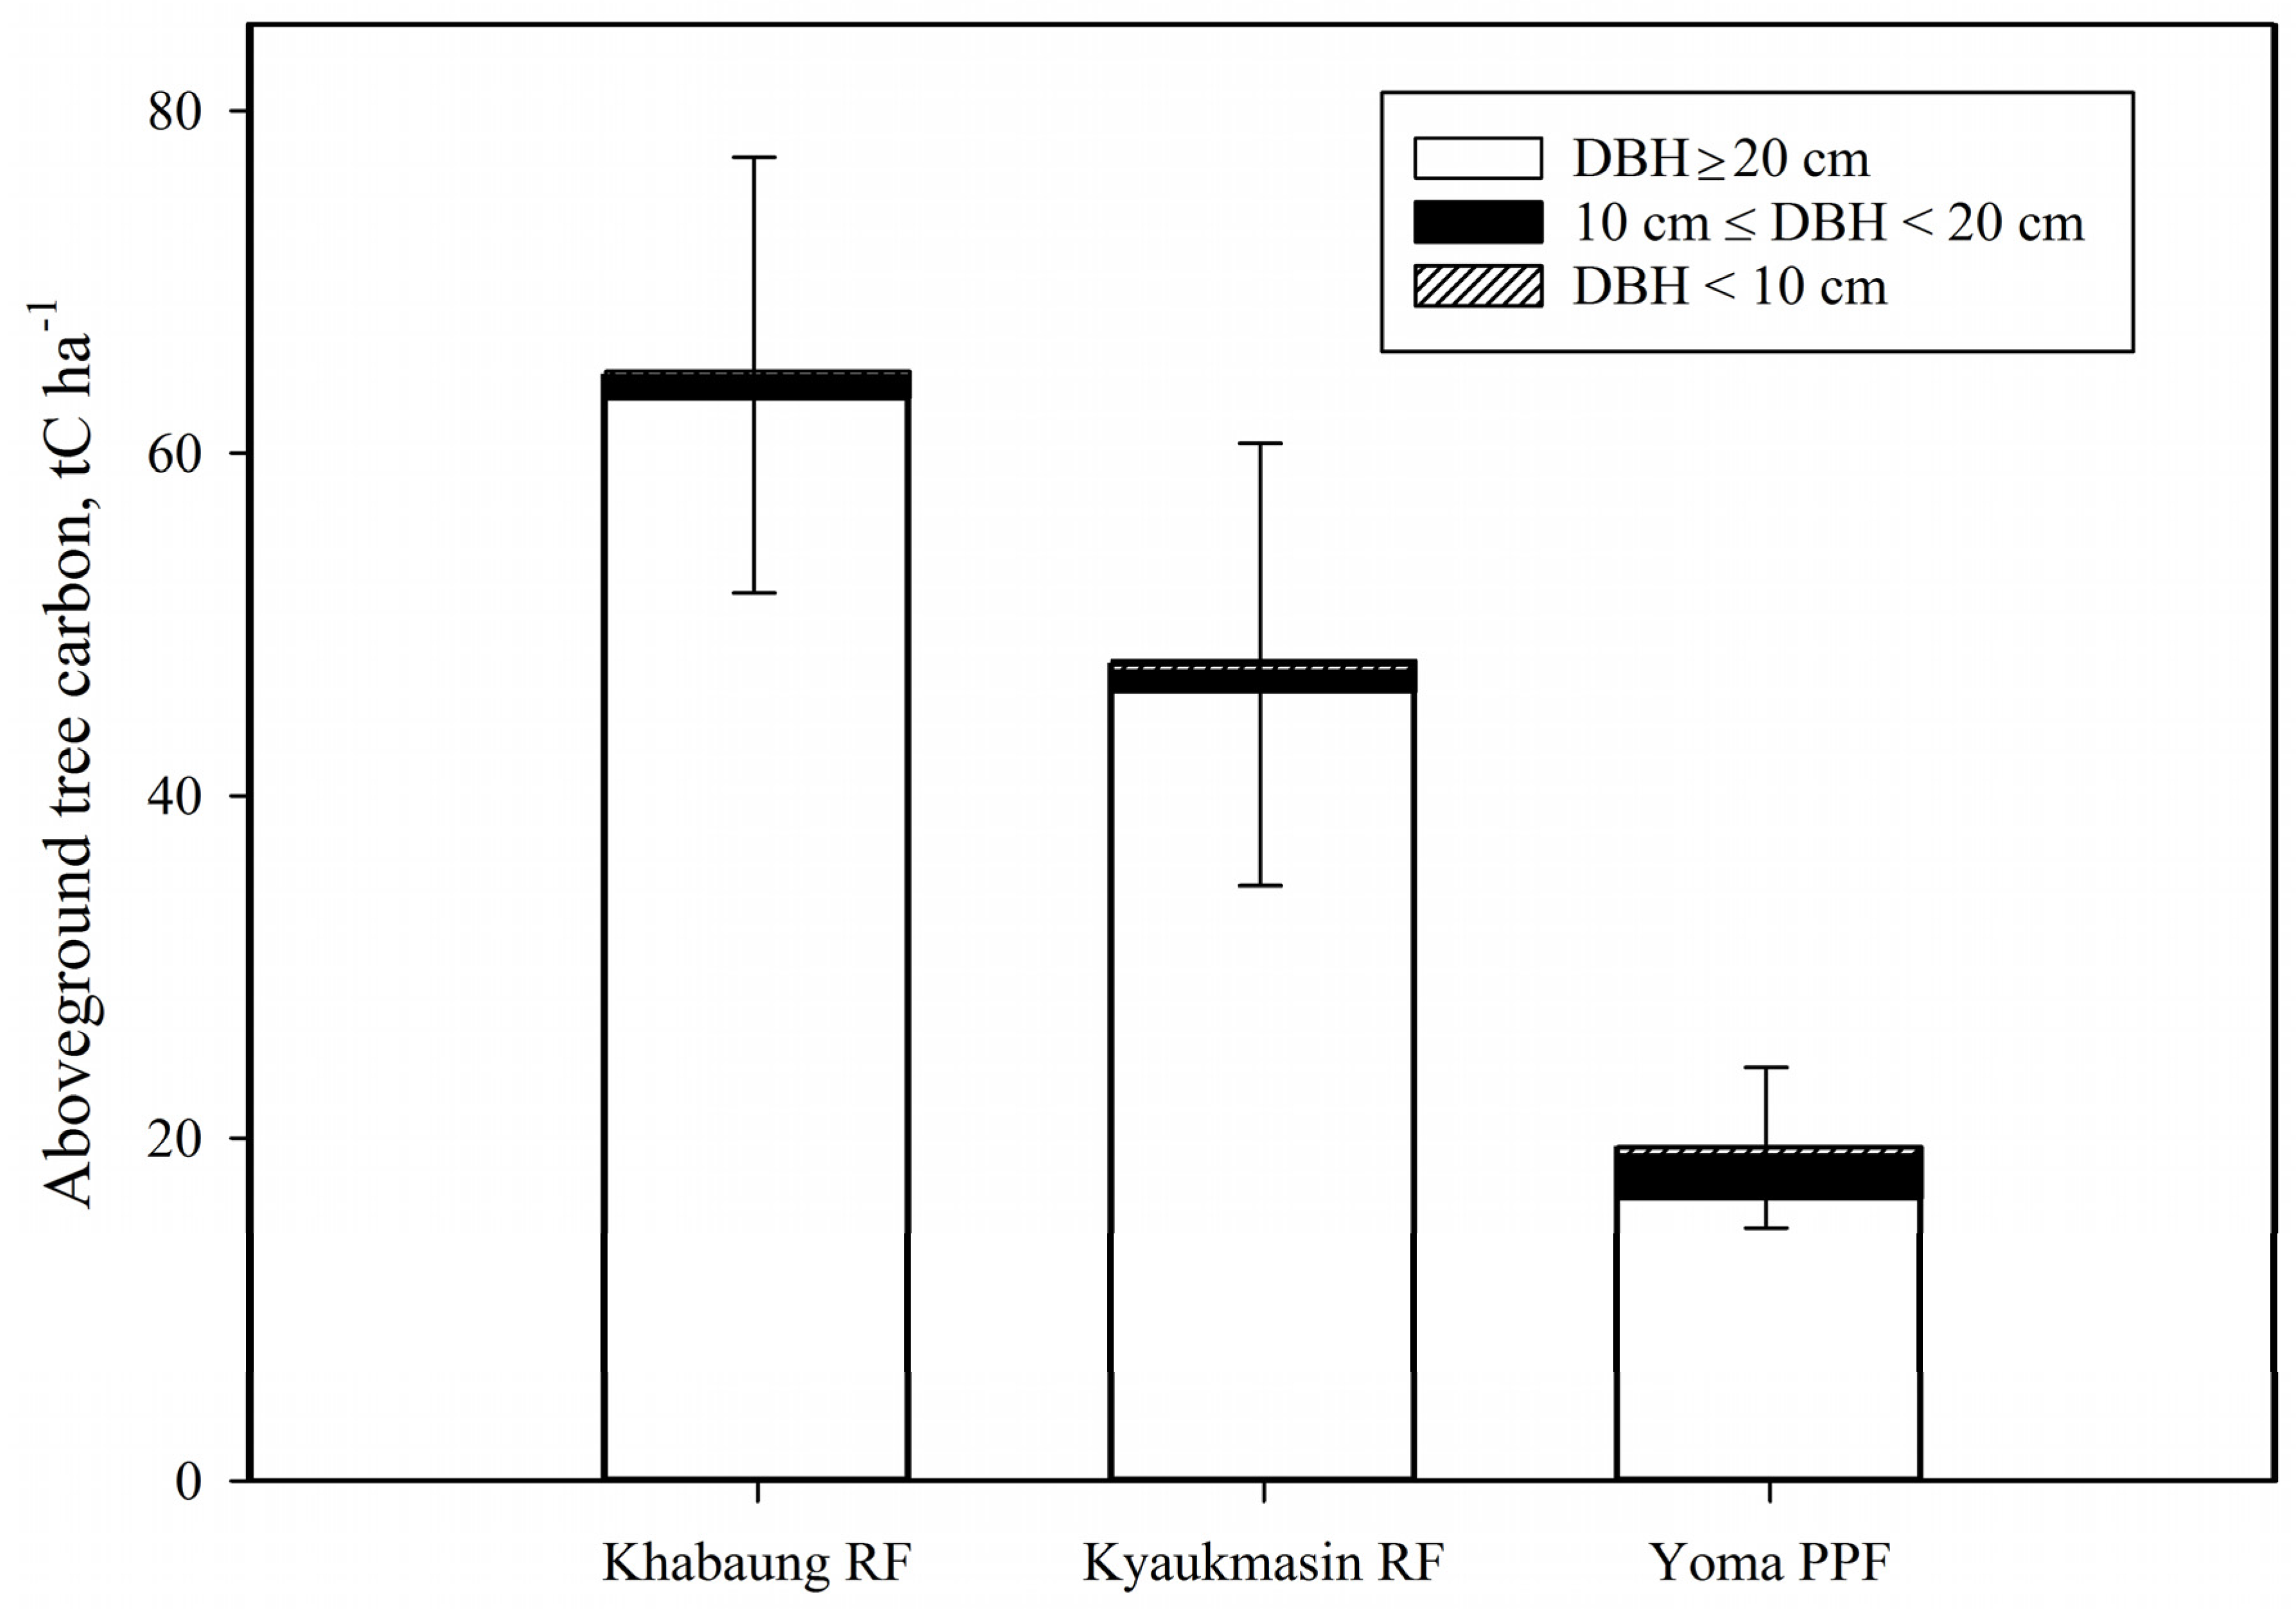
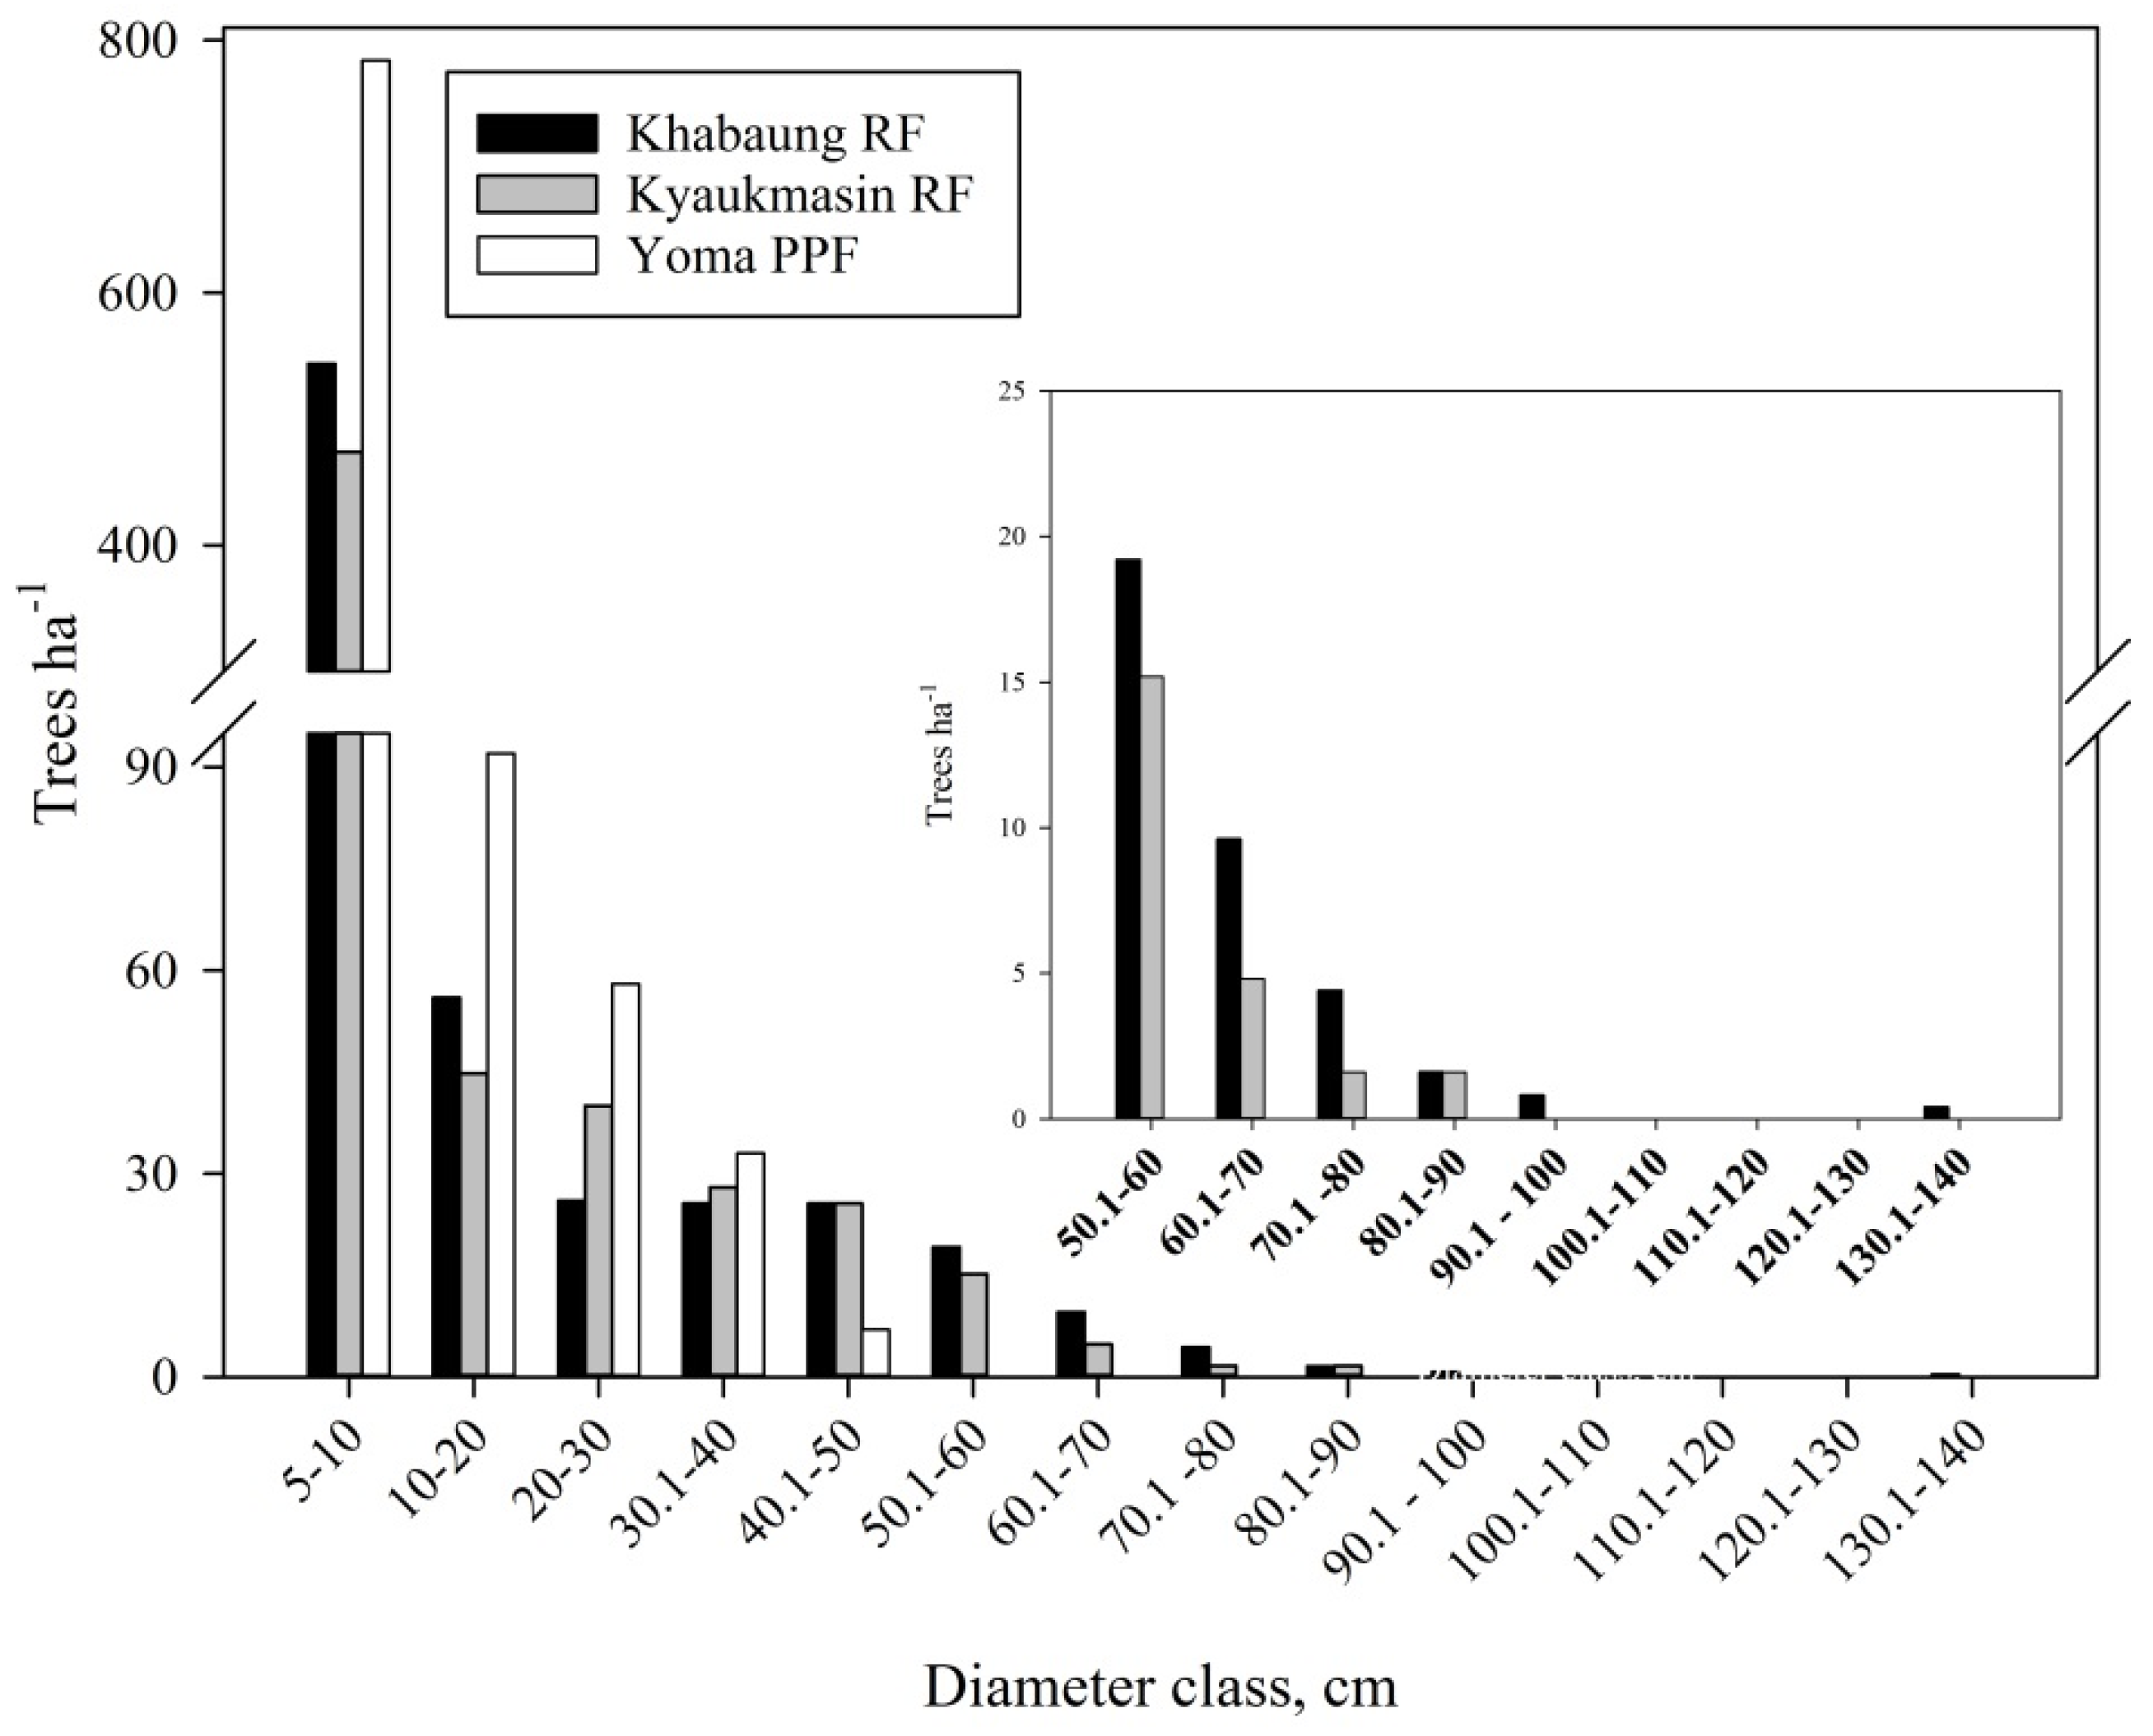
3.1. Forest Structure and Carbon Storage

Both reserved forests had six to seven times more tree genera present compared to the protected public forest (Table 1). Teak was the dominant species in most of the plots. Based on data from large trees (≥20 cm DBH), dominant height and density were similar among the three sites, but Yoma Protected Public Forest had substantially lower basal area compared to the Reserved Forests (Table 1).
Diameter class distributions (Figure 3) constructed using data from both large and small trees showed that Yoma had a greater number of stems <30 cm DBH and a smaller number of stems >40 cm DBH compared to the two other sites. The scarcity of large trees at Yoma was reflected in low aboveground tree carbon values compared to Khabaung and Kyaukmasin Reserved Forests (Figure 4). However, due to the large number of small trees at Yoma, carbon attributable to trees <10 cm DBH was greater at Yoma (2.5 ± 1.8 tC ha−1) compared to the two Reserved Forests (mean 1.3 ± 1.0 tC ha−1, Figure 4).

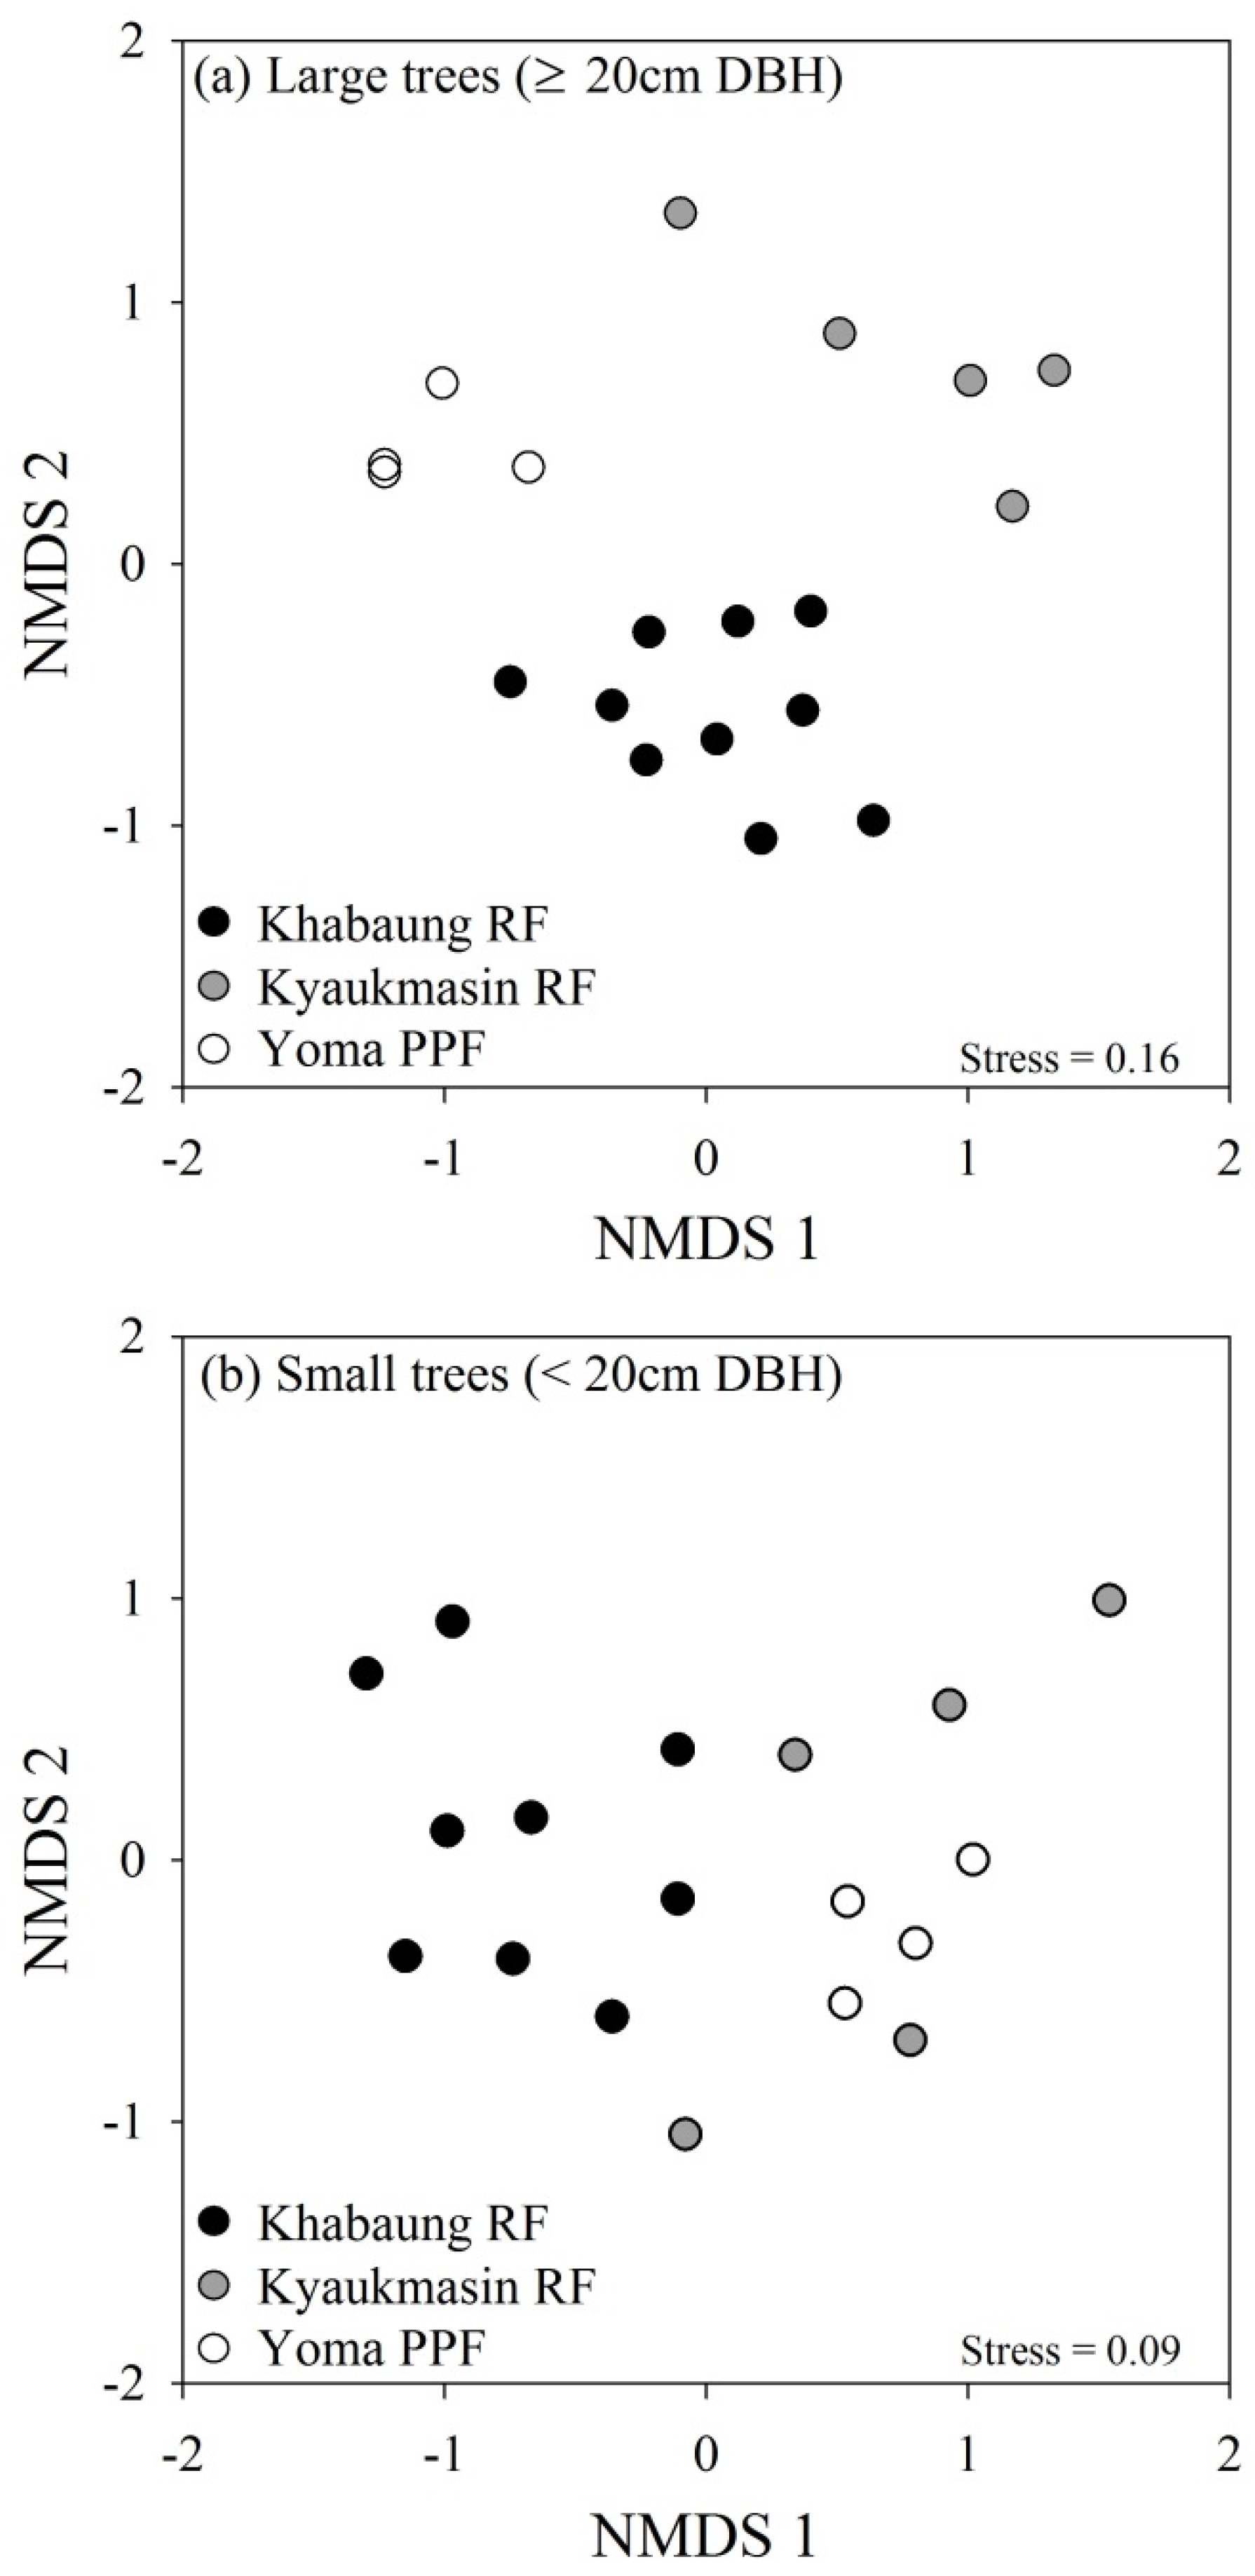
3.2. Tree Species Richness, Diversity, and Composition

Large-tree species richness and diversity was around five times higher in the two reserved forests compared to Yoma Protected Public Forest (Table 2). Small-tree richness and diversity appeared similar among all three sites, but was imprecisely estimated at Kyaukmasin and Yoma, making it difficult to draw firm conclusions (Table 2).
The compositional differences in large trees between all three sites were substantial (Figure 5a, Table 3). The difference between the two reserved forests was influenced by subtle changes in the abundance of several species, each contributing a small amount (<5.3%) to the total dissimilarity between these sites. In contrast, large-tree differences between the reserved forests and public forest were driven by two factors. First, the public forest had a greater abundance of large commercially valuable trees, such as teak, pyinkado, and Burma padauk (Pterocarpus macrocarpus Kurz). Second, many species present in at least one of the reserved forests were missing from the public forest, including Taukkyan (Terminalia alata Wall), Pyinma (Lagerstroemia speciosa), and Gyo (Schleichera oleosa (Lour.) Oken.). In total, 15 of 64 species recorded at ≥20 cm DBH occurred at both reserved sites, while only three of these (teak, pyinkado, and nabe) also occurred at Yoma. Details of the species contributing most to large-tree compositional differences are shown in supplementary Tables S1–S3.
For small trees, substantial compositional differences existed between Khabaung Reserved Forest and the other two sites, but a difference between Kyaukmasin Reserved Forest and Yoma Protected Public Forest was not clearly detected (Figure 5b, Table 3). The difference between the two reserved forests was influenced by a range of species, including Dalbergia cultrata Benth., Bombax insigne Wall., and teak (Table S4). In contrast, the difference between Khabaung Reserved Forest and Yoma Protected Public Forest was driven by teak (contribution to dissimilarity = 19.5%; Table S5), which was substantially more abundant at Yoma; the mean (± 95% CI) number of small teak stems per plot at Yoma and Khabaung was 6.25 ± 2.72 and 0.20 ± 0.30, respectively. Consistent with the large-tree data, Burma padauk was absent from the reserved forests, but present at Yoma.

4. Discussion

Given the continuing loss and degradation of tropical forests [8], the resulting carbon emissions [10], and the importance of these areas for biodiversity conservation [11], understanding the effects of tropical forest degradation on carbon storage and biodiversity is critical. As forest degradation can be reduced by establishing protected areas [21,22], we sort to assess the impact of forest protection on both carbon and biodiversity in a region experiencing rapid rates of forest loss. Overall, our findings indicate substantial benefits of forest protection policies in Myanmar, as both aboveground tree carbon stocks and large tree diversity were substantially higher in reserved compared to protected public forests.
Aboveground tree carbon at our study sites was strongly influenced by forest protection status. Carbon stocks in reserved forests averaged 56 tC ha−1 which was similar to the carbon estimate for Myanmar forests reported by the United Nations (52 tC ha−1 [12]). Yet carbon stocks in Yoma Protected Public Forest (19 tC ha−1) were almost three times lower. Reported values in the literature for mixed deciduous forests in Myanmar and neighboring Thailand are generally similar to our finding (e.g., range 27–47 tC ha−1 in Myanmar [18] and 60.1 tC ha−1 in Thailand [30]). However, an estimate of about 20 tC ha−1 was reported for mixed deciduous forests in India [31], indicating a degree of regional variation within the same general forest type. In general, the official value of 52 tC ha−1 for Myanmar seems reasonable for calculating aboveground tree carbon in the reserved forest system, but may substantially overestimate carbon stocks in public forests. Carbon accounting would likely be improved if reserved and public forests were accounted for separately.
Compared to the reserved forests, reduced carbon stocks in Yoma Protected Public Forest were primarily due to the near absence of trees with DBH >40 cm (Figure 3 insert). This is likely due to illegal logging, which is substantial in some tropical regions [32], but remains unquantified in Myanmar. Nevertheless, Yoma Protected Public Forest had a greater abundance of commercially valuable trees, such as teak, pyinkado, and Burma padauk, compared to the two reserved forests. It is possible that heavy penalties associated with the illegal extraction of these higher value species led to the maintenance of local populations at the expense of alternative species. This explanation is consistent with our biodiversity data, as large-tree richness and diversity was around five times greater in reserved forests compared to Yoma, reflecting the absence of many species from the public forest that occurred at one or both of the reserved sites.
In addition to the clear large-tree compositional difference between reserved and public forests we also detected distinct differences in both large and small-tree species composition between the two reserved forests, Khabaung and Kyaukmasin. Although these differences did not represent a change in species richness or diversity, they suggest that different parts of the reserved forest estate contain a substantially different mix of species. This is not surprising due to the heterogeneous nature of forest systems; for example, aboveground tree carbon was around 35% lower at Kyaukmasin (av. 47.6 tC ha−1) compared to Khabaung (av. 64.5 tC ha−1).
Although some degraded tropical forests have the capacity to support a high proportion of biodiversity present in primary forests [33], plant species richness and diversity is often reduced at secondary or degraded sites [11,34,35,36]. Nevertheless, as long as processes such as seed dispersal and pollination remain intact, the capacity exists for degraded sites to be restored [35]. In our study, the fact that there was no detectable difference in small-tree species richness or diversity between reserved and public forests suggests that restoration of degraded forest sites in Myanmar may be possible. This is important from a biodiversity perspective as effective species conservation must include both reserved and non-reserved areas [8,9].
Further, restoration of degraded sites has the potential to increase their biomass and thus carbon storage capacity. However, out data suggest that restoration of the Yoma Protected Public Forest may require management intervention. In a sustainable population, the diameter distribution would normally form a reverse J-shape, or negative exponential curve [37], characterized by a constant percentage decrease in density between neighboring diameter classes [38]. Our data show a different pattern of density change, with very high numbers of small trees leading to a much greater reduction between the 5–10 cm and 10–20 cm DBH classes than between the 10–20 cm and 20–30 cm classes. Teak, the dominant species in our study area, is light-demanding throughout its life cycle and smaller trees remain suppressed if stand density is too high [39,40]. Consequently, thinning may be required to stimulate sustainable tree growth and development in Yoma Protected Public Forest. More generally, appropriate management of forest stands containing a high density of small, suppressed trees has the capacity to increase rates of biomass accumulation, and thus contribute to the carbon storage capacity of Myanmar’s forests. This could substantially add to carbon credits if Myanmar participated in a REDD+ programme.
The findings of our study should be interpreted in the context of several design-based caveats. First, sample size in both Yoma and Kyaukmasin was low, leading to uncertain estimates in some cases. Second, plots were located to facilitate accessibility, potentially resulting in bias. Third, our data suggested differences in both species composition and aboveground carbon between the two reserved forests, indicating a degree of site-specific heterogeneity within the reserved forest estate. Consequently, our sample of four plots in the public forest may not have accounted adequately for spatial heterogeneity, making it difficult to extend our results to public mixed deciduous forests more generally. Nevertheless, our findings, both with respect to carbon storage and tree diversity, were predictable and consistent with similar studies in other tropical regions [11,12,15,31,35,36,37], lending reliability to our findings.
Data on tree biomass and biodiversity in Myanmar are scarce, thus our results represent an important foundation upon which future research can build. We recommend that the Myanmar Forestry Department expand its current set of 19 plots to more precisely determine the effect of forest protection on carbon storage and biodiversity across a wider area. Future studies should have a more robust design, with plots established further from roads and more evenly distributed across the landscape.

5. Conclusions

Our findings suggest that both aboveground tree carbon stocks and tree biodiversity in the mixed deciduous forests of Myanmar depend on forest protection status. Protected reserved forests stored almost three times more carbon and showed five-fold increases in large-tree richness and diversity compared to the public forest. The major difference in aboveground tree carbon storage between sites was attributed to the scarcity of large trees at Yoma Protected Public Forest, probably due to illegal logging. Differences in large-tree richness and diversity were due to the absence of several species from Yoma that were present in at least one of the reserved forests. We argue that heavy penalties associated with the removal of teak and other high value species from public forests may have resulted in the extraction of alternative species, resulting in their absence above 20 cm DBH. Nevertheless, our inability to detect differences in small-tree richness and diversity between reserved and public forests suggests that protection and subsequent restoration of public forests may be possible, and could have major biodiversity and carbon storage benefits.

Supplementary Materials

The following are available online at www.mdpi.com/1999-4907/7/10/217/s1, Table S1: SIMPER (SIMilarity PERcentage) analysis for large trees (≥20 cm BBH) showing the species that contributed most to the compositional difference between Khabaung and Kyaukmasin Reserved Forests. Table S2: SIMPER analysis for large trees (≥20 cm DBH) showing the species that contributed most to the compositional difference between Khabaung Reserved Forest and Yoma Protected Public Forest. Table S3: SIMPER analysis for large trees (≥20 cm DBH) showing the species that contributed most to the compositional difference between Kyaukmasin Reserved Forest and Yoma Protected Public Forest. Table S4: SIMPER analysis for small trees (<20 cm DBH) showing the species that contributed most to the compositional difference between Khabaung and Kyaukmasin Reserved Forests. Table S5: SIMPER analysis for small trees (<20 cm DBH) showing the species that contributed most to the compositional difference between Khabaung Reserved Forest and Yoma Protected Public Forest.

Acknowledgments

Authors would like to acknowledge the Forest Department, Ministry of Natural Resources and Environmental Conservation of Myanmar, and the International Tropical Timber Organization (ITTO) for the data provided. In particular, thanks to Thaung Naing Oo, Director of Forest Research Institute and head of the REDD+ Division of Myanmar, for allowing us to analyze the dataset for Kyaw Sein Win Tun master research project, Zaw Zaw and Pyae Phyo Mg for their contribution in sharing data they collected, and Ye Wint Htun and Myint Soe for sharing the information about the study areas. Authors also acknowledge Chandra Jayasuriya, a cartographer at the School of Geography, the University of Melbourne for re-drawing the high quality map for the manuscript (Figure 1).

Author Contributions

Kyaw Sein Win Tun accessed and analyzed the data for his master research project from which this publication originated. Julian Di Stefano performed ordination analysis, prepared all supporting Tables and Figure 5, and contributed to writing the paper. Liubov Volkova wrote the paper, analyzed carbon and diameter data, and prepared Figure 3 and Figure 4.

Conflicts of Interest

The authors declare no conflict of interest.

References

  1. Goklany, I.M. Climate Change: The 21st Century’s Most Urgent Environmental Problem or Proverbial Last Straw? In Adapt or Die: the Science, Politics and Economics of Climate Change; Okonski, K., Ed.; Profile Books: London, UK, 2003; pp. 56–74. [Google Scholar]
  2. Pachauri, R.K.; Allen, M.R.; Barros, V.R.; Broome, J.; Cramer, W.; Christ, R.; Church, J.A.; Clarke, L.; Dahe, Q.; Dasgupta, P.; et al. Synthesis Report. Contribution of Working Groups I, II and III to the Fourth Assessment Report of the Intergovernmental Panel. In Climate Change; IPCC.: Geneva, Switzerland, 2007; p. 104. [Google Scholar]
  3. Van der Werf, G.R.; Morton, D.C.; DeFries, R.S.; Olivier, J.G.J.; Kasibhatla, P.S.; Jackson, R.B.; Collatz, G.J.; Randerson, J.T. CO2 emissions from forest loss. Nature Geosci. 2009, 2, 737–738. [Google Scholar] [CrossRef]
  4. Lindenmayer, D.B.; Franklin, J.F.; Fischer, J. General management principles and a checklist of strategies to guide forest biodiversity conservation. Biol. Conserv. 2006, 131, 433–445. [Google Scholar] [CrossRef]
  5. Sala, O.E.; Chapin, F.S.; Armesto, J.J.; Berlow, E.; Bloomfield, J.; Dirzo, R.; Huber-Sanwald, E.; Huenneke, L.F.; Jackson, R.B.; Kinzig, A.; et al. Biodiversity—Global biodiversity scenarios for the year 2100. Science 2000, 287, 1770–1774. [Google Scholar] [CrossRef] [PubMed]
  6. Van Vuuren, D.P.; Sala, O.E.; Pereira, H.M. The future of vascular plant diversity under four global scenarios. Ecol. Soc. 2006, 11, 19. [Google Scholar]
  7. Pereira, H.M.; Leadley, P.W.; Proenca, V.; Alkemade, R.; Scharlemann, J.P.W.; Fernandez-Manjarres, J.F.; Araujo, M.B.; Balvanera, P.; Biggs, R.; Cheung, W.W.L.; et al. Scenarios for Global Biodiversity in the 21st Century. Science 2010, 330, 1496–1501. [Google Scholar] [CrossRef] [PubMed]
  8. Sloan, S.; Sayer, J.A. Forest resources assessment of 2015 shows positive global trends but forest loss and degradation persist in poor tropical countries. For. Ecol. Manag. 2015, 352, 134–145. [Google Scholar] [CrossRef]
  9. Laurance, W.F.; Sayer, J.; Cassman, K.G. Agricultural expansion and its impacts on tropical nature. Trends Ecol. Evol. 2014, 29, 107–116. [Google Scholar] [CrossRef] [PubMed]
  10. Houghton, R. Aboveground forest biomass and the global carbon balance. Glob. Chan. Biol. 2005, 11, 945–958. [Google Scholar] [CrossRef]
  11. Gibson, L.; Lee, T.M.; Koh, L.P.; Brook, B.W.; Gardner, T.A.; Barlow, J.; Peres, C.A.; Bradshaw, C.J.A.; Laurance, W.F.; Lovejoy, T.E.; et al. Primary forests are irreplaceable for sustaining tropical biodiversity. Nature 2011, 478, 378. [Google Scholar] [CrossRef] [PubMed]
  12. State of World’s Forests; Food and Agriculture Organization of the United Nations (FAO): Rome, Italy, 2011; pp. 113–123.
  13. FAO. Global Forest Resources Assessment 2015: Desk Reference; Food and Agricultural Organization of the United Nations: Rome, Italy, 2015; p. 253. [Google Scholar]
  14. Lynam, A.J. A National Tiger Action Plan for the Union of Myanmar; Myanmar Forest Department, Ministry of Forestry: Nay Pyi Taw, Myanmar, 2003.
  15. Aung, M.M. State of forests and forest genetic resources in Myanmar. In Proceedings of the Southeast Asian Moving Workshop on Conservation, Management and Utilization of Forest Genetic Resources, Bangkok, Thailand, 25 Febuary–10 March 2001; Koskela, J., Appanah, S., Pedersen, A.P., Markopoulos, M.D., Eds.; FORSPA: Bangkok, Tailand, 2001; Volume 31. [Google Scholar]
  16. Mon, M.S.; Mizoue, N.; Htun, N.Z.; Kajisa, T.; Yoshida, S. Factors affecting deforestation and forest degradation in selectively logged production forest: A case study in Myanmar. For. Ecol. Manag. 2012, 267, 190–198. [Google Scholar] [CrossRef]
  17. Bryant, R.L. The Political Ecology of Forestry in Burma: 1824–1994; University of Hawaii Press: Hawaii, HI, USA, 1997. [Google Scholar]
  18. Flint, E.P.; Richards, J.F. Historical-analysis of changes in land-use and carbon stock of vegetation in South and Southeast-Asia. Can. J. For. Res. 1991, 21, 91–110. [Google Scholar] [CrossRef]
  19. Leimgruber, P.; Kelly, D.S.; Steininger, M.K.; Brunner, J.; Müller, T.; Songer, M. Forest cover change patterns in Myanmar (Burma) 1990–2000. Environ. Conserv. 2005, 32, 356–364. [Google Scholar] [CrossRef]
  20. Blanford, H.R. Highlights of one hundred years of forestry in Burma. Emp. For. Rev. 1958, 37, 33–42. [Google Scholar]
  21. Joppa, L.N.; Pfaff, A. Global protected area impacts. Proc. R. Soc. Lond. B: Biol. Sci. 2011, 278, 1633–1638. [Google Scholar] [CrossRef] [PubMed]
  22. Robinson, B.E.; Holland, M.B.; Naughton-Treves, L. Does secure land tenure save forests? A meta-analysis of the relationship between land tenure and tropical deforestation. Glob. Environ. Chan. 2014, 29, 281–293. [Google Scholar] [CrossRef]
  23. UN-REDD. 2015 Annual Report of the UN-REDD Programme Fund. Executive Summary. Available online: http://www.unredd.net/index.php?view=list&slug=2015-annual-report&option=com_docman&Itemid=134 (accessed on 20 July 2016).
  24. Taungoo District Forestry Working Plan (2006–2016); Forest Department, Ministry of Environmental Conservation and Forestry: Taungoo, Myanmar, 2013.
  25. Kress, W.; DeFilipps, R.; Farr, E.; Daw, Y.Y.K. A Checklist of the trees, shrubs, herbs and climbers of Myanmar (Revised from the original works by JH Lace and HG Hundley). Contrib. USA Herb. 2003, 45, 1–590. [Google Scholar]
  26. Siregar, C.A. Develop Forest Carbon Standard and Carbon Accounting System for Small-scale Plantation Based on Local Experiences. RED-PD 2011, 7, 09. [Google Scholar]
  27. IPCC. Good Practice Guidance for Land Use, Land-Use Change and Forestry; Penman, J., Gytarsky, M., Hiraishi, T., Krug, T., Kruger, D., Pipatti, R., Buendia, L., Miwa, K., Ngara, T., Tanabe, K., et al., Eds.; Institute for Global Environmental Strategies (IGES) for the Intergovernmental Panel on Climate Change (IPCC): Kanagawa, Japan, 2003; pp. 3.11–13.22. [Google Scholar]
  28. Clarke, K.R.; Warwick, R.M. Change in Marine Communities: An Approach to Statistical Analysis and Interpretation, 2nd ed.; PRIMER-E: Plymouth, UK, 2001. [Google Scholar]
  29. Jost, L. Entropy and diversity. Oikos 2006, 113, 363–375. [Google Scholar] [CrossRef]
  30. Petsri, S.; Pumijumnong, N.; Wachrinrat, C.; Thoranisorn, S. Aboveground carbon content in mixed deciduous forest and teak plantations. Environ. Nat. Resour. J. 2007, 5, 1–10. [Google Scholar]
  31. Salunkhe, O.; Khare, P.K.; Sahu, T.R.; Singh, S. Estimation of tree biomass reserves in tropical deciduous forests of Central India by non-destructive approach. Trop. Ecol. 2016, 57, 153–161. [Google Scholar]
  32. FAO. Best Practices for Improving Law Compliance in the Forest Sector; Food and Agricultural Organization: Rome, Italy, 2005. [Google Scholar]
  33. Whitworth, A.; Downie, R.; von May, R.; Villacampa, J.; MacLeod, R. How much potential biodiversity and conservation value can a regenerating rainforest provide? A ‘best-case scenario’ approach from the Peruvian Amazon. Trop. Conserv. Sci. 2016, 9, 224–245. [Google Scholar]
  34. Oo, T.N.; Lee, D.K. Species composition and stand structure of natural forest, timber-harvested forest and degraded forest in the Bago Yoma region of Myanmar. J. Korean For. Soc. 2007, 96, 572–579. [Google Scholar]
  35. Onyekwelu, J.C.; Mosandl, R.; Stimm, B. Tree species diversity and soil status of primary and degraded tropical rainforest ecosystems in south-western Nigeria. J. Trop. For. Sci. 2008, 20, 193–204. [Google Scholar]
  36. Fibich, P.; Leps, J.; Novotny, V.; Klimes, P.; Tesitel, J.; Molem, K.; Damas, K.; Weiblen, G.D. Spatial patterns of tree species distribution in New Guinea primary and secondary lowland rain forest. J. Veg. Sci. 2016, 27, 328–339. [Google Scholar] [CrossRef]
  37. Rubin, B.D.; Manion, P.D.; Faber-Langendoen, D. Diameter distributions and structural sustainability in forests. For. Ecol. Manag. 2006, 222, 427–438. [Google Scholar] [CrossRef]
  38. Meyer, H.A.; Stevenson, D.D. The structure and growth of virgin beech-birch-maple-hemlock forests in northern Pennsylvania. J. Agric. Res. 1943, 67, 465–484. [Google Scholar]
  39. Kadambi, K. Silviculture and Management of Teak; Bulletin 24 School of Forestry Stephen F; Austin State University Nacogdoches: Nacogdoches, TX, USA, 1972. [Google Scholar]
  40. Krishnapillai, B. Silviculture and management of teak plantations. FAO Unasylva, No. 201, Teak Volume 51, 2000/2. Available online: http://www.fao.org/DOCREP/X4565E/x4565e04.htm#P0_0.2000 (accessed on 10 June 2016).
Figure 1. Study sites in the Bago Yo Ma Mountain Range, Taungoo District, Myanmar.
Forests 07 00217 g001
Figure 2. Photographs of (a) the Khabaung Reserved Forest; (b) Kyaukmasin Reserved Forest; and (c) Yoma Protected Public Forest.
Forests 07 00217 g002
Figure 3. Diameter class distribution at the Khabaung Reserved Forest, Kyaukmasin Reserved Forest, and Yoma Protected Public Forest study sites. The inset shows the distribution of trees >50 cm DBH more clearly.
Forests 07 00217 g003
Figure 4. Aboveground tree carbon at the Khabaung Reserved Forest, Kyaukmasin Reserved Forest, and Yoma Protected Public Forest study sites. Error bars are 95% confidence intervals.
Forests 07 00217 g004
Figure 5. Non-metric multidimensional scaling (NMDS) ordination of (a) large trees and (b) small trees at Khabaung Reserved Forest, Kyaukmasin Reserved Forest, and Yoma Protected Public Forest. In (b) one outlying plot from Khabaung has been removed to improve visual clarity (see methods for details).
Forests 07 00217 g005
Table 1. Dominant tree species ≥20cm DBH (Diameter at Breast Height) and stand characteristics at the study sites.
Study Site*Dominant Species (% of Basal Area/ha)No. of SpeciesNo. of GeneraNo. of FamiliesNo. Stems (ha−1)Basal Area (m2 ha−1)Av Height (m)Av DBH (cm)
Khabaung Reserved Forest
Plot 1T(13), TT(17), YD(17), P(13)10989637.721.839.3
Plot 2T(36), PK(9), P(9), TK(9)1313813261.026.346.2
Plot 3T(22), TK(28), K(9), TW(6)1413712855.922.343.7
Plot 4T(33), Y(9), TW (6), A(6)1514913259.723.745.2
Plot 5T(54), P(17), YD(8), TK(8)7669638.919.040.5
Plot 6T(8), P(14), B(14), TP(8)16141014460.621.842.1
Plot 7T (55), M (15), YZ (10), B (10)6548033.624.142.0
Plot 8T(33), D(13), H(8), N(4)1413109644.428.146.3
Plot 9T(31), TK(22), Y(6), TW(6)14141112853.220.041.6
Plot 10T(28), TD(12), P(8), N(8)1210910045.824.045.8
Average ± 95% CI12118113 ± 1649.1 ± 7.423.1 ± 1.943.3 ± 1.8
Kyaukmasin Reserved Forest
Plot 1T(13), PK(29), N(13), S(8)1212109636.412.638.0
Plot 2T(12), TK(23), G(19), PT(8)12121210436.614.635.2
Plot 3T(33), G(21), N(6), K(6)14141113252.023.839.4
Plot 4T(22), TY(19), G(8), TT(8)17151214856.218.538.0
Plot 5T(19), TY(19), A(8), DN(8)14131410442.019.240.3
Average ± 95% CI141312117 ± 2844.7 ± 1117.7 ± 5.438.2 ± 2.4
Yoma Protected Public Forest
Plot 1T(93), PD(7)22211231.517.628.0
Plot 2T(78), PD(22)2229224.318.826.3
Plot 3T(94), N(6)2227222.617.031.3
Plot 4T(52), PK(38), PD(10)33311635.718.030.8
Average ± 95% CI22298 ± 3228.5 ± 9.817.8 ± 1.229.1 ± 3.8
* T, Kyun (T grandis); A, Aukchinsa (Chisocheton paniculatus Hiern.); B, Binga (Mitragyna rotundifolia (Roxb.) Kuntze); D, Didu (Salmalia insignis Schott & Endl.); DN, Dwani (Eriolaena candollei Wall.); G, Gyo (Schleichera oleosa (Lour.) Oken.); H, Hnaw (Adina cordifolia (Roxb.) Benth. & Hook.f. ex B.D.Jacks.); KT, Kathit (Erythrina suberosa); K, Kyetyo (Hyptianthera stricta (Roxb.) Wight & Arn.); M, Madama (Dalbergia ovata Benth.); N, Nabe (Lannea coromandelica (Houtt.) Merr.); PD, Padauk (Pterocarpus macrocarpus); PT, Petthan (Heterophragma adenophylla (Wall. ex G. Don) Seem. ex Benth. & Hook. f.); PK, Pyinkado (Xylia xylocarpa); P, Pyinma (Lagerstroemia speciosa L.); S, Seikchi (Bridelia retusa (L.) A. Juss.); TK, Taukkyan (Terminalia alata); TD, Thande (Stereospermum colais (Buch.-Ham. ex Dillwyn) Mabb.); TT, Than-that (Albizzia lucida (Roxb.) Benth.); TW, Thinwin (Millettia ovalifolia Kurz.); TP, Thit-pagan (Millettia multiflora Collett & Hemsl.); TY, Thitya (Shorea obtusa); YD, Yindaik (Dalbergia cultrata); YZ, Yinzat (Dalbergia fusca Pierre.); Y, Yon (Anogeissus acuminata (Roxb.) Wall. ex Bedd.).
Table 2. Tree species richness and diversity (mean ± 95% confidence intervals) at the three sites measured using both large (≥20 cm DBH) and small (<20 cm DBH) trees. Diversity values are the effective number of species (the exponent of the Shannon diversity index), and can be interpreted on a linear scale.
Biodiversity MetricSite
KhabaungKyaukmasinYoma
Species richness (large trees)12.0 ± 2.413.4 ± 3.22.3 ± 0.8
Species richness (small trees)4.9 ± 2.25.0 ± 5.27.8 ± 5.3
Diversity (large trees)8.6 ± 2.09.9 ± 2.21.7 ± 1.0
Diversity (small trees)4.1 ± 1.84.7 ± 4.75.8 ± 5.1
Table 3. ANOSIM (analysis of similarities) results for both the large-tree and small-tree data sets. The value of R represents the magnitude of the difference between contrasted sites. R ranges between approximately 0 and 1, where 1 represents complete dissimilarity between sites.
ContrastEffect size (R)
Large trees (≥20 cm DBH)
Khabaung vs. Kyaukmasin0.87
Khabaung vs. Yoma0.89
Kyaukmasin vs. Yoma0.78
Small trees (<20 cm DBH)
Khabaung vs. Kyaukmasin0.51
Khabaung vs. Yoma0.61
Kyaukmasin vs. Yoma0.26

