
Warm and Fertile Sub-Humid Conditions Enhance Litterfall to Sustain High Soil Respiration Fluxes in a Mediterranean Cork Oak Forest


 ,
,
Abstract
:1. Introduction
2. Materials and Methods
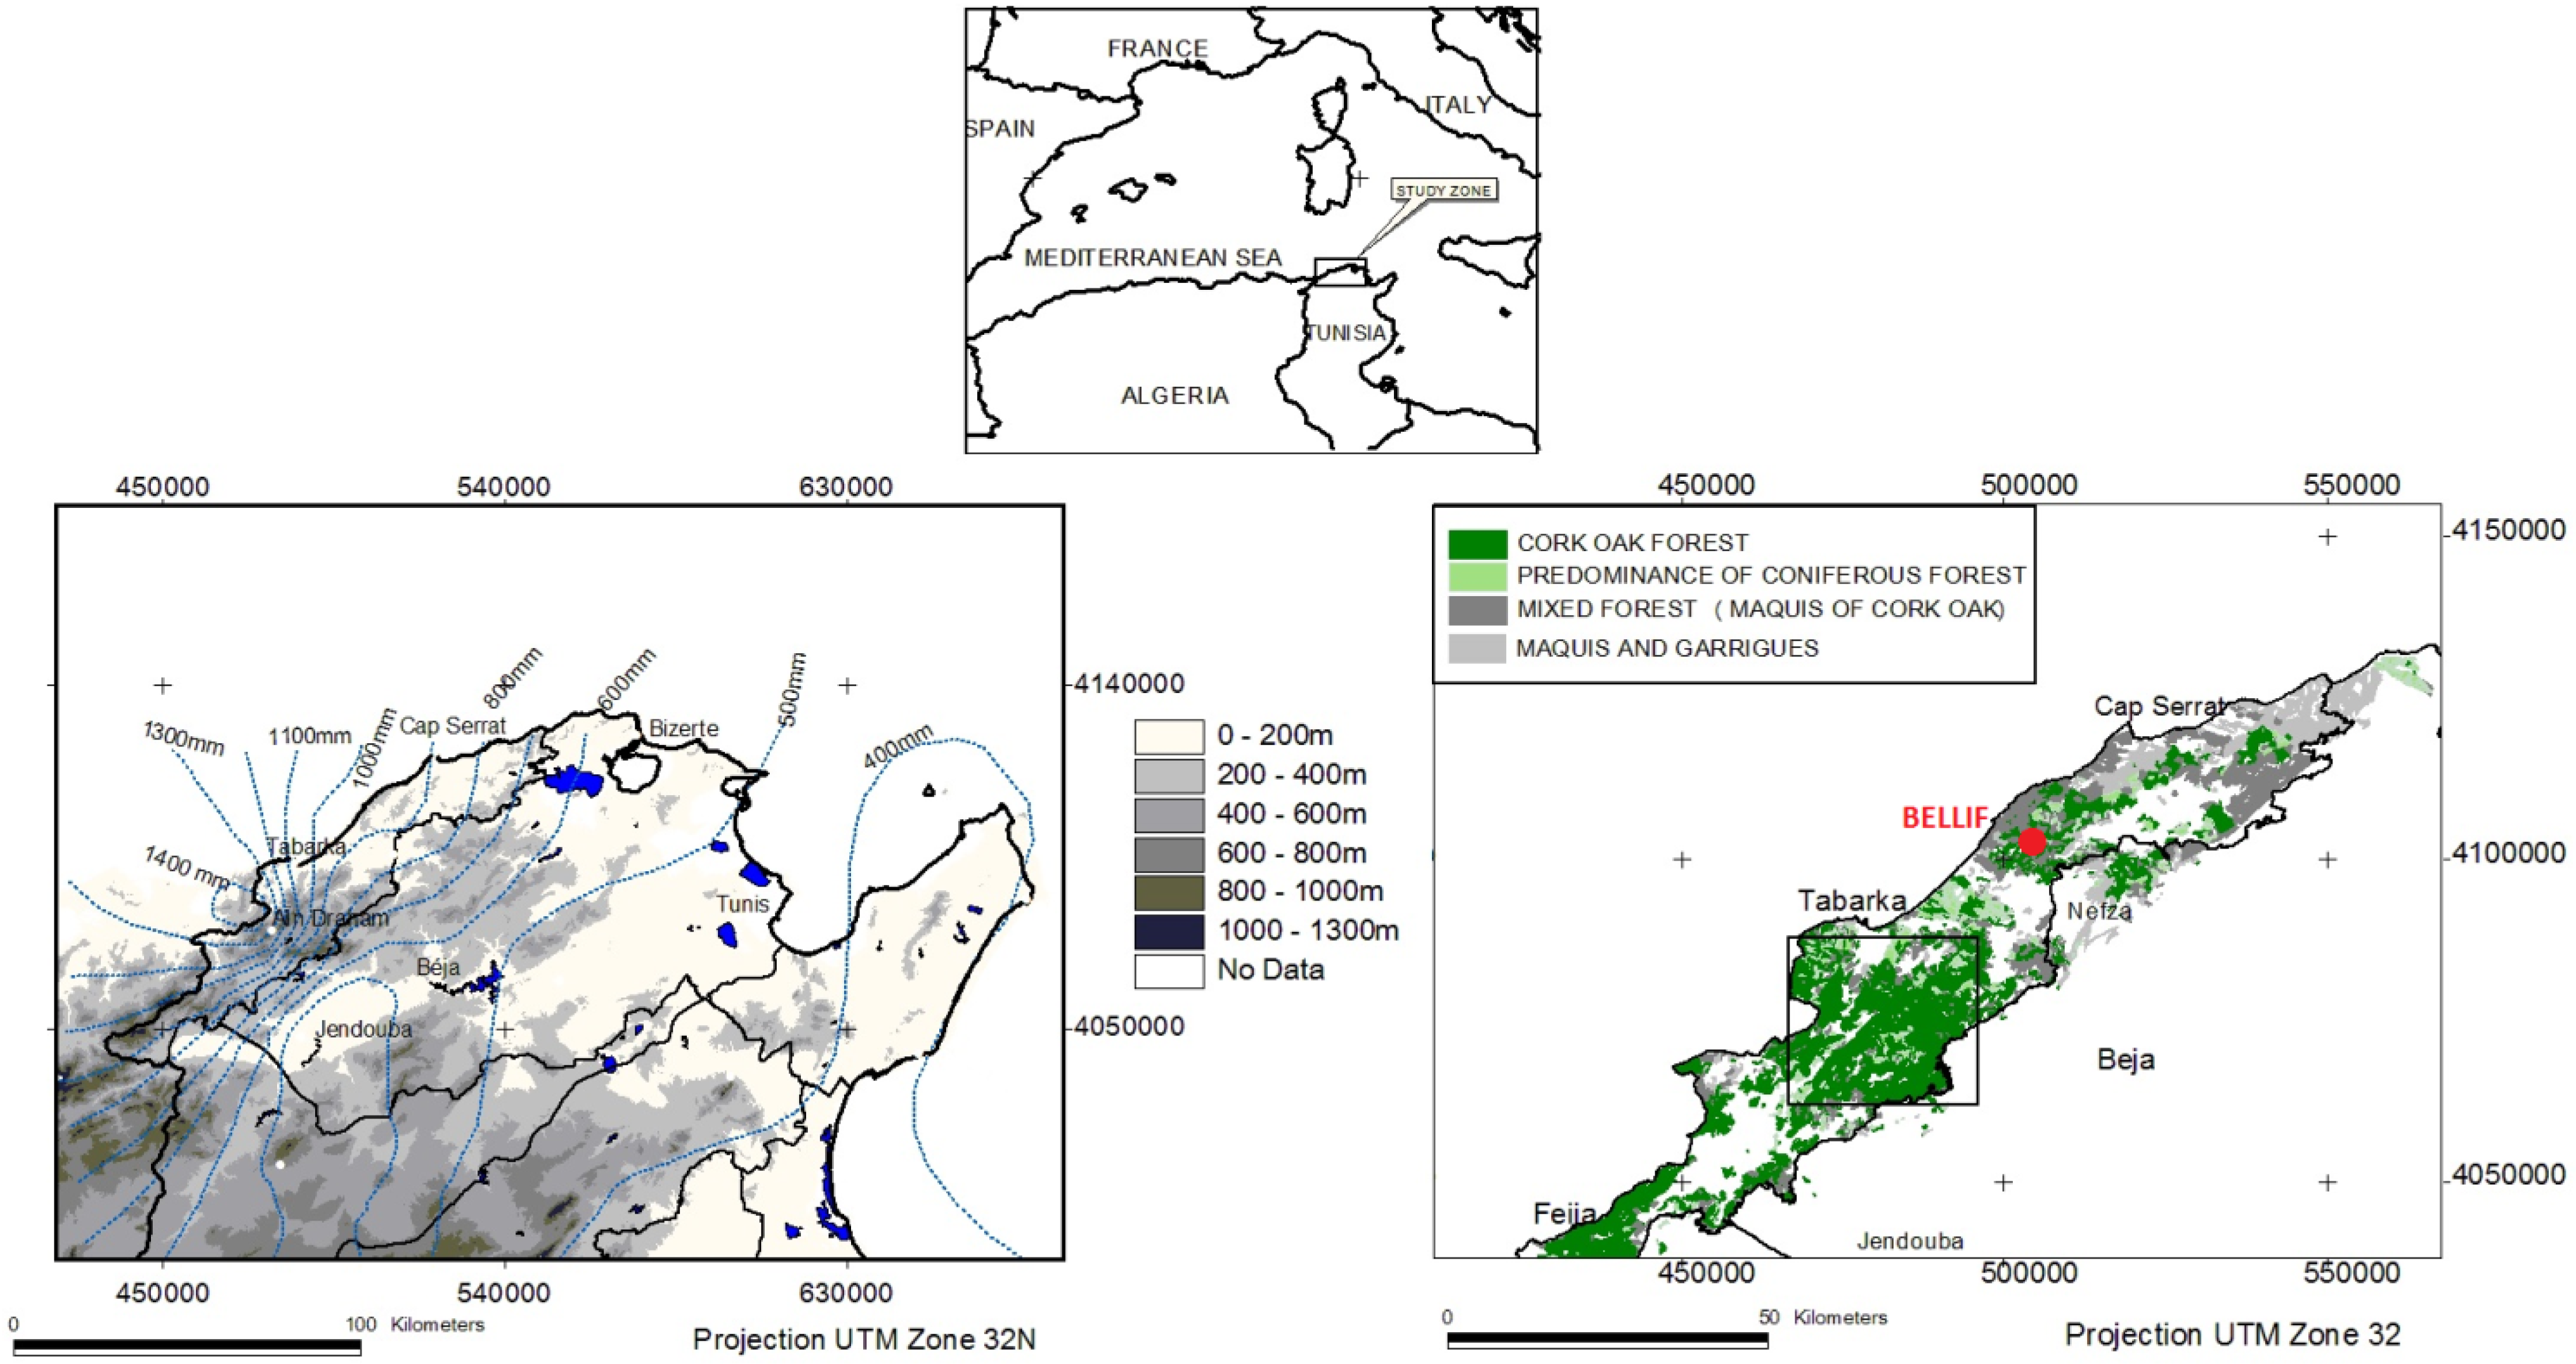
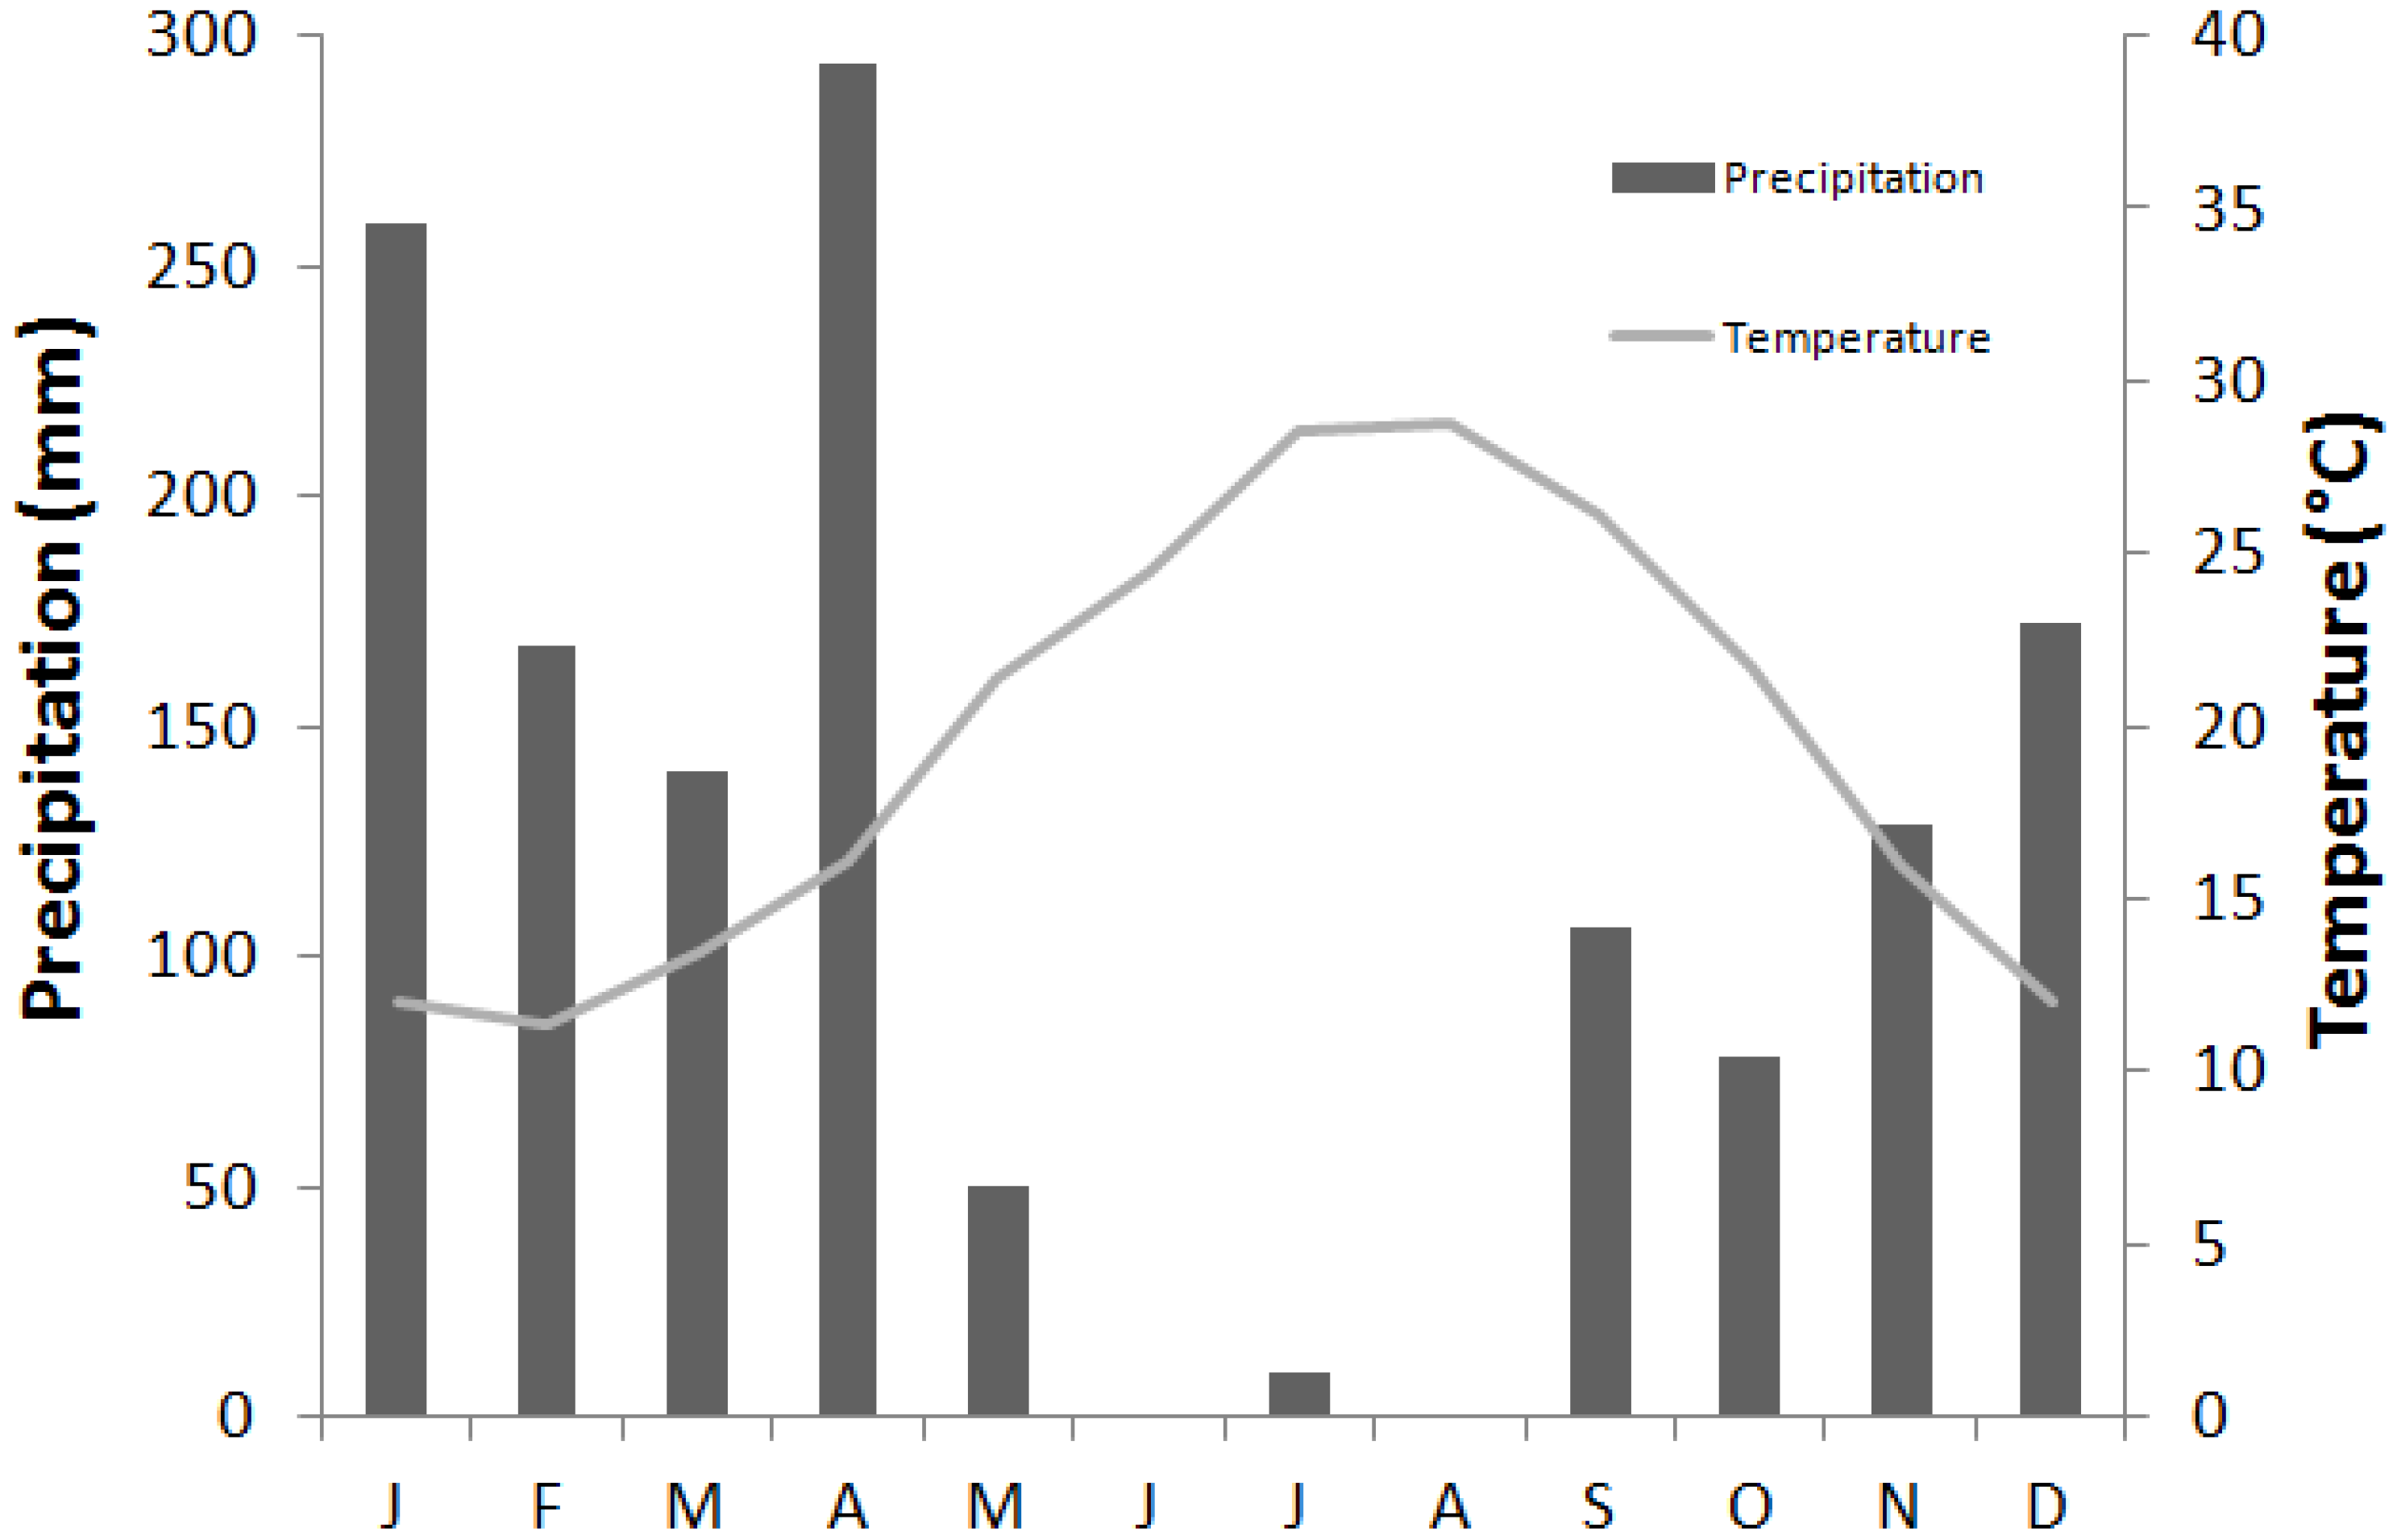
2.1. Study Site


| Site Characteristics | YS | MS |
|---|---|---|
| Latitude | 37°02′41.70″ N | 37°02′12.44″ N |
| Longitude | 09°06′08.04″ E | 09°03′44.25″ E |
| Altitude (m) | 125 | 121 |
| Vegetation type | Quercus suber (even-aged) | Quercus suber (uneven-aged) |
| Shrub stratum | Pistacia lentiscus, Erica arborea, Myrtus communis | Pistacia lentiscus, Erica arborea, Myrtus communis |
| Tree cover | 53% | 69% |
| Field capacity (0–150cm) | 340 mm | 450 mm |
| Soil type | Ferric Luvisol | Ferric Luvisol |
2.2. Soil and Vegetation Ecophysiological Measurements
2.3. Soil Sampling and Analyses
2.4. Data Analyses and Modelling
2.4.1. SOC Stocks Estimation
2.4.2. Soil Respiration Modelling
3. Results
3.1. Site Characteristics and Ecosystem Functioning
| Stand Characteristics | Young Stand (YS) (Mean +/− SE) | Mature Stand (MS) (Mean +/− SE) |
|---|---|---|
| LAI | 1.88 (±0.02) b | 1.68 (±0.03) a |
| LMA gC m−2 | 146.19 (±7.99) a | 121.28 (±16.27) a |
| Height (m) | 11.2 (±0.13) a | 12.8 (±0.38) b |
| DBH (cm) | 24.3 (±4.77) a | 31.1 (±1.71) b |
| Stem number (stems ha−1) | 560 | 512 |
| Aboveground biomass (kg DM m−2) | 16.96 (±1.52) a | 31.24 (±2.19) b |
| Belowground biomass (kg DM m−2) | 7.09 (±0.40) a | 9.88 (±0.49) b |
| Root/Shoot ratio | 0.41 | 0.31 |
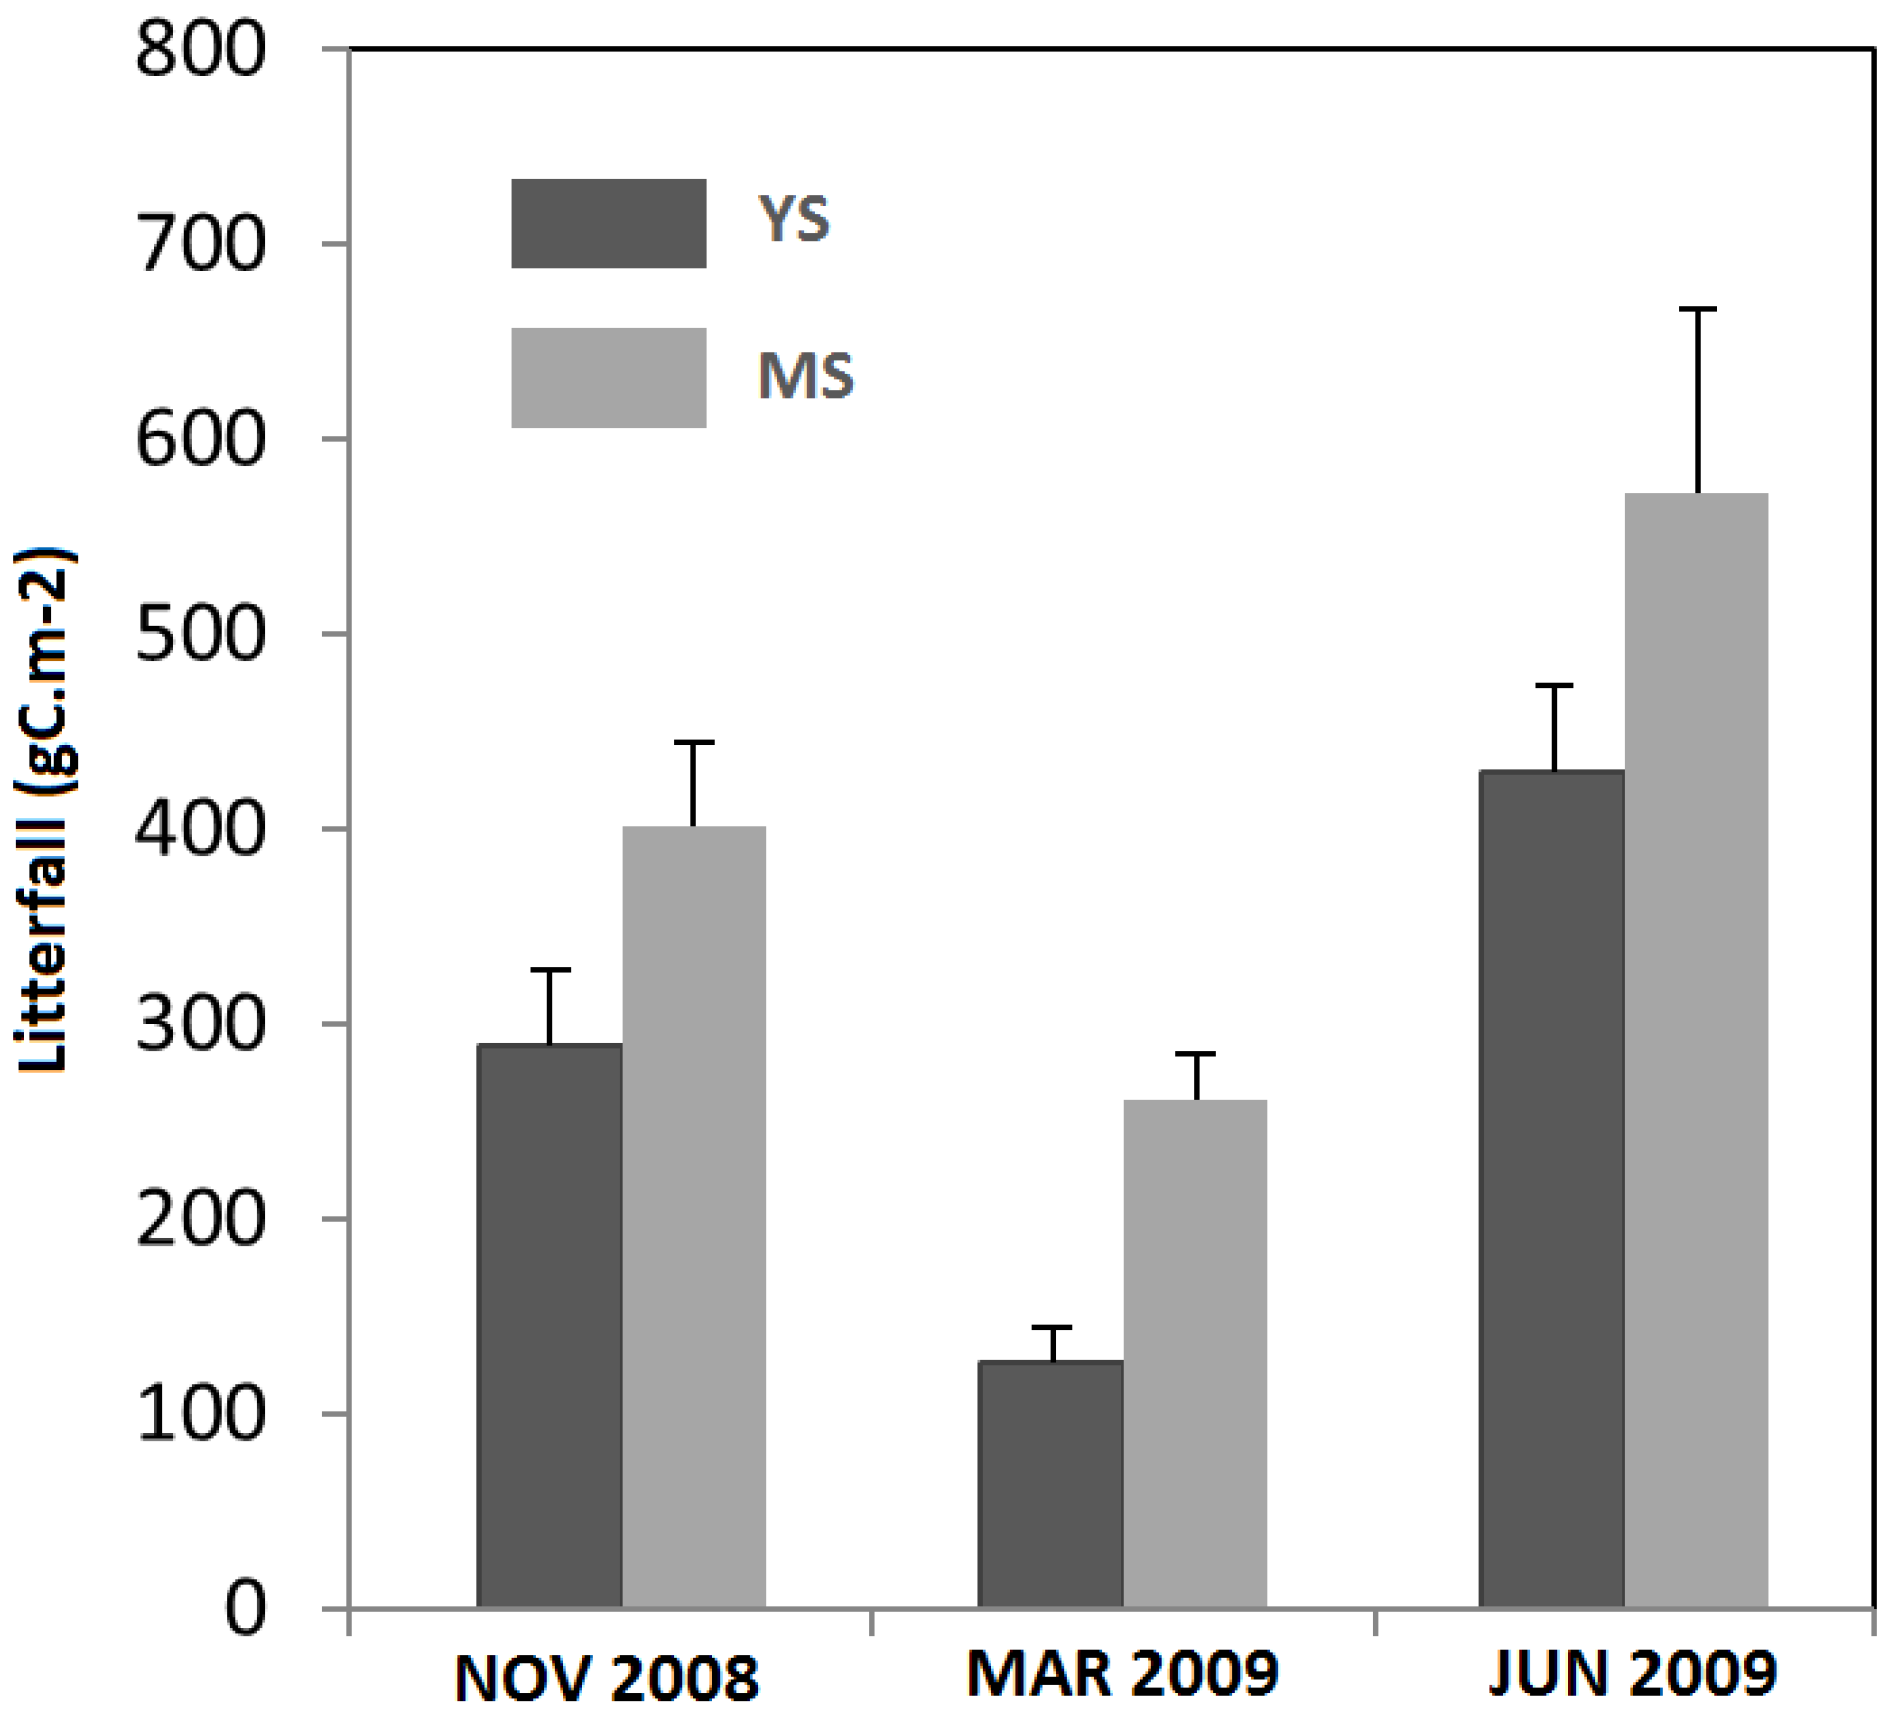
| Annual litterfall (gC m−2) | 386.30 (±30.21) a | 636.42 (±55.59) b |
| Age (years) | 35 | 71–102 |
| Cork removal | 2000–1988 | 2005–1992–1980–1968–1956 |
| Soil C content (%) | 3.26 (0.02) a | 4.15 (0.05) b |
| Soil N content (%) | 0.28 (0.002) a | 0.31 (0.007) b |
| C/N | 11.46 (0.10) a | 13.42 (0.43) b |
| SOC (kgC m−2) | 10.96 (1.64) a | 14.79 (2.31) b |
| Soil bulk density (g cm−3) | 1.23 (0.007) a | 1.30 (0.004) b |
| Clay (%) | 25.36 (0.49) a | 24.11 (0.67) a |
| Silt (%) | 46.54 (0.27) a | 33.22 (0.37) b |
| Sand (%) | 28.10 (0.33) a | 42.66 (0.84) b |
| Soil texture | loam | loam |
| Bed rock | sandstone [39] | sandstone [39] |

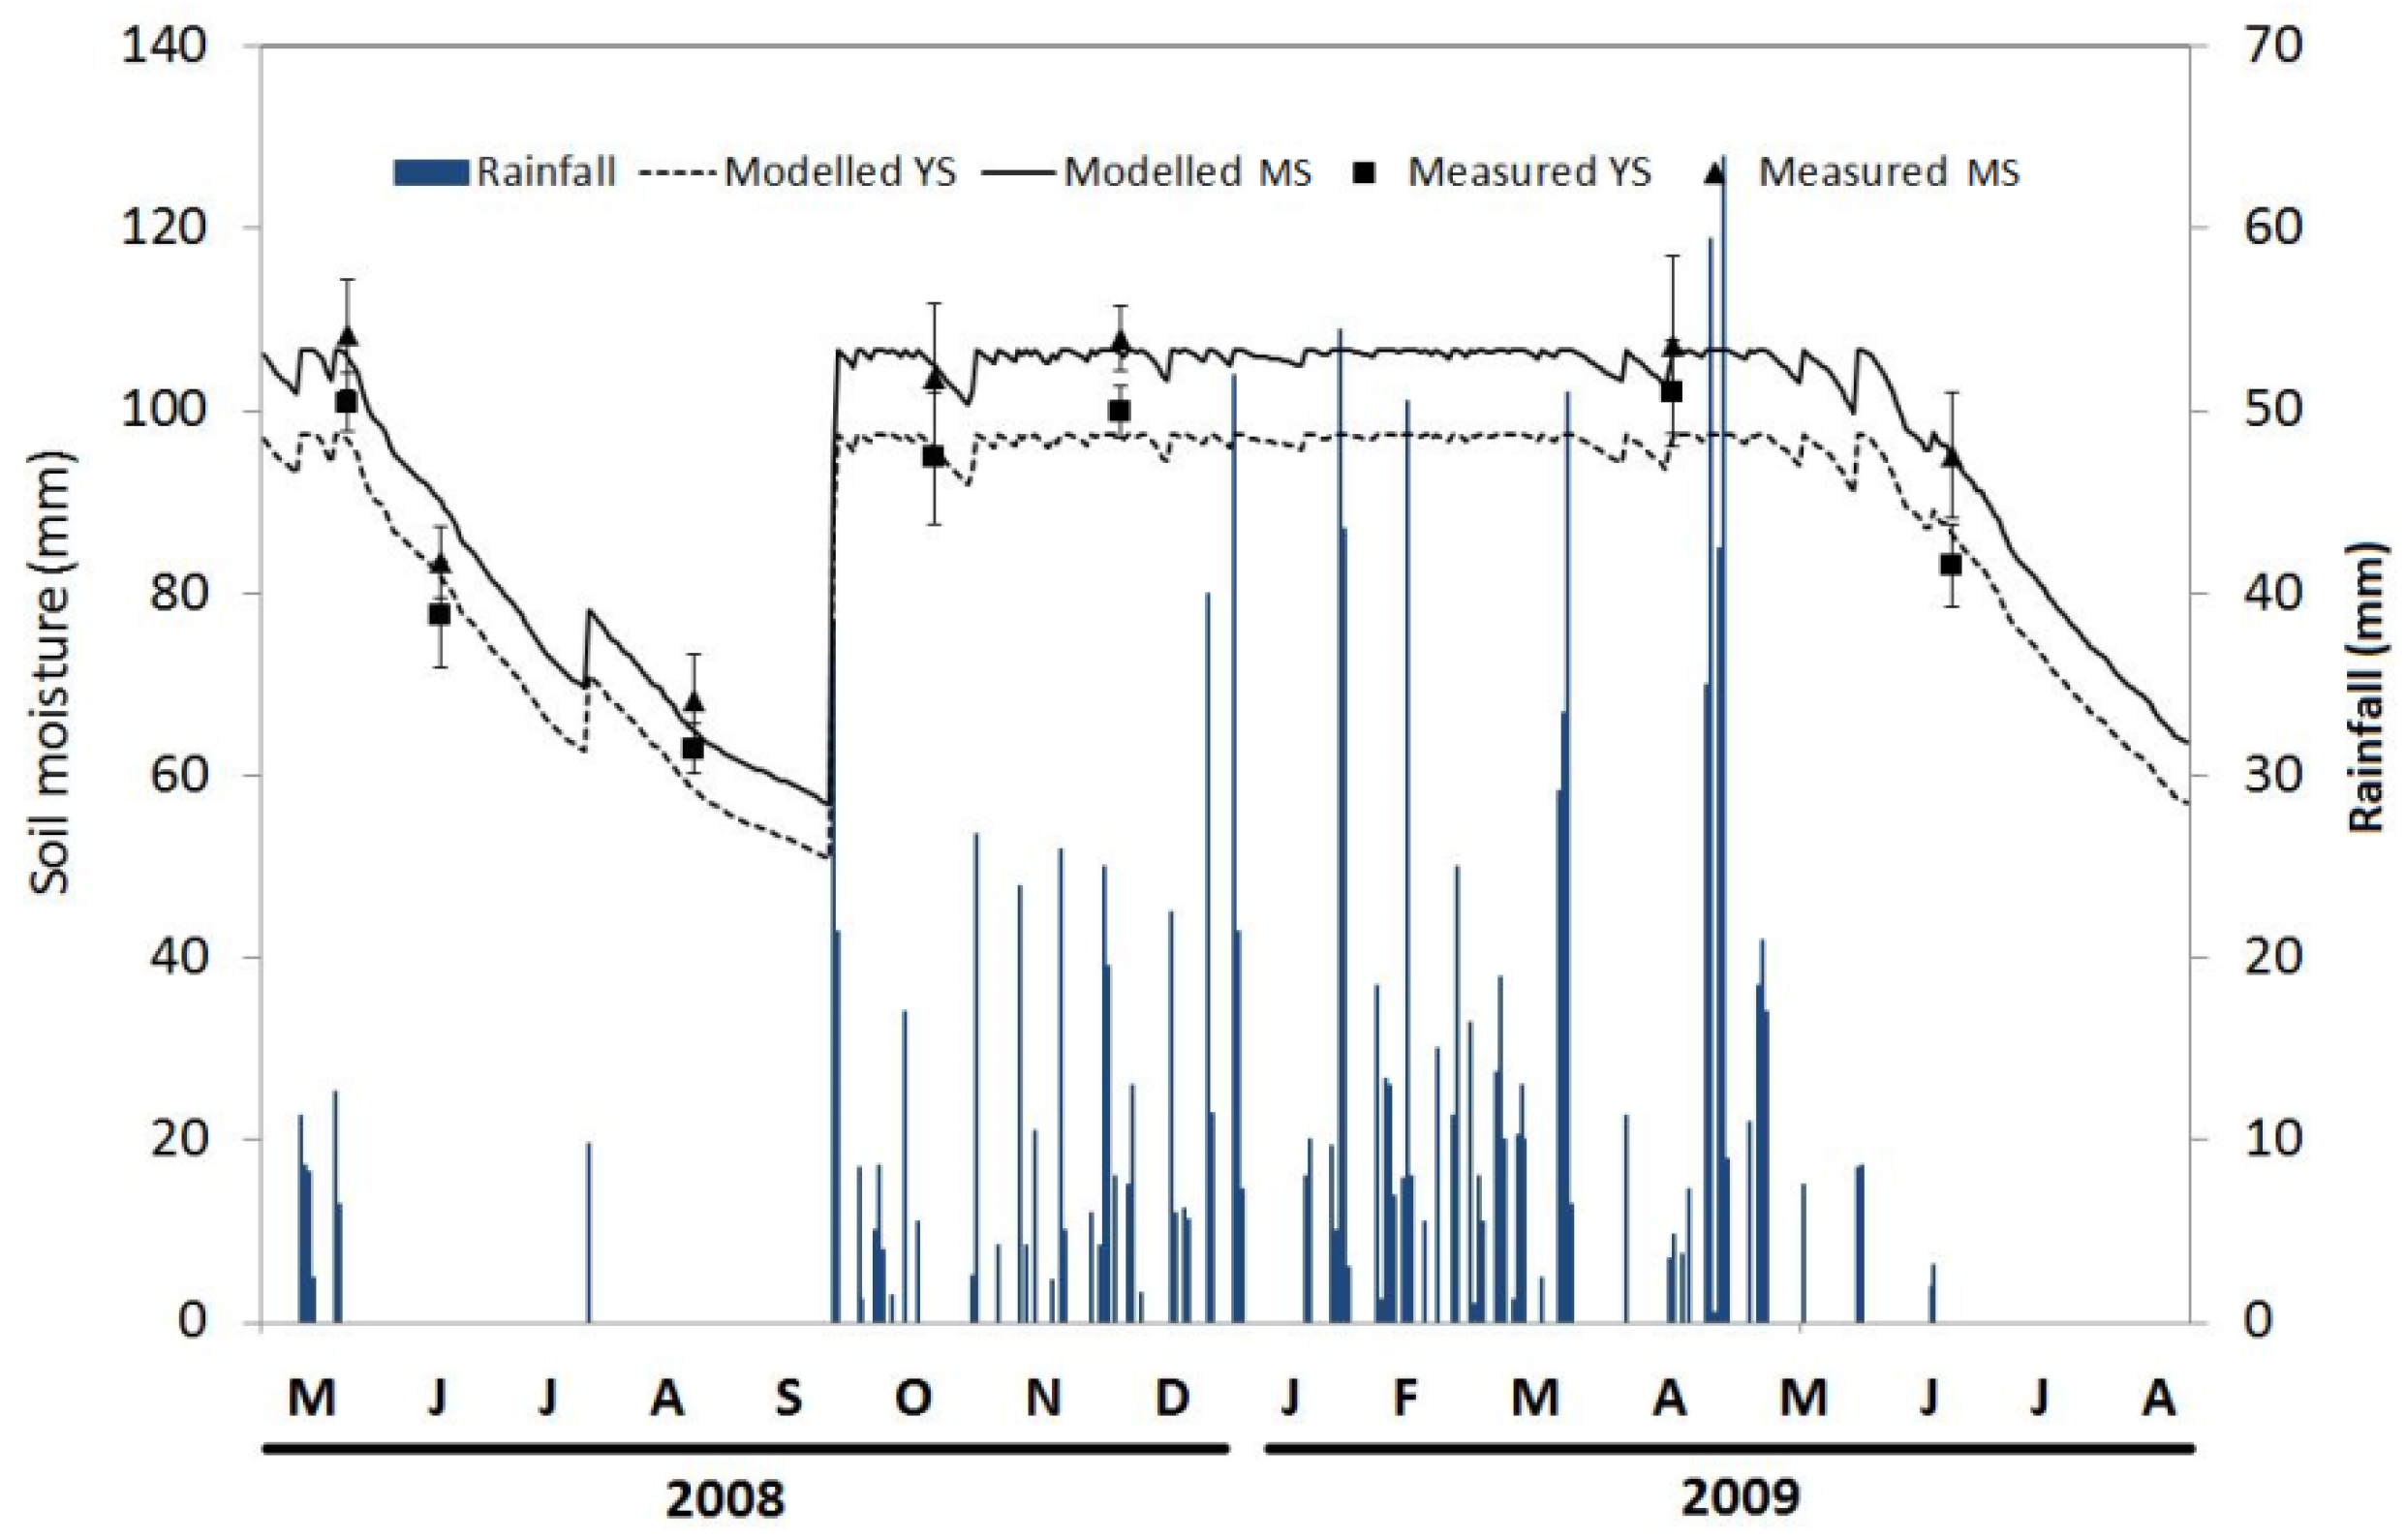
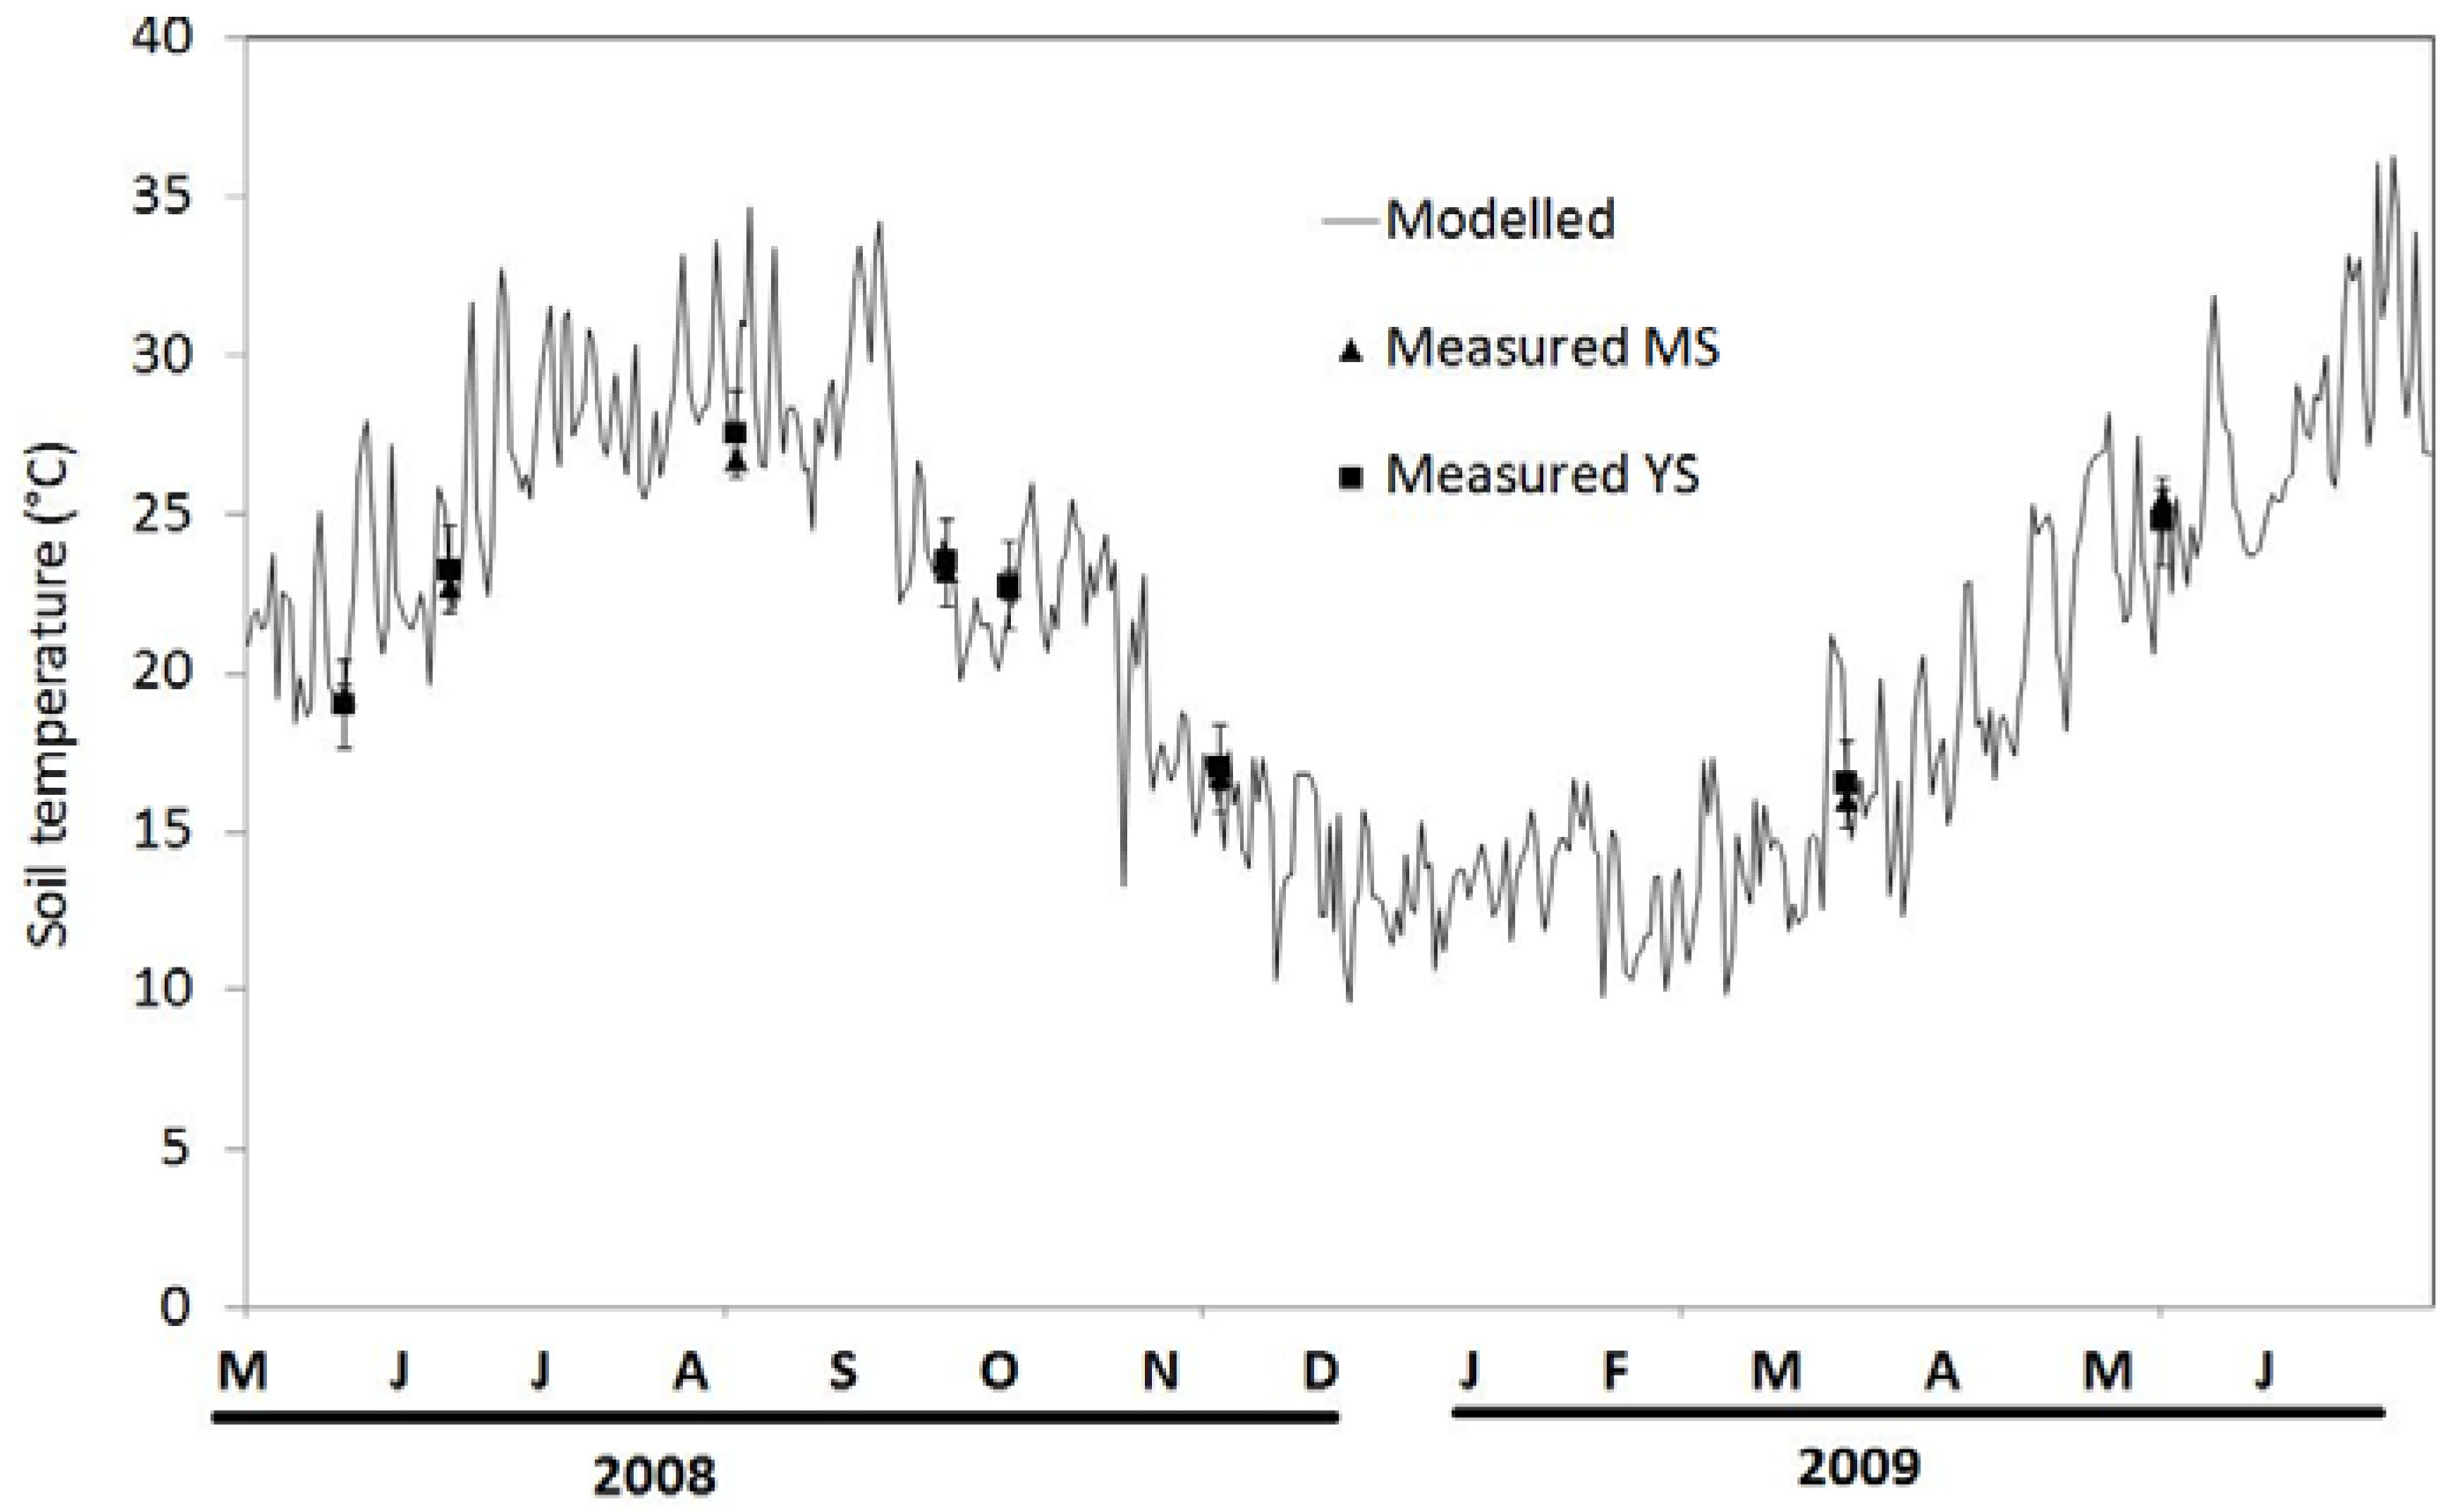
3.2. Seasonal Variation of Soil Temperature and Soil Moisture

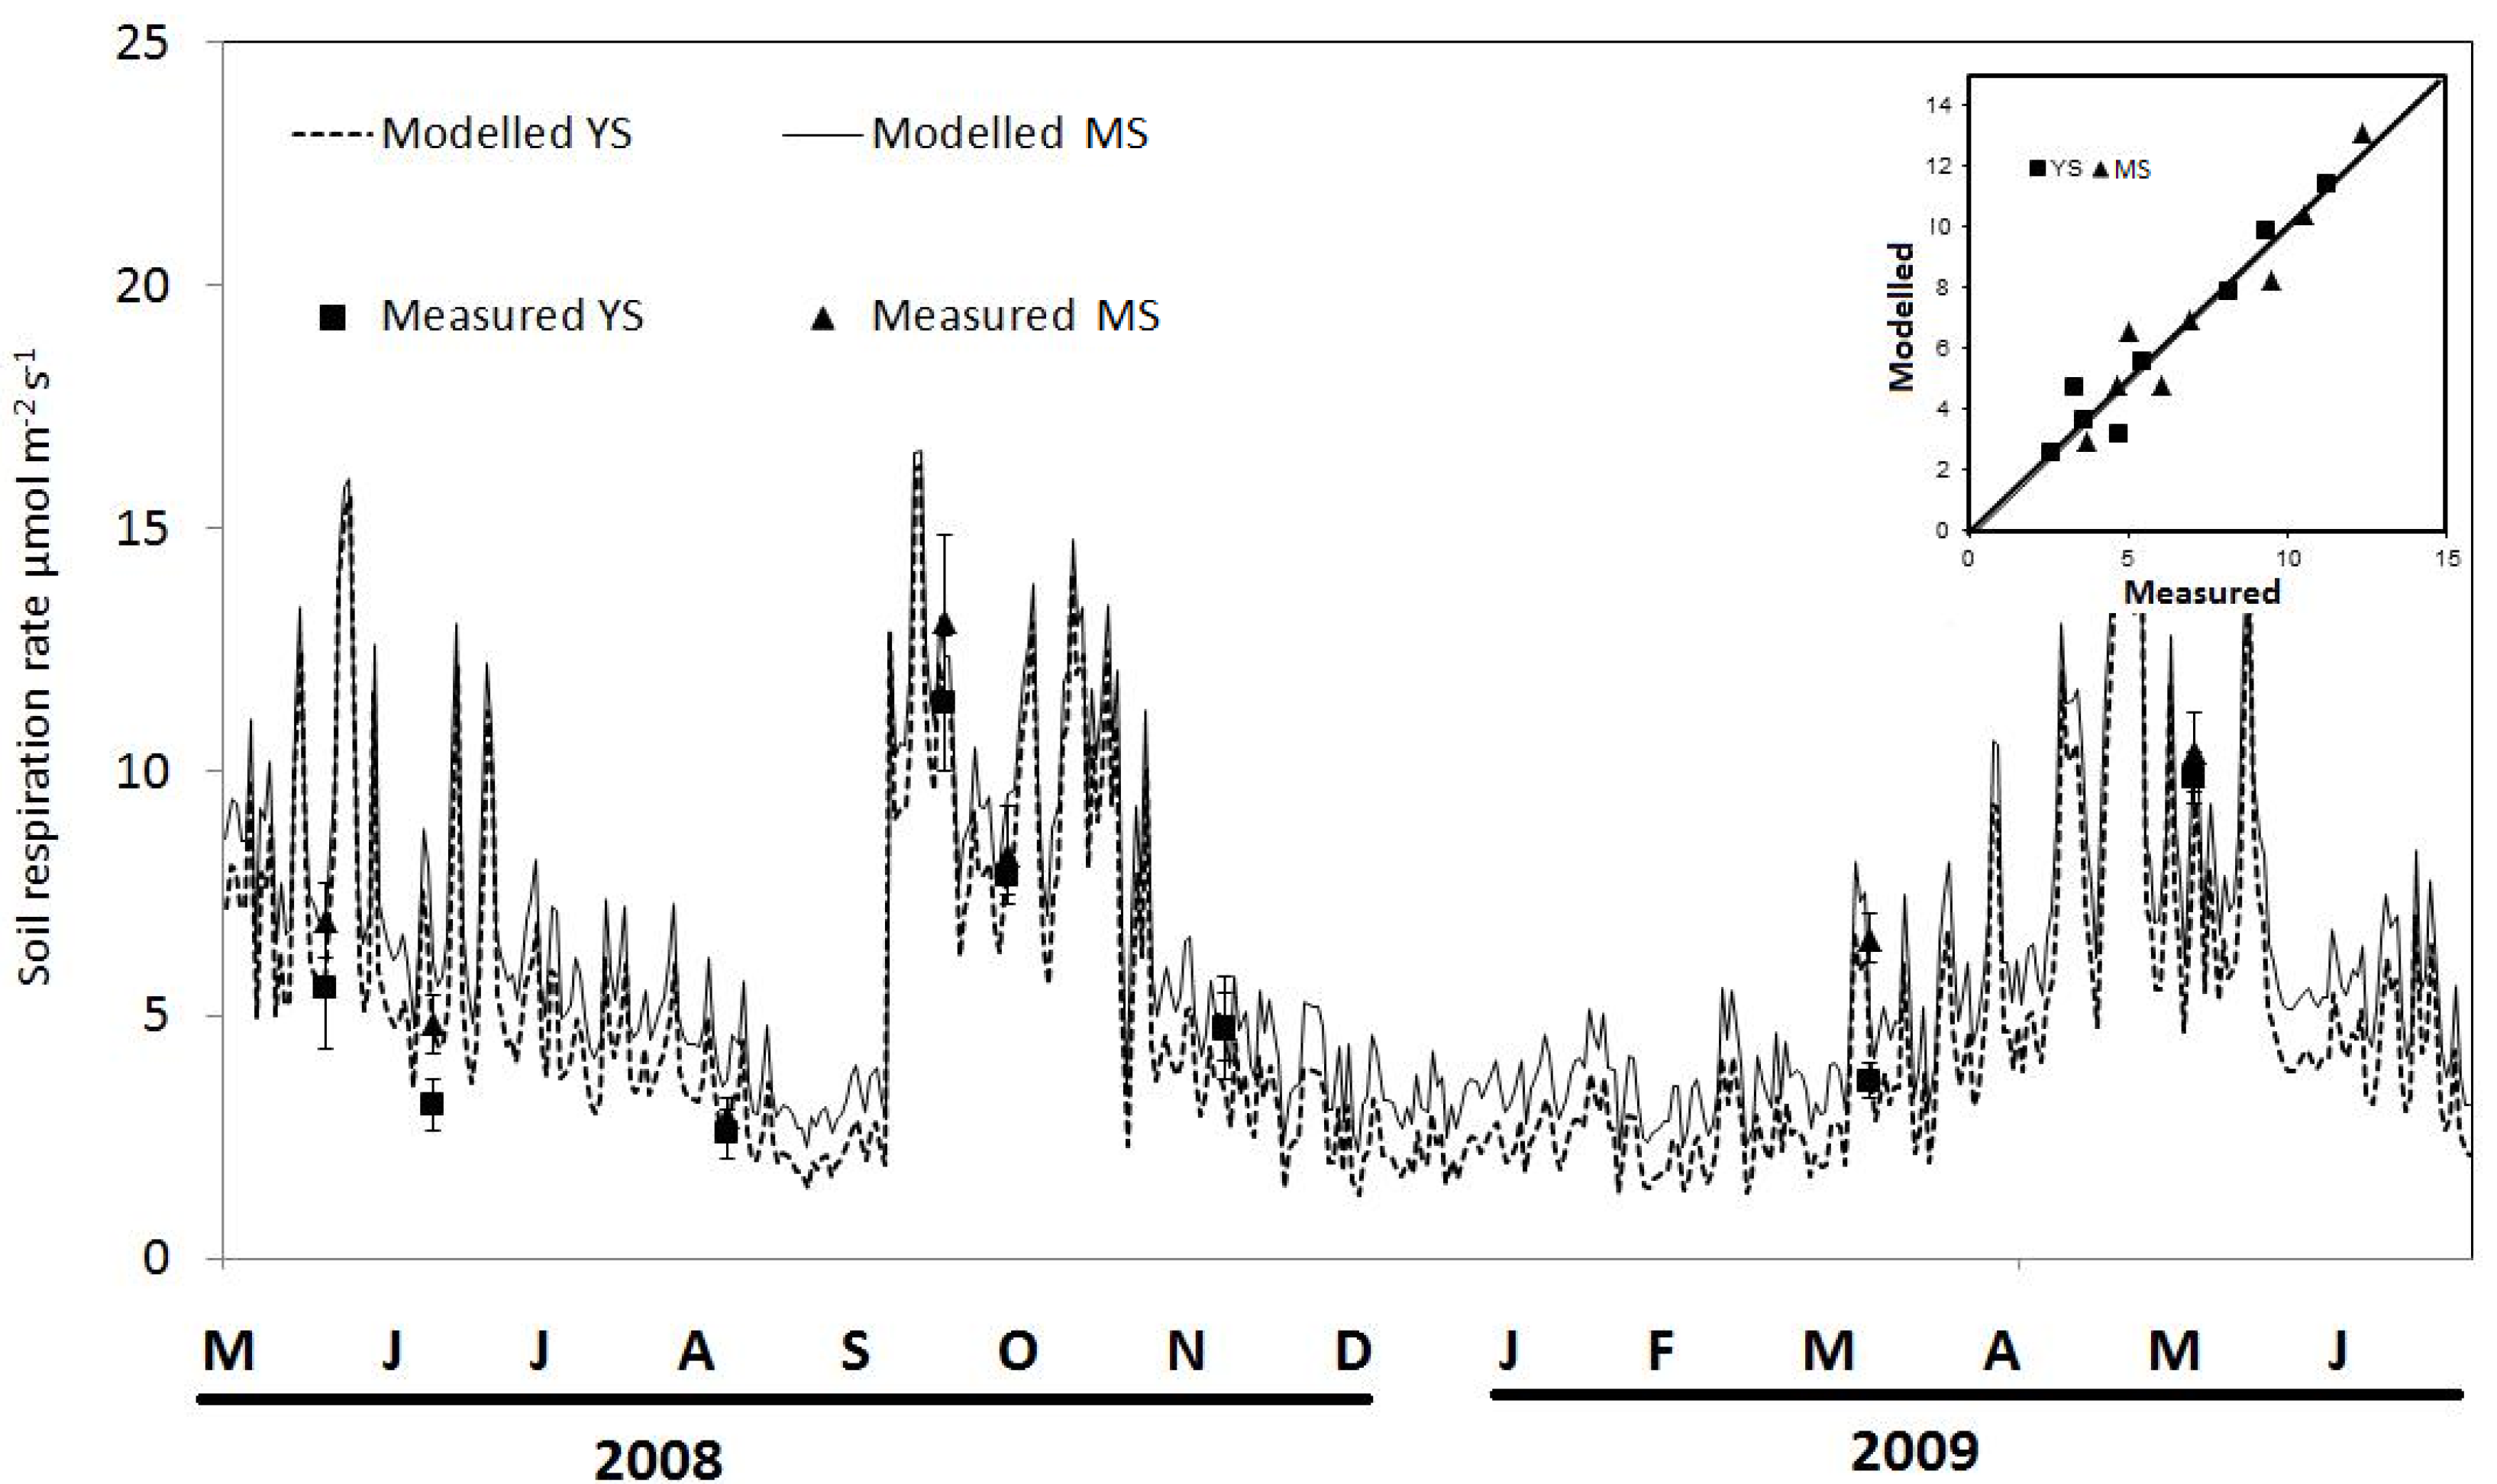
3.3. Carbon Flux from Soil Respiration: Measurements and Modelling

4. Discussion
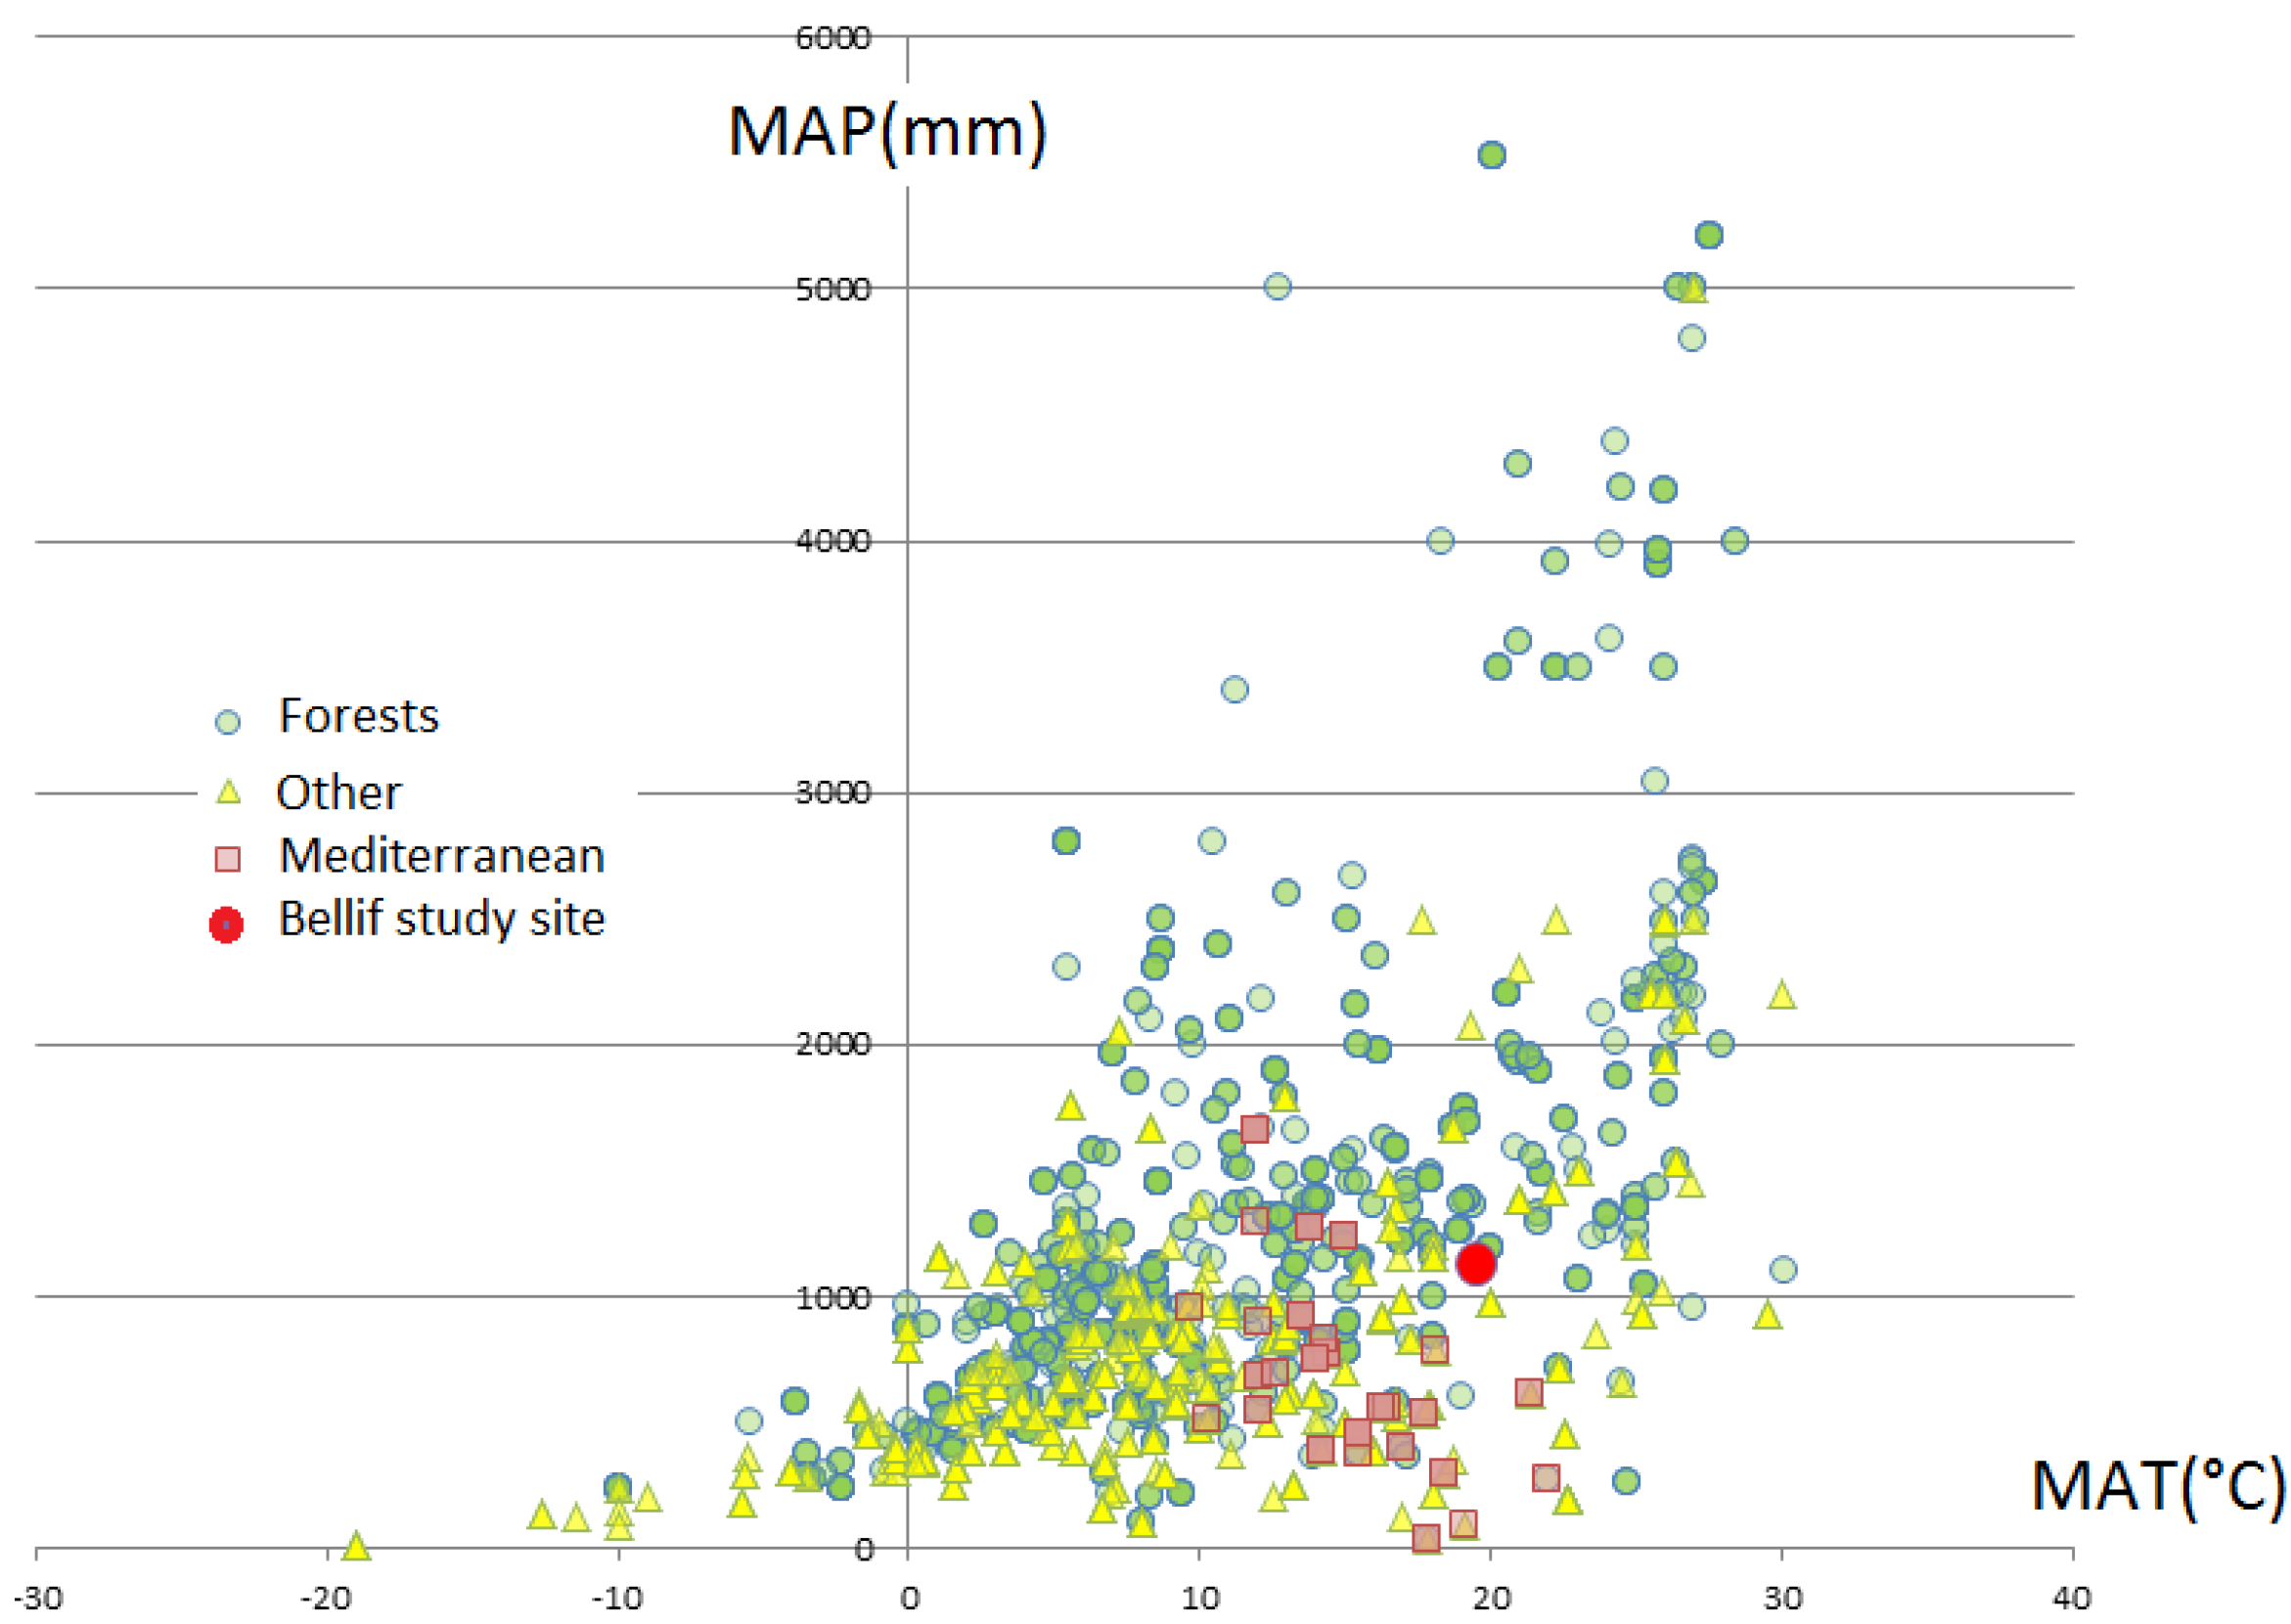
4.1. Bellif Ecosystem Peculiar Fertile Conditions within the Mediterranean Context
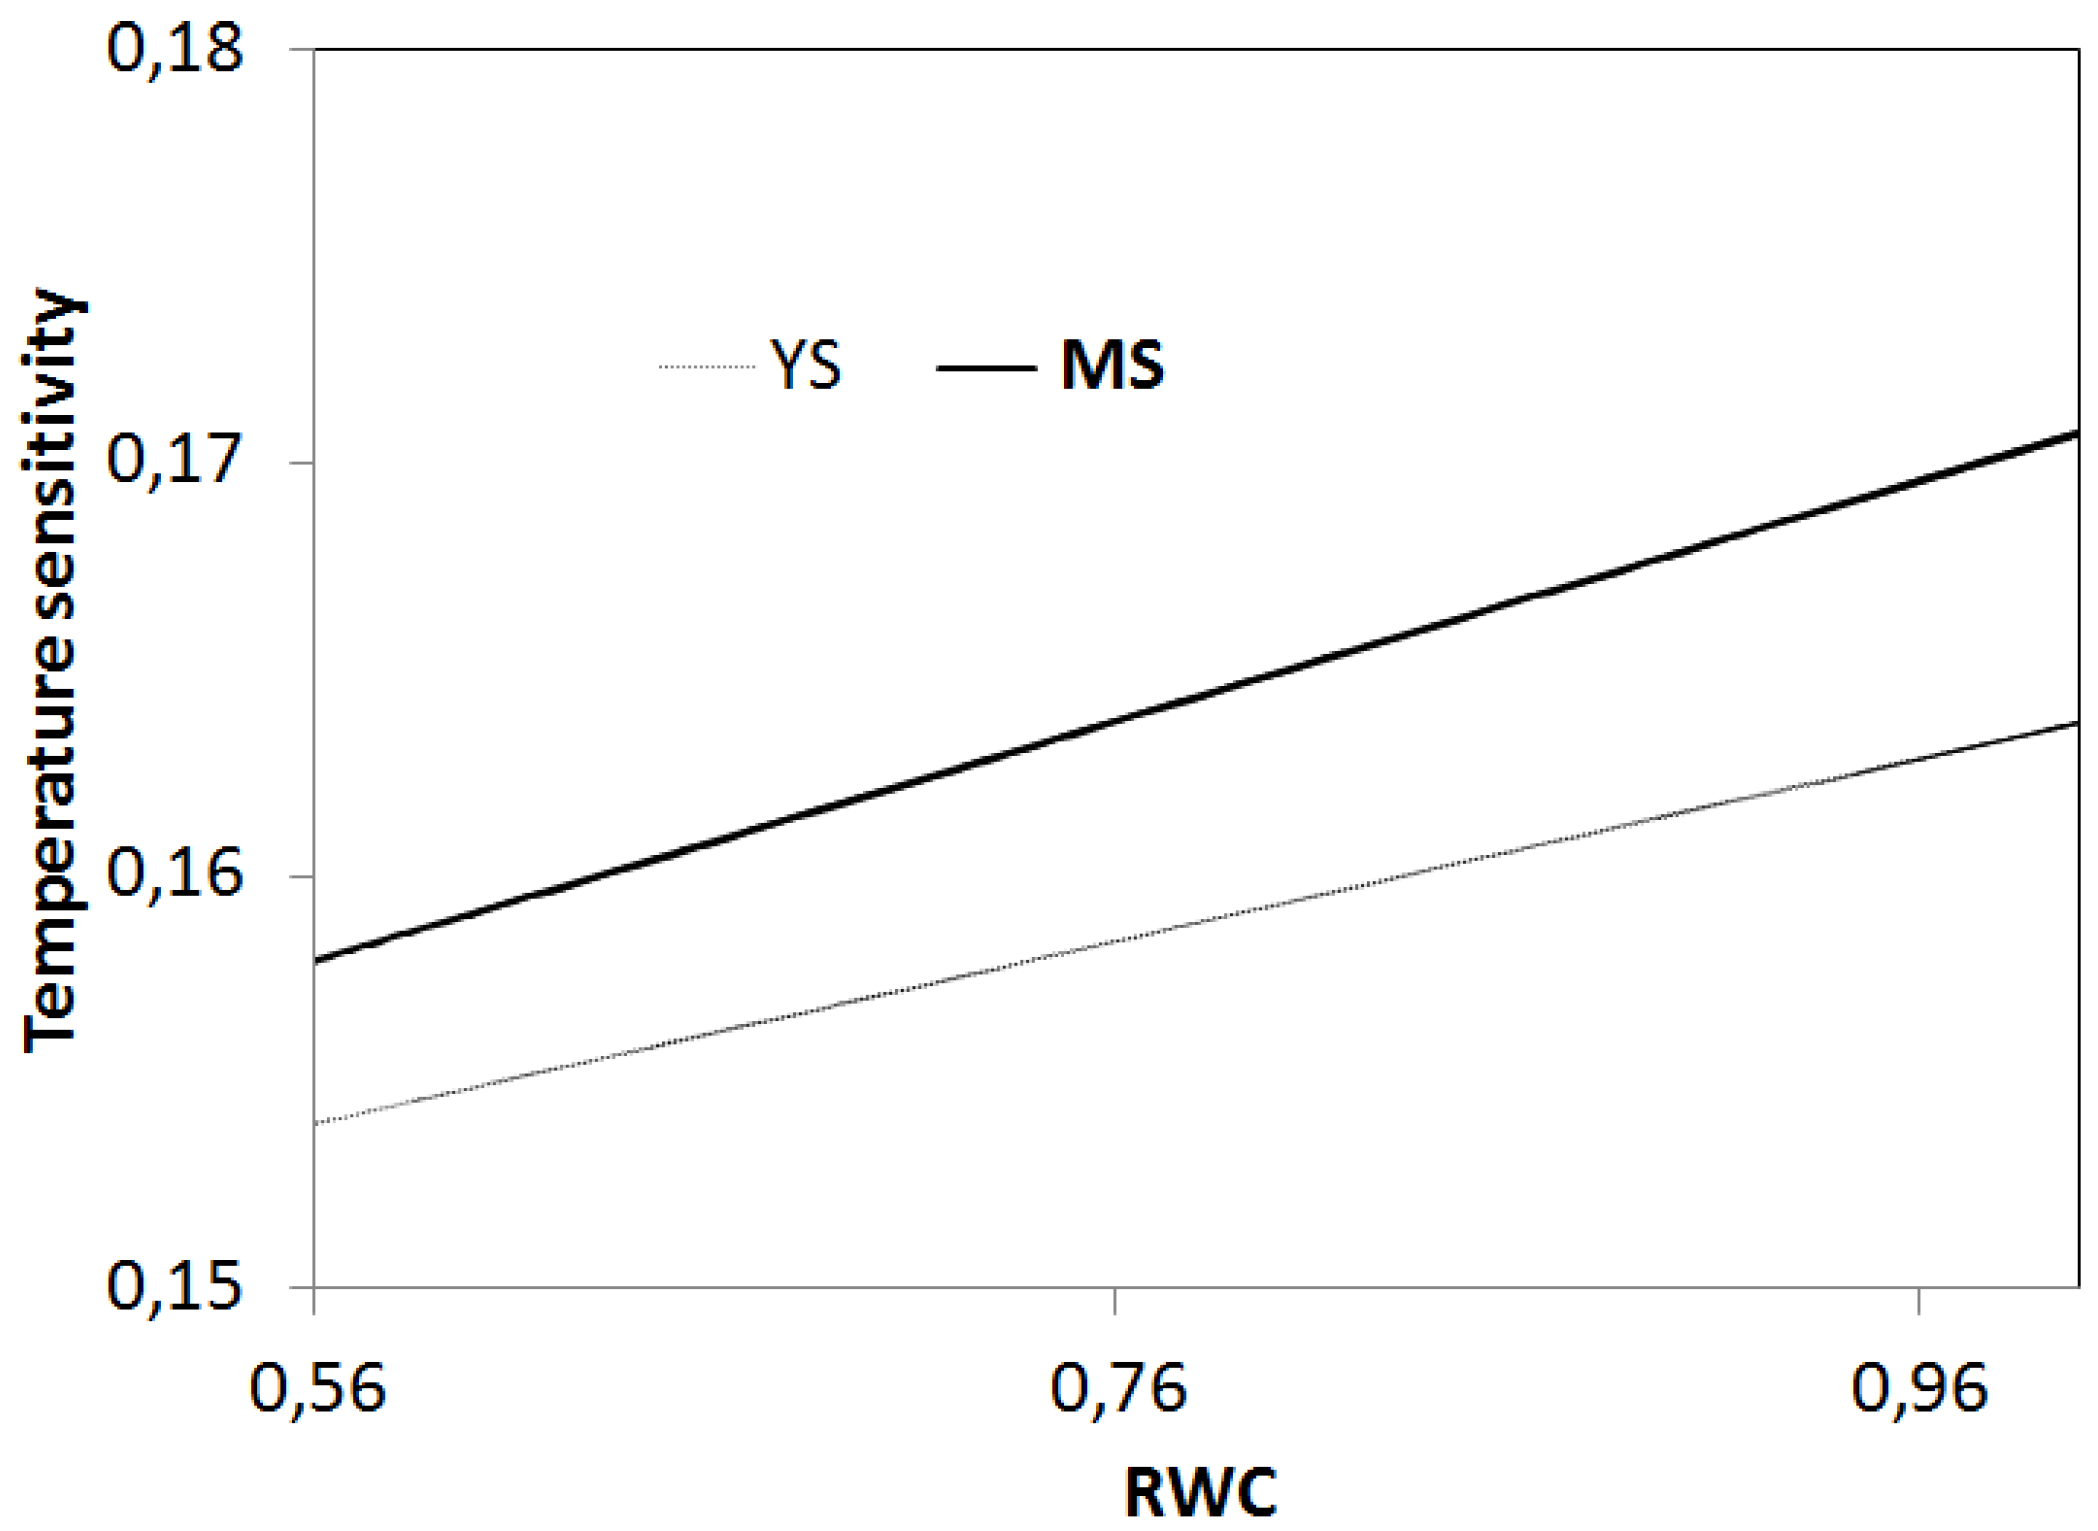
4.2. Relationships between Soil Temperature, Soil Moisture, and Soil Respiration
| Site | Vegetation | MAT (°C) | MAP (mm) | Rs (µmol m−2 s−1) | Annual Litterfall (gC m−2 year−1) | Annual RS (gC m−2 year−1) | Soil Type and Depth (m) | Reference |
|---|---|---|---|---|---|---|---|---|
| Puechabon | Quercus forest (61 years) | 13.5 | 883 | 0.7 min., 5.59 max. | 205 | 762 | rhodo-chromic luvisol (0.90) | [15] |
| California | Oak–grass savanna | 16.3 | 556 | 0.5 | - | 488 | Lithic haploxerepts (0.75) | [28] |
| Cabo de Gata/Spain | Degraded Steppe alpha grass | 18 | 220 | 0.8 | - | 293.86 | Lithic Leptosol/Calcaric (0.10) | [80] |
| Cabo de Gata/spain | Natural Steppe alpha grass | 18 | 220 | 1.1 | - | 405.06 | Mollic LithicLeptosol (Calcaric) (0.20) | [80] |
| Roccarespampani Italy | Coppiced oak chronosequence (1 to 17 years) | 14 | 755 | 1.7 min., 7.8 max. | 36.48 min., 138.24 max. | - | Luvisoil (0.90) | [82] |
| Italy2 | Quercus ilex forest (30 years) | 14.5 | 770 | - | - | 1456 | - | [3,83] |
| Bellif | Quercus suber (71–102 years) | 19.29 | 1113 | 5.89 | 636 | 2227 | Ferric luvisol (1.50) | This issue |
| Bellif | Quercus suber (35 years) | 19.29 | 1113 | 4.69 | 386 | 1774 | Ferric luvisol (1.50) | This issue |
4.3. Suitability of a Generic Drought/Temperature-Driven Soil Respiration Models
5. Conclusions
Acknowledgements
Author Contributions
Conflicts of Interest
References
- Raich, J.W.; Potter, C.S. Global patterns of carbon dioxide emissions from soils. Global. Biogeochem. Cycles. 1995, 9, 23–36. [Google Scholar] [CrossRef]
- Lavigne, M.B.; Ryan, M.G.; Anderson, D.E.; Baldocchi, D.D.; Crill, P.M.; Fitzjarrald, D.R.; Goulden, M.L.; Gower, S.T.; Massheder, J.M.; McCaughey, J.H.; et al. Comparing nocturnal eddy covariance measurements to estimates of ecosystem respiration made by scaling chamber measurements at six coniferous boreal sites. J. Geophys. Res. 1997, 102, 28977–28985. [Google Scholar] [CrossRef]
- Janssens, I.A.; Lankreijer, H.; Matteucci, G.; Kowalski, A.S.; Buchmann, N.; Epron, D.; Pilegaard, K.; Kutsch, W.; Longdoz, B.; Grunwald, T.; et al. Productivity overshadows temperature in determining soil and ecosystem respiration across European forests. Glob. Chang. Biol. 2001, 7, 269–278. [Google Scholar] [CrossRef]
- Raich, J.W.; Potter, C.S.; Bhagawati, D. Interannual variability in global soil respiration 1980–1994. Glob. Chang. Biol. 2002, 8, 800–812. [Google Scholar] [CrossRef]
- Wu, J.; Liu, Z.; Huang, G.; Chen, D.; Zhang, W.; Shao, Y.; Wan, S.; Fu, S. Response of soil respiration and ecosystem carbon budget to vegetation removal in Eucalyptus plantations with contrasting ages. Sci. Rep. 2014, 4, 6262. [Google Scholar] [CrossRef] [PubMed]
- IPCC. Summary for Policymakers: Working Group I: “Climate Change 2001: The Scientific Basis”; Intergovernmental Panel on Climate Change: Geneva, Switzerland, 2001. [Google Scholar]
- Gibelin, A.L.; Deque, M. Anthropogenic climate change over the Mediterranean region simulated by a global variable resolution model. Clim. Dyn. 2003, 20, 327–339. [Google Scholar]
- Kueppers, L.M.; Snyder, M.A.; Sloan, L.C.; Zavaleta, E.S.; Fulfrost, B. Modeled regional climate Change and California endemic oak ranges. Proc. Nat. Acad. Sci. U.S.A. 2005, 102, 16281–16286. [Google Scholar] [CrossRef] [PubMed]
- Sardans, J.; Peñuelas, J. Plant-soil interactions in Mediterranean forest and shrublands: Impacts of climatic change. Plant Soil 2013, 365, 1–33. [Google Scholar] [CrossRef]
- Cox, P.M.; Betts, R.A.; Jones, C.D.; Spall, S.A.; Totterdell, I.J. Acceleration of global warming due to carbon-cycle feedbacks in a coupled climate model. Nature 2000, 408, 184–187. [Google Scholar] [CrossRef] [PubMed]
- Trumbore, S.E.; Chadwick, O.A.; Amundson, R. Rapid exchange between soil carbon and atmospheric carbon dioxide driven by temperature change. Science 1996, 272, 393–396. [Google Scholar] [CrossRef]
- Kirschbaum, M.U.F. Will changes in soil organic carbon act as a positive or negative feedback on global warming? Biogeochemistry 2000, 48, 21–51. [Google Scholar] [CrossRef]
- Lal, R. Soil carbon sequestration to mitigate climate change. Geoderma 2004, 123, 1–22. [Google Scholar] [CrossRef]
- Goh, K.M. Carbon sequestration and stabilization in soils: Implications for soil productivity and climate change. Soil. Sci. Plant Nutr. 2004, 50, 467–476. [Google Scholar] [CrossRef]
- Raich, J.W.; Schlesinger, W.H. The global carbon dioxide flux in soil respiration and its relationship to vegetation and climate. Tellus B 1992, 44, 81–89. [Google Scholar] [CrossRef]
- Kirschbaum, M.U.F. The temperature dependence of soil organic matter decomposition and the effect of global warming on soil organic C storage. Soil Biol. Biochem. 1995, 27, 753–760. [Google Scholar] [CrossRef]
- Davidson, E.A.; Belk, E.; Boone, R.D. Soil water content and temperature as independent or confounded factors controlling soil respiration in a temperate mixed hardwood forest. Glob. Chang. Biol. 1998, 4, 217–227. [Google Scholar] [CrossRef]
- Risk, D.; Kellman, L.; Beltrami, H. Carbon dioxide in soil profiles: Production and temperature dependence. Geophys. Res. Lett. 2002, 29. [Google Scholar] [CrossRef]
- Reichstein, M.; Rey, A.; Freibauer, A.; Tenhunen, J.; Valentini, R.; Banza, J.; Casals, P.; Cheng, Y.; Grunzweig, J.M.; Irvine, J.; et al. Modeling temporal and large-scale spatial variability of soil respiration from soil water availability, temperature and vegetation productivity indices. Glob. Biogeochem. Cycles 2003, 17, 1104. [Google Scholar] [CrossRef]
- Raich, J.W.; Tufekcioglu, A. Vegetation and soil respiration: Correlations and controls. Biogeochemistry 2000, 48, 71–90. [Google Scholar] [CrossRef]
- Ryan, M.G.; Law, B.E. Interpreting, measuring, and modelling soil respiration. Biogeochemistry 2005, 73, 3–27. [Google Scholar] [CrossRef]
- Haynes, B.E.; Gower, S.T. Belowground carbon allocation in unfertilized and fertilized red pine plantations in northern Wisconsin. Tree Physiol. 1995, 15, 317–325. [Google Scholar] [CrossRef] [PubMed]
- Maier, C.A.; Kress, L.W. Soil CO2 evolution and root respiration in 11 year old loblolly pine (Pinus taeda) plantations as affected by moisture and nutrient availability. Can. J. For. Res. 2000, 30, 347–359. [Google Scholar] [CrossRef]
- Mosier, A.R. Soil processes and global change. Biol. Fert. Soils 1998, 27, 221–229. [Google Scholar] [CrossRef]
- Rustad, L.E.; Huntington, T.G.; Boone, R.D. Controls on soil respiration: Implications for climate change. Biogeochemistry 2000, 48, 1–6. [Google Scholar] [CrossRef]
- Raich, J.W.; Nadelhoffer, K.J. Belowground carbon allocation in forest ecosystems: Global trends. Ecology 1989, 70, 1346–1354. [Google Scholar] [CrossRef]
- Chen, G.; Yang, Y.; Guo, J.; Xie, J.; Yang, Z. Relationships between carbon allocation and partitioning of soil respiration across world mature forests. Plant Ecol. 2011, 212, 195–206. [Google Scholar] [CrossRef]
- Chen, G.; Yang, Y.; Robinson, D. Allometric constraints on, and trade-offs in, belowground carbon allocation and their control of soil respiration across global forest ecosystems. Glob. Chang. Biol. 2014, 20, 1674–1684. [Google Scholar] [CrossRef] [PubMed]
- Rambal, S.; Lempereur, M.; Limousin, J.M.; Martin St Paul, N.K.; Ourcival, J.M.; Rodriguez-Calcerrada, J. How drought severity constrains gross primary production (GPP) and its partitioning among carbon pools in a Quercus ilex coppice? Biogeosciences 2014, 11, 6855–6869. [Google Scholar] [CrossRef]
- Lempereur, M.; Martin St Paul, N.; Damesin, C.; Joffre, R.; Ourcival, J.M.; Rocheteau, A.; Rambal, S. Growth duration is a better predictor of stem increment than carbon supply in a Mediterranean oak forest: Implication for assessing forest productivity under climate change. New Phytol. 2015. [Google Scholar] [CrossRef] [PubMed]
- Limousin, J.M.; Rambal, S.; Ourcival, J.M.; Rocheteau, A.; Joffre, R.; Rodriguez-Cortina, R. Long term transpiration change with rainfall decline in a Mediterranean Quercus ilex forest. Glob. Chang. Biol. 2009, 15, 2163–2175. [Google Scholar] [CrossRef]
- Valladares, F.; Sánchez-Gómez, D. Ecophysiological traits associated with drought in Mediterranean tree seedlings: individual responses versus interspecific trends in eleven species. Plant Boil. 2006, 8, 688–697. [Google Scholar] [CrossRef] [PubMed]
- Pinol, J.; Alcaniz, J.M.; Roda, F. Carbon dioxide efflux and PCO2 in soils of three Quercus ilex montane forests. Biogeochemistry 1995, 30, 191–215. [Google Scholar] [CrossRef]
- Asensio, D.; Penuelas, J.; Ogaya, R.; Llusia, J. Seasonal soil and leaf CO2 exchange rates in a Mediterranean holm oak forest and their responses to drought conditions. Atmos. Environ. 2007, 41, 2447–2455. [Google Scholar] [CrossRef]
- Correia, A.C.; Minunno, F.; Caldeira, M.C.; Banza, J.; Mateus, J.; Carneiro, M.; Wingate, L.; Shvaleva, A.; Ramos, A.; Jongen, M.; et al. Soil water availability strongly modulates soil CO2 efflux in different Mediterranean ecosystems: Model calibration using Bayesian approach. Agr. Ecosyst. Envir. 2012, 161, 88–100. [Google Scholar] [CrossRef]
- Emran, M.; Gispert, M.; Pardini, G. Comparing measurements methods of carbon dioxide fluxes in a soil sequence under land use and cover change in North Eastern Spain. Geoderma 2012, 170, 176–185. [Google Scholar] [CrossRef]
- Varik, M.; Kukumägi, M.; Aossar, J.; Becker, H.; Ostonen, I.; Löhmus, K.; Veiko, U. Carbon budgets in fertile silver birch (Betula pendula Roth) chronosequence stands. Ecol. Eng. 2015, 77, 284–296. [Google Scholar] [CrossRef]
- Paulo, J.A.; Palma, J.H.N.; Gomes, A.A.; Faias, S.P.; Tomé, J.; Tomé, M. Predicting site index from climate and soil variables for cork oak (Quercus suber L.) stands in Portugal. New For. 2015, 46, 293–307. [Google Scholar] [CrossRef]
- Nouri, M. Facteurs pédoclimatiques et évolution de la subéraie tunisienne: Propriétés physicochimiques et hydrodynamiques des sols dans les forêts de chêne liège (Quercus suber L.). Ph.D. Thesis, Institut National Agronomique de Tunisie, Tunis, Tunisia, 2010. [Google Scholar]
- Belkhodja, K.; Bortoli, L.; Cointepas, J.P.; Dimanche, P.; Fournet, A.; Jacquinet, J.C.; Mori, A. Les sols de la Tunisie Septentrionale; Ministère de l’Agriculture, Direction Générale des Ressources en Eau et en Sol: Tunis, Tunisia, 1971; p. 246. [Google Scholar]
- Posner, S.D. Biological Diversity and Tropical Forests in Tunisia; Agency of the International Development: Washington, DC, USA, 1988; p. 241. [Google Scholar]
- Chakroun, H.; Mouillot, F.; Nasr, Z.; Nouri, M.; Ennajah, A.; Ourcival, J.M. Performance of LAI MODIS and the influence on drought simulation in a Mediterranean forest. Ecohydrology 2014, 7, 1014–1028. [Google Scholar] [CrossRef]
- Beira, J.; Prades, C.; Santiago, R. New tools to extract cork from Quercus suber L.: Increasing productivity and reducing damages. For. Syst. 2014, 23, 22–35. [Google Scholar]
- Bugalho, M.N.; Caldeira, M.C.; Pereira, J.S.; Aronson, J.; Pausas, J.G. Mediterranean cork oak savannas require human use to sustain biodiversity and ecosystem services. Front. Ecol. Environ. 2011, 9, 278–286. [Google Scholar] [CrossRef]
- DGF (Direction Générale des Forêts). Deuxième Inventaire Forestier et Pastoral National. Résultats sur l’Echelon de Jendouba; Ministère de l’Agriculture: Tunis, Tunisia, 2005; p. 129. [Google Scholar]
- Hasnaoui, B. Régénération naturelle par rejets de souche et par drageonnement d’une suberaie dans le Nord-Ouest de la Tunisie. Ecol. Mediterr. 1991, 17, 79–87. [Google Scholar]
- Walker, W.R.; Skogerboe, G.V. Surface Irrigation. Theory and Practice; Prentice-536 Hall, Inc.: Englewood Cliffs, NJ, USA, 1987. [Google Scholar]
- Burt, R. Soil Survey Laboratory Methods Manual; Soil Survey Investigations Report No. 42 Version 4.0; United States Department of Agriculture; Natural Resources Conservation Service: Washington, DC, USA, 2004.
- Anne, P. Carbone organique (total) du sol et de l’humus. Ann. Agron. 1945, 15, 161–172. [Google Scholar]
- Bremner, J.M.; Mulvaney, C.S. Total nitrogen. In Methods of Soil Analysis. Part 2–Chemical and Microbial Properties, 2nd ed.; Page, A.L., Miller, R.H., Keeny, D.R., Eds.; American Society of Agronomy Inc.; Soil Science Society of America Inc.: Madison, WI, USA, 1982; pp. 1119–1123. [Google Scholar]
- Batjes, N.H. Total carbon and nitrogen in the soils of the world. Eur. J. Soil Sci. 1996, 47, 151–163. [Google Scholar] [CrossRef]
- Brahim, N.; Bernoux, M.; Blavet, D.; Gallali, T. Tunisian soil organic carbon stocks. Int. J. Soil Sci. 2010, 5, 34–40. [Google Scholar] [CrossRef]
- Martin, M.P.; Wattenbach, M.; Smith, P.; Meersmans, J.; Jolivet, C.; Boulonne, L.; Arrouays, D. Spatial distribution of soil organic carbon stocks in France. Biogeosciences 2011, 8, 1053–1065. [Google Scholar] [CrossRef]
- Joffre, R.; Ourcival, J.M.; Rambal, S.; Rocheteau, A. The key role of topsoil moisture on CO2 efflux from a Mediterranean Quercus ilex forest. Ann. For. Sci. 2003, 60, 519–526. [Google Scholar] [CrossRef]
- Mouillot, F.; Rambal, S.; Lavorel, S. A generic process based simulator for Mediterranean landscapes SIERRA: Design and validation exercise. For. Ecol. Manag. 2001, 147, 75–97. [Google Scholar] [CrossRef]
- Bond-Lamberty, B.; Thomson, A. A global database of soil respiration data. Biogeosciences 2010, 7, 1915–1926. [Google Scholar] [CrossRef]
- Hoff, C.; Rambal, S.; Joffre, R. Simulating carbon and water flows and growth in a Mediterranean evergreen Quercus ilex coppice using the FOREST-BGC model. For. Ecol. Manag. 2002, 164, 121–136. [Google Scholar] [CrossRef]
- Ruiz-Peinado, R.; Montero, G.; del Rio, M. Biomass models to estimate carbon stocks for hardwood tree species. For. Syst. 2012, 21, 42–52. [Google Scholar] [CrossRef]
- Mediavilla, S.; Herranz, M.; Gonzalez-Zurdo, P.; Escudero, A. Ontogenic transition in leaf traits: A new cost associated with the increase in leaf longevity. J. Plant Ecol. 2014, 7, 567–575. [Google Scholar] [CrossRef]
- Mediavilla, S.; Garcia-Ciudad, A.; GaricaCriado, B.; Escudero, A. Testing the correlations between leaf life span and leaf structural reinforcement in 13 species of European Mediterranean woody plants. Funct. Ecol. 2008, 22, 787–793. [Google Scholar] [CrossRef]
- Limousin, J.M.; Misson, L.; Lavoir, A.V.; Martin, N.K.; Rambal, S. Do photosynthetic limitations of evergreen Quercus ilex leaves change with long term increased drought severity? Plant Cell Environ. 2010, 33, 863–875. [Google Scholar] [PubMed]
- Gouveia, A.C.; Freitas, H. Modulation of leaf attributes and water use efficiency in Quercus suber along a rainfall gradient. Trees-Struct. Funct. 2009, 23, 267–275. [Google Scholar] [CrossRef]
- Boulmane, M.; Halim, M.; Khia, A.; Oubrahim, H.; Abbassi, H. Biomasse, minéralomasse et éléments nutritifs retournant au sol dans le Quercus ilex du Moyen Atlas Central Marocain. Nat. Technol. 2013, 9, 41–53. [Google Scholar]
- Sebei, H.; Albouchi, A.; Rapp, M.; El Aouni, M.H. Cork oak biomass productivity in a damaging sequence of cytisus cork oak forest in Kroumirie (Tunisia). Ann. For. Sci. 2004, 61, 347–361. [Google Scholar] [CrossRef]
- Pinto, C.A.; Henriques, M.O.; Figueiredo, J.P.; David, J.S.; Abreu, F.G.; Pereira, J.S.; Correia, I.; David, T.S. Phenology and growth dynamics in Mediterranean evergreen oaks: Effects of environmental conditions and water relations. For. Ecol. Manag. 2011, 262, 500–508. [Google Scholar] [CrossRef]
- Eagleson, P.S. Ecological optimality in water-limited natural soil-vegetation systems. 1. Theory and hypothesis. Water Resour. Res. 1982, 18, 325–340. [Google Scholar] [CrossRef]
- Hoff, C.; Rambal, S. An examination of the interaction between climate, soil and leaf area index in a Quercus ilex ecosystem. Ann. For. Sci. 2003, 60, 153–161. [Google Scholar] [CrossRef]
- Limousin, J.M.; Rambal, S.; Ourcival, J.M.; Rodriguez-Calcerrada, J.; Perez-Ramos, I.M.; Rodriguez-Cortina, R.; Misson, L.; Joffre, R. Morphological and phenological shoot plasticity in a Mediterranean evergreen oak facing long-term increased drought. Oecologia 2012, 169, 565–577. [Google Scholar] [CrossRef] [PubMed]
- Van Ommen Koleke, A.E.E.; Douma, J.C.; Ordonez, J.C.; Reich, P.B.; van Bodegom, P.M. Global quantification of contrasting leaf life span strategies for deciduous and evergreen species in response to environmental conditions. Glob. Ecol. Biogeogr. 2012, 21, 224–235. [Google Scholar] [CrossRef]
- Mediavilla, S.; Escudero, A. Stomatal responses to drought at a Mediterranean site: A comparative study of co-occuring woody species differing in leaf longevity. Tree Physiol. 2003, 23, 987–996. [Google Scholar] [CrossRef] [PubMed]
- Caritat, A.; Garcia Berthou, E.; Lapena, R.; Vilar, L. Litter production in a Quercus suber forest of Montseny (NE Spain) and its relationship to meteorological conditions. Ann. For. Sci. 2006, 63, 791–800. [Google Scholar] [CrossRef]
- Andivia, E.; Fernandez, M.; Vazquez Piqué, J.; Gonzalez Perez, A.; Tapias, R. Nutrients return from leaves and litterfall in a mediterranean cork oak (Quercus suber L.) forest in southwestern Spain. Eur. J. For. Res. 2010, 129, 5–12. [Google Scholar] [CrossRef]
- De Lillis, M.; Fontanella, A. Comparative phenology and growth in different species of the Mediterranean maquis of central Italy. Vegetatio 1992, 100, 83–96. [Google Scholar] [CrossRef]
- Léonardi, S.; Rapp, M.; Dénes, A. Biomasse, minéralomasse, productivité et gestion de certains éléments biogènes dans une forêt de Quercus suber L. en Sicile (Italie). Ecol. Mediterr. 1992, 18, 89–98. [Google Scholar]
- Andivia, E.; Vazquez-Pique, J.; Fernandez, M.; Alejano, R. Litter production in Holm oak trees subjected to different pruning intensities in Mediterranean dehesas. Agrofor. Syst. 2013, 87, 657–666. [Google Scholar] [CrossRef]
- Rambal, S. Productivity of Mediterranean-type ecosystems. In Terrestrial Global Productivity: Past, Present, Future; Mooney, H.A., Roy, J., Saugier, B., Eds.; Academic Press: San Diego, CA, USA, 2001; pp. 315–344. [Google Scholar]
- Brahim, N.; Gallali, T.; Bernoux, M. Carbon stock by soils and departments in Tunisia. J. Appl. Sci. 2011, 11, 46–55. [Google Scholar] [CrossRef]
- Davidson, E.A.; Savage, K.; Verchot, L.V.; Navarro, R. Minimizing artefacts and biases in chamber based measurements of soil respiration. Agr. For. Meteorol. 2002, 113, 21–37. [Google Scholar] [CrossRef]
- Hibbard, K.A.; Law, B.E.; Reichstein, M.; Sulzman, J. An analysis of soil respiration across northern hemisphere temperate ecosystems. Biogeochemistry 2005, 73, 29–70. [Google Scholar] [CrossRef]
- Rey, A.; Pegoraro, E.; Oyonarte, C.; Were, A.; Escribano, P.; Raimundo, J. Impact of land degradation on soil respiration in a steppe (Stipa tenacissima L.) semi-arid ecosystem in the SE of Spain. Soil Biol. Biochem. 2011, 43, 393–403. [Google Scholar] [CrossRef]
- Xu, L.; Baldocchi, D.D.; Tang, J. How soil moisture, rain pulses, and growth alter the response of ecosystem respiration to temperature. Glob. Biogeochem. Cycles 2004, 18. [Google Scholar] [CrossRef]
- Tedeschi, V.; Rey, A.; Manca, G.; Valentini, R.; Jarvis, P.G.; Borghetti, M. Soil respiration in a Mediterranean oak forest at different developmental stages after coppicing. Glob. Chang. Biol. 2006, 12, 110–121. [Google Scholar] [CrossRef]
- Janssens, I.A.; Dore, S.; Epron, D.; Lankreijer, H.; Buchmann, N.; Longdoz, B.; Brossaud, J.; Montagnani, L. Climatic influences on seasonal and spatial differences in soil CO2 efflux. In Fluxes of Carbon, Water and Energy of European Forests; Springer-Verlag: Berlin-Heidelberg, Germany, 2003. [Google Scholar]
- Rey, A.; Pegoraro, E.; Tedeschi, V.; de Parri, I.; Jarvis, P.G.; Valentini, R. Annual variation in soil respiration and its components in a coppice oak forest in Central Italy. Glob. Chang. Biol. 2002, 8, 851–866. [Google Scholar] [CrossRef]
- Epron, D.; Farque, L.; Lucot, E.; Badot, P.-M. Soil CO2 efflux in a beech forest: dependence on soil temperature and soil water content. Ann. For. Sci. 1999, 56, 221–226. [Google Scholar] [CrossRef]
- Saiz, G.; Green, C.; Butterbach-Bahl, K.; Kiese, R.; Avitabile, V.; Farrell, E.P. Seasonal and spatial variability of soil respiration in four Sitka spruce stands. Plant Soil 2006, 287, 161–176. [Google Scholar] [CrossRef]
- Lloyd, J.; Taylor, J.A. On the temperature dependence of soil respiration. Funct. Ecol. 1994, 8, 315–323. [Google Scholar] [CrossRef]
- Katterer, T.; Reichstein, M.; Andren, O.; Lomander, A. Temperature dependence of organic matter decomposition: A critical review using literature data analysed with different models. Biol. Fert. Soils 1998, 27, 258–262. [Google Scholar]
- Kukumägi, M.; Ostonen, I.; Kupper, P.; Truu, M.; Tulva, I.; Varik, M.; Aosaar, J.; Sõber, J.; Lõhmus, K. The effects of elevated atmospheric humidity on soil respiration components in a young silver birch forest. Agr. For. Meteorol. 2014, 194, 167–174. [Google Scholar] [CrossRef]
- Hanson, P.J.; Wullschleger, S.D.; Bohlman, S.A.; Todd, D.E. Seasonal and topographic patterns of forest floor CO2 efflux from an upland oak forest. Tree Physiol. 1993, 13, 1–15. [Google Scholar] [CrossRef] [PubMed]
- Thierron, V.; Laudelout, H. Contribution of root respiration to total CO2 efflux from the soil of a deciduous forest. Can. J. For. Res. 1996, 26, 1142–1148. [Google Scholar] [CrossRef]
- Tang, J.W.; Qi, Y.; Xu, M.; Misson, L.; Goldstein, A.H. Forest thinning and soil respiration in a ponderosa pine plantation in the Sierra Nevada. Tree Physiol. 2004, 25, 57–66. [Google Scholar] [CrossRef]
- Rey, A.; Pepsikos, C.; Jarvis, P.G.; Grace, J. The effect of soil temperature and soil moisture on carbon mineralisation rates in a Mediterranean forest soil. Eur. J. Soil Sci. 2005, 56, 589–599. [Google Scholar] [CrossRef]
- Leon, E.; Vargas, R.; Bullock, S.; Lopez, E.; Rodrigo Panasso, A.; La Scala, N., Jr. Hot spots, hot moments, and spatio-temporal controls on soil CO2 efflux in a water-limited ecosystem. Soil Biol. Biochem. 2014, 77, 12–21. [Google Scholar] [CrossRef]
- Davidson, E.A.; Janssens, I.A. Temperature sensitivity of soil carbon decomposition and feedbacks to climate change. Nature 2006, 440, 165–173. [Google Scholar] [CrossRef] [PubMed]
- Uribe, C.; Inclán, R.; Sánchez, D.M.; Clavero, M.A.; Fernández, A.M.; Morante, R.; Cardeña, A.; Blanco, A.; van Miegroet, H. Effect of wildfires on soil respiration in three typical Mediterranean forest ecosystems in Madrid, Spain. Plant soil 2013, 69, 403–420. [Google Scholar] [CrossRef]
- Gillon, D.; Houssard, C.; Joffre, R. Using near-infrared reflectance spectroscopy to predict carbon, nitrogen and phosphorus content in heterogeneous plant material. Oecologia 1999, 118, 173–182. [Google Scholar] [CrossRef]
- Søe, A.R.B.; Buchmann, N. Spatial and temporal variations in soil respiration in relation to stand structure and soil parameters in an unmanaged beech forest. Tree Physiol. 2005, 25, 1427–1436. [Google Scholar] [CrossRef] [PubMed]
- Wiseman, P.E.; Seiler, J.R. Soil CO2 efflux across four age classes of plantation loblolly pine (Pinus taeda L.) on the Virginia Piedmont. For. Ecol. Manag. 2004, 192, 297–311. [Google Scholar] [CrossRef]
- Makkonen, K.; Helmisaari, H.S. Fine root biomass and production in Scots pine stands in relation to stand age. Tree Physiol. 2001, 21, 193–198. [Google Scholar] [CrossRef] [PubMed]
- Hamdi, S.; Chevallier, T.; Aïssa, N.B.; Aïssa, B.N.; Gallali, T.; Chotte, J.-L.; Bernoux, M. Short-term temperature dependence of heterotrophic soil respiration after one-month of pre-incubation at different temperatures. Soil Biol. Biochem. 2011, 43, 1752–1758. [Google Scholar] [CrossRef]
- Annabi, M.; Bahri, H.; Latiri, K. Statut organique et respiration microbienne des sols du nord de la Tunisie. Biotechnol. Agron. Soc. Environ. 2009, 13, 401–408. [Google Scholar]
© 2015 by the authors; licensee MDPI, Basel, Switzerland. This article is an open access article distributed under the terms and conditions of the Creative Commons Attribution license (http://creativecommons.org/licenses/by/4.0/).
Share and Cite
Zribi, L.; Mouillot, F.; Gharbi, F.; Ourcival, J.-M.; Hanchi, B. Warm and Fertile Sub-Humid Conditions Enhance Litterfall to Sustain High Soil Respiration Fluxes in a Mediterranean Cork Oak Forest. Forests 2015, 6, 2918-2940. https://doi.org/10.3390/f6092918
Zribi L, Mouillot F, Gharbi F, Ourcival J-M, Hanchi B. Warm and Fertile Sub-Humid Conditions Enhance Litterfall to Sustain High Soil Respiration Fluxes in a Mediterranean Cork Oak Forest. Forests. 2015; 6(9):2918-2940. https://doi.org/10.3390/f6092918
Chicago/Turabian StyleZribi, Lobna, Florent Mouillot, Fatma Gharbi, Jean-Marc Ourcival, and Belgacem Hanchi. 2015. "Warm and Fertile Sub-Humid Conditions Enhance Litterfall to Sustain High Soil Respiration Fluxes in a Mediterranean Cork Oak Forest" Forests 6, no. 9: 2918-2940. https://doi.org/10.3390/f6092918
APA StyleZribi, L., Mouillot, F., Gharbi, F., Ourcival, J.-M., & Hanchi, B. (2015). Warm and Fertile Sub-Humid Conditions Enhance Litterfall to Sustain High Soil Respiration Fluxes in a Mediterranean Cork Oak Forest. Forests, 6(9), 2918-2940. https://doi.org/10.3390/f6092918