
Simulation of CO2 Fluxes in European Forest Ecosystems with the Coupled Soil-Vegetation Process Model “LandscapeDNDC”


 ,
,
Abstract
:1. Introduction
2. Experimental Section
2.1. Model Framework
2.2. Site Description
2.3. Model Parameter Calibration
2.4. Statistics

| Site | Shortcut | Tree Species | Latitude | Average Annual Climate Conditions | Stand Age | N Dep. (kg N ha−1·a−1) | Organic Layer | Soil (First 5 cm) | |||||||
|---|---|---|---|---|---|---|---|---|---|---|---|---|---|---|---|
| T (°C) | P (mm) | Humus Type | C (%) | C:N | Soil Type | Clay (%) | C (%) | C:N | pH | ||||||
| Hyytiälä—Finland * | FI-Hyy | Pinus sylvestris | N 61°50′ | 4.0 | 614 | 56 | 4 | MODER | 32 | 39 | sandy loam | 8–13 | 3.4 | 31 | 4.6 |
| Brasschaat—Belgium | Be-Bra | Pinus sylvestris | N 51°18′ | 10.8 | 825 | 87 | 40 | MODER | 44 | 28 | loamy sand | 1–4 | 5.0 | 23 | 3.8 |
| Loobos—Netherlands | NL-Loo | Pinus sylvestris | N 52°10′ | 10.1 | 788 | 106 | 50 | MODER | 44 * | 27 | sand | 2 | 8.5 | 17 | 3.4 |
| Sodankylä—Finland | FI-Sod | Pinus sylvestris | N 67°21′ | 0.8 | 500 | 60–154 | 2 | MODER | 32 | 29 *** | sand | 2–9 | 2.2 | 29 *** | 3.3 |
| Höglwald—Germany | DE-Hoeg | Picea abies | N 50°30′ | 8.7 | 856 | 109 | 30 | MODER | 35 | 30 | loam | 5–25 | 4.2 | 19 | 3.6 |
| Tharandt—Germany * | DE-Tha | Picea abies | N 50°57′ | 8.9 | 860 | 125 | 30 | MODER | 41 | 24 | silty loam | 13–16 | 6.3 | 20 | 3.9 |
| Wetzstein—Germany | DE-Wet | Picea abies | N 50°27′ | 6.5 | 865 | 61 | 21 | MODER | 36 | 26 | loamy sand | 7–11 | 7.0 | 10 | 3.7 |
| Collelongo—Italy | IT-Col | Fagus sylvatica | N 46°35′ | 4.7 | 830 | 47 | 12 | MODER | 38 | 33 | silty clay | 25–27 | 9.0 | 13 | 4.1 |
| Soroe—Denmark | DK-Sor | Fagus sylvatica | N 55°29′ | 8.6 | 752 | 95 | 27 | MODER | 45 *** | 22 *** | sandy loam | 23–26 | 2.5 | 15 | 4.6 |
| Hesse—France ** | FR-Hes | Fagus sylvatica | N 48°40′ | 10.2 | 965 | 46 | 16 | MULL | 41 | 41 | silty clay | 22–29 | 3.9 | 15 | 4.6 |
| Group | Parameter | Description | Units | Fagus Sylvatica | Picea Abies | Pinus Sylvestris | ||||||
|---|---|---|---|---|---|---|---|---|---|---|---|---|
| Min | Max | References | Min | Max | References | Min | Max | References | ||||
| A | BASEFOLRESPFRAC | respiration as fraction of max. photosynthesis | (0–1) | 0.05 | 0.15 | [66] +/−0.05 | 0.05 | 0.15 | [66] +/−0.05 | 0.05 | 0.15 | [66] +/−0.05 |
| A | FRTALLOC_BASE | intercept of relationship between foliar and root allocation | - | 0.0 | 130 | [32,66] | 0.0 | 130.0 | [32,66] | 0.0 | 130.0 | [32,66] |
| A | FRTLOSS_SCALE | slope of relationship between foliar and root allocation | - | 1.0 | 7.0 | + | 1.0 | 7.0 | + | 1.0 | 7.0 | + |
| A | GRESPFRAC | growth respiration as fraction of allocation | (0–1) | 0.20 | 0.25 | [32,67] | 0.2 | 0.3 | [32,66] | 0.2 | 0.3 | [32,66] |
| A | MFOLOPT | foliage biomass under optimal closed canopy condition | kg DW·m−2 | 0.23 | 0.39 | [68,69] | 1.10 | 1.66 | ++, [70] | 0.39 | 0.96 | [71,72] |
| A | QWODFOLMIN | min. ratio of carbon allocation to wood and foliage | - | 0.3 | 5.0 | + | 0.3 | 5.0 | + | 0.3 | 5.0 | + |
| A | RESPQ10 | temperature dependency of leaf respiration | °C | 1.8 | 2.3 | [73,74] | 2.0 | 5.0 | [32,75] | 2.0 | 2.3 | [77,77,78] |
| A | ROOTMRESPFRAC | fine root maintenance respiration, fraction of allocation | - | 0.5 | 1.0 | [32,66] | 0.5 | 1.0 | [32,66] | 0.5 | 1.0 | [32,66] |
| A | WOODMRESPA | wood maintenance respiration, fraction of allocation | (0–1) | 0.07 | 0.35 | [32,66] | 0.07 | 0.35 | [32,66] | 0.07 | 0.35 | [32,66] |
| N | AMAXB | nitrogen dependency of photosynthesis | nmol CO2 g−1·s−1/% N | 36.0 | 71.9 | [35,79] | 0.0 | 75.6 | [79,80,81] | 0.0 | 75.6 | same as PIAB |
| N | EXPL_NH4 | exploitation rate of NH4 | % | 0.00 | 0.50 | +++ | 0.00 | 0.50 | ++ | 0.0 | 0.5 | [40] |
| N | EXPL_NO3 | exploitation rate of NO3 | % | 0.00 | 0.35 | +++, [82] | 0.00 | 0.15 | ++ | 0.0 | 0.3 | [40] |
| N | FRET_N | max. fraction of nitrogen retranslocated before tissue loss | (0–1) | 0.2 | 0.7 | [67,83] | 0.15 | 0.50 | [84,85] | 0.56 | 0.62 | [86,87] |
| N | NCFOLOPT | opt. nitrogen concentration of foliage | g N·g DW−1 | 0.015 | 0.035 | [88,89,90] | 0.011 | 0.020 | [91,92] | 0.013 | 0.022 | [93,94] |
| N | NCFRTOPT | opt. nitrogen concentration of fine roots | g N·g DW−1 | 0.007 | 0.01 | [13,95] | 0.005 | 0.02 | [96,97] | 0.0027 | 0.01 | [91,98] |
| N | NCSAPOPT | opt. nitrogen concentration of living wood | g N·g DW−1 | 0.001 | 0.002 | [83,99] | 0.001 | 0.002 | [100], + | 0.001 | 0.002 | [91,100] |
| N | SENESCSTART | day of year after which leaf death can occur | day number | 195 | 325 | ++++/−65 | 205 | 335 | [75] +/−0.65 | 205 | 325 | [35] +/−0.65 |
| T | GDDFOLEND | max. temperature sum for foliage activity offset | °C | 200 | 1300 | [35] +/−400 | 1100 | 1400 | [75,101] | 1100 | 1400 | [102,103] |
| T | GDDFOLSTART | min. temperature sum for foliage activity onset | °C | 100 | 580 | [13,35] | 250 | 350 | [75,101] | 190 | 280 | [86,104] |
| T | GDDWODEND | max. temperature sum for wood activity offset | °C | 900 | 1700 | ++++/−400, [35] | 1000 | 1800 | [75] +/−400, [35] | 1400 | 2200 | [103] +/−400 |
| T | GDDWODSTART | min. temperature sum for wood activity onset | °C | 100 | 400 | ++++/−150, [35] | 100 | 400 | [75] +/−150 | 200 | 500 | [103] +/−150 |
| T | PSNTMAX | max. temperature for photosynthesis | °C | 25 | 45 | [76] +/−10 | 32 | 52 | [105] +/−10 | 27 | 47 | [76] +/−10 |
| T | PSNTMIN | min. temperature for photosynthesis | °C | 0 | 10 | [76] +/−5 | −8 | 2 | [105] +/−5 | −7 | 3 | [76] +/−5 |
| T | PSNTOPT | opt. temperature for photosynthesis | °C | 14 | 34 | [76] +/−10 | 14 | 34 | [75] +/−10 | 8 | 28 | [76] +/−10 |
| W_L | EXT | light extinction (attenuation) coefficient | (0–1) | 0.25 | 0.65 | [106,107] | 0.40 | 0.67 | [80,108] | 0.40 | 0.65 | [108,109] |
| W_L | H2OREF_A | relative available soil water content at which conductance is affected | (0–1) | 0.2 | 0.6 | [106] +/−0.2 | 0.2 | 0.6 | [110] +/−0.2 | 0.2 | 0.6 | [111] +/−0.2 |
| W_L | WUECMAX | max. water use efficiency | mg CO2·g H2O−1 | 4.6 | 14.0 | [112], +++ | 4.8 | 13.9 | [75,113] | 4.1 | 12.0 | [114,115] |
| Group | Fagus Sylvatica | Picea Abies | Pinus Sylvestris | ||||||
|---|---|---|---|---|---|---|---|---|---|
| Parameter | Mean | CV (%) | Parameter | Mean | CV (%) | Parameter | Mean | CV (%) | |
| A | FRTALLOC_BASE | 88.715 | 54.429 | FRTALLOC_BASE | 52.227 | 123.389 | FRTALLOC_BASE | 75.717 | 74.642 |
| A | WOODMRESPA | 0.181 | 47.023 | QWODFOLMIN | 3.094 | 61.075 | QWODFOLMIN | 1.363 | 51.107 |
| A | BASEFOLRESPFRAC | 0.097 | 28.491 | RESPQ10 | 2.981 | 51.829 | WOODMRESPA | 0.221 | 46.430 |
| A | QWODFOLMIN | 4.028 | 24.632 | BASEFOLRESP FRAC | 0.093 | 46.728 | FRTLOSS_SCALE | 3.352 | 44.372 |
| A | FRTLOSS_SCALE | 3.303 | 24.178 | WOODMRESPA | 0.111 | 42.231 | MFOLOPT | 0.699 | 32.916 |
| A | MFOLOPT | 0.338 | 16.603 | FRTLOSS_SCALE | 5.369 | 25.779 | BASEFOLRESP FRAC | 0.106 | 25.451 |
| A | RESPQ10 | 1.981 | 16.064 | GRESPFRAC | 0.228 | 16.925 | ROOTMRESPFRAC | 0.881 | 8.171 |
| A | ROOTMRESPFRAC | 0.776 | 6.718 | ROOTMRESPFRAC | 0.598 | 12.930 | GRESPFRAC | 0.262 | 4.283 |
| A | GRESPFRAC | 0.222 | 5.815 | MFOLOPT | 1.420 | 11.100 | RESPQ10 | 2.064 | 1.509 |
| N | FRET_N | 0.466 | 47.019 | EXPL_NO3 | 0.149 | 76.562 | AMAXB | 44.4 | 44.553 |
| N | EXPL_NO3 | 0.202 | 42.584 | EXPL_NH4 | 0.217 | 74.349 | NCFRTOPT | 0.006 | 42.086 |
| N | EXPL_NH4 | 0.363 | 21.501 | AMAXB | 37.2 | 37.917 | EXPL_NH4 | 0.333 | 41.451 |
| N | AMAXB | 55.6 | 14.698 | NCSAPOPT | 0.002 | 37.124 | EXPL_NO3 | 0.252 | 15.294 |
| N | NCSAPOPT | 0.001 | 14.343 | NCFRTOPT | 0.009 | 23.406 | SENESCSTART | 240.4 | 10.535 |
| N | NCFRTOPT | 0.007 | 13.070 | FRET_N | 0.243 | 13.592 | NCFOLOPT | 0.019 | 5.071 |
| N | NCFOLOPT | 0.030 | 10.683 | NCFOLOPT | 0.012 | 5.573 | NCSAPOPT | 0.001 | 3.988 |
| N | SENESCSTART | 240.7 | 8.768 | SENESCSTART | 208.6 | 0.915 | FRET_N | 0.599 | 2.194 |
| T | GDDFOLSTART | 304.1 | 56.337 | GDDWODEND | 1591.5 | 35.090 | GDDWODSTART | 367.8 | 45.798 |
| T | GDDWODEND | 1643.8 | 34.031 | GDDWODSTART | 179.8 | 9.172 | GDDWODEND | 1538.2 | 26.710 |
| T | GDDFOLEND | 603.6 | 25.309 | GDDFOLSTART | 299.8 | 8.838 | GDDFOLSTART | 239.5 | 16.397 |
| T | GDDWODSTART | 232.3 | 18.472 | GDDFOLEND | 1235.4 | 6.737 | GDDFOLEND | 1287.6 | 3.857 |
| T | PSNTMAX * | 316.4 | 2.410 | PSNTOPT * | 301.8 | 3.754 | PSNTOPT * | 292.8 | 1.730 |
| T | PSNTOPT * | 301.7 | 1.073 | PSNTMAX * | 310.6 | 0.737 | PSNTMAX * | 314.6 | 0.907 |
| T | PSNTMIN * | 278.1 | 0.316 | PSNTMIN * | 270.3 | 0.252 | PSNTMIN * | 272.1 | 0.801 |
| W_L | EXT | 0.354 | 34.717 | H2OREF_A | 0.239 | 21.531 | H2OREF_A | 0.347 | 49.831 |
| W_L | H2OREF_A | 0.271 | 17.406 | EXT | 0.597 | 10.762 | WUECMAX | 10.295 | 17.160 |
| W_L | WUECMAX | 13.343 | 2.472 | WUECMAX | 13.589 | 2.489 | EXT | 0.580 | 6.529 |
| Parameter | Group | Fagus Sylvatica | Picea Abies | Pinus Sylvestris |
|---|---|---|---|---|
| BASEFOLRESPFRAC | A | 0.085 | 0.133 | 0.146 |
| FRTALLOC_BASE | A | 86.0 | 17.7 | 52.4 |
| FRTLOSS_SCALE | A | 2.423 | 5.689 | 4.240 |
| GRESPFRAC | A | 0.240 | 0.214 | 0.238 |
| MFOLOPT | A | 0.332 | 1.583 | 0.423 |
| QWODFOLMIN | A | 3.052 | 4.123 | 0.602 |
| RESPQ10 | A | 1.693 | 2.637 | 2.094 |
| ROOTMRESPFRAC | A | 0.662 | 0.553 | 0.759 |
| WOODMRESPA | A | 0.166 | 0.130 | 0.118 |
| AMAXB | N | 62.6 | 23. 3 | 52.0 |
| EXPL_NH4 | N | 0.245 | 0.306 | 0.209 |
| EXPL_NO3 | N | 0.301 | 0.189 | 0.062 |
| FRET_N | N | 0.520 | 0.420 | 0.617 |
| NCFOLOPT | N | 0.030 | 0.016 | 0.014 |
| NCFRTOPT | N | 0.009 | 0.020 | 0.004 |
| NCSAPOPT | N | 0.001 | 0.001 | 0.001 |
| SENESCSTART | N | 208.9 | 207.3 | 258.4 |
| GDDFOLEND | T | 521.3 | 1257. 7 | 1054.3 |
| GDDFOLSTART | T | 184.4 | 311.3 | 234.1 |
| GDDWODEND | T | 1738.9 | 1012.9 | 1317.1 |
| GDDWODSTART | T | 139.7 | 256.9 | 202.5 |
| PSNTMAX | T | 45.1 | 38.8 | 40.6 |
| PSNTMIN | T | 4.450 | −2.494 | 0.650 |
| PSNTOPT | T | 34.5 | 35.1 | 20.5 |
| EXT | W_L | 0.532 | 0.632 | 0.560 |
| H2OREF_A | W_L | 0.349 | 0.295 | 0.212 |
| WUECMAX | W_L | 12.3 | 13.7 | 10.3 |
3. Results
3.1. Site-Specific Parameter Variability
3.1.1. Allocation and Respiration Parameters
3.1.2. Nitrogen Dependency
3.1.3. Temperature Dependency
3.1.4. Water Dependency
3.2. Species-Specific Parameter Variability
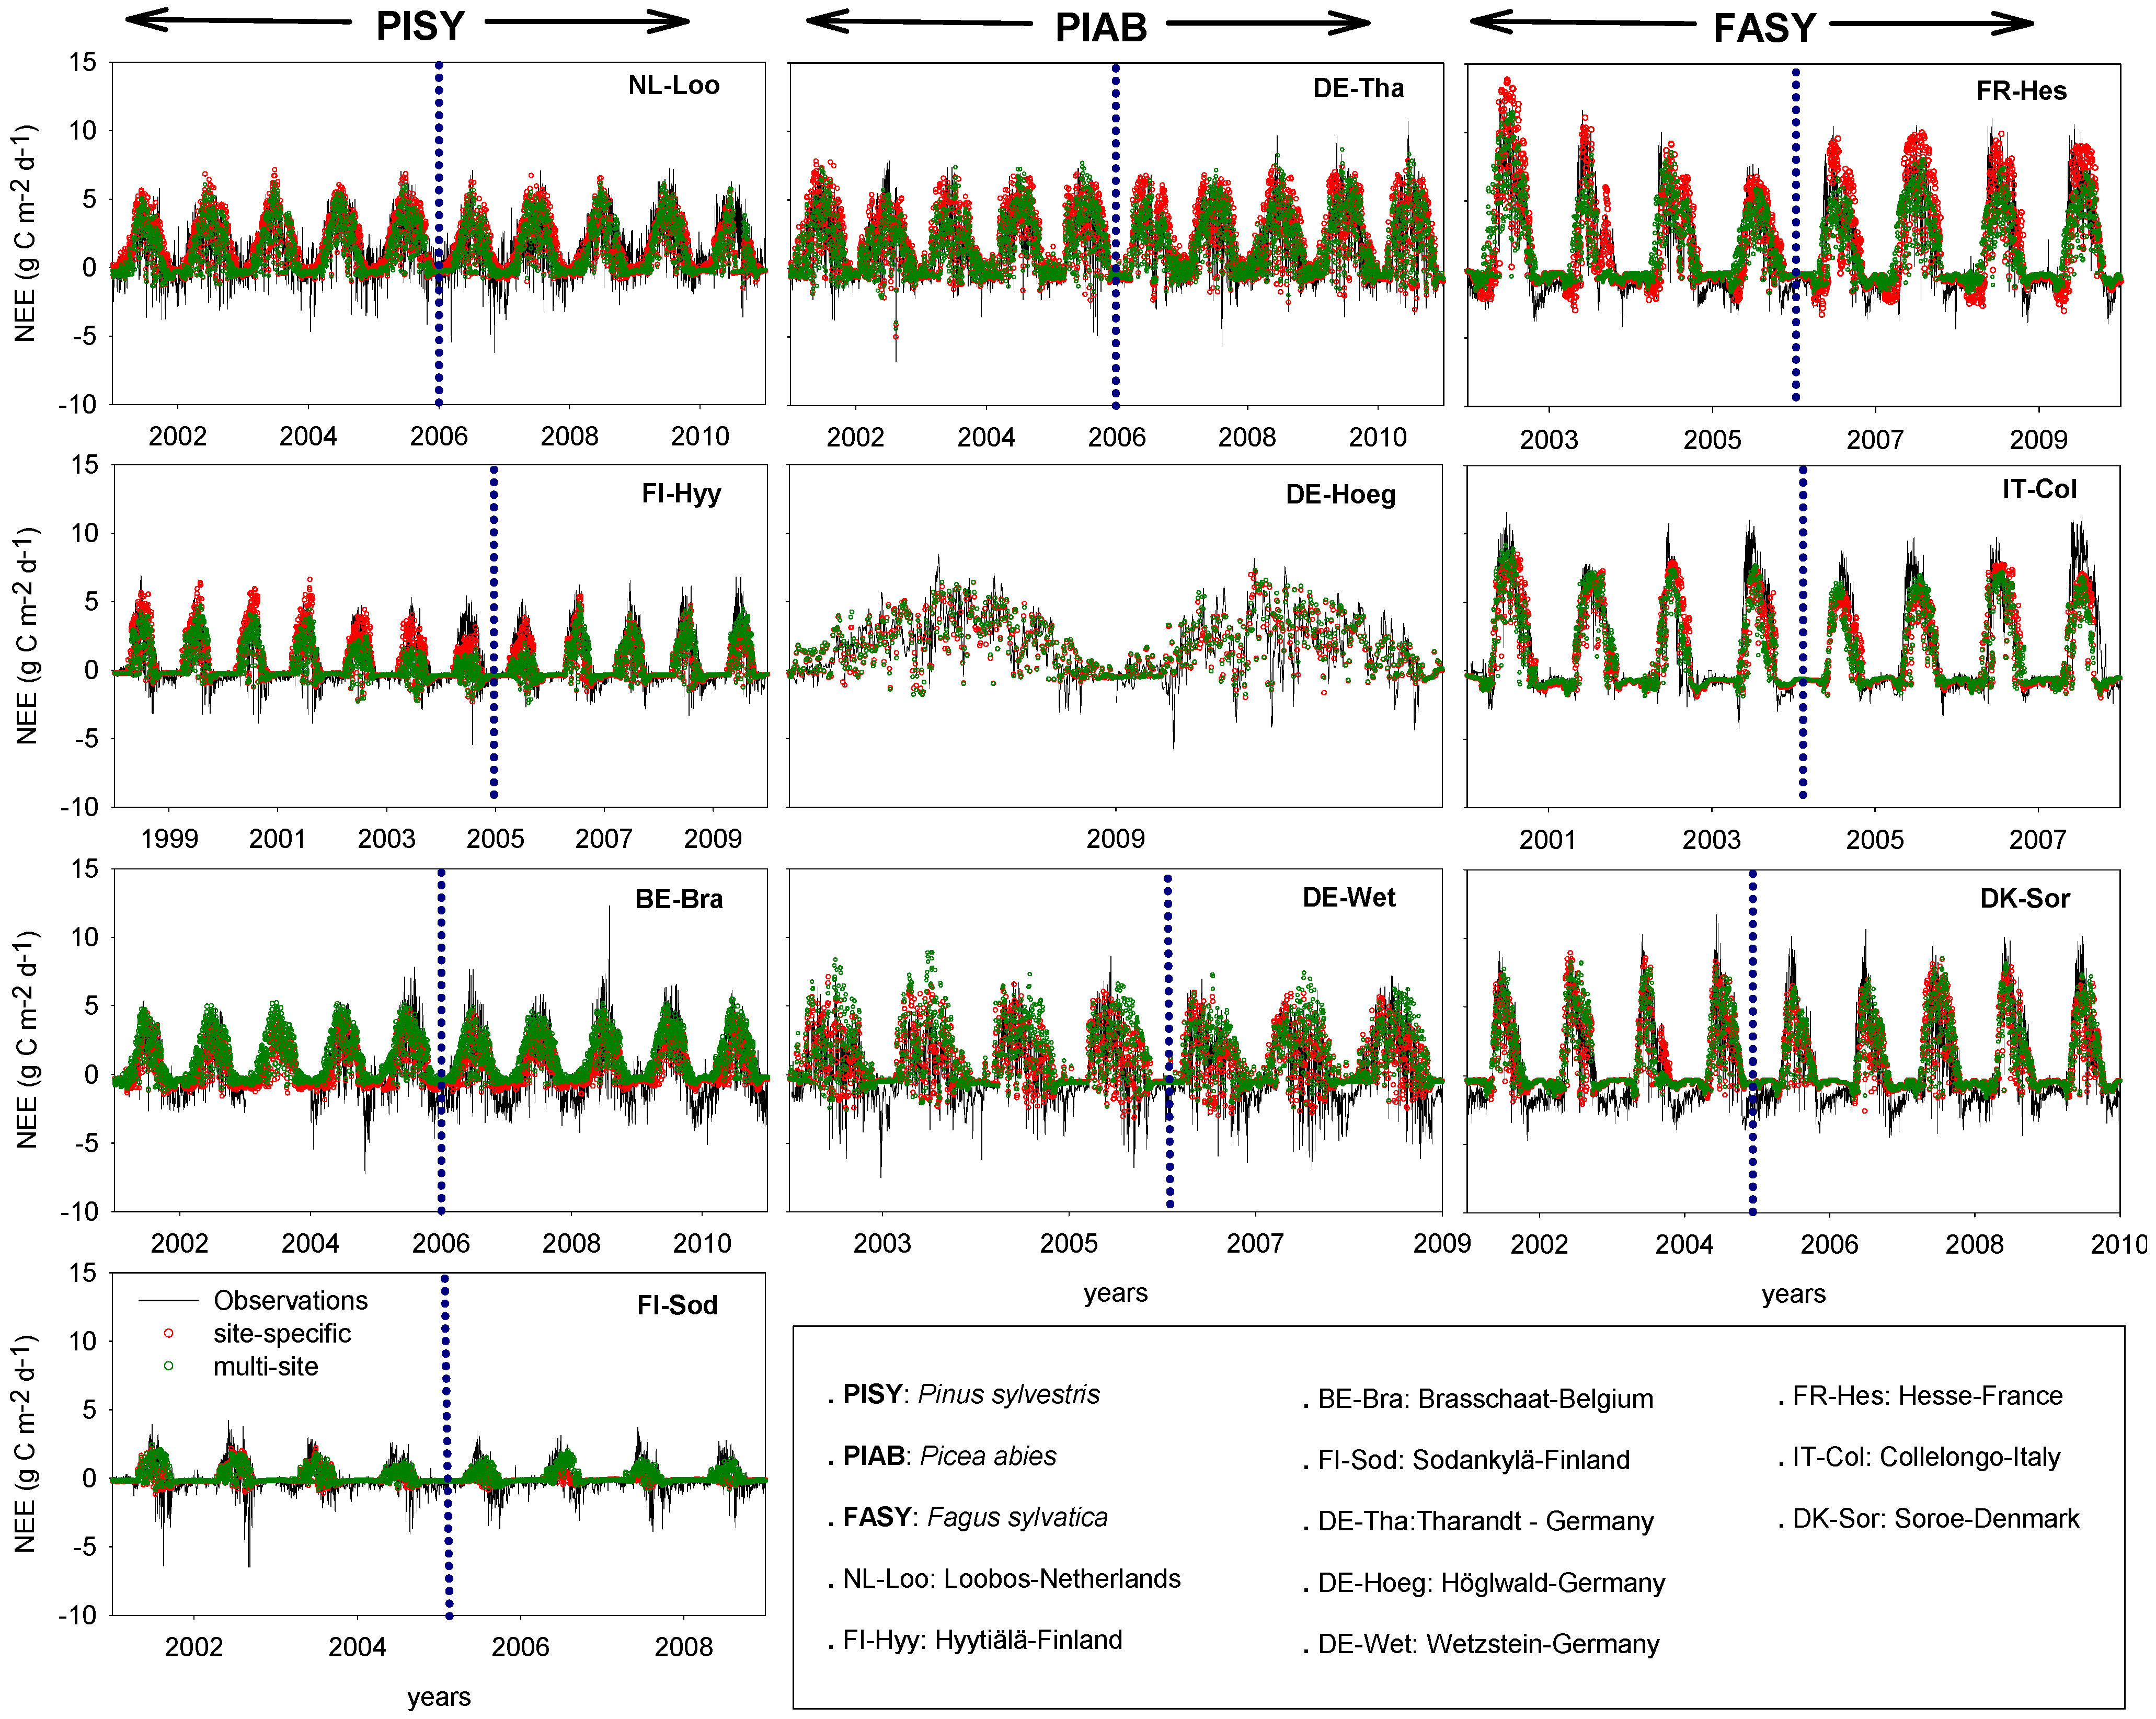
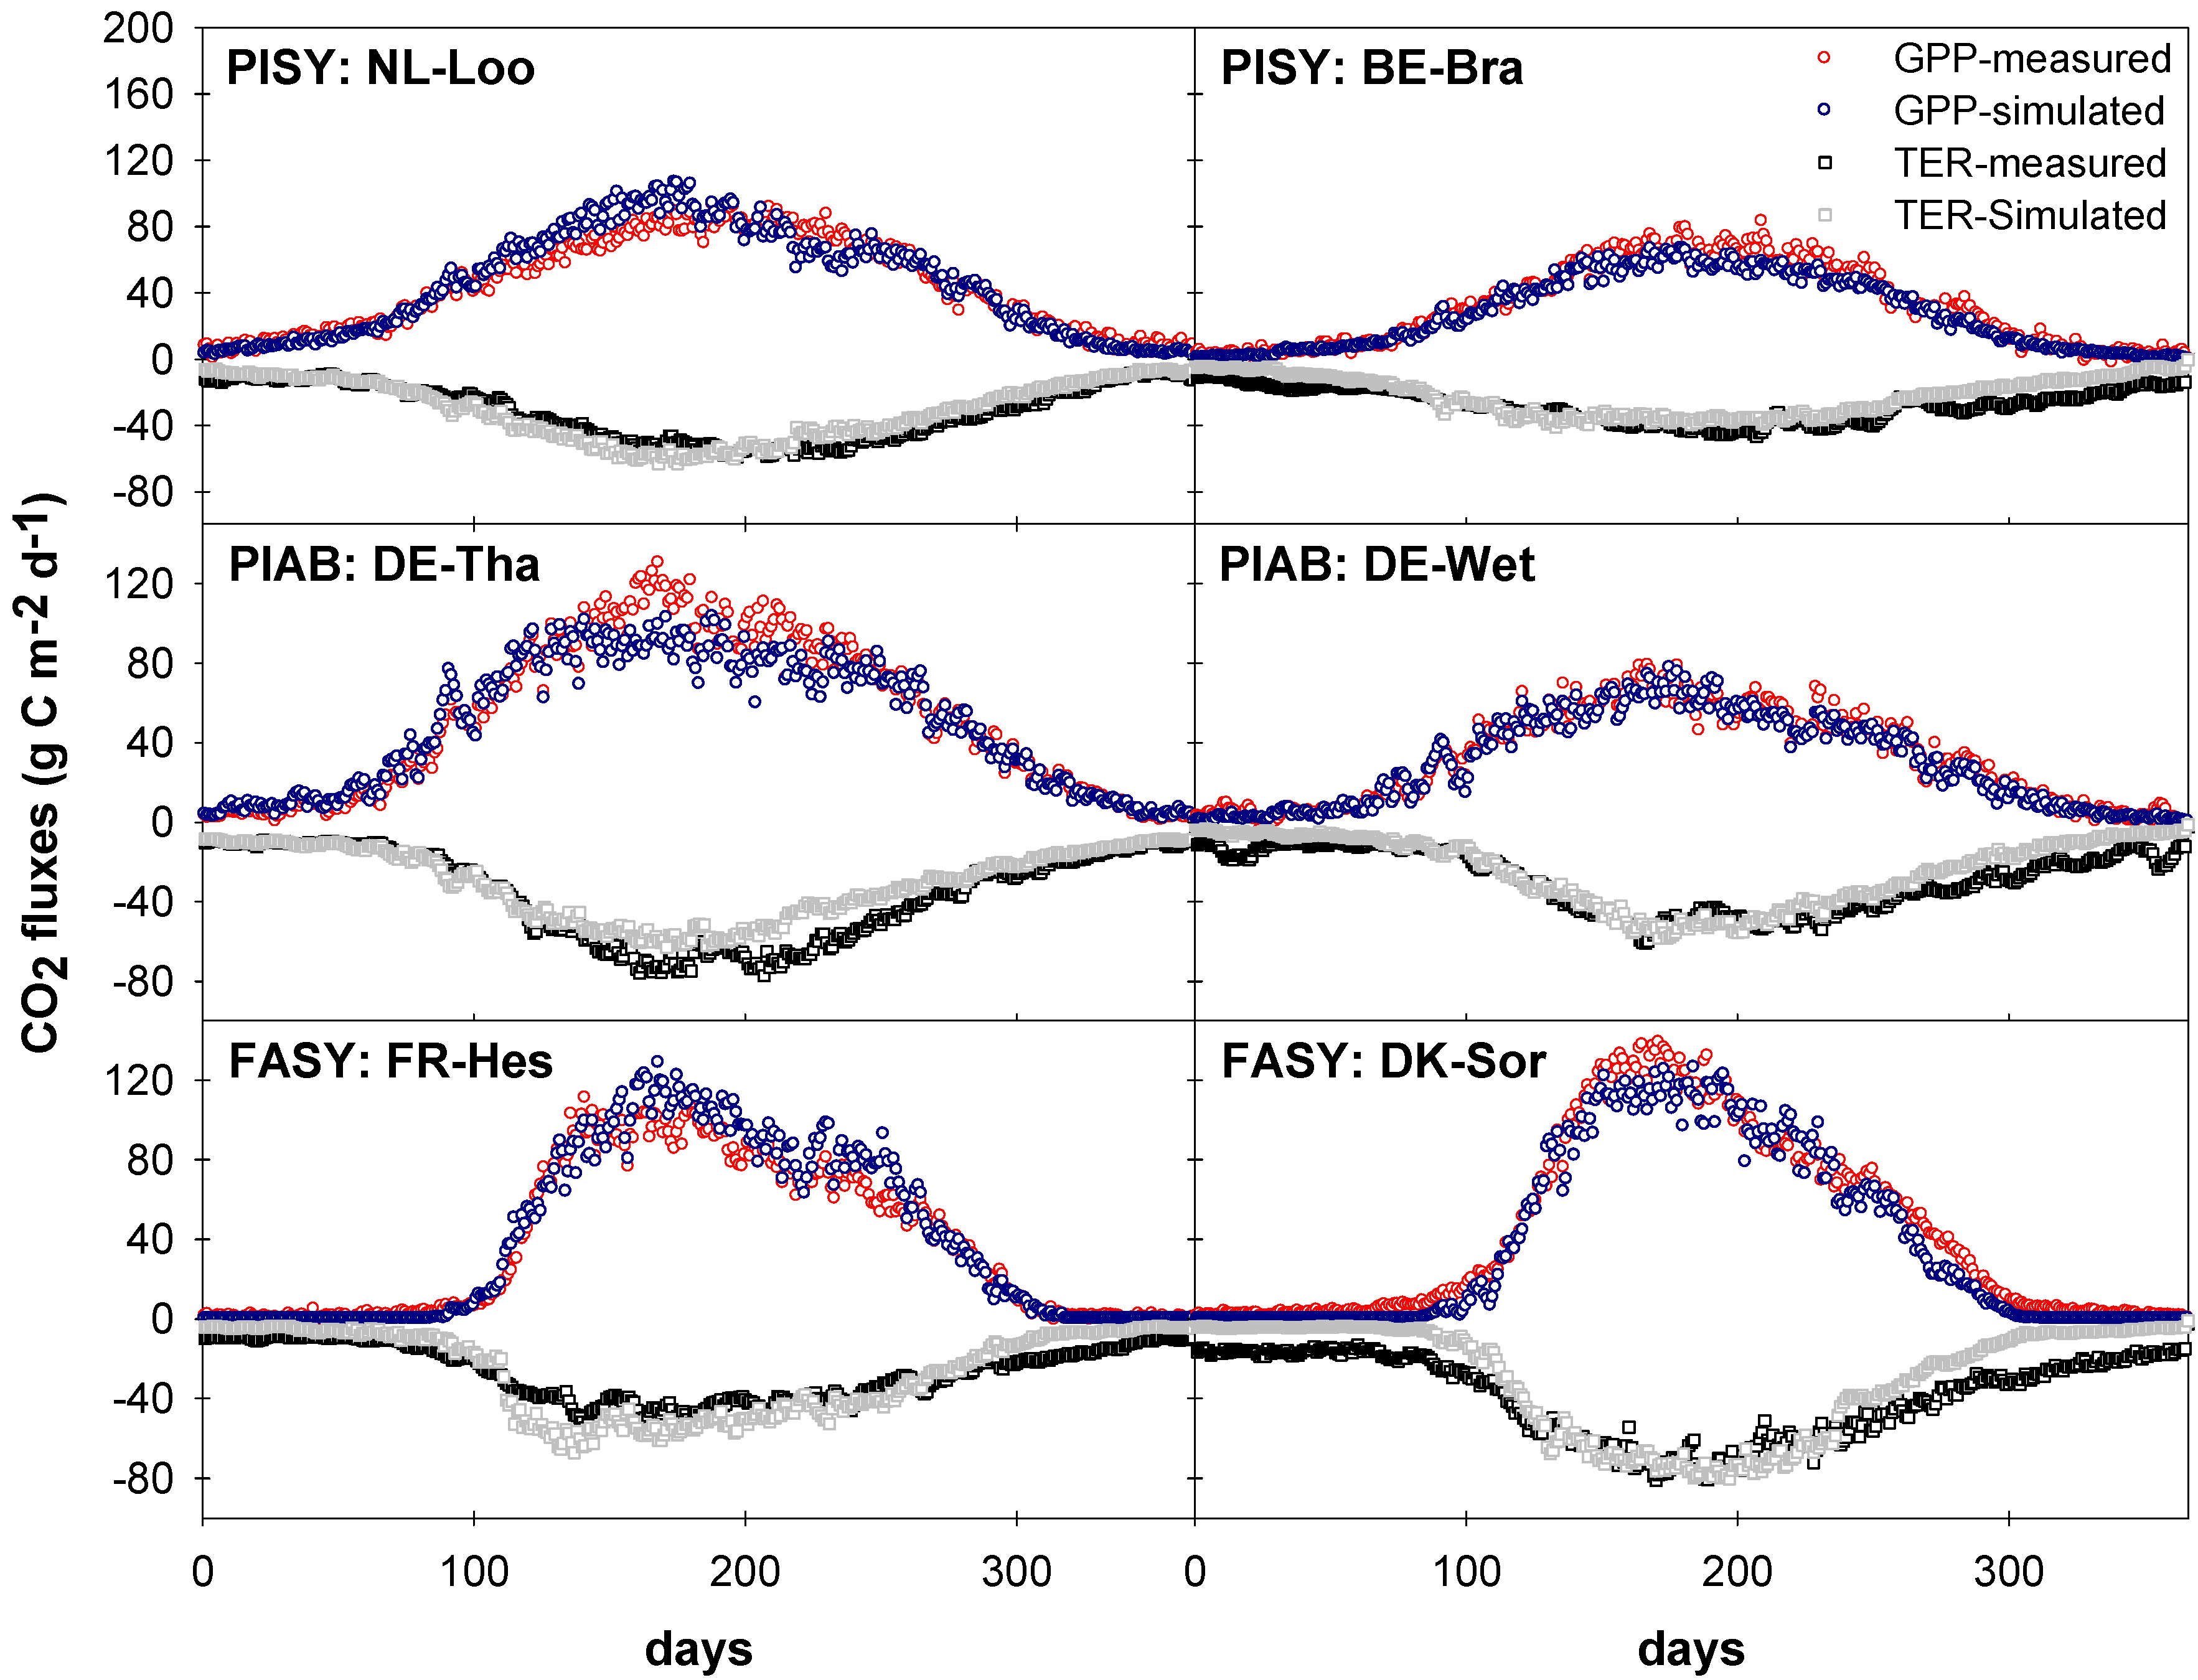
3.3. Measured vs. Simulated Daily and Monthly CO2 Exchange Fluxes
3.3.1. Comparison of Model Performances for the Calibration and Evaluation Periods
| Tree Species | Site | CO2 Flux | r2 | ME | RPMSEn | |||
|---|---|---|---|---|---|---|---|---|
| CP | EP | CP | EP | CP | EP | |||
| Pinus sylvestris | FI-Hyy | GPP | 0.85 | 0.86 | 0.85 | 0.81 | 0.39 | 0.44 |
| NEE | 0.65 | 0.71 | 0.61 | 0.63 | 0.62 | 0.61 | ||
| BE-Bra | GPP | 0.85 | 0.80 | 0.83 | 0.73 | 0.41 | 0.52 | |
| NEE | 0.70 | 0.70 | 0.64 | 0.63 | 0.60 | 0.61 | ||
| NL-Loo | GPP | 0.90 | 0.71 | 0.84 | 0.65 | 0.39 | 0.59 | |
| NEE | 0.74 | 0.51 | 0.70 | 0.47 | 0.55 | 0.72 | ||
| FI-Sod | GPP | 0.78 | 0.68 | 0.78 | 0.34 | 0.47 | 0.81 | |
| NEE | 0.64 | 0.35 | 0.63 | 0.22 | 0.61 | 0.88 | ||
| Picea abies | DE-Hoeg | GPP | 0.67 | - | 0.62 | - | 0.61 | - |
| NEE | 0.51 | - | 0.48 | - | 0.72 | - | ||
| DE-Tha | GPP | 0.85 | 0.80 | 0.85 | 0.79 | 0.39 | 0.45 | |
| NEE | 0.65 | 0.65 | 0.61 | 0.60 | 0.62 | 0.63 | ||
| DE-Wet | GPP | 0.85 | 0.79 | 0.83 | 0.77 | 0.41 | 0.48 | |
| NEE | 0.70 | 0.56 | 0.64 | 0.54 | 0.60 | 0.68 | ||
| Fagus sylvatica | IT-Col | GPP | 0.79 | 0.66 | 0.77 | 0.63 | 0.48 | 0.60 |
| NEE | 0.70 | 0.57 | 0.70 | 0.55 | 0.55 | 0.67 | ||
| DK-Sor | GPP | 0.84 | 0.85 | 0.81 | 0.83 | 0.43 | 0.42 | |
| NEE | 0.67 | 0.69 | 0.64 | 0.67 | 0.60 | 0.57 | ||
| FR-Hes | GPP | 0.83 | 0.87 | 0.71 | 0.84 | 0.54 | 0.40 | |
| NEE | 0.72 | 0.73 | 0.69 | 0.70 | 0.56 | 0.55 | ||
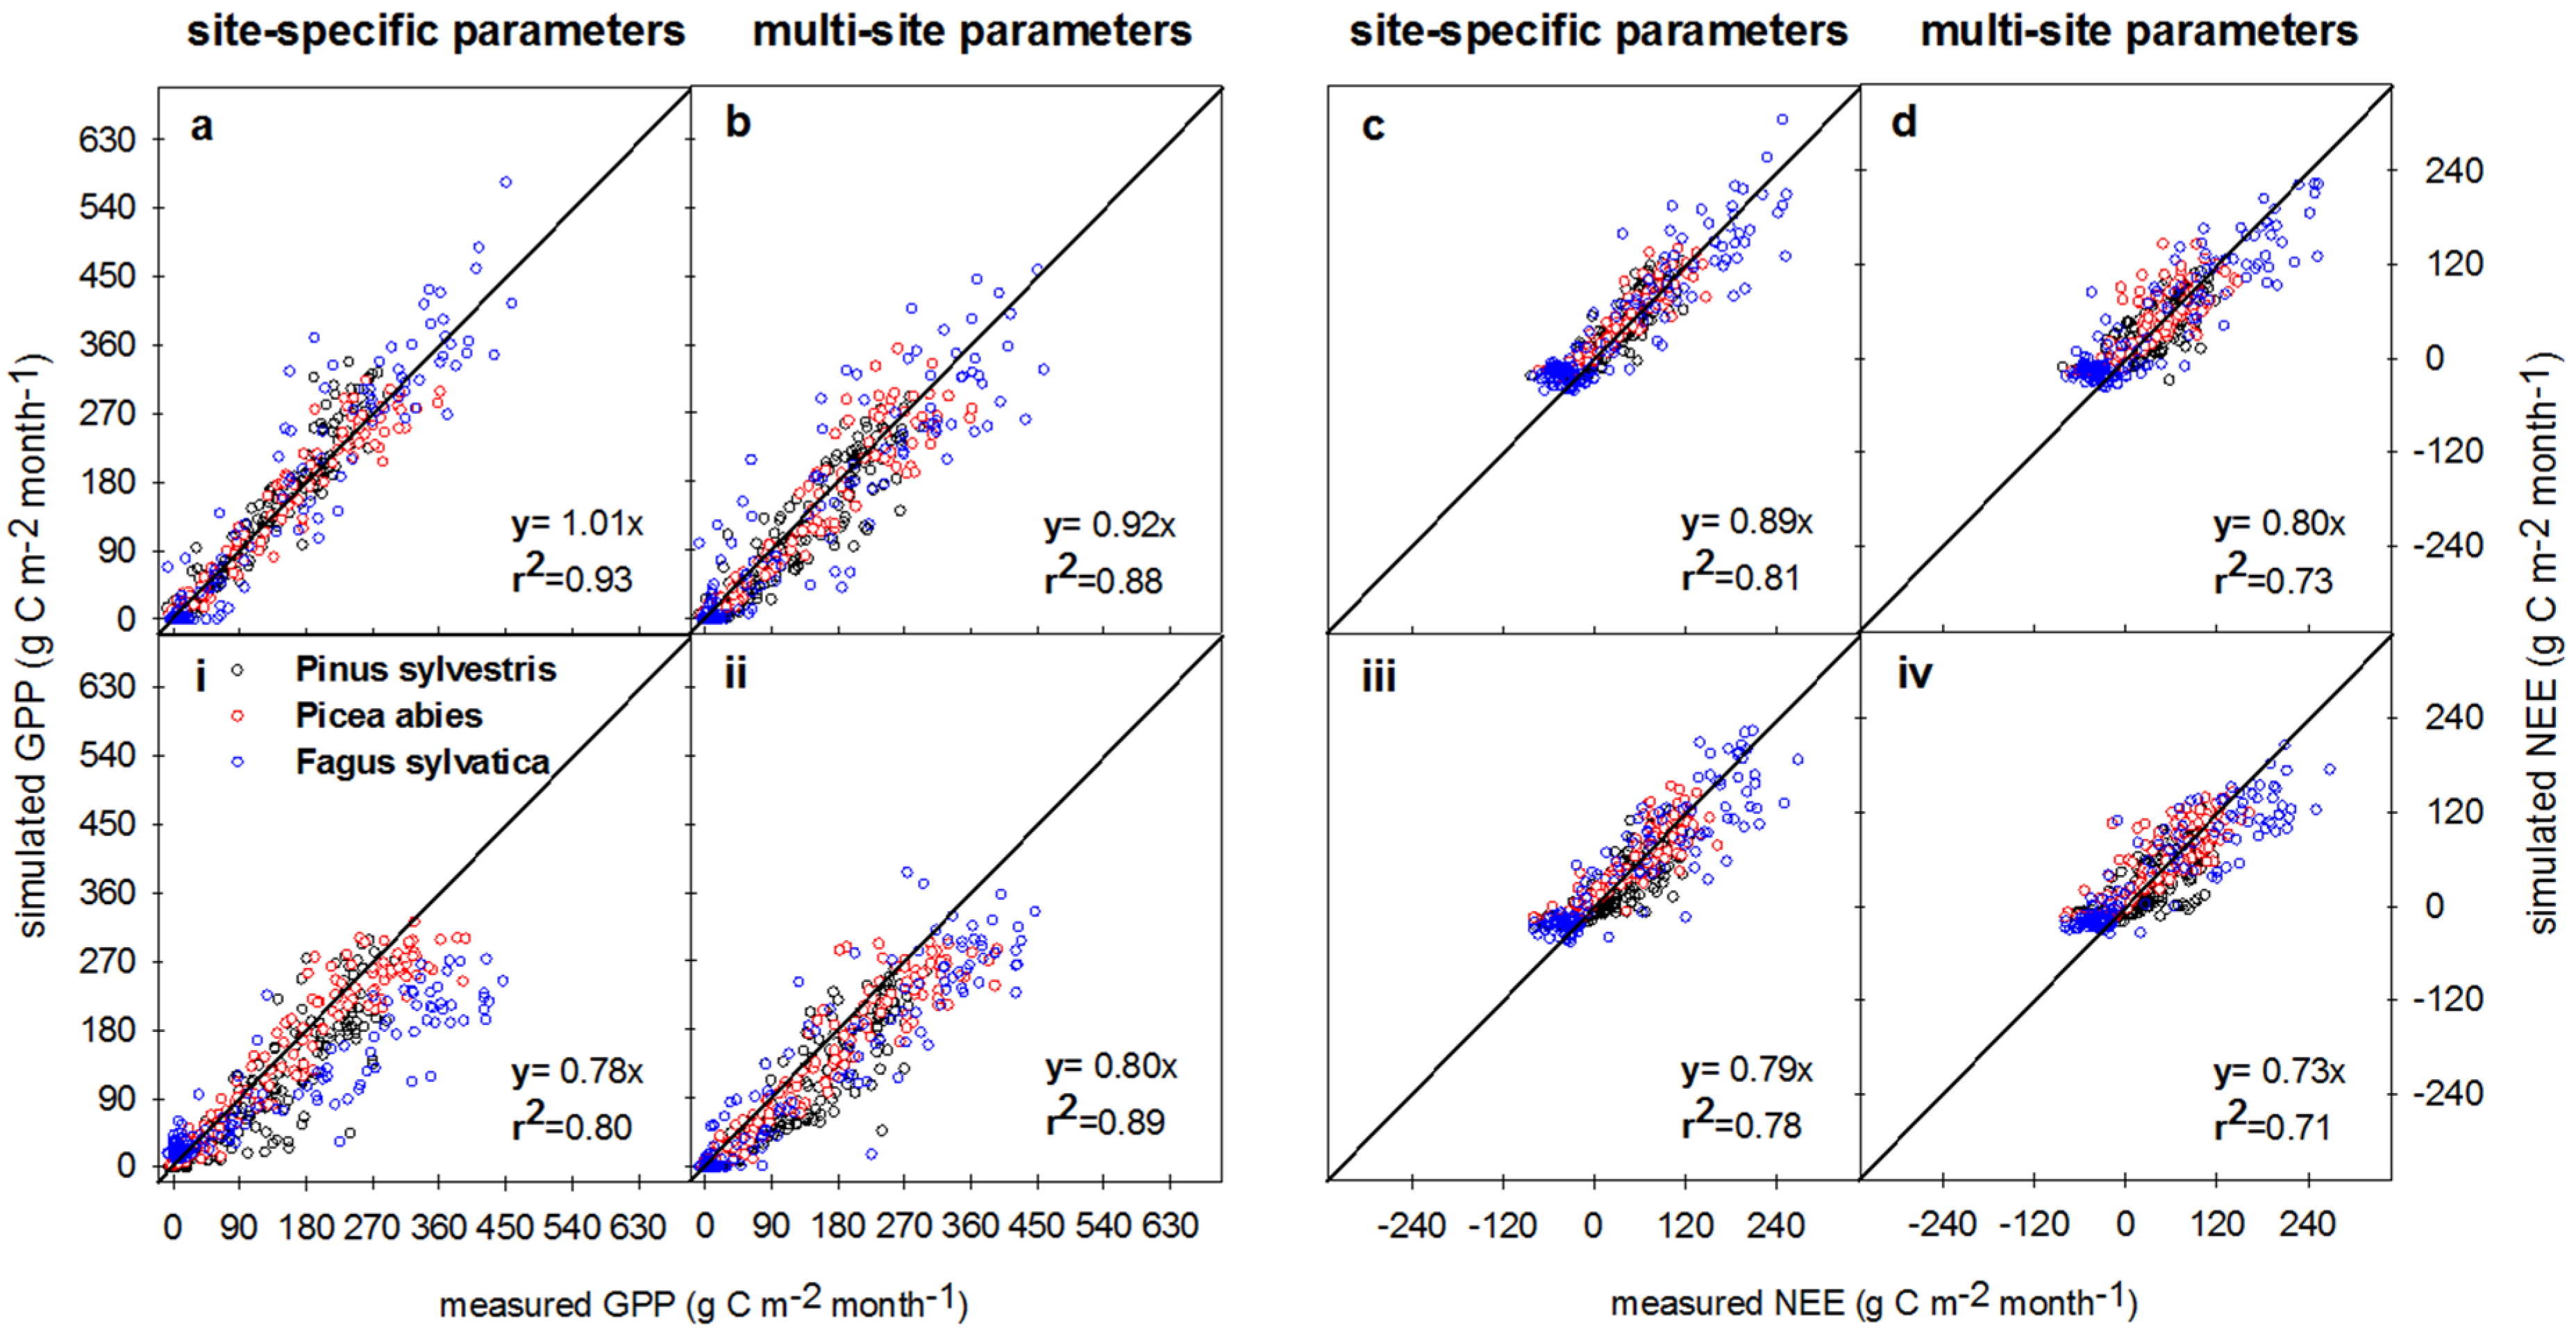
3.3.2. Gross Primary Productivity (GPP)
3.3.3. Net Ecosystem Exchange (NEE)
| Tree Species | Site | Period | Calibration Type | Annual Mean CO2 Fluxes (g C m−2 day−1) | Model | ||||||
|---|---|---|---|---|---|---|---|---|---|---|---|
| Measured | SIMULATED | ||||||||||
| Mean | STD. | Mean | STD. | r2 | ME | RMSPEn | |||||
| Pinus sylvestris | FI-Hyy | 2004–2009 | GPP | multi-site | 3.04 | 3.28 | 2.19 | 2.74 | 0.84 | 0.76 | 0.49 |
| site-specific | 3.04 | 3.28 | 2.32 | 2.76 | 0.86 | 0.81 | 0.44 | ||||
| NEE | multi-site | 0.74 | 1.87 | 0.29 | 1.20 | 0.59 | 0.51 | 0.70 | |||
| site-specific | 0.74 | 1.87 | 0.34 | 1.21 | 0.71 | 0.63 | 0.61 | ||||
| BE-Bra | 2006–2010 | GPP | multi-site | 3.72 | 3.31 | 3.32 | 2.80 | 0.79 | 0.77 | 0.48 | |
| site-specific | 3.72 | 3.31 | 2.97 | 2.58 | 0.80 | 0.73 | 0.52 | ||||
| NEE | multi-site | 0.32 | 2.35 | 1.10 | 1.53 | 0.69 | 0.55 | 0.67 | |||
| site-specific | 0.32 | 2.35 | 0.54 | 1.39 | 0.70 | 0.63 | 0.61 | ||||
| NL-Loo | 2006–2010 | GPP | multi-site | 4.39 | 3.16 | 3.42 | 3.17 | 0.73 | 0.61 | 0.62 | |
| site-specific | 4.39 | 3.16 | 4.26 | 3.40 | 0.71 | 0.65 | 0.59 | ||||
| NEE | multi-site | 1.30 | 1.88 | 1.11 | 1.69 | 0.50 | 0.46 | 0.74 | |||
| site-specific | 1.30 | 1.88 | 1.34 | 1.72 | 0.51 | 0.47 | 0.72 | ||||
| FI-Sod | 2005–2008 | GPP | multi-site | 1.55 | 2.11 | 0.72 | 1.04 | 0.87 | 0.53 | 0.69 | |
| site-specific | 1.55 | 2.11 | 0.60 | 0.96 | 0.68 | 0.34 | 0.81 | ||||
| NEE | multi-site | −0.10 | 0.99 | 0.05 | 0.45 | 0.35 | 0.31 | 0.83 | |||
| site-specific | −0.10 | 0.99 | −0.11 | 0.23 | 0.35 | 0.22 | 0.88 | ||||
| Picea abies | DE-Tha | 2006–2010 | GPP | multi-site | 5.52 | 4.55 | 4.34 | 3.54 | 0.84 | 0.76 | 0.49 |
| site-specific | 5.52 | 4.55 | 5.12 | 4.03 | 0.80 | 0.79 | 0.45 | ||||
| NEE | multi-site | 1.71 | 2.41 | 1.66 | 2.16 | 0.68 | 0.68 | 0.57 | |||
| site-specific | 1.71 | 2.41 | 1.94 | 2.39 | 0.65 | 0.60 | 0.63 | ||||
| DE-Wet | 2006–2008 | GPP | multi-site | 4.68 | 3.99 | 4.05 | 3.74 | 0.78 | 0.75 | 0.50 | |
| site-specific | 4.68 | 3.99 | 4.13 | 3.63 | 0.79 | 0.77 | 0.48 | ||||
| NEE | multi-site | 0.38 | 2.61 | 1.26 | 2.04 | 0.48 | 0.36 | 0.80 | |||
| site-specific | 0.38 | 2.61 | 0.74 | 1.87 | 0.56 | 0.54 | 0.68 | ||||
| Fagus sylvatica | IT-Col | 2004–2007 | GPP | multi-site | 3.95 | 4.62 | 3.61 | 4.53 | 0.66 | 0.63 | 0.61 |
| site-specific | 3.95 | 4.62 | 3.28 | 4.15 | 0.66 | 0.63 | 0.60 | ||||
| NEE | multi-site | 1.57 | 3.40 | 1.02 | 2.59 | 0.54 | 0.51 | 0.70 | |||
| site-specific | 1.57 | 3.40 | 1.12 | 2.74 | 0.57 | 0.55 | 0.67 | ||||
| DK-Sor | 2005–2009 | GPP | multi-site | 5.01 | 5.23 | 3.47 | 4.17 | 0.84 | 0.74 | 0.51 | |
| site-specific | 5.01 | 5.23 | 4.36 | 5.31 | 0.85 | 0.83 | 0.42 | ||||
| NEE | multi-site | 0.68 | 3.18 | 1.07 | 2.38 | 0.72 | 0.69 | 0.56 | |||
| site-specific | 0.68 | 3.18 | 0.95 | 2.33 | 0.69 | 0.67 | 0.57 | ||||
| FR-Hes | 2006–2009 | GPP | multi-site | 4.97 | 5.48 | 3.91 | 4.19 | 0.82 | 0.77 | 0.48 | |
| site-specific | 4.97 | 5.48 | 5.17 | 6.03 | 0.87 | 0.84 | 0.40 | ||||
| NEE | multi-site | 1.40 | 3.49 | 1.30 | 2.40 | 0.69 | 0.67 | 0.57 | |||
| site-specific | 1.40 | 3.49 | 1.72 | 3.47 | 0.73 | 0.70 | 0.55 | ||||
| Tree Species | Site | Period | Calibration Type | Annual Mean CO2 Fluxes (kg C m−2 month−1) | Model | ||||||
|---|---|---|---|---|---|---|---|---|---|---|---|
| Measured | Simulated | ||||||||||
| Mean | STD. | Mean | STD. | r2 | ME | RMSPEn | |||||
| Pinus sylvestris | FI-Hyy | 2004–2009 | GPP | multi-site | 0.09 | 0.09 | 0.07 | 0.08 | 0.90 | 0.81 | 0.43 |
| site-specific | 0.09 | 0.09 | 0.07 | 0.08 | 0.94 | 0.87 | 0.36 | ||||
| NEE | multi-site | 0.02 | 0.05 | 0.01 | 0.03 | 0.65 | 0.53 | 0.68 | |||
| site-specific | 0.02 | 0.05 | 0.01 | 0.03 | 0.87 | 0.71 | 0.53 | ||||
| BE-Bra | 2006–2010 | GPP | multi-site | 0.11 | 0.09 | 0.10 | 0.08 | 0.93 | 0.91 | 0.30 | |
| site-specific | 0.11 | 0.09 | 0.09 | 0.07 | 0.95 | 0.86 | 0.37 | ||||
| NEE | multi-site | 0.01 | 0.06 | 0.03 | 0.04 | 0.89 | 0.66 | 0.58 | |||
| site-specific | 0.01 | 0.06 | 0.02 | 0.04 | 0.88 | 0.78 | 0.47 | ||||
| NL-Loo | 2006–2010 | GPP | multi-site | 0.13 | 0.09 | 0.10 | 0.09 | 0.84 | 0.72 | 0.52 | |
| site-specific | 0.13 | 0.09 | 0.13 | 0.10 | 0.80 | 0.76 | 0.49 | ||||
| NEE | multi-site | 0.04 | 0.04 | 0.03 | 0.04 | 0.69 | 0.62 | 0.61 | |||
| site-specific | 0.04 | 0.04 | 0.04 | 0.04 | 0.65 | 0.58 | 0.65 | ||||
| FI-Sod | 2005–2008 | GPP | multi-site | 0.05 | 0.06 | 0.02 | 0.03 | 0.96 | 0.54 | 0.67 | |
| site-specific | 0.05 | 0.06 | 0.02 | 0.03 | 0.73 | 0.35 | 0.80 | ||||
| NEE | multi-site | 0.00 | 0.02 | 0.00 | 0.01 | 0.44 | 0.38 | 0.78 | |||
| site-specific | 0.00 | 0.02 | 0.00 | 0.00 | 0.46 | 0.24 | 0.86 | ||||
| Picea abies | DE-Tha | 2006–2010 | GPP | multi-site | 0.17 | 0.13 | 0.13 | 0.10 | 0.96 | 0.82 | 0.42 |
| site-specific | 0.17 | 0.13 | 0.16 | 0.11 | 0.93 | 0.90 | 0.31 | ||||
| NEE | multi-site | 0.05 | 0.06 | 0.05 | 0.05 | 0.87 | 0.87 | 0.36 | |||
| site-specific | 0.05 | 0.06 | 0.06 | 0.05 | 0.82 | 0.80 | 0.45 | ||||
| DE-Wet | 2006–2008 | GPP | multi-site | 0.14 | 0.11 | 0.12 | 0.10 | 0.92 | 0.89 | 0.33 | |
| site-specific | 0.14 | 0.11 | 0.13 | 0.10 | 0.94 | 0.91 | 0.30 | ||||
| NEE | multi-site | 0.01 | 0.06 | 0.04 | 0.05 | 0.58 | 0.35 | 0.80 | |||
| site-specific | 0.01 | 0.06 | 0.02 | 0.03 | 0.83 | 0.70 | 0.55 | ||||
| Fagus sylvatica | IT-Col | 2004–2007 | GPP | multi-site | 0.12 | 0.13 | 0.11 | 0.13 | 0.82 | 0.81 | 0.43 |
| site-specific | 0.12 | 0.13 | 0.10 | 0.12 | 0.83 | 0.80 | 0.44 | ||||
| NEE | multi-site | 0.05 | 0.10 | 0.03 | 0.07 | 0.71 | 0.67 | 0.57 | |||
| site-specific | 0.05 | 0.10 | 0.03 | 0.08 | 0.75 | 0.72 | 0.52 | ||||
| DK-Sor | 2005–2009 | GPP | multi-site | 0.15 | 0.15 | 0.11 | 0.12 | 0.94 | 0.80 | 0.44 | |
| site-specific | 0.15 | 0.15 | 0.13 | 0.15 | 0.93 | 0.91 | 0.29 | ||||
| NEE | multi-site | 0.02 | 0.09 | 0.03 | 0.06 | 0.85 | 0.79 | 0.45 | |||
| site-specific | 0.02 | 0.09 | 0.03 | 0.06 | 0.86 | 0.80 | 0.45 | ||||
| FR-Hes | 2006–2009 | GPP | multi-site | 0.15 | 0.16 | 0.12 | 0.12 | 0.92 | 0.84 | 0.40 | |
| site-specific | 0.15 | 0.16 | 0.16 | 0.17 | 0.95 | 0.94 | 0.23 | ||||
| NEE | multi-site | 0.04 | 0.10 | 0.04 | 0.07 | 0.85 | 0.79 | 0.45 | |||
| site-specific | 0.04 | 0.10 | 0.05 | 0.09 | 0.86 | 0.84 | 0.39 | ||||

4. Discussion
4.1. Site-Specific versus Multi-Site (Species-Specific) Parametrization


4.2. Gross Primary Production and Respiration
4.3. Net Ecosystem Exchange
4.4. Uncertainties of Model Process Implementation and Measurements
5. Conclusions
Acknowledgments
Author Contributions
Conflicts of Interest
References
- Pan, Y.; Birdsey, R.A.; Fang, J.; Houghton, R.; Kauppi, P.E.; Kurz, W.A.; Phillips, O.L.; Shvidenko, A.; Lewis, S.L.; Canadell, J.G.; et al. A Large and Persistent Carbon Sink in the World’s Forests. Science 2011, 333, 988–993. [Google Scholar] [CrossRef] [PubMed]
- Fernandez-Martinez, M.; Vicca, S.; Janssens, I.A.; Sardans, J.; Luyssaert, S.; Campioli, M.; Chapin, F.S., III; Ciais, P.; Malhi, Y.; Obersteiner, M.; et al. Nutrient availability as the key regulator of global forest carbon balance. Nat. Clim. Chang. 2014, 4, 471–476. [Google Scholar] [CrossRef]
- Whitehead, D. Forests as carbon sinks—Benefits and consequences. Tree Physiol. 2011, 31, 893–902. [Google Scholar] [CrossRef] [PubMed]
- Baldocchi, D.; Falge, E.; Gu, L.; Olson, R.; Hollinger, D.; Running, S.; Anthoni, P.; Bernhofer, C.; Davis, K.; Evans, R.; et al. FLUXNET: A New Tool to Study the Temporal and Spatial Variability of Ecosystem–Scale Carbon Dioxide, Water Vapor, and Energy Flux Densities. Bull. Am. Meteorol. Soc. 2001, 82, 2415–2434. [Google Scholar] [CrossRef]
- Gustafson, E. When relationships estimated in the past cannot be used to predict the future: Using mechanistic models to predict landscape ecological dynamics in a changing world. Landsc. Ecol. 2013, 28, 1429–1437. [Google Scholar] [CrossRef]
- Wißkirchen, K.; Tum, M.; Günther, K.P.; Niklaus, M.; Eisfelder, C.; Knorr, W. Quantifying the carbon uptake by vegetation for Europe on a 1 km2 resolution using a remote sensing driven vegetation model. Geosci. Model Dev. 2013, 6, 1623–1640. [Google Scholar] [CrossRef]
- Aber, J.; Neilson, R.P.; McNulty, S.; Lenihan, J.M.; Bachelet, D.; Drapek, R.J. Forest processes and global environmental change: Predicting the effects of individual and multiple stressors. Bioscience 2001, 51, 735–751. [Google Scholar] [CrossRef]
- Agren, G.I.; McMurtrie, R.E.; Parton, W.J.; Pastor, J.; Shugart, H.H. State of the Art of models of production decomposition linkages in conifer and grassland ecosystems. Ecol. Appl. 1991, 1, 118–138. [Google Scholar] [CrossRef]
- Landsberg, J. Modelling forest ecosystems: State of the art, challenges, and future directions. Can. J. For. Res. 2003, 33, 385–397. [Google Scholar] [CrossRef]
- Mäkelä, A.; Landsberg, J.; Ek, A.R.; Burk, T.E.; Ter-Mikaelian, M.; Agren, G.I.; Oliver, C.D.; Puttonen, P. Process-based models for forest ecosystem management: Current state of the art and challenges for practical implementation. Tree Physiol. 2000, 20, 289–298. [Google Scholar] [CrossRef] [PubMed]
- Mäkelä, A. Process-based modelling of tree and stand growth: Towards a hierarchical treatment of multiscale processes. Can. J. For. Res. 2003, 33, 398–409. [Google Scholar] [CrossRef]
- Kramer, K.; Leinonen, I.; Bartelink, H.H.; Berbigier, P.; Borghetti, M.; Bernhofer, C.; Cienciala, E.; Dolman, A.J.; Froer, O.; Gracia, C.A.; et al. Evaluation of six process-based forest growth models using eddy-covariance measurements of CO2 and H2O fluxes at six forest sites in Europe. Glob. Chang. Biol. 2002, 8, 213–230. [Google Scholar] [CrossRef]
- Dufrêne, E.; Davi, H.; François, C.; Maire, G.L.; Dantec, V.L.; Granier, A. Modelling carbon and water cycles in a beech forest. Part I: Model description and uncertainty analysis on modelled NEE. Ecol. Model. 2005, 185, 407–436. [Google Scholar] [CrossRef]
- Krinner, G.; Viovy, N.; de Noblet-Ducoudré, N.; Ogée, J.; Polcher, J.; Friedlingstein, P.; Ciais, P.; Sitch, S.; Prentice, I.C. A dynamic global vegetation model for studies of the coupled atmosphere-biosphere system. Glob. Biogeochem. Cycles 2005, 19. [Google Scholar] [CrossRef]
- Jansson, P.E.; Svensson, M.; Kleja, D.; Gustafsson, D. Simulated climate change impacts on fluxes of carbon in Norway spruce ecosystems along a climatic transect in Sweden. Biogeochemistry 2008, 89, 81–94. [Google Scholar] [CrossRef]
- Medlyn, B.E.; Berbigier, P.; Clement, R.; Grelle, A.; Loustau, D.; Linder, S.; Wingate, L.; Jarvis, P.G.; Sigurdsson, B.D.; McMurtrie, R.E.; et al. Carbon balance of coniferous forests growing in contrasting climates: Model-based analysis. Agric. For. Meteorol. 2005, 131, 97–124. [Google Scholar] [CrossRef]
- Vargas, R.; Sonnentag, O.; Abramowitz, G.; Carrara, A.; Chen, J.; Ciais, P.; Correia, A.; Keenan, T.; Kobayashi, H.; Ourcival, J.M.; et al. Drought Influences the Accuracy of Simulated Ecosystem Fluxes: A Model-Data Meta-analysis for Mediterranean Oak Woodlands. Ecosystems 2013, 16, 749–764. [Google Scholar] [CrossRef]
- Medlyn, B.E.; Robinson, A.P.; Clement, R.; McMurtrie, R.E. On the validation of models of forest CO2 exchange using eddy covariance data: Some perils and pitfalls. Tree Physiol. 2005, 25, 839–857. [Google Scholar] [CrossRef] [PubMed]
- Chen, M.; Zhuang, Q. Spatially Explicit Parameterization of a Terrestrial Ecosystem Model and Its Application to the Quantification of Carbon Dynamics of Forest Ecosystems in the Conterminous United States. Earth Interact. 2012, 16, 1–22. [Google Scholar] [CrossRef]
- Evans, L.M.; Slavov, G.T.; Rodgers-Melnick, E.; Martin, J.; Ranjan, P.; Muchero, W.; Brunner, A.M.; Schackwitz, W.; Gunter, L.; Chen, J.G.; et al. Population genomics of Populus trichocarpa identifies signatures of selection and adaptive trait associations. Nat. Genet. 2014, 46, 1089–1096. [Google Scholar] [CrossRef] [PubMed]
- Soolanayakanahally, R.Y.; Guy, R.D.; Silim, S.N.; Drewes, E.C.; Schroeder, W.R. Enhanced assimilation rate and water use efficiency with latitude through increased photosynthetic capacity and internal conductance in balsam poplar (Populus balsamifera L.). Plant Cell Environ. 2009, 32, 1821–1832. [Google Scholar] [CrossRef] [PubMed]
- Palmroth, S.; Berninger, F.; Nikinmaa, E.; Lloyd, J.; Pulkkinen, P.; Hari, P. Structural adaptation rather than water conservation was observed in Scots pine over a range of wet to dry climates. Oecologia 1999, 121, 302–309. [Google Scholar] [CrossRef]
- Oleksyn, J.; Modrzýnski, J.; Tjoelker, M.G.; Z·ytkowiak, R.; Reich, P.B.; Karolewski, P. Growth and physiology of Picea abies populations from elevational transects: Common garden evidence for altitudinal ecotypes and cold adaptation. Funct. Ecol. 1998, 12, 573–590. [Google Scholar] [CrossRef]
- Peuke, A.D.; Schraml, C.; Hartung, W.; Rennenberg, H. Identification of drought-sensitive beech ecotypes by physiological parameters. New Phytol. 2002, 154, 373–387. [Google Scholar] [CrossRef]
- Gunderson, C.A.; Norby, R.J.; Wullschleger, S.D. Acclimation of photosynthesis and respiration to simulated climatic warming in northern and southern populations of Acer saccharum: Laboratory and field evidence. Tree Physiol. 2000, 20, 87–96. [Google Scholar] [CrossRef] [PubMed]
- Eysteinsson, T.; Karlman, L.; Fries, A.; Martinsson, O.; Skúlason, B. Variation in spring and autumn frost tolerance among provenances of Russian larches (Larix Mill.). Scand. J. For. Res. 2009, 24, 100–110. [Google Scholar] [CrossRef]
- Haas, E.; Klatt, S.; Fröhlich, A.; Kraft, P.; Werner, C.; Kiese, R.; Grote, R.; Breuer, L.; Butterbach-Bahl, K. LandscapeDNDC: A process model for simulation of biosphere-atmosphere-hydrosphere exchange processes at site and regional scale. Landsc. Ecol. 2013, 28, 615–636. [Google Scholar] [CrossRef]
- Tröltzsch, K.; van Brusselen, J.; Schuck, A. Spatial occurrence of major tree species groups in Europe derived from multiple data sources. For. Ecol. Manag. 2009, 257, 294–302. [Google Scholar] [CrossRef]
- Brus, D.; Hengeveld, G.; Walvoort, D.; Goedhart, P.; Heidema, A.; Nabuurs, G.; Gunia, K. Statistical mapping of tree species over Europe. Eur. J. For. Res. 2012, 131, 145–157. [Google Scholar] [CrossRef]
- Nabuurs, G.J.; Schelhaas, M.J. Carbon profiles of typical forest types across Europe assessed with CO2FIX. Ecol. Indic. 2002, 1, 213–223. [Google Scholar] [CrossRef]
- Gallaun, H.; Zanchi, G.; Nabuurs, G.J.; Hengeveld, G.; Schardt, M.; Verkerk, P.J. EU-wide maps of growing stock and above-ground biomass in forests based on remote sensing and field measurements. For. Ecol. Manag. 2010, 260, 252–261. [Google Scholar] [CrossRef]
- Aber, J.D.; Ollinger, S.V.; Federer, C.A.; Reich, P.B.; Goulden, M.L.; Kicklighter, D.W.; Melillo, J.M.; Lathrop, R.G. Predicting the effects of climate change on water yield and forest production in the northeastern United States. Clim. Res. 1995, 5, 207–222. [Google Scholar] [CrossRef]
- Li, C.S.; Frolking, S.; Frolking, T.A. A model of nitrous-oxide evolution from soil driven by rainfall events .1. Model structure and sensitivity. J. Geophys. Res. Atmos. 1992, 97, 9759–9776. [Google Scholar] [CrossRef]
- Li, C.S.; Aber, J.; Stange, F.; Butterbach-Bahl, K.; Papen, H. A process-oriented model of N2O and NO emissions from forest soils: 1. Model development. J. Geophys. Res. Atmos. 2000, 105, 4369–4384. [Google Scholar] [CrossRef]
- Aber, J.D.; Reich, P.B.; Goulden, M.L. Extrapolating leaf CO2 exchange to the canopy: A generalized model of forest photosynthesis compared with measurements by eddy correlation. Oecologia 1996, 106, 257–265. [Google Scholar] [CrossRef]
- Grote, R.; Korhonen, J.; Mammarella, I. Challenges for evaluating process-based models of gas exchange at forest sites with fetches of various species. For. Syst. 2011, 20, 389–406. [Google Scholar]
- Grote, R.; Lehmann, E.; Brümmer, C.; Brüggemann, N.; Szarzynski, J.; Kunstmann, H. Modelling and observation of biosphere-atmosphere interactions in natural savannah in Burkina Faso, West Africa. Phys. Chem. Earth 2009, 34, 251–260. [Google Scholar] [CrossRef]
- Holst, J.; Grote, R.; Offermann, C.; Ferrio, J.P.; Gessler, A.; Mayer, H.; Rennenberg, H. Water fluxes within beech stands in complex terrain. Int. J. Biometeorol. 2010, 54, 23–36. [Google Scholar] [CrossRef] [PubMed]
- Cameron, D.R.; van Oijen, M.; Werner, C.; Butterbach-Bahl, K.; Haas, E.; Heuvelink, G.B.M.; Grote, R.; Kiese, R.; Kuhnert, M.; Kros, J.; et al. Environmental change impacts on the C- and N-cycle of European forests: A model comparison study. Biogeosci. Discuss. 2012, 9, 11041–11101. [Google Scholar] [CrossRef]
- Kiese, R.; Heinzeller, C.; Werner, C.; Wochele, S.; Grote, R.; Butterbach-Bahl, K. Quantification of nitrate leaching from German forest ecosystems by use of a process oriented biogeochemical model. Environ. Pollut. 2011, 159, 3204–3214. [Google Scholar] [CrossRef] [PubMed]
- Grote, R.; Kiese, R.; Gruenwald, T.; Ourcival, J.M.; Granier, A. Modelling forest carbon balances considering tree mortality and removal. Agric. For. Meteorol. 2011, 151, 644–644. [Google Scholar] [CrossRef]
- European Fluxes Database. Available online: http://gaia.agraria.unitus.it/ (accessed on 24 March 2015).
- Rahn, K.H.; Werner, C.; Kiese, R.; Haas, E.; Butterbach-Bahl, K. Parameter-induced uncertainty quantification of soil N2O, NO and CO2 emission from Höglwald spruce forest (Germany) using the LandscapeDNDC model. Biogeosciences 2012, 9, 3983–3998. [Google Scholar] [CrossRef]
- Engeland, K.; Renard, B.; Steinsland, I.; Kolberg, S. Evaluation of statistical models for forecast errors from the HBV model. J. Hydrol. 2010, 384, 142–155. [Google Scholar] [CrossRef]
- Ritter, A.; Muñoz-Carpena, R. Performance evaluation of hydrological models: Statistical significance for reducing subjectivity in goodness-of-fit assessments. J. Hydrol. 2013, 480, 33–45. [Google Scholar] [CrossRef]
- Markkanen, T.; Rannik, U.; Keronen, P.; Suni, T.; Vesala, T. Eddy covariance fluxes over a boreal Scots pine forest. Boreal Environ. Res. 2001, 6, 65–78. [Google Scholar]
- Kahkonen, M.A.; Wittmann, C.; Ilvesniemi, H.; Westman, C.J.; Salkinoja-Salonen, M.S. Mineralization of detritus and oxidation of methane in acid boreal coniferous forest soils: Seasonal and vertical distribution and effects of clear-cut. Soil Biol. Biochem. 2002, 34, 1191–1200. [Google Scholar] [CrossRef]
- Curiel Yuste, J.; Konopka, B.; Janssens, I.A.; Coenen, K.; Xiao, C.W.; Ceulemans, R. Contrasting net primary productivity and carbon distribution between neighboring stands of Quercus robur and Pinus sylvestris. Tree Physiol. 2005, 25, 701–712. [Google Scholar] [CrossRef] [PubMed]
- Gielen, B.; Neirynck, J.; Luyssaert, S.; Janssens, I.A. The importance of dissolved organic carbon fluxes for the carbon balance of a temperate Scots pine forest. Agric. For. Meteorol. 2011, 151, 270–278. [Google Scholar] [CrossRef]
- Verhoef, H.A.; Dorel, F.G.; Zoomer, H.R. Effects of nitrogen deposition on animal-mediated nitrogen mobilization in coniferous litter. Biol. Fertil. Soils 1989, 8, 255–259. [Google Scholar] [CrossRef]
- Dolman, A.J.; Moors, E.J.; Elbers, J.A. The carbon uptake of a mid latitude pine forest growing on sandy soil. Agric. For. Meteorol. 2002, 111, 157–170. [Google Scholar] [CrossRef]
- Rey, A.; Pegoraro, E.; Jarvis, P.G. Carbon mineralization rates at different soil depths across a network of European forest sites (FORCAST). Eur. J. Soil Sci. 2008, 59, 1049–1062. [Google Scholar] [CrossRef]
- Cummins, T.; Beier, C.; Blanck, K.; Visser, P.H.B.; Farrell, E.P.; Rasmussen, L.; Kreutzer, K.; Weis, W.; Bredemeier, M.; Lamersdorf, N.; et al. The exman project—Biogeochemical fluxes in plantation forests on acid soils. Water Air Soil Pollut. 1995, 85, 1653–1658. [Google Scholar] [CrossRef]
- Kreutzer, K.; Weiss, T. The Höglwald field experiments—Aims, concept and basic data. Plant Soil 1998, 199, 1–10. [Google Scholar] [CrossRef]
- Butterbach-Bahl, K.; Gasche, R.; Willibald, G.; Papen, H. Exchange of N-gases at the Höglwald Forest—A summary. Plant Soil 2002, 240, 117–123. [Google Scholar] [CrossRef]
- Weis, W.; Baier, R.; Huber, C.; Göttlein, A. Long Term Effects of Acid Irrigation at the Höglwald on Seepage Water Chemistry and Nutrient Cycling. Water Air Soil Pollut. Focus 2007, 7, 211–223. [Google Scholar] [CrossRef]
- Grünwald, T.; Bernhofer, C. A decade of carbon, water and energy flux measurements of an old spruce forest at the Anchor Station Tharandt. Tellus Ser. B Chem. Phys. Meteorol. 2007, 59, 387–396. [Google Scholar] [CrossRef]
- Wutzler, T.; Koestner, B.; Bernhofer, C. Spatially explicit assessment of carbon stocks of a managed forest area in eastern Germany. Eur. J. For. Res. 2007, 126, 371–383. [Google Scholar] [CrossRef]
- Moderow, U.; Aubinet, M.; Feigenwinter, C.; Kolle, O.; Lindroth, A.; Molder, M.; Montagnani, L.; Rebmann, C.; Bernhofer, C. Available energy and energy balance closure at four coniferous forest sites across Europe. Theor. Appl. Climatol. 2009, 98, 397–412. [Google Scholar] [CrossRef]
- Anthoni, P.M.; Knohl, A.; Rebmann, C.; Freibauer, A.; Mund, M.; Ziegler, W.; Kolle, O.; Schulze, E.D. Forest and agricultural land-use-dependent CO2 exchange in Thuringia, Germany. Glob. Chang. Biol. 2004, 10, 2005–2019. [Google Scholar] [CrossRef]
- Rodeghiero, M.; Cescatti, A. Main determinants of forest soil respiration along an elevation/temperature gradient in the Italian Alps. Glob. Chang. Biol. 2005, 11, 1024–1041. [Google Scholar] [CrossRef]
- Epron, D.; le Dantec, V.; Dufrene, E.; Granier, A. Seasonal dynamics of soil carbon dioxide efflux and simulated rhizosphere respiration in a beech forest. Tree Physiol. 2001, 21, 145–152. [Google Scholar] [CrossRef] [PubMed]
- Granier, A.; Pilegaard, K.; Jensen, N.O. Similar net ecosystem exchange of beech stands located in France and Denmark. Agric. For. Meteorol. 2002, 114, 75–82. [Google Scholar] [CrossRef]
- Pilegaard, K.; Mikkelsen, T.N.; Beier, C.; Jensen, N.O.; Ambus, P.; Ro-Poulsen, H. Field measurements of atmosphere-biosphere interactions in a Danish beech forest. Boreal Environ. Res. 2003, 8, 315–333. [Google Scholar]
- Persson, T.; Karlsson, P.S.; Seyferth, U.; Sjoberg, R.M.; Rudebeck, A. Carbon mineralisation in European forest soils. Ecol. Stud. 2000, 142, 257–275. [Google Scholar]
- Aber, J.D.; Federer, C.A. A generalized, lumped-parameter model of photosynthesis, evapotranspiration and net primary production in temperate and boreal forest ecosystems. Oecologia 1992, 92, 463–474. [Google Scholar] [CrossRef]
- Hoffmann, F. FAGUS, a model for growth and development of beech. Ecol. Model. 1995, 83, 327–348. [Google Scholar] [CrossRef]
- Cutini, A. Litterfall and Leaf Area Index in the CONECOFOR Permanent Monitoring Plots. J. Limnol. 2002, 61, 62–68. [Google Scholar] [CrossRef]
- Leuschner, C.; Voß, S.; Foetzki, A.; Clases, Y. Variation in leaf area index and stand leaf mass of European beech across gradients of soil acidity and precipitation. Plant Ecol. 2006, 182, 247–258. [Google Scholar] [CrossRef]
- Mund, M.; Kummetz, E.; Hein, M.; Bauer, G.A.; Schulze, E.D. Growth and carbon stocks of a spruce forest chronosequence in central Europe. For. Ecol. Manag. 2002, 171, 275–296. [Google Scholar] [CrossRef]
- Kuuluvainen, T. Long-term development of needle mass, radiation interception and stemwood production in naturally regenerated Pinus-sylvestris stands on empetrum-vaccinium site type in the northern boreal zone in Finland—An analysis based on an empirical-study and simulation. For. Ecol. Manag. 1991, 46, 103–122. [Google Scholar]
- Xiao, C.W.; Yuste, J.C.; Janssens, I.A.; Roskams, P.; Nachtergale, L.; Carrara, A.; Sanchez, B.Y.; Ceulemans, R. Above- and belowground biomass and net primary production in a 73-year-old Scots pine forest. Tree Physiol. 2003, 23, 505–516. [Google Scholar] [CrossRef] [PubMed]
- Damesin, C.; Ceschia, E.; le Goff, N.; Ottorini, J.M.; Dufrene, E. Stem and branch respiration of beech: From tree measurements to estimations at the stand level. New Phytol. 2002, 153, 159–172. [Google Scholar] [CrossRef]
- Davi, H.; Bouriaud, O.; Dufrêne, E.; Soudani, K.; Pontailler, J.Y.; le Maire, G.; François, C.; Bréda, N.; Granier, A.; le Dantec, V.; et al. Effect of aggregating spatial parameters on modelling forest carbon and water fluxes. Agric. For. Meteorol. 2006, 139, 269–287. [Google Scholar] [CrossRef]
- Kurbatova, J.; Li, C.; Varlagin, A.; Xiao, X.; Vygodskaya, N. Modeling carbon dynamics in two adjacent spruce forests with different soil conditions in Russia. Biogeosciences 2008, 5, 969–980. [Google Scholar] [CrossRef]
- Bergh, J.; Freeman, M.; Sigurdsson, B.; Kellomäki, S.; Laitinen, K.; Niinistö, S.; Peltola, H.; Linder, S. Modelling the short-term effects of climate change on the productivity of selected tree species in Nordic countries. For. Ecol. Manag. 2003, 183, 327–340. [Google Scholar] [CrossRef]
- Mäkelä, A.; Kolari, P.; Karimaki, J.; Nikinmaa, E.; Peramaki, M.; Hari, P. Modelling five years of weather-driven variation of GPP in a boreal forest. Agric. For. Meteorol. 2006, 139, 382–398. [Google Scholar] [CrossRef]
- Mäkelä, H.; Pekkarinen, A. Estimation of forest stand volumes by Landsat TM imagery and stand-level field-inventory data. For. Ecol. Manag. 2004, 196, 245–255. [Google Scholar] [CrossRef]
- Kattge, J.; Knorr, W.; Raddatz, T.; Wirth, C. Quantifying photosynthetic capacity and its relationship to leaf nitrogen content for global-scale terrestrial biosphere models. Glob. Chang. Biol. 2009, 15, 976–991. [Google Scholar] [CrossRef]
- Postek, K.M.; Driscoll, C.T.; Aber, J.D.; Santore, R.C. Application of PnET-CN/CHESS to a spruce stand in solling, Germany. Ecol. Model. 1995, 83, 163–172. [Google Scholar] [CrossRef]
- Roberntz, P.; Stockfors, J. Effects of elevated CO2 concentration and nutrition on net photosynthesis, stomatal conductance and needle respiration of field-grown Norway spruce trees. Tree Physiol. 1998, 18, 233–241. [Google Scholar] [CrossRef] [PubMed]
- Gessler, A.; Schneider, S.; von Sengbusch, D.; Weber, P.; Hanemann, U.; Huber, C.; Rothe, A.; Kreutzer, K.; Rennenberg, H. Field and laboratory experiments on net uptake of nitrate and ammonium by the roots of spruce (Picea abies) and beech (Fagus sylvatica) trees. New Phytol. 1998, 138, 275–285. [Google Scholar] [CrossRef]
- Templer, P.; Lovett, G.; Weathers, K.; Findlay, S.; Dawson, T.E. Influence of Tree Species on Forest Nitrogen Retention in the Catskill Mountains, New York, USA. Ecosystems 2005, 8, 1–16. [Google Scholar] [CrossRef]
- Berger, T.W.; Untersteiner, H.; Toplitzer, M.; Neubauer, C. Nutrient fluxes in pure and mixed stands of spruce (Picea abies) and beech (Fagus sylvatica). Plant Soil 2009, 322, 317–342. [Google Scholar] [CrossRef]
- Bossel, H.; Schafer, H. Generic simulation-model of forest growth, carbon and nitrogen dynamics, and application to tropical acacia and european spruce. Ecol. Model. 1989, 48, 221–265. [Google Scholar] [CrossRef]
- Berninger, F. Effects of drought and phenology on GPP in Pinus sylvestris: A simulation study along a geographical gradient. Funct. Ecol. 1997, 11, 33–42. [Google Scholar] [CrossRef]
- Escudero, A.; Mediavilla, S. Decline in photosynthetic nitrogen use efficiency with leaf age and nitrogen resorption as determinants of leaf life span. J. Ecol. 2003, 91, 880–889. [Google Scholar] [CrossRef]
- Aranda, I.; Pardo, F.; Gil, L.; Pardos, J.A. Anatomical basis of the change in leaf mass per area and nitrogen investment with relative irradiance within the canopy of eight temperate tree species. Acta Oecol. 2004, 25, 187–195. [Google Scholar] [CrossRef]
- Sariyildiz, T.; Anderson, J.M. Variation in the chemical composition of green leaves and leaf litters from three deciduous tree species growing on different soil types. For. Ecol. Manag. 2005, 210, 303–319. [Google Scholar] [CrossRef]
- Thimonier, A.; Graf Pannatier, E.; Schmitt, M.; Waldner, P.; Walthert, L.; Schleppi, P.; Dobbertin, M.; Kräuchi, N. Does exceeding the critical loads for nitrogen alter nitrate leaching, the nutrient status of trees and their crown condition at Swiss Long-term Forest Ecosystem Research (LWF) sites? Eur. J. For. Res. 2010, 129, 443–461. [Google Scholar] [CrossRef]
- Alriksson, A.; Eriksson, H.M. Variations in mineral nutrient and C distribution in the soil and vegetation compartments of five temperate tree species in NE Sweden. For. Ecol. Manag. 1998, 108, 261–273. [Google Scholar] [CrossRef]
- Meir, P.; Kruijt, B.; Broadmeadow, M.; Barbosa, E.; Kull, O.; Carswell, F.; Nobre, A.; Jarvis, P.G. Acclimation of photosynthetic capacity to irradiance in tree canopies in relation to leaf nitrogen concentration and leaf mass per unit area. Plant Cell Environ. 2002, 25, 343–357. [Google Scholar] [CrossRef]
- Fischer, R.; Lorenz, M.; De Vries, W. Waldzustandserfassung in Europa. Allg. Forstz. 2000, 25, 1367–1370. [Google Scholar]
- Wang, Q.; Tenhunen, J.; Falge, E.; Bernhofer, C.; Granier, A.; Vesala, T. Simulation and scaling of temporal variation in gross primary production for coniferous and deciduous temperate forests. Glob. Chang. Biol. 2003, 10, 37–51. [Google Scholar] [CrossRef]
- Jacobsen, J.B.; Thorsen, B.J. A Danish example of optimal thinning strategies in mixed-species forest under changing growth conditions caused by climate change. For. Ecol. Manag. 2003, 180, 375–388. [Google Scholar] [CrossRef]
- Högberg, P.; Högbom, L.; Schinkel, H. Nitrogen-related root variables of trees along an N-deposition gradient in Europe. Tree Physiol. 1998, 18, 823–828. [Google Scholar] [CrossRef] [PubMed]
- Widen, B.; Majdi, H. Soil CO2 efflux and root respiration at three sites in a mixed pine and spruce forest: Seasonal and diurnal variation. Can. J. For. Res. 2001, 31, 786–796. [Google Scholar] [CrossRef]
- Brunner, I.; Brodbeck, S.; Walthert, L. Fine root chemistry, starch concentration and “vitality” of subalpine conifer forests in relation to soil pH. For. Ecol. Manag. 2002, 165, 75–84. [Google Scholar] [CrossRef]
- Ceschia, É.; Damesin, C.; Lebaube, S.; Pontailler, J.Y.; Dufrêne, É. Spatial and seasonal variations in stem respiration of beech trees (Fagus sylvatica). Ann. For. Sci. 2002, 59, 801–812. [Google Scholar] [CrossRef]
- Ukonmaanaho, L.; Merilä, P.; Nöjd, P.; Nieminen, T.M. Litterfall production and nutrient return to the forest floor in Scot pine and Norway spruce atands in Finland. Boreal Environ. Res. 2008, 13, 67–91. [Google Scholar]
- Andersson, P.; Berggren, D.; Nilsson, I. Indices for nitrogen status and nitrate leaching from Norway spruce (Picea abies (L.) Karst.) stands in Sweden. For. Ecol. Manag. 2002, 157, 39–53. [Google Scholar] [CrossRef]
- Irvine, J.; Perks, M.P.; Magnani, F.; Grace, J. The response of Pinus sylvestris to drought: Stomatal control of transpiration and hydraulic conductance. Tree Physiol. 1998, 18, 393–402. [Google Scholar] [CrossRef] [PubMed]
- Schmitt, U.; Jalkanen, R.; Eckstein, D. Cambium dynamics of Pinus sylvestris and Betula spp. in the northern boreal forest in Finland. Silva Fenn. 2004, 38, 167–178. [Google Scholar] [CrossRef]
- Mediavilla, S.; Escudero, A. Relative growth rate of leaf biomass and leaf nitrogen content in several mediterranean woody species. Plant Ecol. 2003, 168, 321–332. [Google Scholar] [CrossRef]
- Bergh, J.; McMurtrie, R.E.; Linder, S. Climatic factors controlling the productivity of Norway spruce: A model-based analysis. For. Ecol. Manag. 1998, 110, 127–139. [Google Scholar] [CrossRef]
- Davi, H.; Dufrêne, E.; Granier, A.; le Dantec, V.; Barbaroux, C.; François, C.; Bréda, N. Modelling carbon and water cycles in a beech forest. Part II: Validation of the main processes from organ to stand scale. Ecol. Model. 2005, 185, 387–405. [Google Scholar] [CrossRef]
- Granier, A.; Ceschia, E.; Damesin, C.; Dufrêne, E.; Epron, D.; Gross, P.; Lebaube, S.; le Dantec, V.; le Goff, N.; Lemoine, D.; et al. The carbon balance of a young Beech forest. Funct. Ecol. 2000, 14, 312–325. [Google Scholar] [CrossRef]
- Pietsch, S.A.; Hasenauer, H.; Thornton, P.E. BGC-Model parameters for tree species growing in central European forests. For. Ecol. Manag. 2005, 211, 264–295. [Google Scholar] [CrossRef]
- Sampson, D.A.; Waring, R.H.; Maier, C.A.; Gough, C.M.; Ducey, M.J.; Johnsen, K.H. Fertilization effects on forest carbon storage and exchange, and net primary production: A new hybrid process model tor stand management. For. Ecol. Manag. 2006, 221, 91–109. [Google Scholar] [CrossRef]
- Havranek, W.M.; Benecke, U. Influence of soil-moisture on water potential, transpiration and photosynthesis of conifer seedlings. Plant Soil 1978, 49, 91–103. [Google Scholar] [CrossRef]
- Maseyk, K.S.; Lin, T.; Rotenberg, E.; Gruenzweig, J.M.; Schwartz, A.; Yakir, D. Physiology-phenology interactions in a productive semi-arid pine forest. New Phytol. 2008, 178, 603–616. [Google Scholar] [CrossRef] [PubMed]
- Rötzer, T.; Liao, Y.; Goergen, K.; Schüller, G.; Pretzsch, H. Modelling the impact of climate change on the productivity and water-use efficiency of a central European beech forest. Clim. Res. 2013, 58, 81–95. [Google Scholar] [CrossRef]
- Cienciala, E.; Running, S.W.; Lindroth, A.; Grelle, A.; Ryan, M.G. Analysis of carbon and water fluxes from the NOPEX boreal forest: Comparison of measurements with FOREST-BGC simulations. J. Hydrol. 1998, 212, 62–78. [Google Scholar] [CrossRef]
- Thum, T.; Aalto, T.; Laurila, T.; Aurela, M.; Kolari, P.; Hari, P. Parametrization of two photosynthesis models at the canopy scale in a northern boreal Scots pine forest. Tellus Ser. B Chem. Phys. Meteorol. 2007, 59, 874–890. [Google Scholar] [CrossRef]
- Wang, K.Y.; Kellomäki, S.; Li, C.; Zha, T. Light and Water-use Efficiencies of Pine Shoots Exposed to Elevated Carbon Dioxide and Temperature. Ann. Bot. 2003, 92, 53–64. [Google Scholar] [CrossRef] [PubMed]
- Gornall, J.L.; Guy, R.D. Geographic variation in ecophysiological traits of black cottonwood (Populus trichocarpa). Can. J. Bot. 2007, 85, 1202–1213. [Google Scholar] [CrossRef]
- Fonti, P.; Heller, O.; Cherubini, P.; Rigling, A.; Arend, M. Wood anatomical responses of oak saplings exposed to air warming and soil drought. Plant Biol. 2013, 1, 210–219. [Google Scholar] [CrossRef] [PubMed]
- Bravo, L.A.; Saavedra-Mella, F.A.; Vera, F.; Guerra, A.; Cavieres, L.A.; Ivanov, A.G.; Huner, N.P.A.; Corcuera, L.J. Effect of cold acclimation on the photosynthetic performance of two ecotypes of Colobanthus quitensis (Kunth) Bartl. J. Exp. Bot. 2007, 58, 3581–3590. [Google Scholar] [CrossRef] [PubMed]
- Reich, P.B.; Rich, R.L.; Lu, X.; Wang, Y.-P.; Oleksyn, J. Biogeographic variation in evergreen conifer needle longevity and impacts on boreal forest carbon cycle projections. Proc. Natl. Acad. Sci. USA 2014, 111, 13703–13708. [Google Scholar] [CrossRef] [PubMed]
- Sendall, K.M.; Reich, P.B.; Zhao, C.; Jihua, H.; Wei, X.; Stefanski, A.; Rice, K.; Rich, R.L.; Montgomery, R.A. Acclimation of photosynthetic temperature optima of temperate and boreal tree species in response to experimental forest warming. Glob. Chang. Biol. 2015, 21, 1342–1357. [Google Scholar] [CrossRef] [PubMed]
- Kim, Y.; Roulet, N.; Peng, C.; Li, C.; Frolking, S.; Strachan, L.B.; Tremblay, A. Multi-Year carbon dioxide flux simulations for mature Canadian black spruce forests and ombrotrophic bogs using Forest-DnDc. Boreal Environ. Res. 2014, 19, 417–440. [Google Scholar]
- Yuan, F.; Arain, M.A.; Barr, A.G.; Black, T.A.; Bourque, C.P.A.; Coursolle, C.; Margolis, H.A.; McCaughey, J.H.; Wofsy, S.C. Modeling analysis of primary controls on net ecosystem productivity of seven boreal and temperate coniferous forests across a continental transect. Glob. Chang. Biol. 2008, 14, 1765–1784. [Google Scholar] [CrossRef]
- Wu, J.; Larsen, K.S.; van der Linden, L.; Beier, C.; Pilegaard, K.; Ibrom, A. Synthesis on the carbon budget and cycling in a Danish, temperate deciduous forest. Agric. For. Meteorol. 2013, 181, 94–107. [Google Scholar] [CrossRef]
- Richardson, A.D.; Anderson, R.S.; Arain, M.A.; Barr, A.G.; Bohrer, G.; Chen, G.; Chen, J.M.; Ciais, P.; Davis, K.J.; Desai, A.R.; et al. Terrestrial biosphere models need better representation of vegetation phenology: Results from the North American Carbon Program Site Synthesis. Glob. Chang. Biol. 2012, 18, 566–584. [Google Scholar] [CrossRef]
- Wohlfahrt, G.; Bahn, M.; Haslwanter, A.; Newesely, C.; Cernusca, A. Estimation of daytime ecosystem respiration to determine gross primary production of a mountain meadow. Agric. For. Meteorol. 2005, 130, 13–25. [Google Scholar] [CrossRef]
- Lavigne, M.B.; Ryan, M.G.; Anderson, D.E.; Baldocchi, D.D.; Crill, P.M.; Fitzjarrald, D.R.; Goulden, M.L.; Gower, S.T.; Massheder, J.M.; McCaughey, J.H.; et al. Comparing nocturnal eddy covariance measurements to estimates of ecosystem respiration made by scaling chamber measurements at six coniferous boreal sites. J. Geophys. Res. Atmos. 1997, 102, 28977–28985. [Google Scholar] [CrossRef]
- Ge, Z.M.; Kellomaki, S.; Zhou, X.; Wang, K.Y.; Peltola, H. Evaluation of carbon exchange in a boreal coniferous stand over a 10-year period: An integrated analysis based on ecosystem model simulations and eddy covariance measurements. Agric. For. Meteorol. 2011, 151, 191–203. [Google Scholar] [CrossRef]
- Campioli, M.; Gielen, B.; Göckede, M.; Papale, D.; Bouriaud, O.; Granier, A. Temporal variability of the NPP-GPP ratio at seasonal and interannual time scales in a temperate beech forest. Biogeosciences 2011, 8, 2481–2492. [Google Scholar] [CrossRef]
- Aubinet, M.; Feigenwinter, C.; Heinesch, B.; Bernhofer, C.; Canepa, E.; Lindroth, A.; Montagnani, L.; Rebmann, C.; Sedlak, P.; van Gorsel, E.; et al. Direct advection measurements do not help to solve the night-time CO2 closure problem: Evidence from three different forests. Agric. For. Meteorol. 2010, 150, 655–664. [Google Scholar] [CrossRef]
- Aurela, M. Carbon Dioxide Exchange in Subartic Ecosystems Measured by a Micrometeorological Technique; Finnish Meteorological Institute: Helsinki, Finland, 2005.
- Zeri, M.; Rebmann, C.; Feigenwinter, C.; Sedlak, P. Analysis of periods with strong and coherent CO2 advection over a forested hill. Agric. For. Meteorol. 2010, 150, 674–683. [Google Scholar] [CrossRef]
© 2015 by the authors; licensee MDPI, Basel, Switzerland. This article is an open access article distributed under the terms and conditions of the Creative Commons Attribution license (http://creativecommons.org/licenses/by/4.0/).
Share and Cite
Molina-Herrera, S.; Grote, R.; Santabárbara-Ruiz, I.; Kraus, D.; Klatt, S.; Haas, E.; Kiese, R.; Butterbach-Bahl, K. Simulation of CO2 Fluxes in European Forest Ecosystems with the Coupled Soil-Vegetation Process Model “LandscapeDNDC”. Forests 2015, 6, 1779-1809. https://doi.org/10.3390/f6061779
Molina-Herrera S, Grote R, Santabárbara-Ruiz I, Kraus D, Klatt S, Haas E, Kiese R, Butterbach-Bahl K. Simulation of CO2 Fluxes in European Forest Ecosystems with the Coupled Soil-Vegetation Process Model “LandscapeDNDC”. Forests. 2015; 6(6):1779-1809. https://doi.org/10.3390/f6061779
Chicago/Turabian StyleMolina-Herrera, Saúl, Rüdiger Grote, Ignacio Santabárbara-Ruiz, David Kraus, Steffen Klatt, Edwin Haas, Ralf Kiese, and Klaus Butterbach-Bahl. 2015. "Simulation of CO2 Fluxes in European Forest Ecosystems with the Coupled Soil-Vegetation Process Model “LandscapeDNDC”" Forests 6, no. 6: 1779-1809. https://doi.org/10.3390/f6061779
APA StyleMolina-Herrera, S., Grote, R., Santabárbara-Ruiz, I., Kraus, D., Klatt, S., Haas, E., Kiese, R., & Butterbach-Bahl, K. (2015). Simulation of CO2 Fluxes in European Forest Ecosystems with the Coupled Soil-Vegetation Process Model “LandscapeDNDC”. Forests, 6(6), 1779-1809. https://doi.org/10.3390/f6061779