
Non Destructive Method for Biomass Prediction Combining TLS Derived Tree Volume and Wood Density


Abstract
:
1. Introduction
1.1. Related Work
1.1.1. TLS Derived Volume Estimations
1.1.2. Non Remote Sensing Based Biomass Estimations
2. Rationale
- Quercus petraea, a deciduous broadleaved tree species;
- Erythrophleum fordii, an evergreen broadleaved tree species;
- Pinus massoniana, an evergreen coniferous tree species.
3. Materials and Methods
3.1. Definitions.

| Abbreviation | Name | Description | Calculated by |
|---|---|---|---|
| bc | biomass content | weighted mean value of all ratios between dry weight and fresh weight of all stem discs of a tree | |
| densb | basic density ( | derived from a simulated increment core using high frequency densitometry | HF-densitometry calibrated [ 34] |
| densf | fresh density ( | weighted mean value of the fresh density values of all stem discs of a tree | |
| wX | fresh weight (kg) | the fresh weight in kilogram of all compartments of a tree, whose diameter is larger than X cm | directly measured |
| BEF | biomass expansion factor | value to estimate total biomass from partially measured biomass [ 35,36] | |
| TLS derived volume (l) | volume of all compartments of a tree, whose diameter is larger than X cm | directly measured (Simple Tree software) | |
| volume (l) | weight derived volume of all compartments of a tree, whose diameter is larger than X cm | ||
| biomassTLS | biomass (kg) | total TLS derived tree biomass | |
| biomassTLS* | biomass (kg) | total tree biomass estimated with biomass expansion factor derived from TLS | |
| biomassweight | biomass (kg) | total tree biomass derived from biomass content and fresh weight | w0 * bc |
3.2. Data Collection
| Species | Q. petraea | E. fordii | P. massoniana |
|---|---|---|---|
| Number of trees | 12 | 12 | 12 |
| Scan mode | superhigh | superhigh | high |
| Average scans per tree | 8 | 8 | 6 |
| Species | Q. petraea | E. fordii | P. massoniana |
|---|---|---|---|
| leaf/needle condition | off (leaf) | on (leaf) | on (needle) |
| bark | rough | plain | rough |
| epicormic shoots | yes | no | no |
| wind | yes | yes | yes |
| precipitation | yes | no | no |
Ground Truth and Density Measurements
3.3. TLS Volume Estimation—Using Software Simpletree
3.3.1. Cylinder Creation
- the angle between its normal and the z-axis is larger than 60°; points located on stems not growing in the direction of the z-axis are deleted by this criterium;
- the third principal component accounts to a maximum of 10% of the spatial variation, the second principal component to a minimum of 35%. Only points in a coplanar neighborhood satisfy both eigenvalue conditions [24].
3.3.2. Denoising
3.3.2.1. Selection of Scans
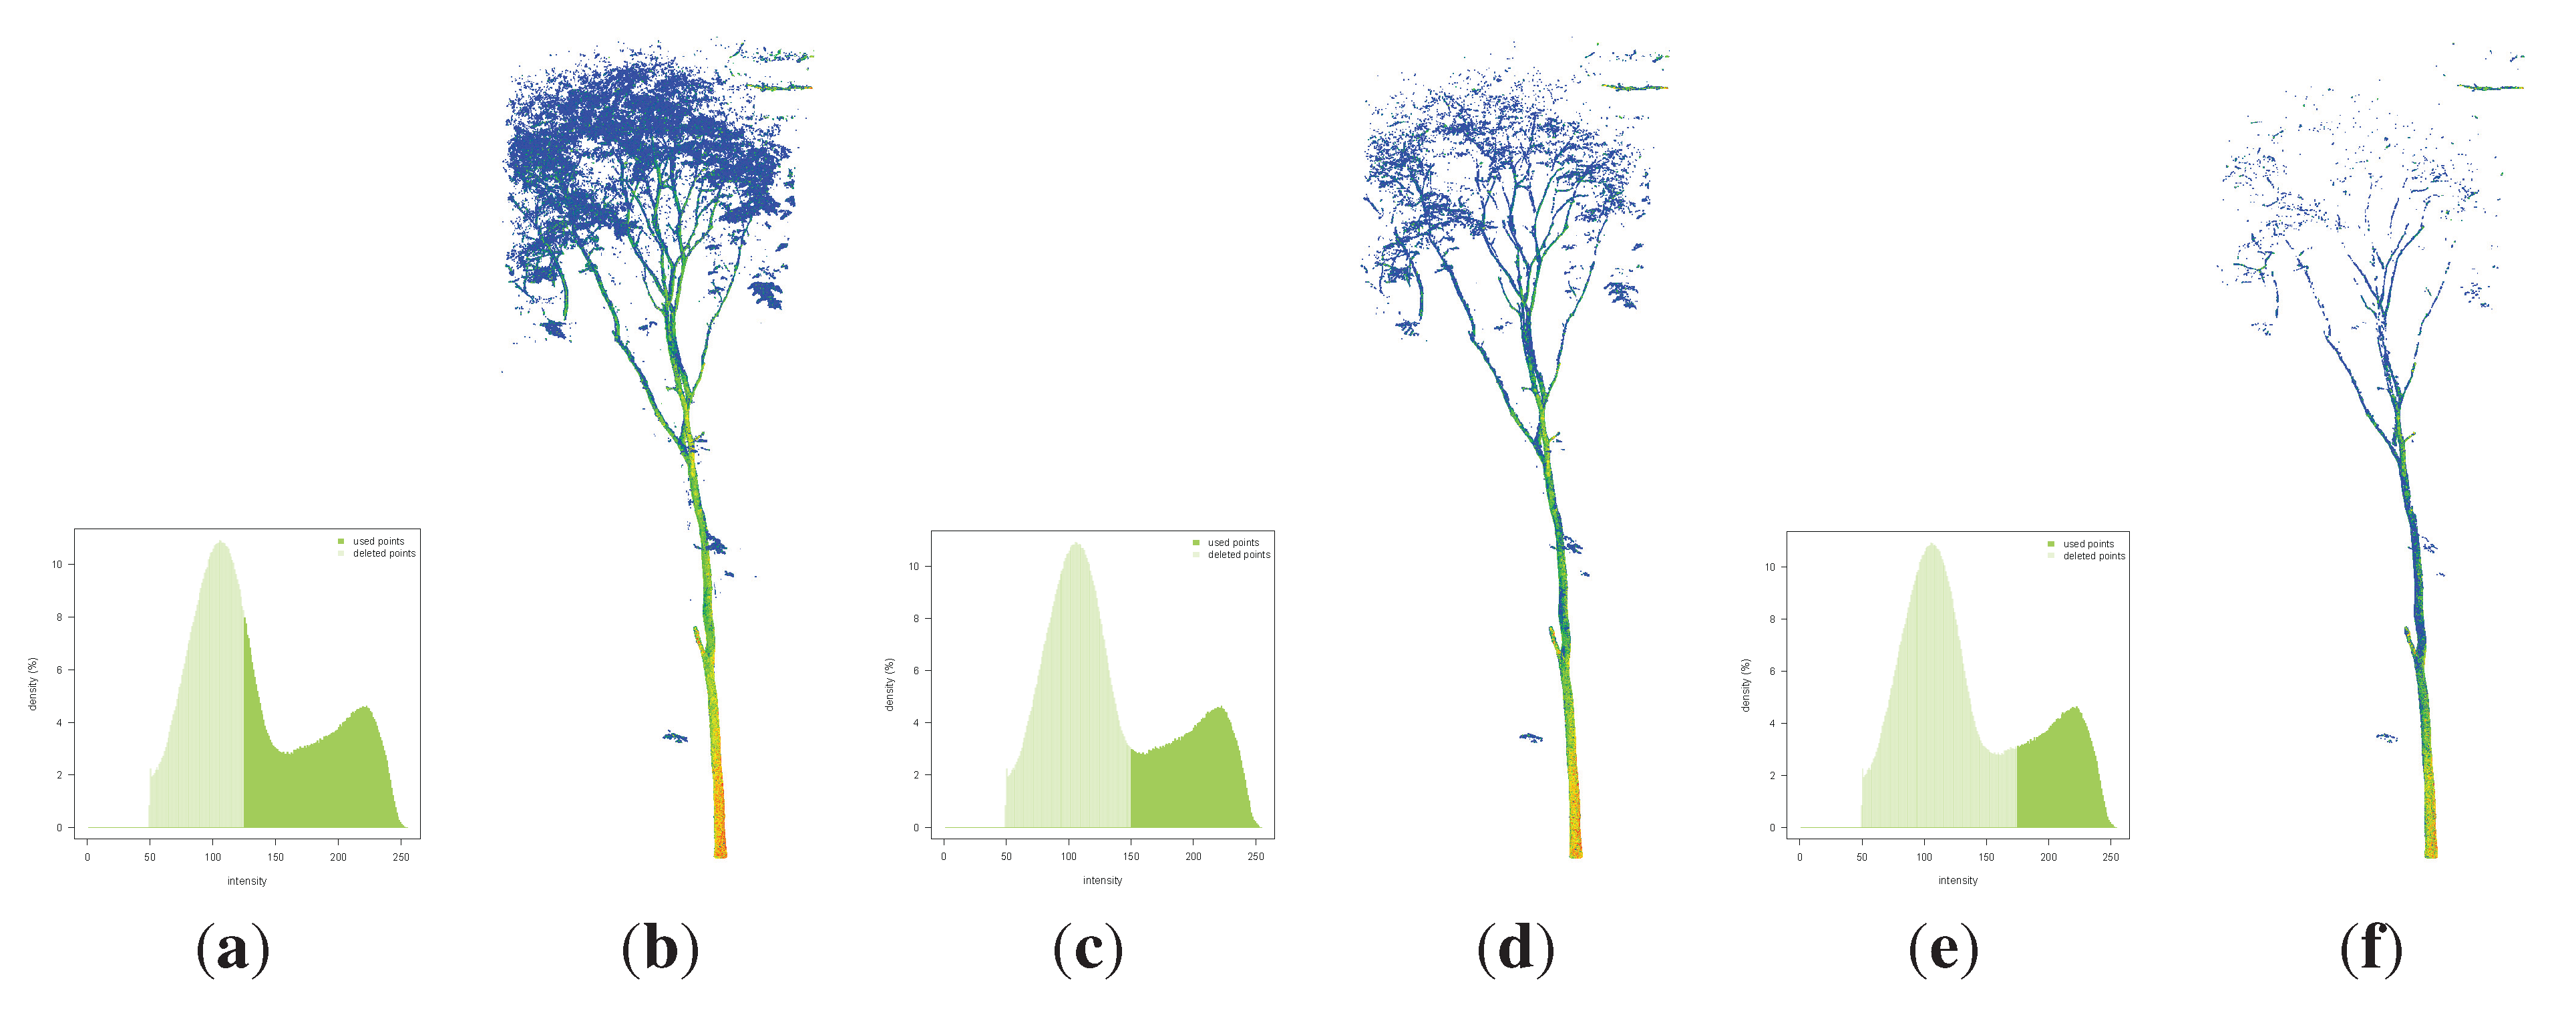
3.3.2.2. Filter by Intensity
3.3.2.3. Filter by Neighborhood Information
3.3.2.4. Isolating the Target Tree
3.3.2.5. Inclusion of Artificial Gaps
3.3.2.6. Buffering with Original Point Cloud
3.3.2.7. Combination of Two Point Clouds
3.3.3. Output
4. Results
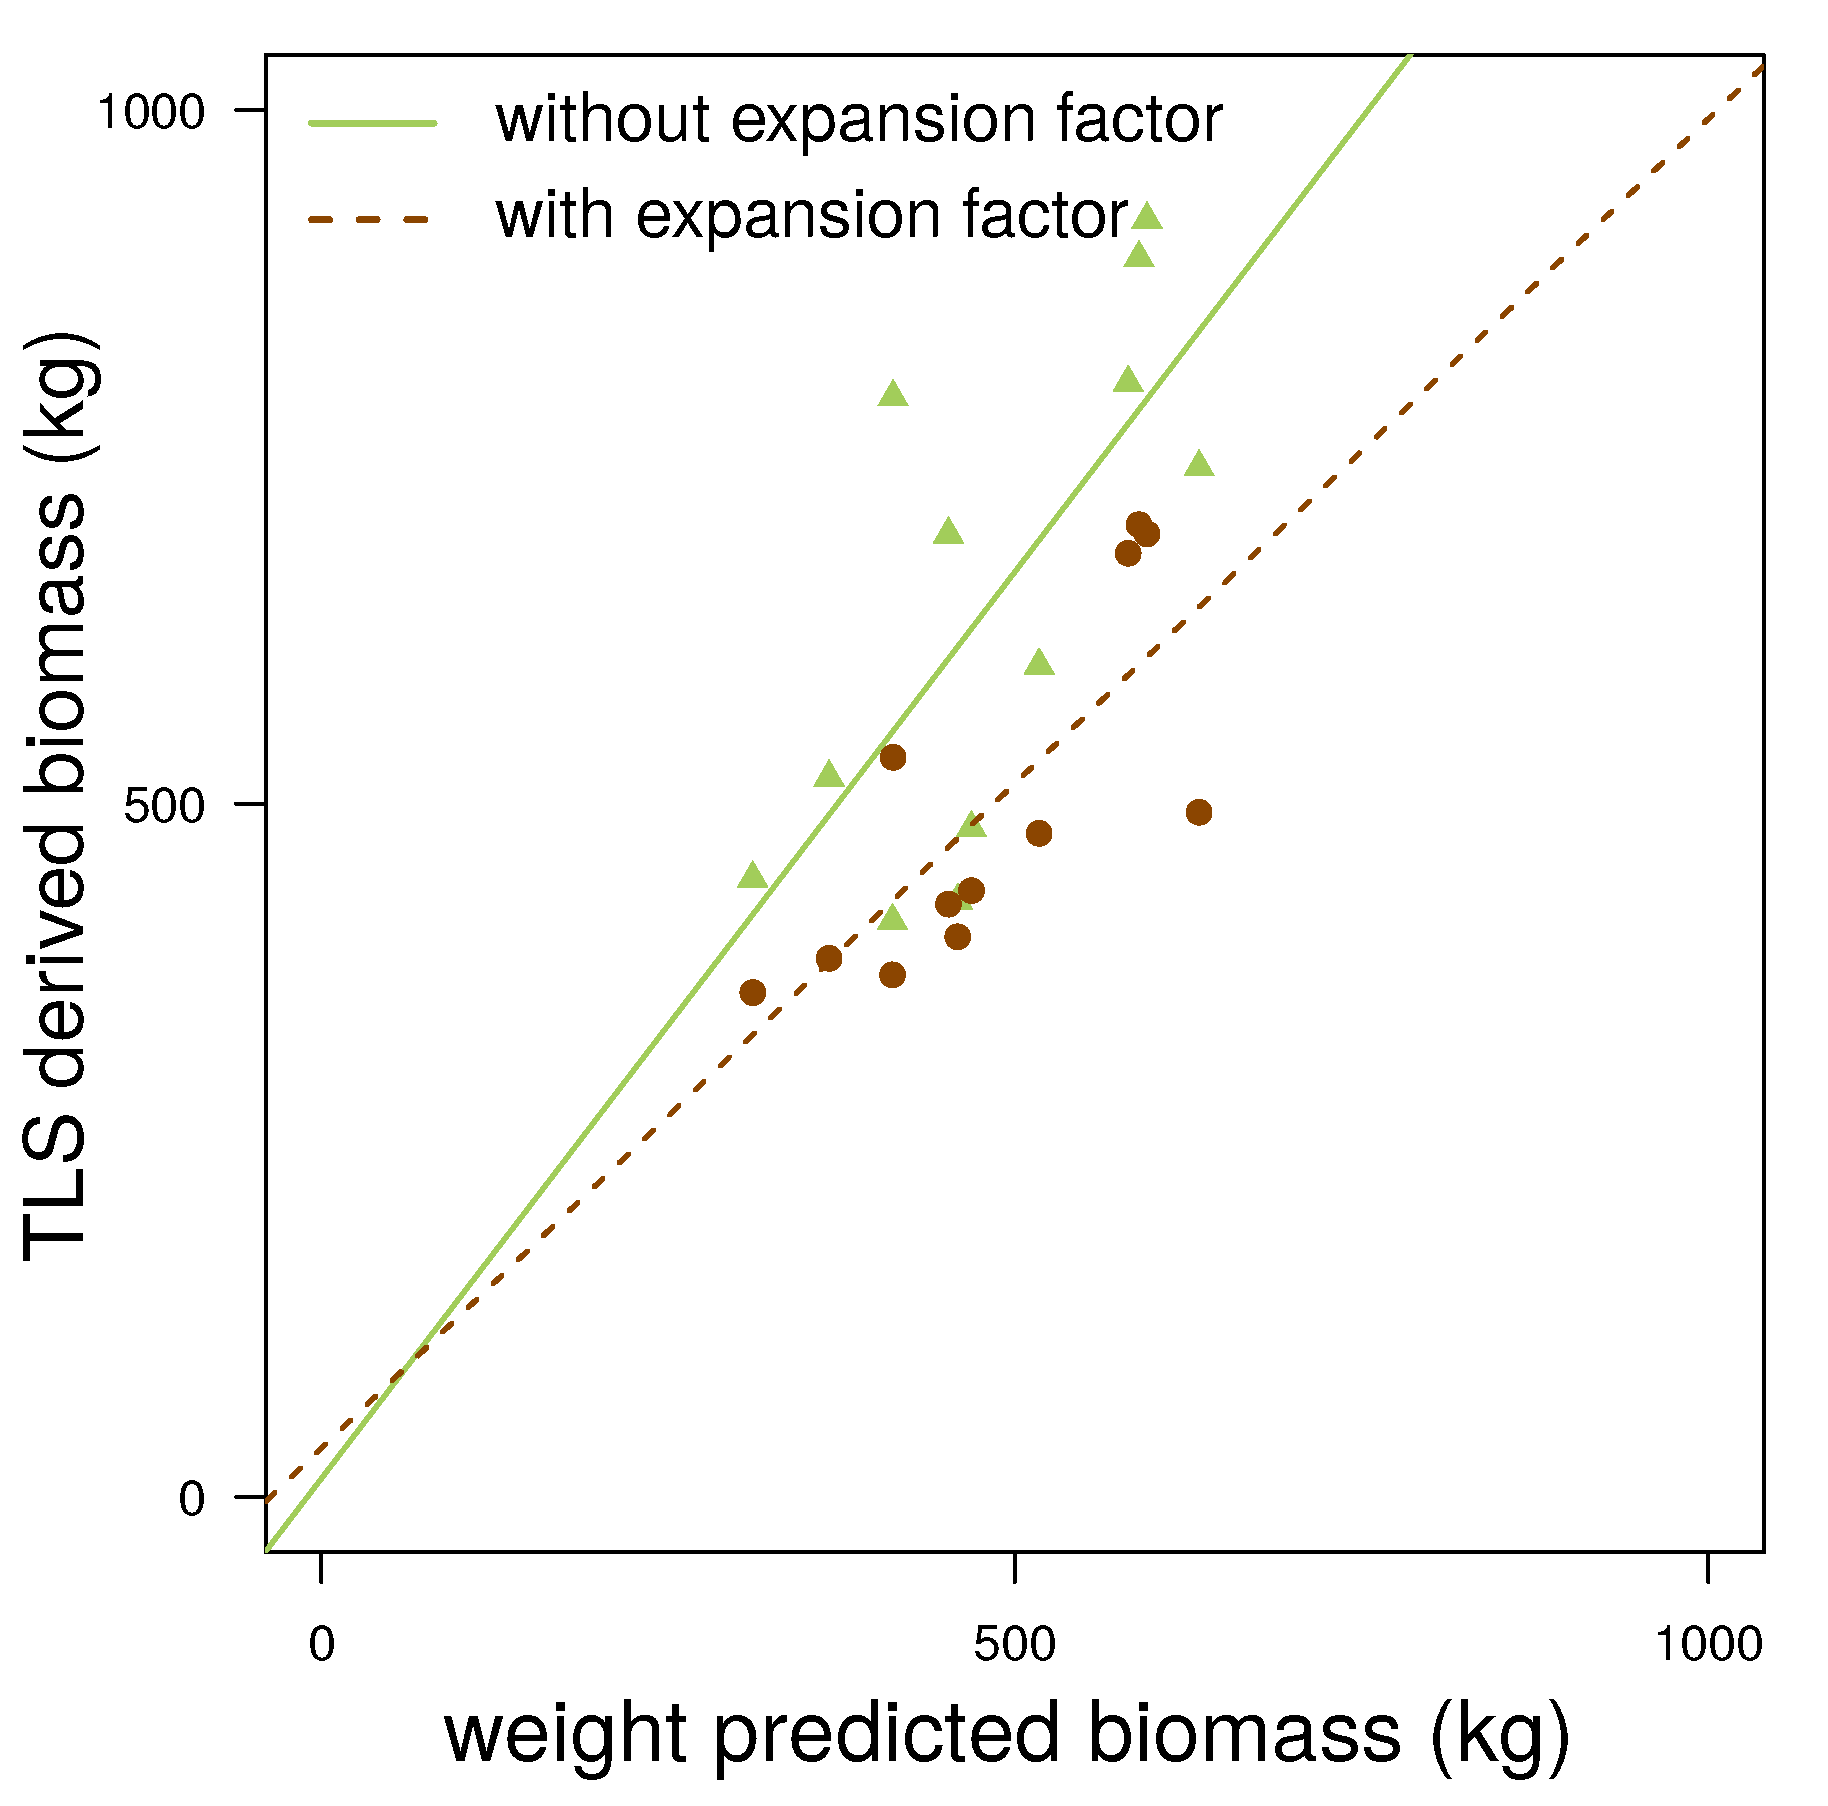
4.1. Quercus Petraea

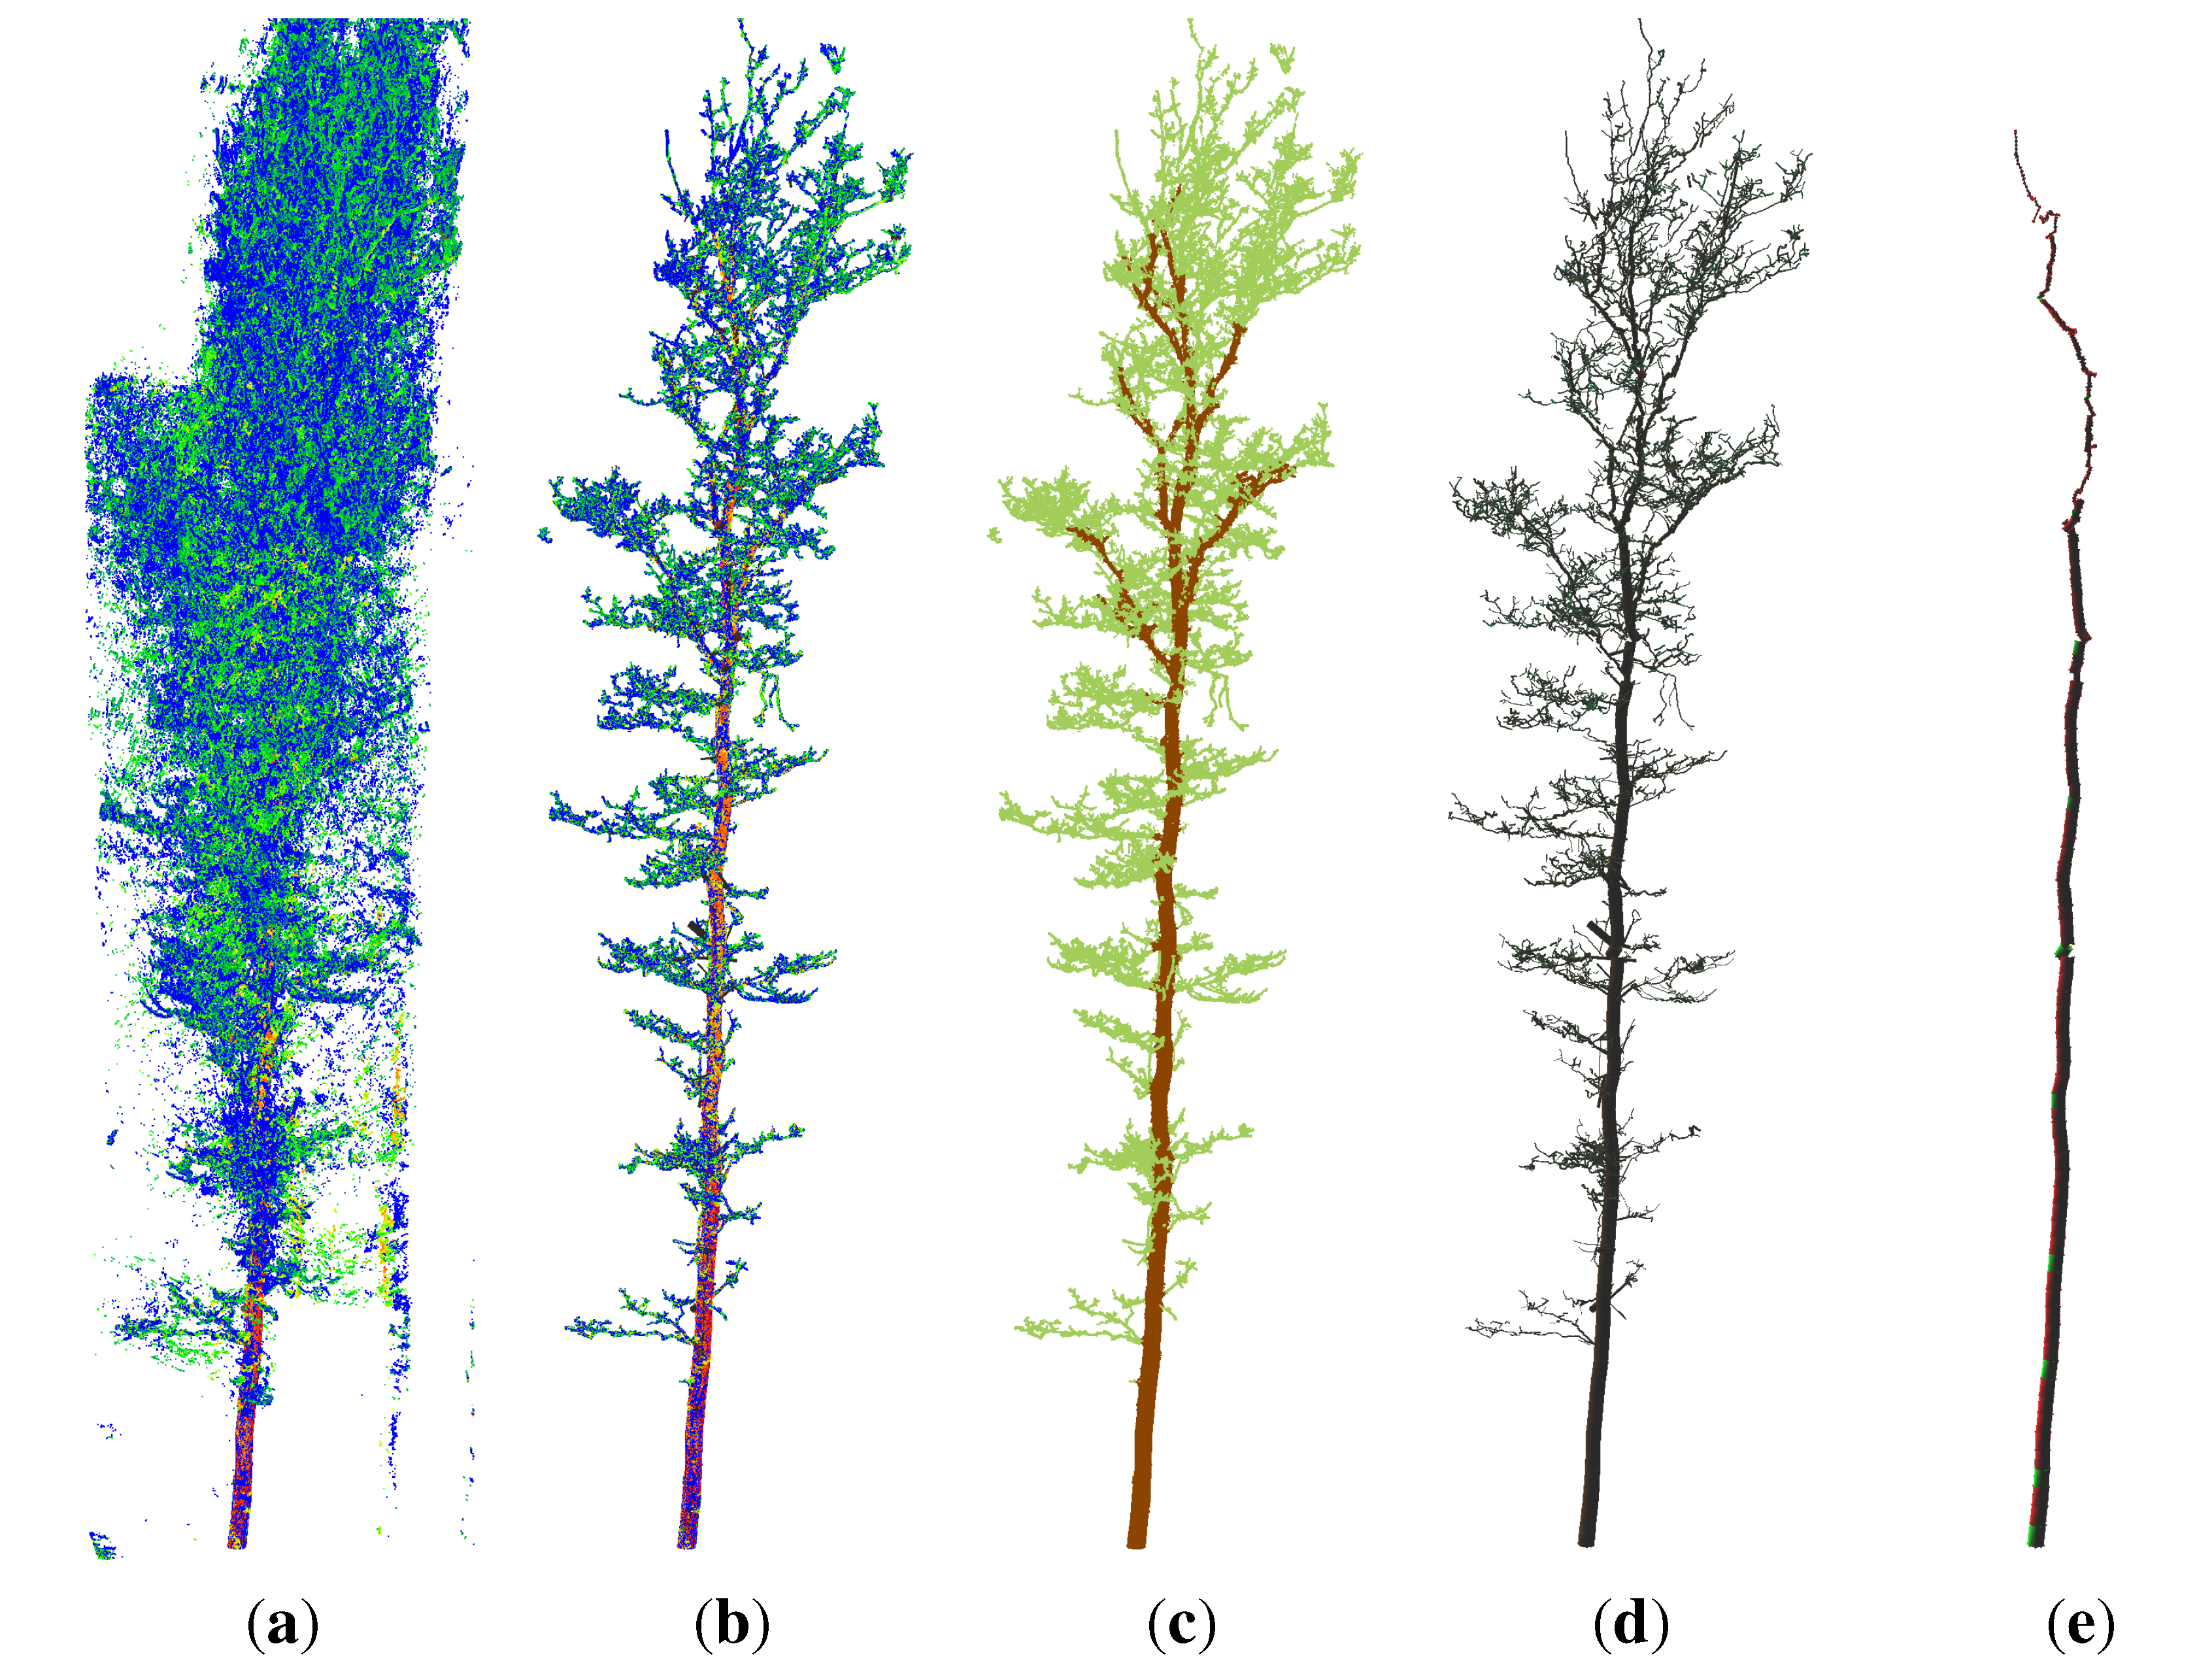
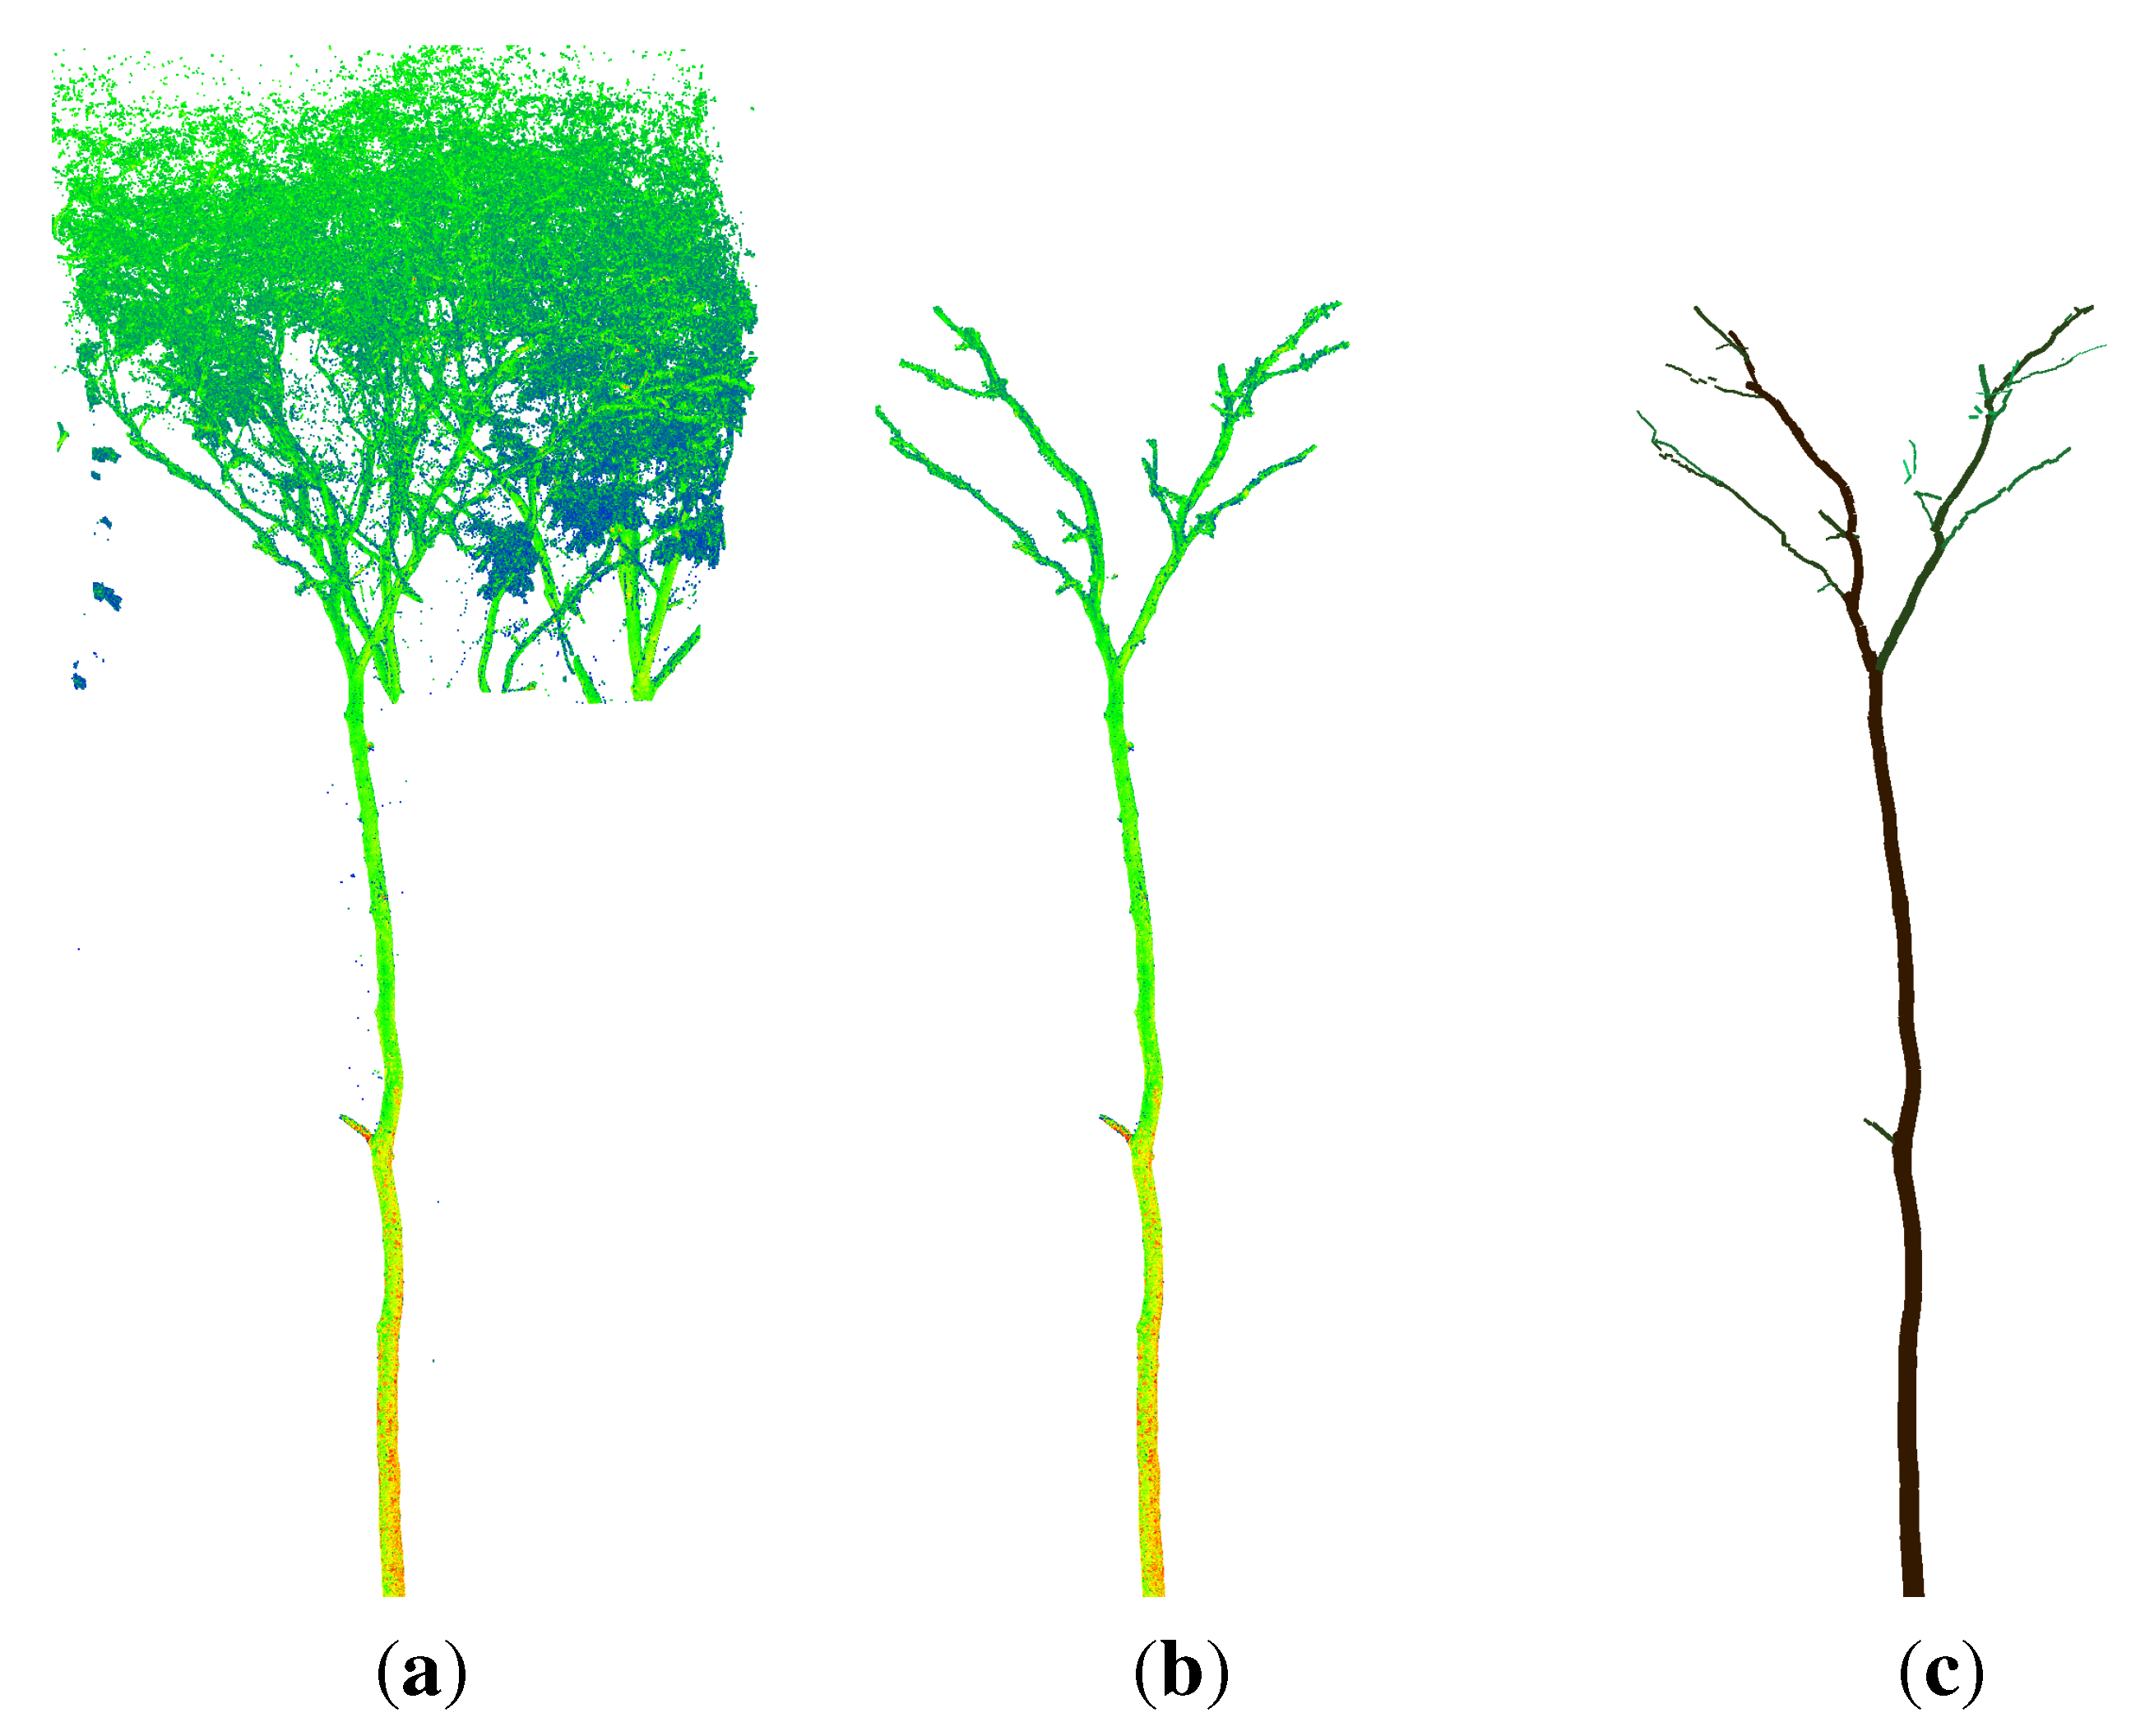
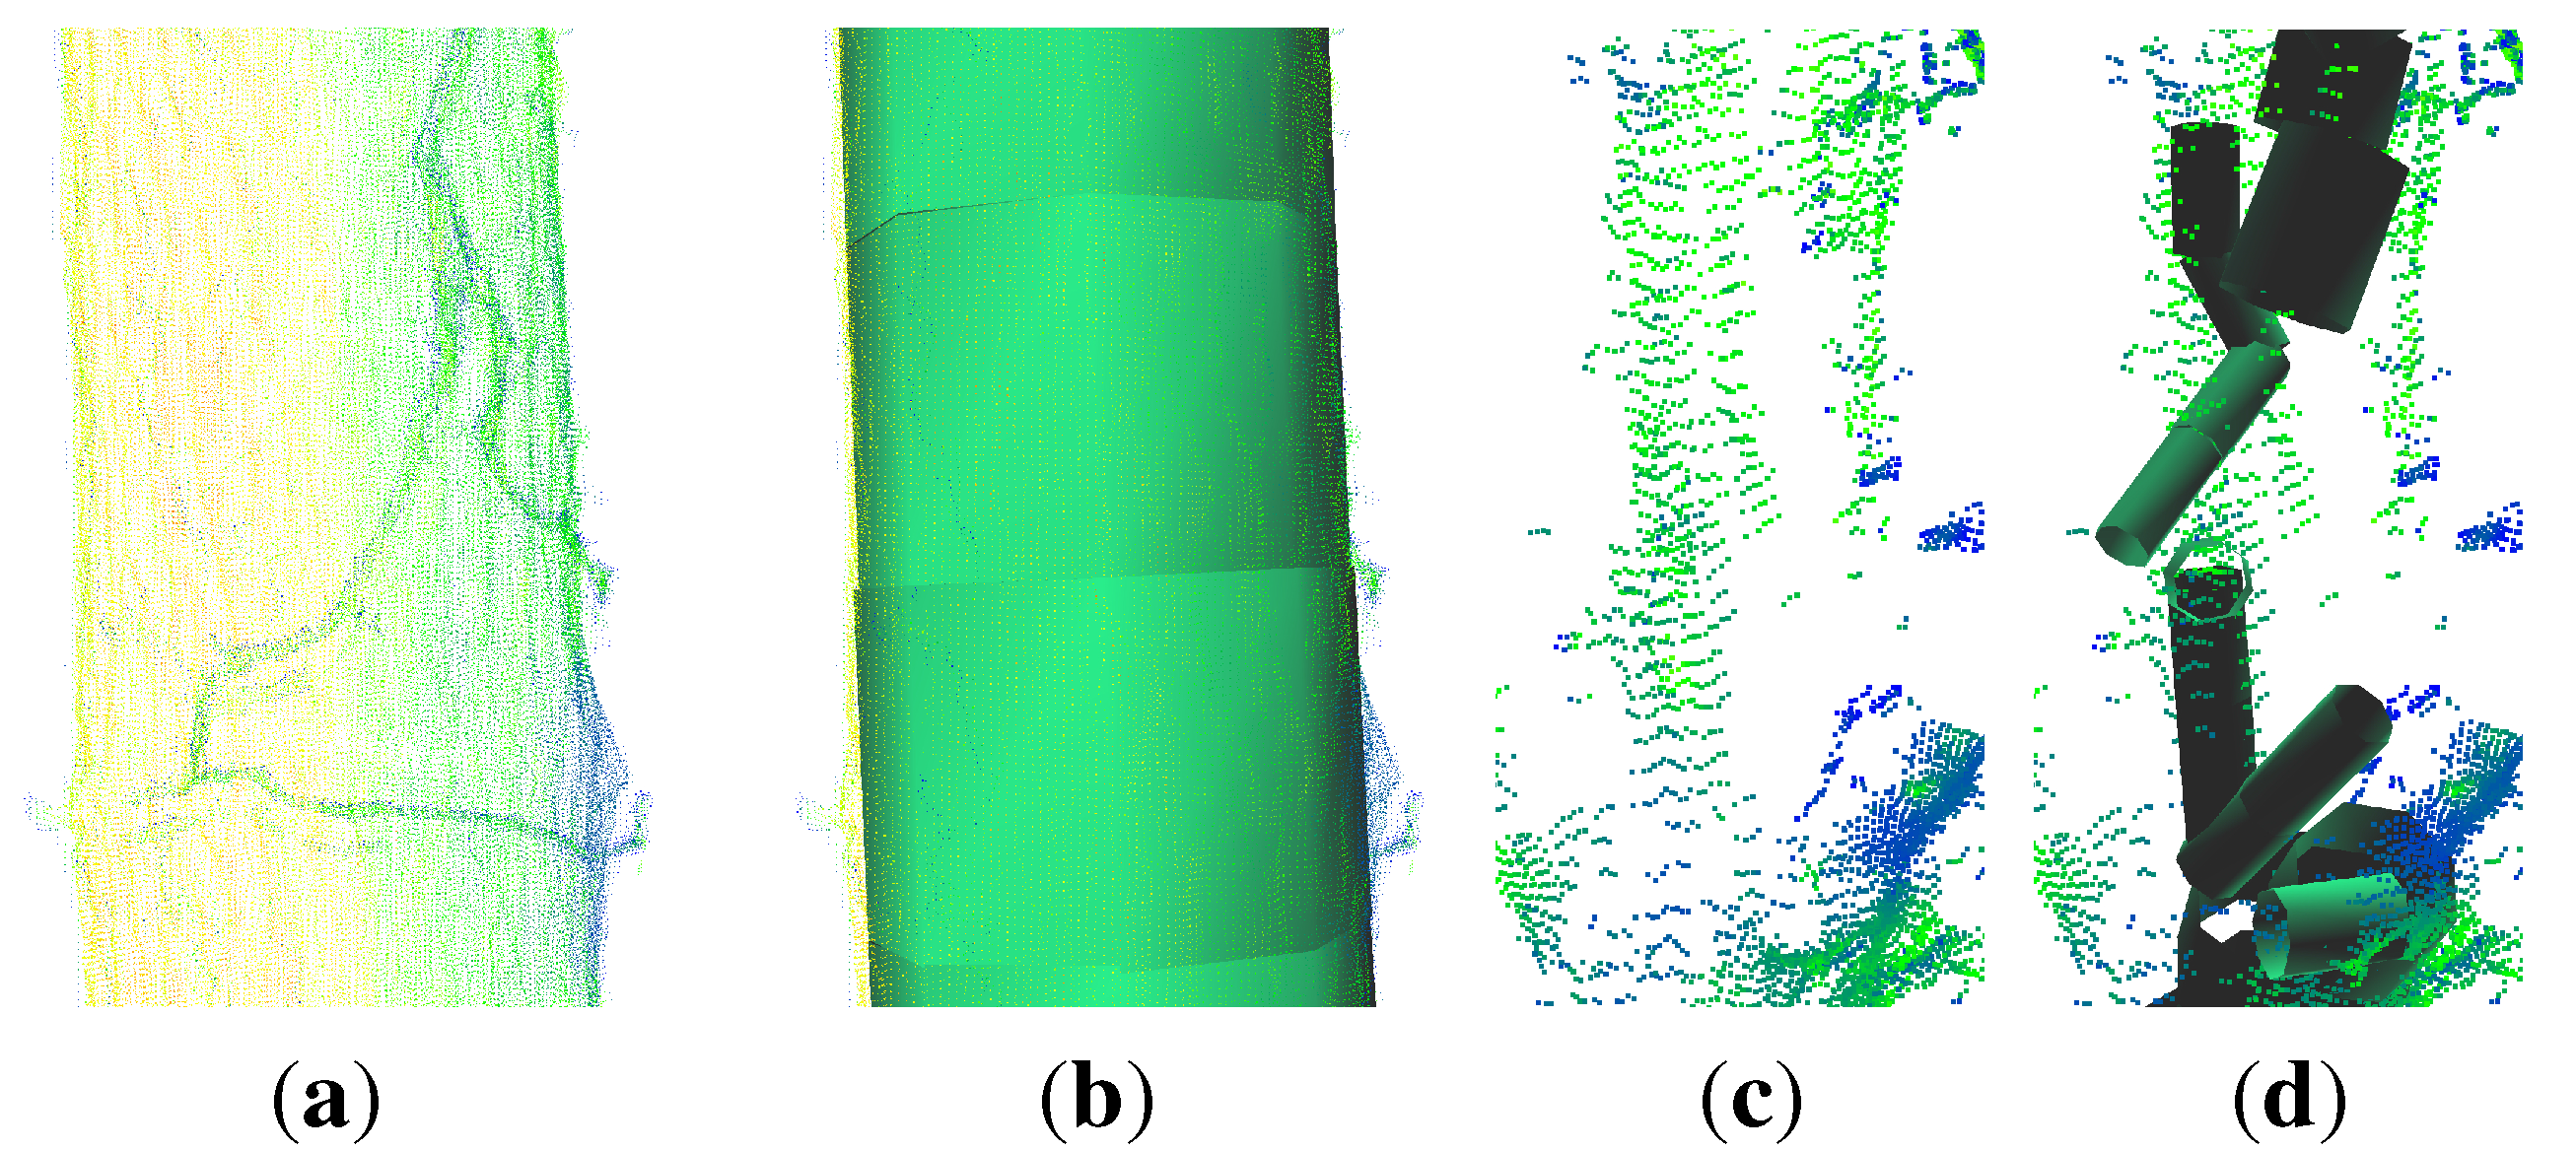
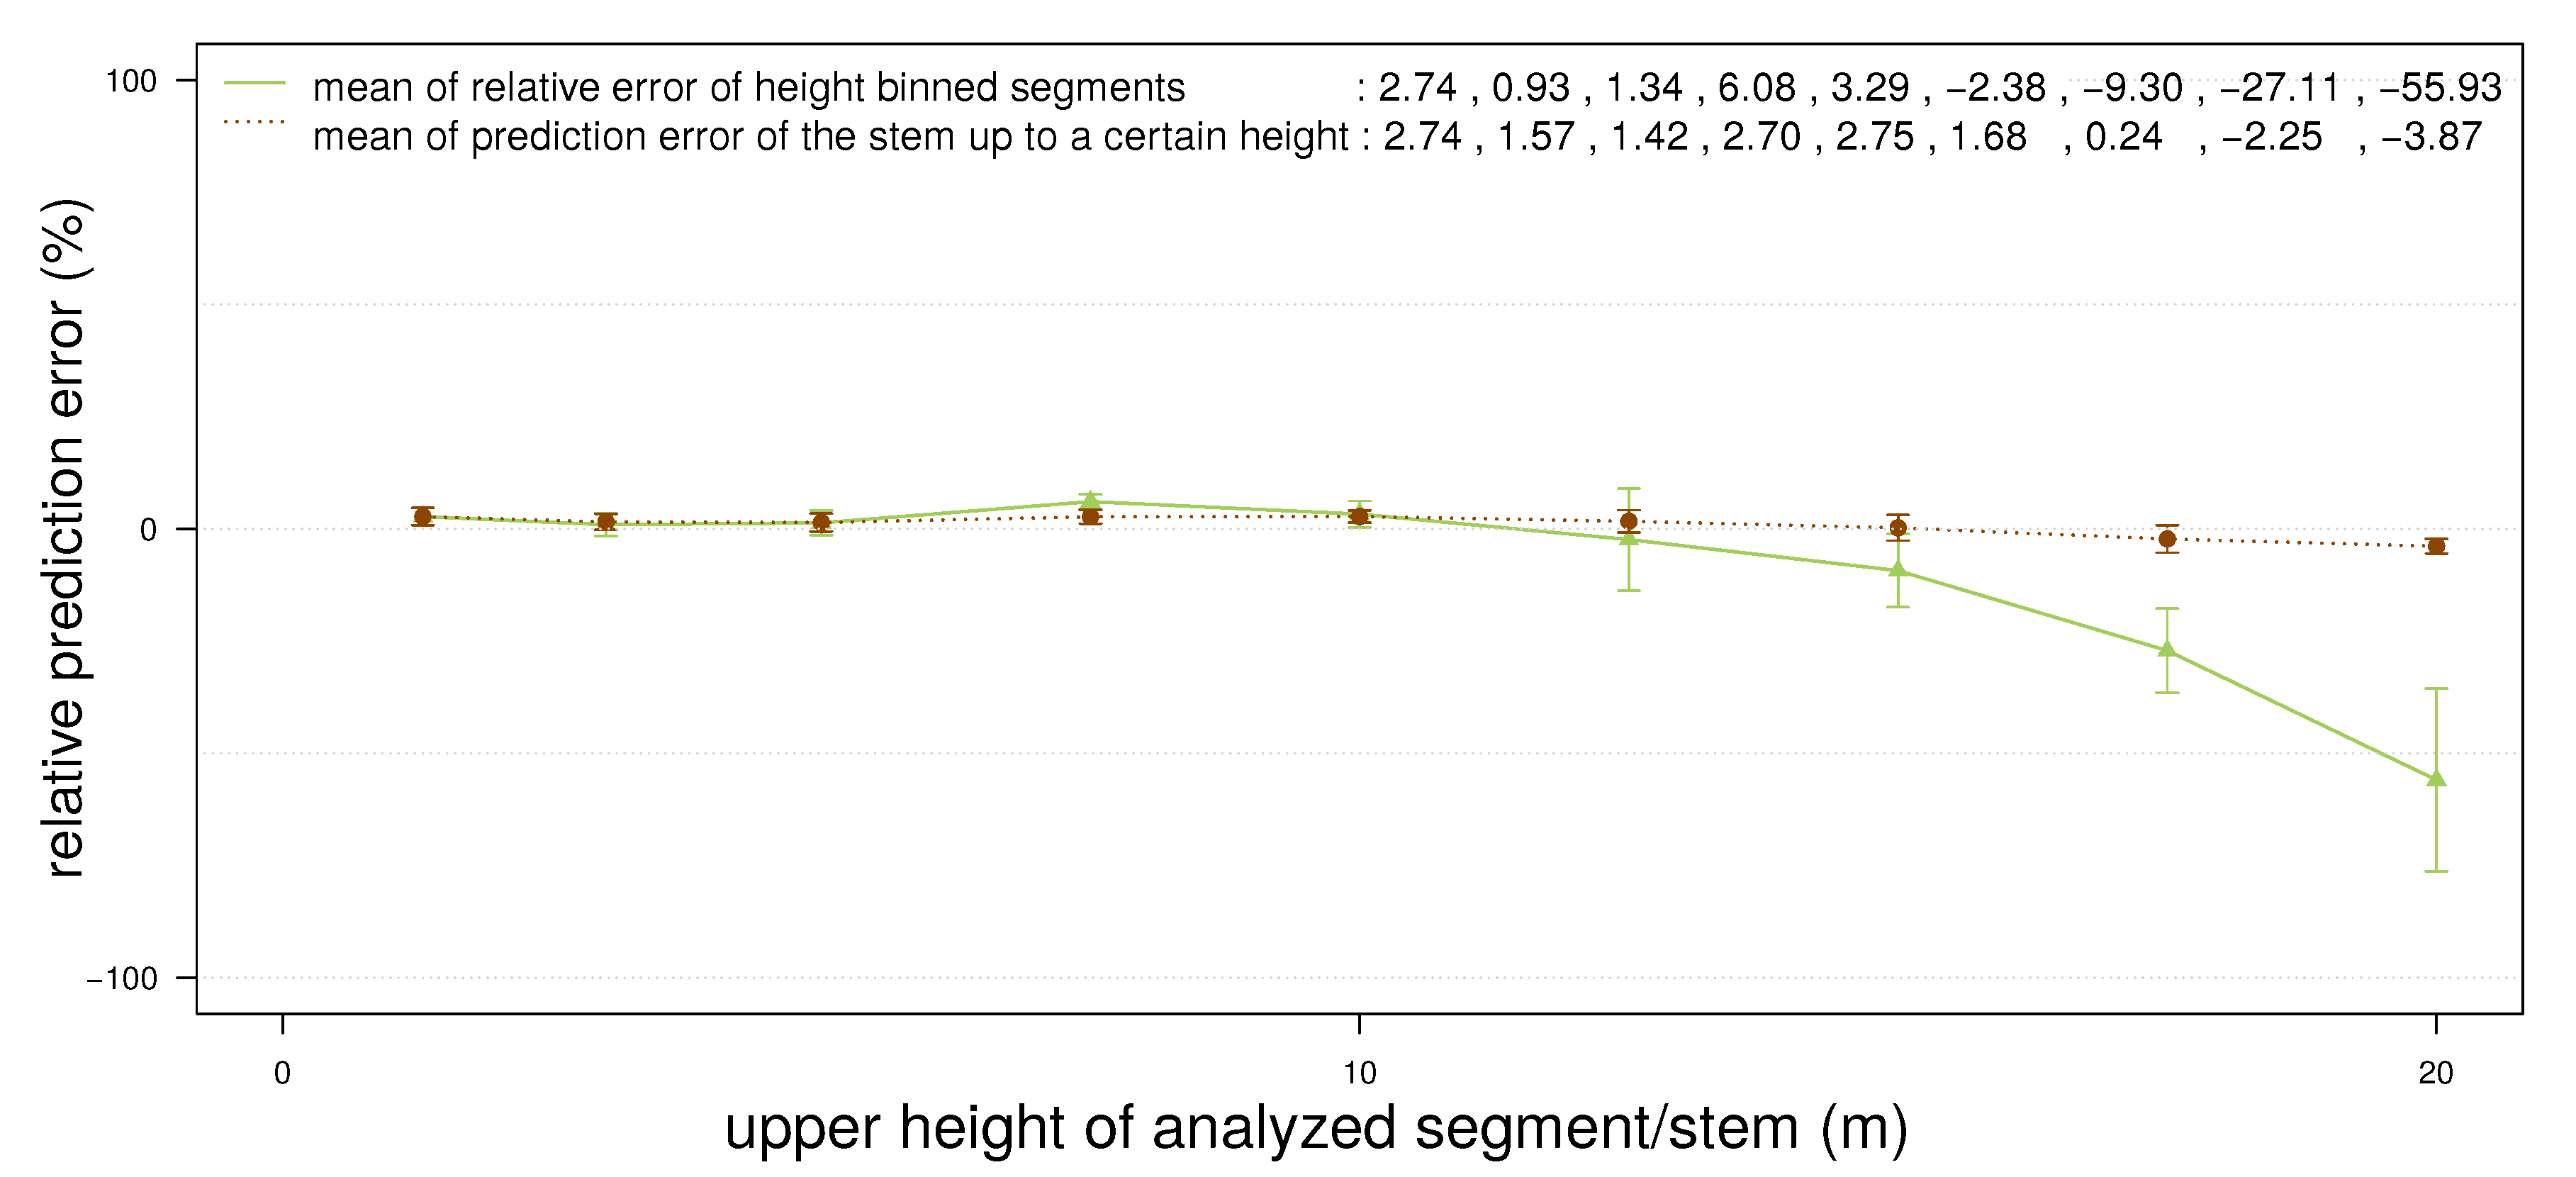
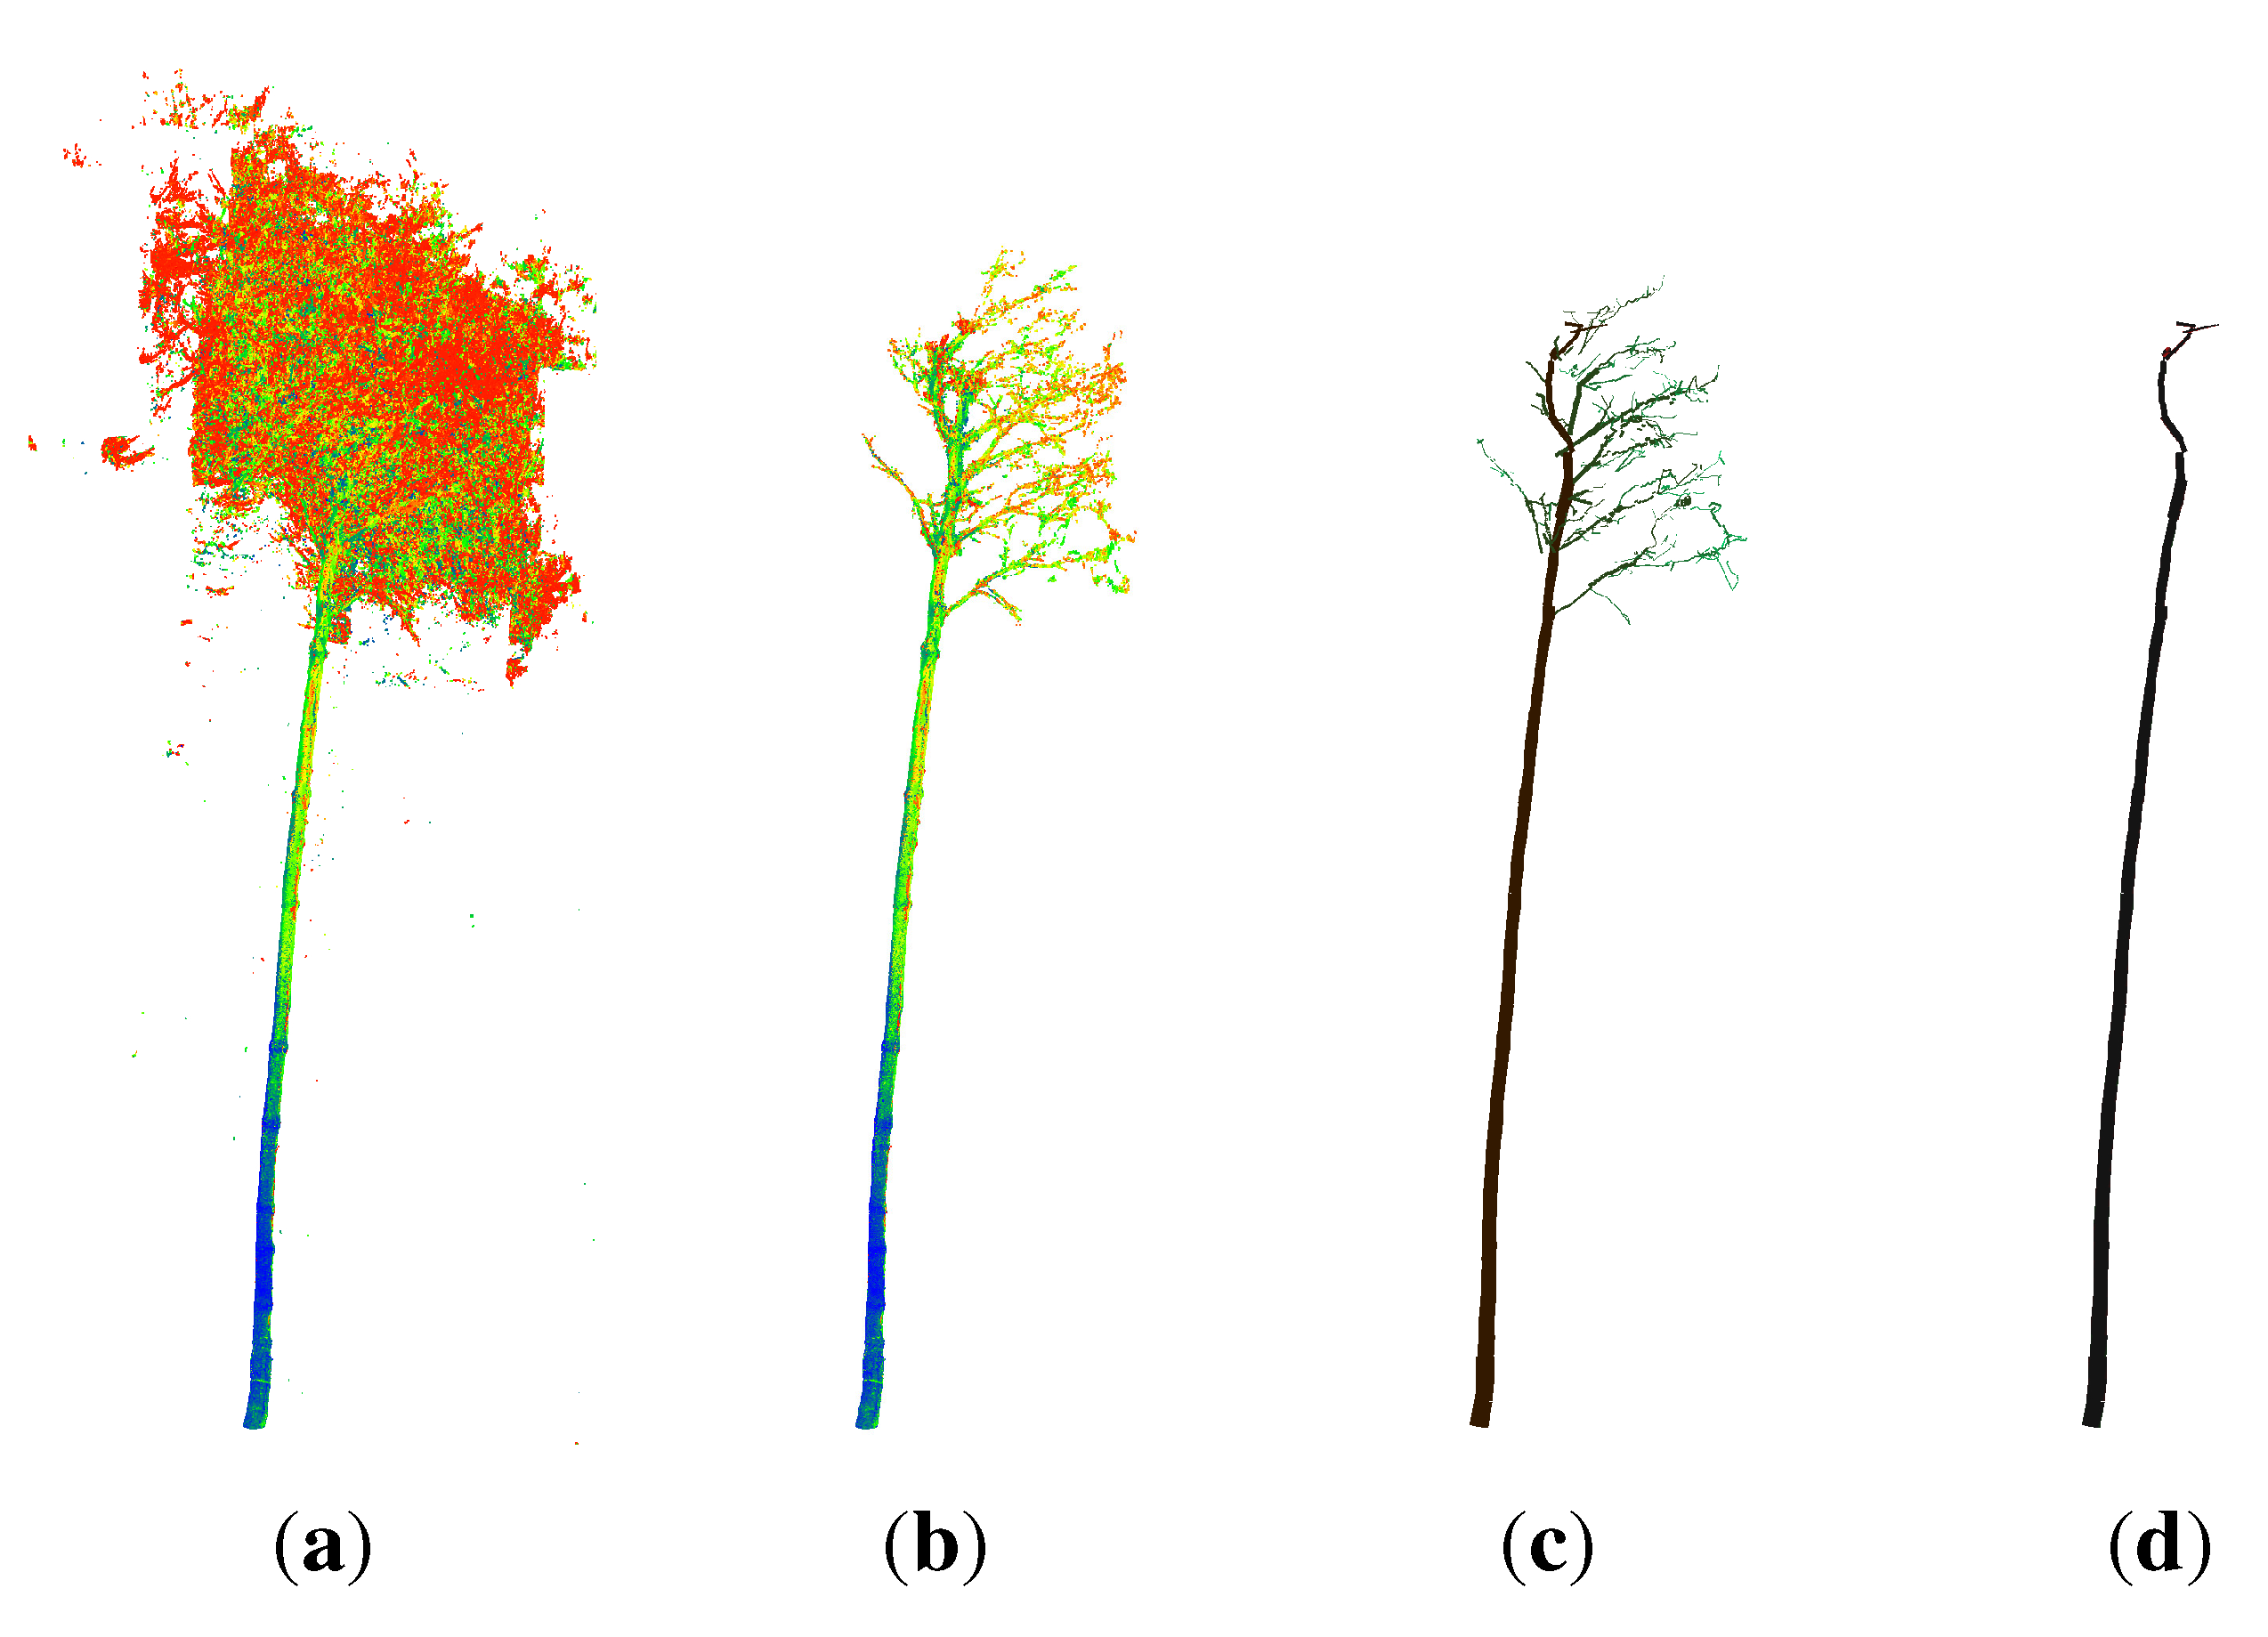
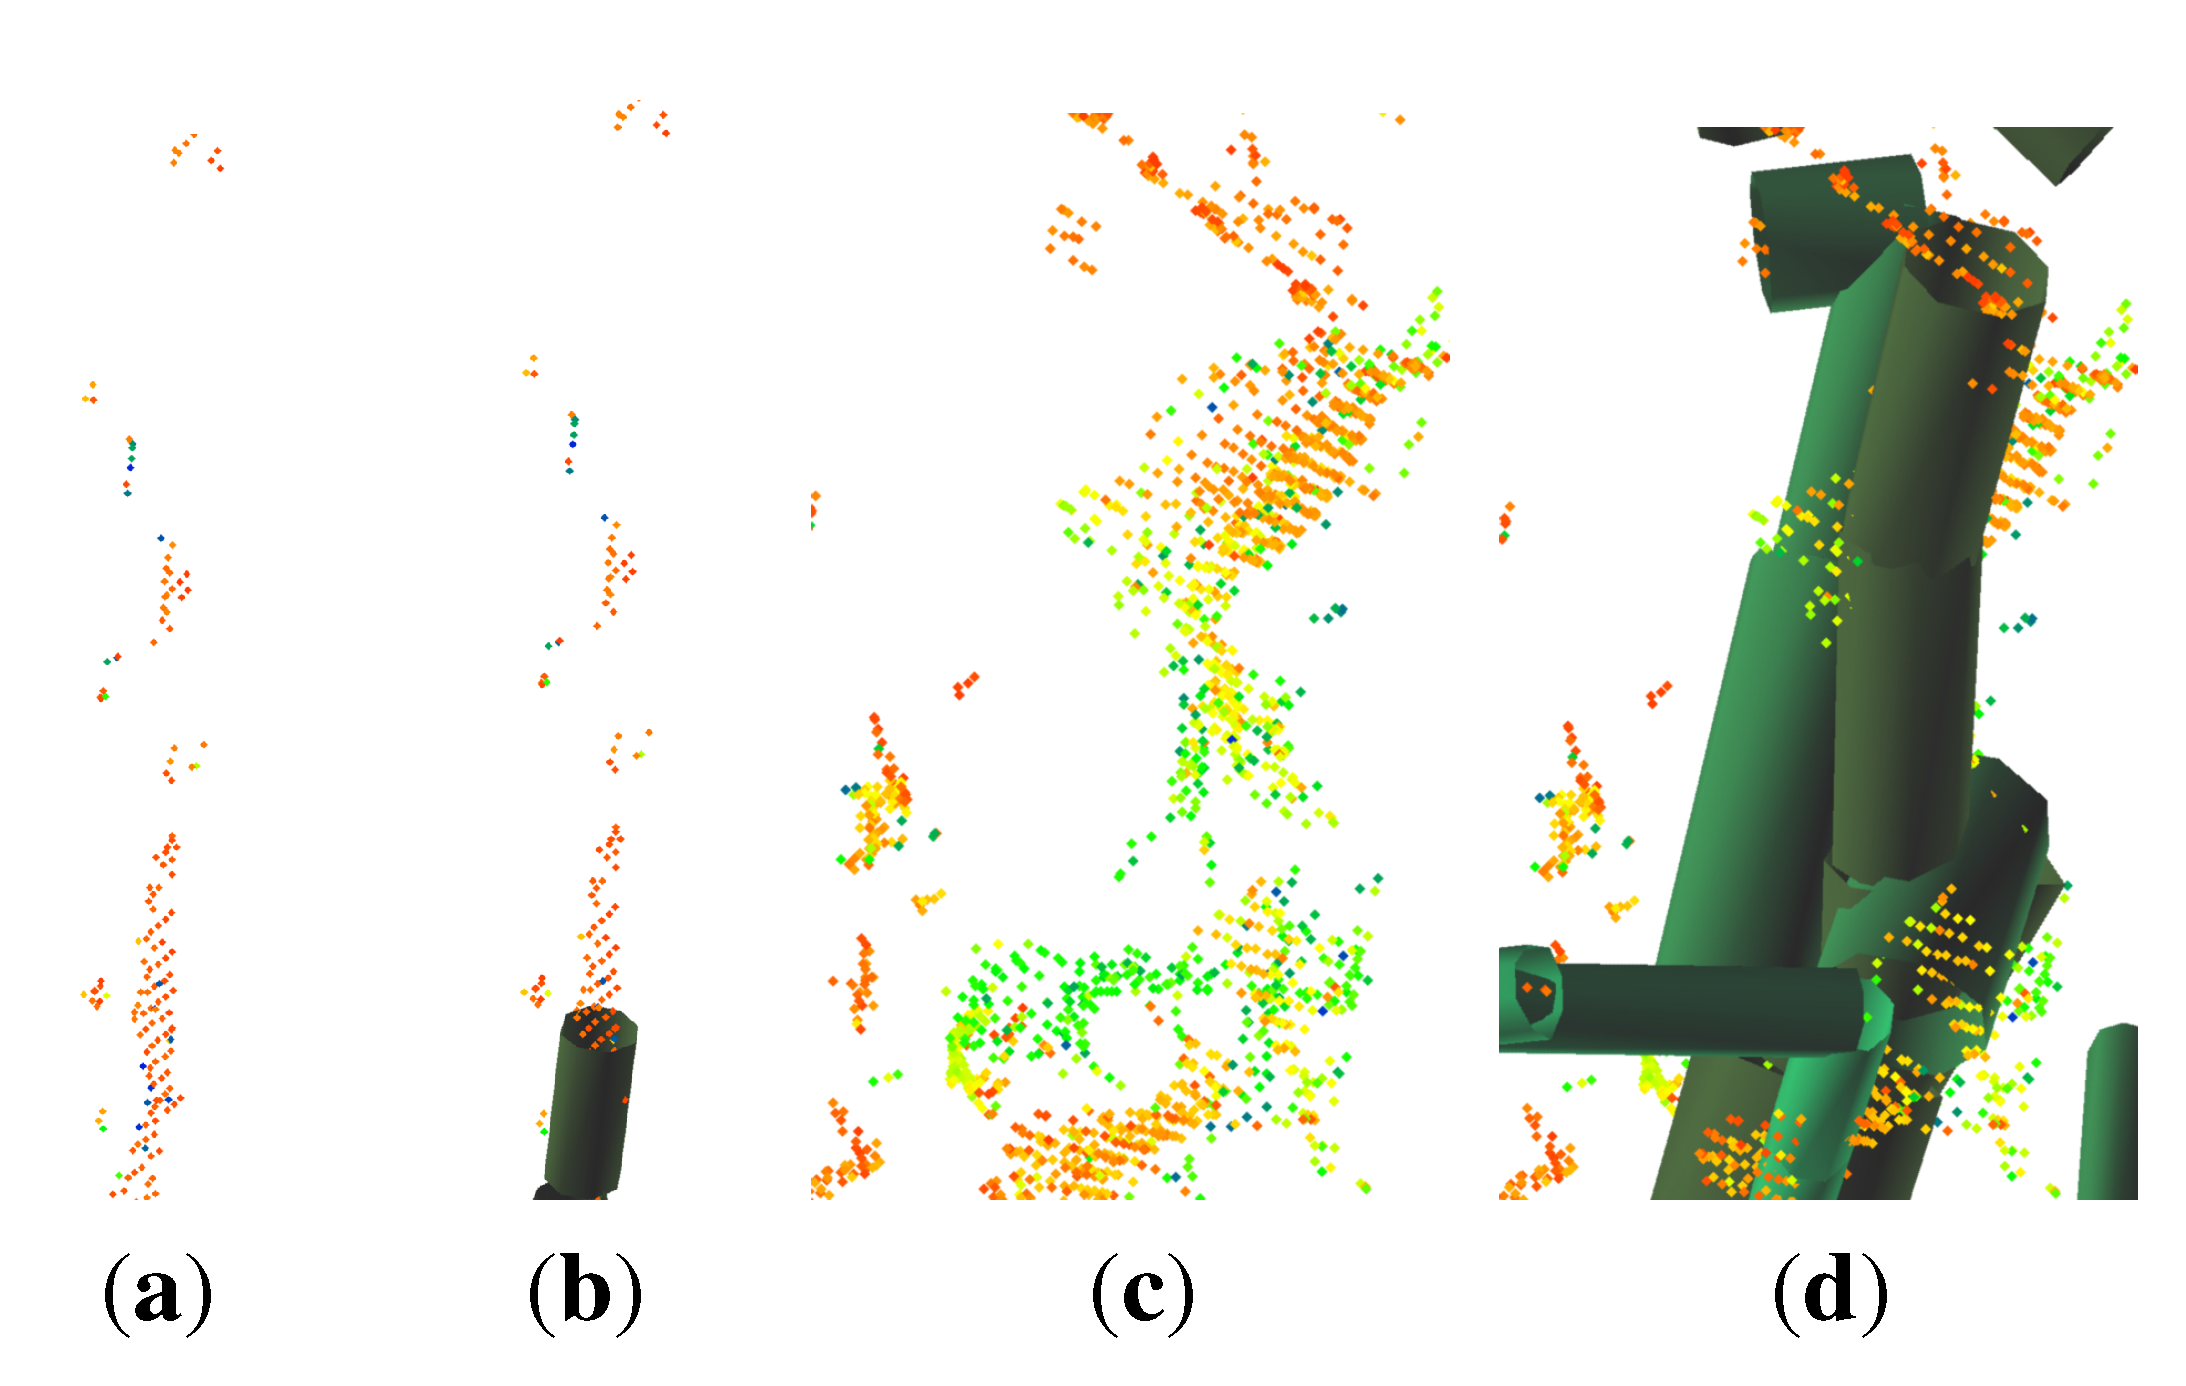
- points located on the upper part of the stem are not detected as stem points (Figure 2(c)), because the lower point density in combination with a higher curvature of the stem surface prevents a successful pass of the test for stem points; as the thresholds are then adjusted for the detection of smaller twigs, upper stem cylinders might have underestimated diameters (Figure 3);
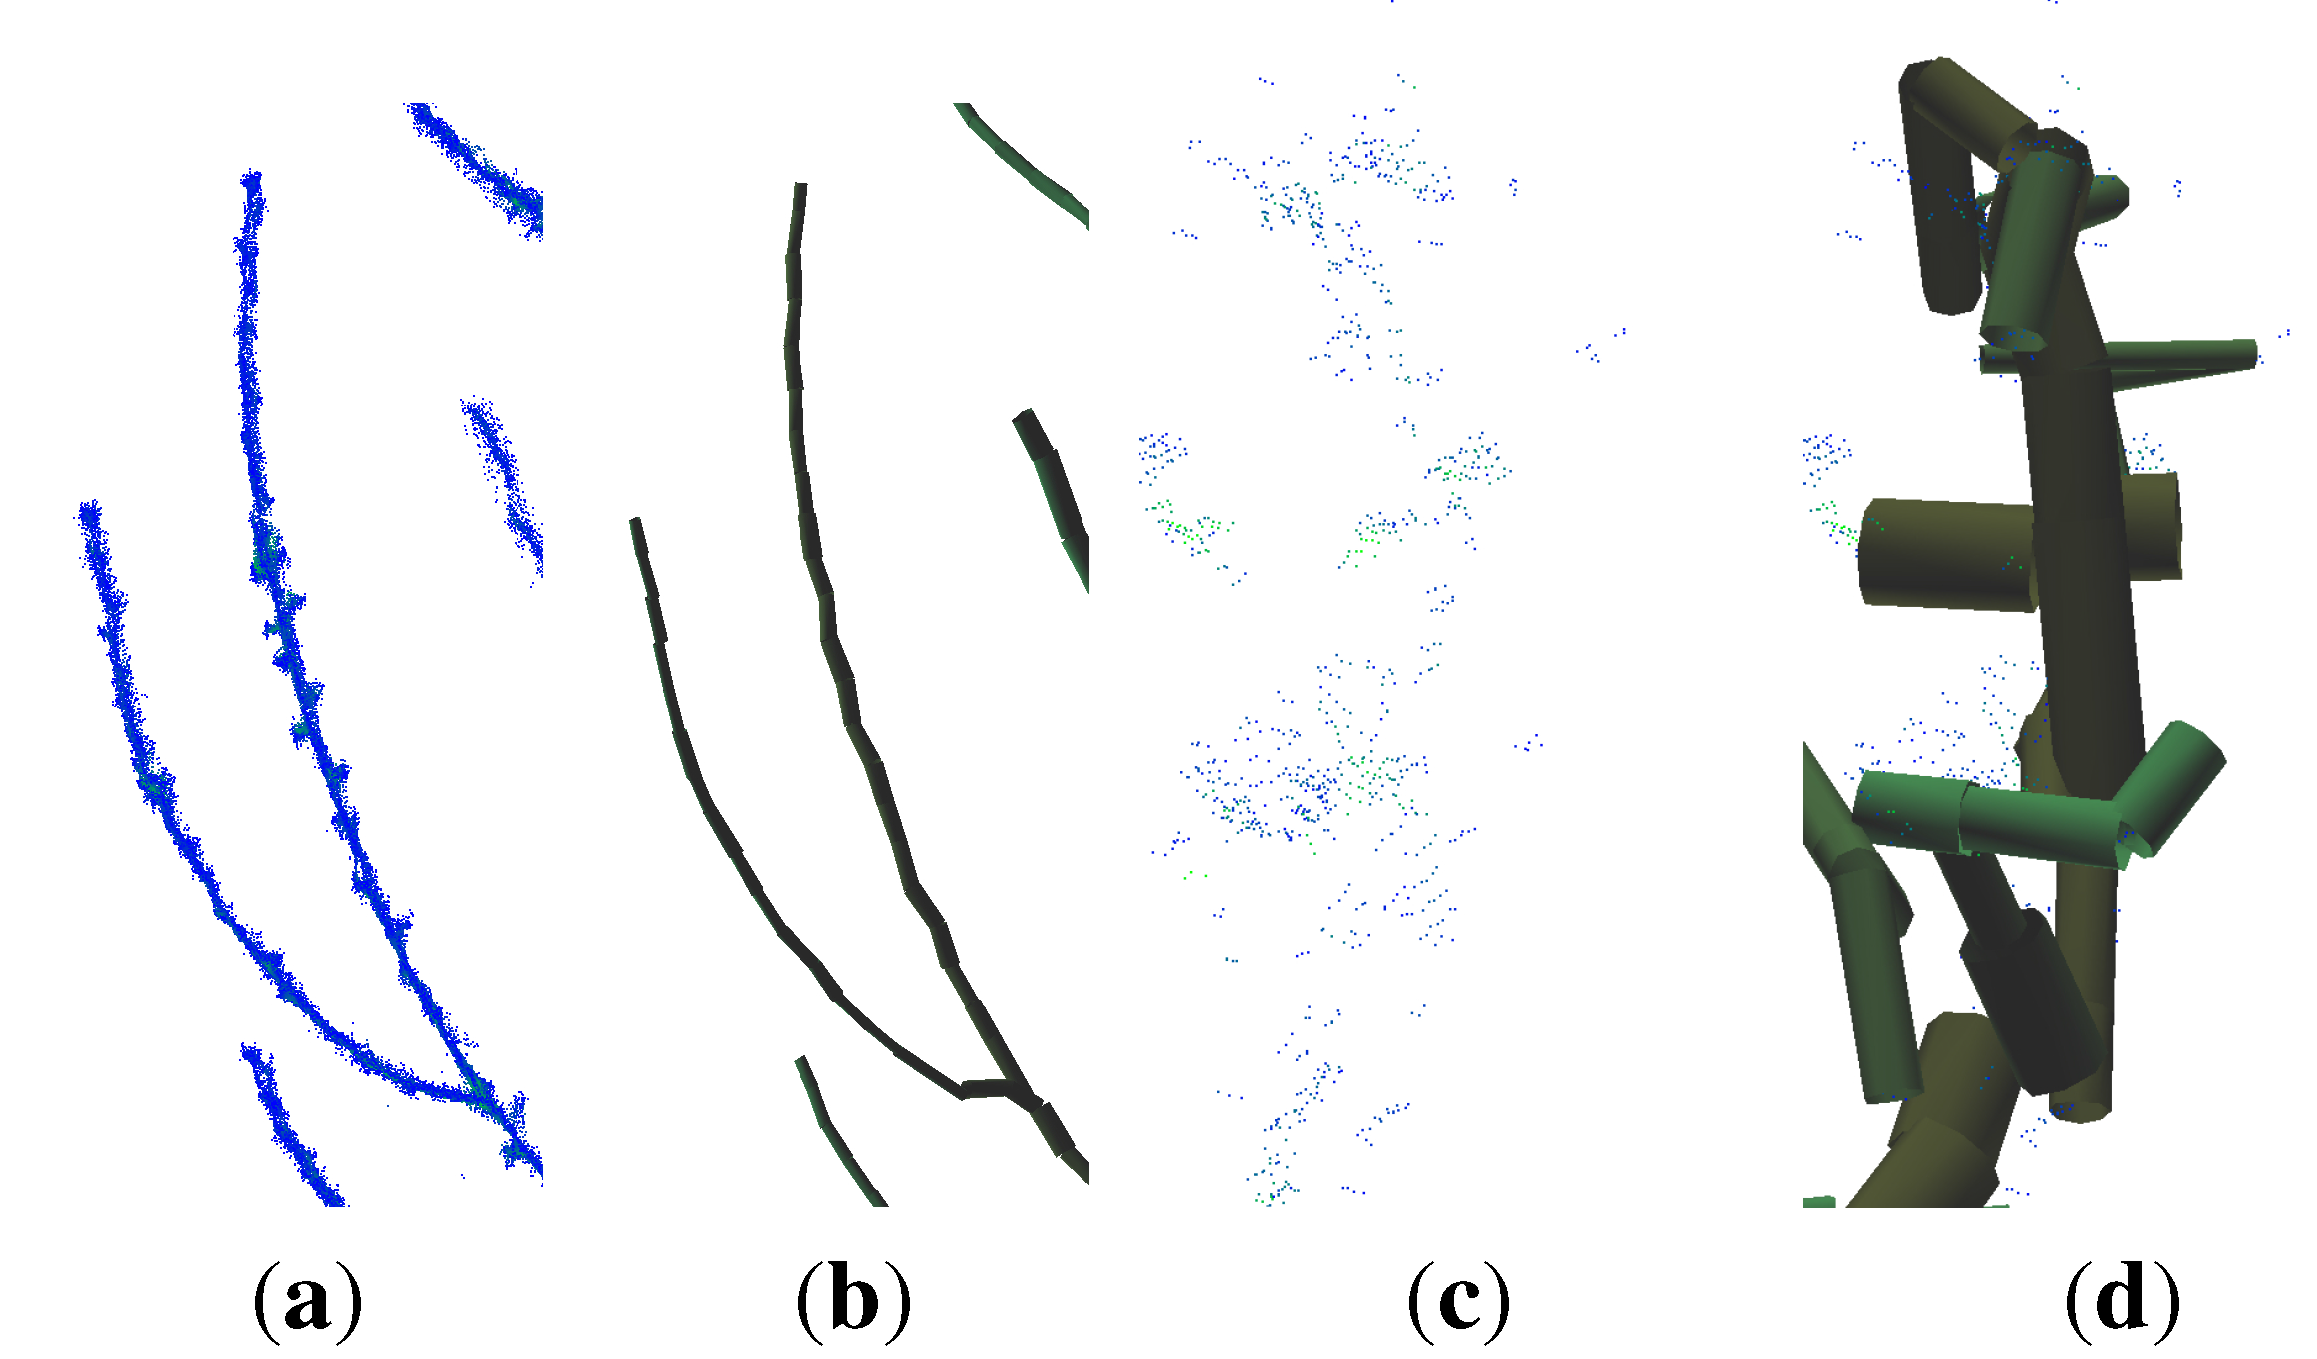
- points located at the tips of branches often scatter due to windy conditions during the scanning campaign; this circumstance leads to overestimated cylinders, an example can be seen in Figure 4.


4.2. Erytrophleum Fordii


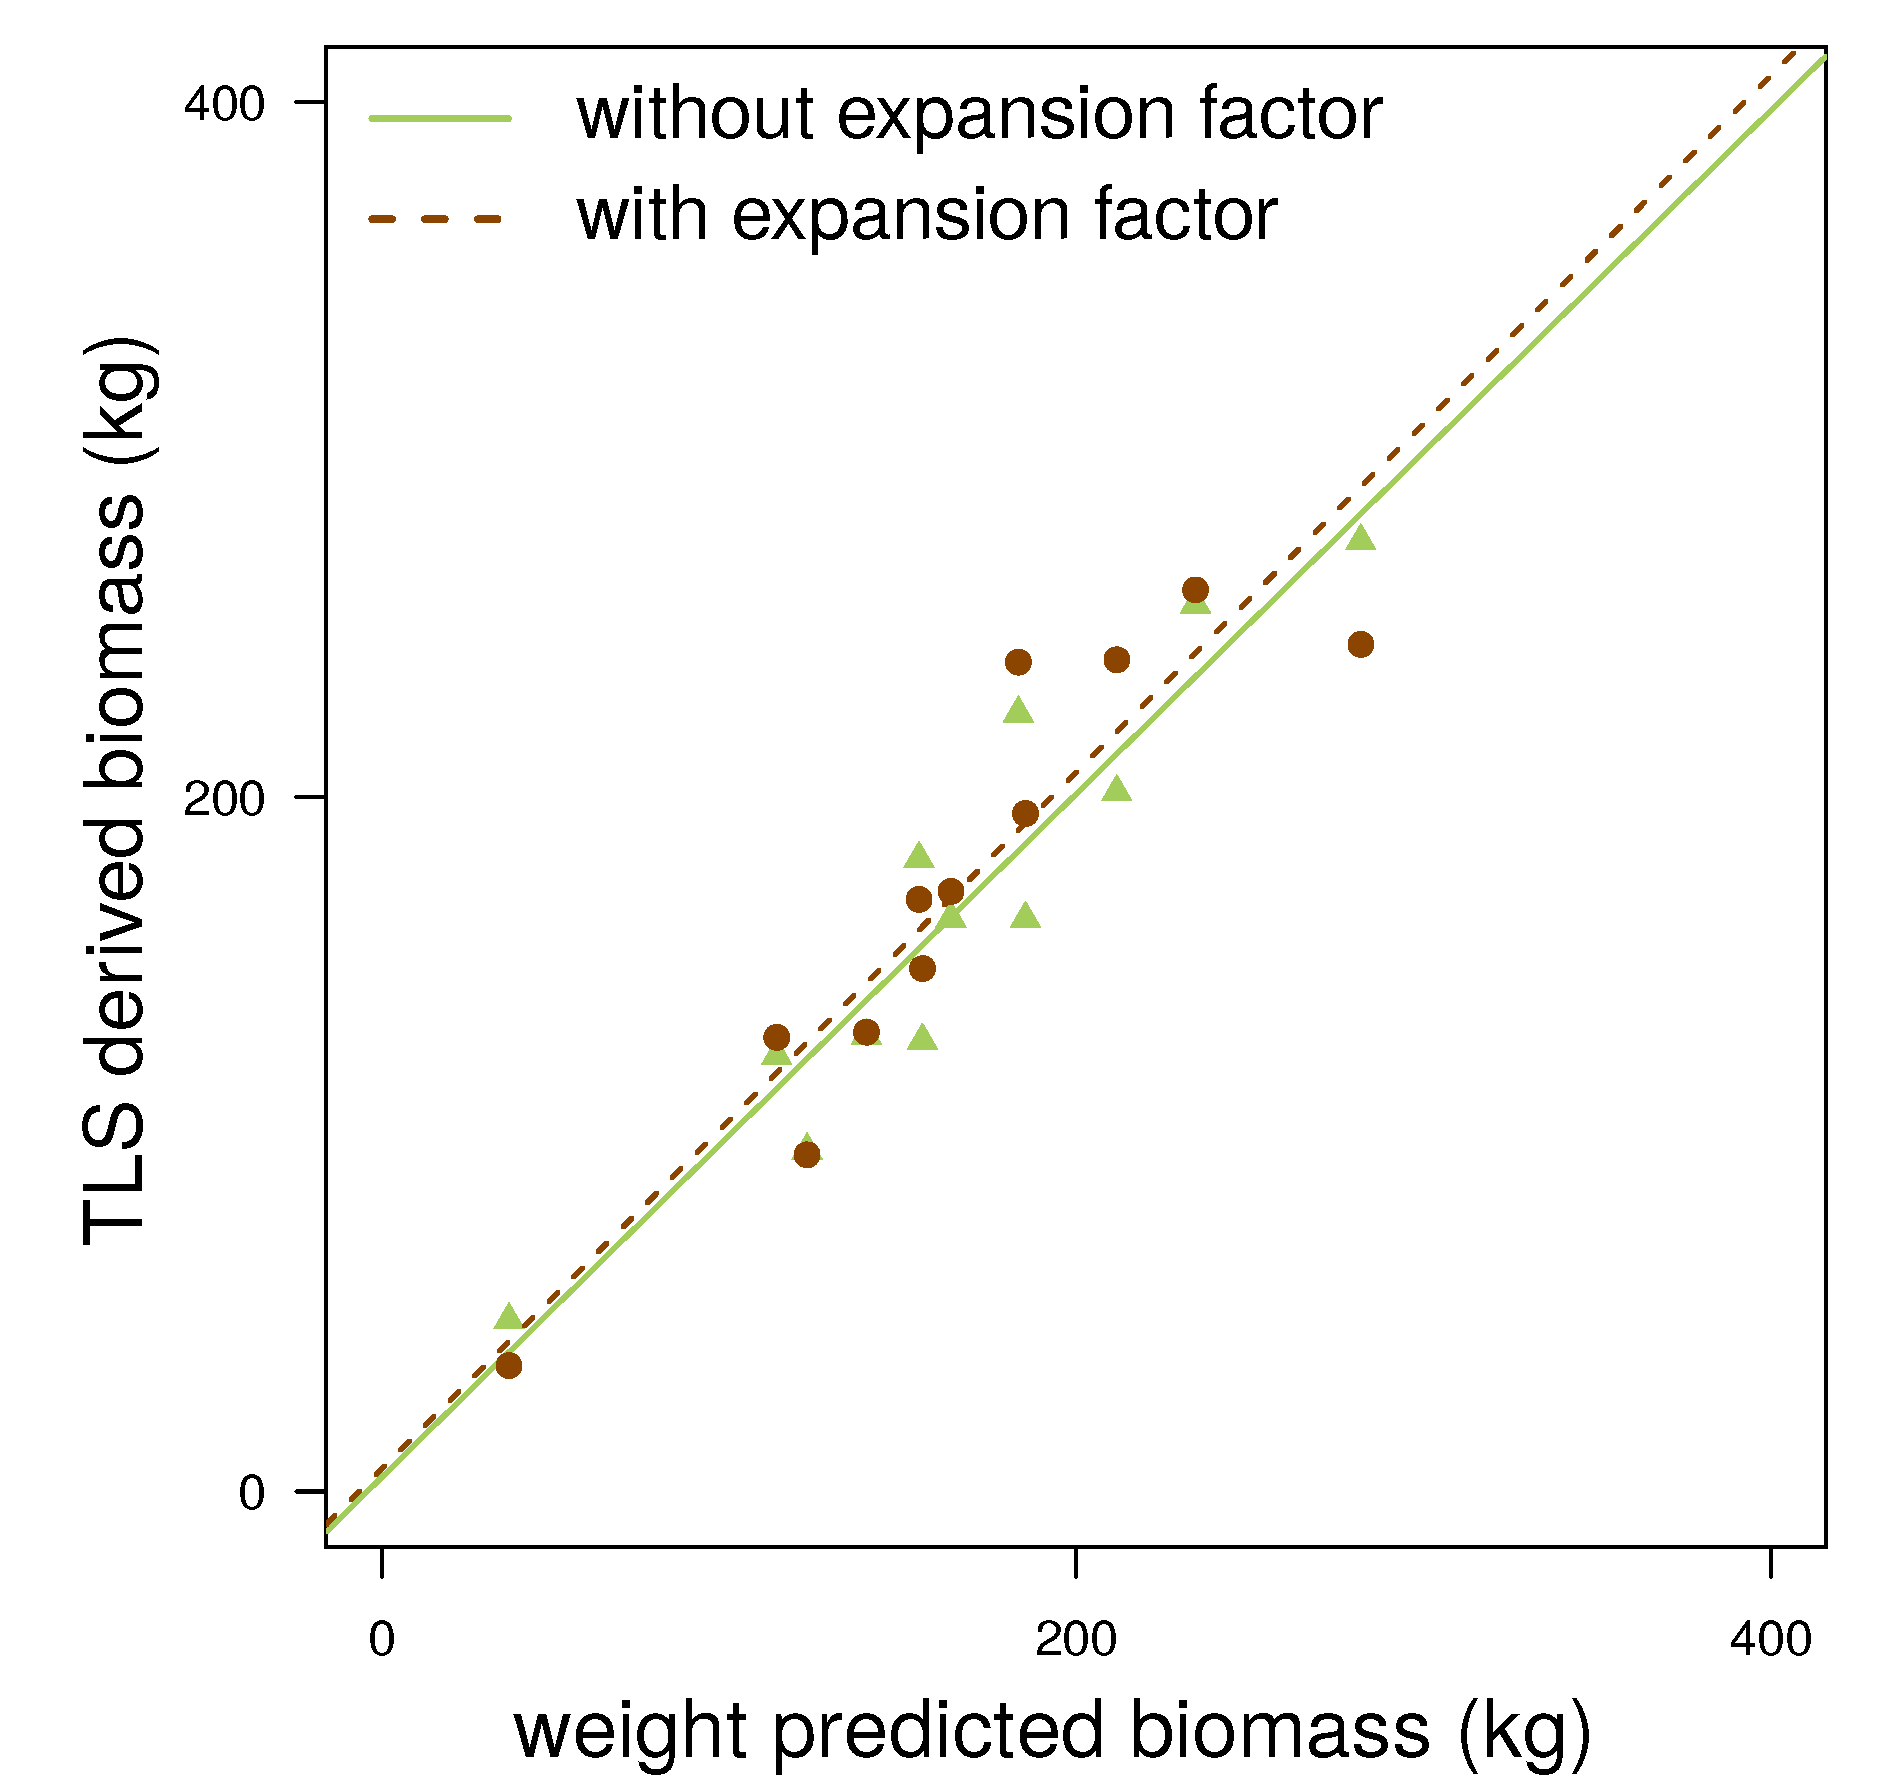
4.3. Pinus Massoniana

5. Discussion
6. Conclusions
7. Future Work
Acknowledgments
Author Contributions
Appendix
| ID | DBH1 (cm) | h1,2 (m) | densb (g cm −1) | BiomassTLS (kg) | BiomassTLS* (kg) | Biomassweight (kg) |
|---|---|---|---|---|---|---|
| Q1 | 24.52 | 25.52 | 0.53 | 429.84 | 403.97 | 458.82 |
| Q2 | 24.15 | 26.61 | 0.52 | 446.07 | 363.68 | 311.03 |
| Q3 | 31.66 | 29.04 | 0.52 | 921.26 | 694.49 | 595.32 |
| Q4 | 26.27 | 28.56 | 0.54 | 599.61 | 478.57 | 517.56 |
| Q5 | 28.71 | 24.80 | 0.53 | 793.11 | 533.35 | 412.24 |
| Q6 | 27.46 | 29.43 | 0.51 | 482.34 | 437.26 | 468.74 |
| Q7 | 24.02 | 27.22 | 0.52 | 518.93 | 388.39 | 366.09 |
| Q8 | 30.01 | 27.60 | 0.51 | 742.57 | 493.74 | 632.91 |
| Q9 | 29.22 | 31.10 | 0.52 | 803.47 | 680.51 | 581.76 |
| Q10 | 27.09 | 22.66 | 0.52 | 415.38 | 376.53 | 411.82 |
| Q11 | 25.71 | 25.81 | 0.51 | 694.15 | 427.44 | 452.16 |
| Q12 | 29.39 | 27.34 | 0.53 | 893.41 | 701.13 | 589.56 |
| ID | DBH1 (cm) | h1,2 (m) | densb (g cm−1) | BiomassTLS (kg) | BiomassTLS* (kg) | Biomassweight (kg) |
|---|---|---|---|---|---|---|
| E1 | 22.29 | 15.60 | 0.70 | 244.50 | 287.81 | 283.51 |
| E2 | 20.28 | 16.77 | 0.73 | 214.91 | 234.29 | 236.00 |
| E3 | 18.99 | 14.63 | 0.70 | 189.52 | 214.63 | 267.76 |
| E4 | 21.27 | 17.13 | 0.69 | 280.60 | 305.53 | 303.03 |
| E5 | 25.74 | 17.58 | 0.69 | 396.40 | 468.25 | 520.45 |
| E6 | 18.07 | 15.94 | 0.74 | 144.06 | 160.14 | 155.72 |
| E7 | 17.99 | 16.82 | 0.71 | 206.77 | 232.75 | 255.67 |
| E8 | 23.15 | 16.88 | 0.69 | 310.47 | 382.20 | 412.49 |
| E9 | 23.73 | 15.62 | 0.70 | 344.56 | 378.53 | 442.90 |
| E10 | 25.93 | 19.25 | 0.70 | 432.61 | 476.46 | 524.21 |
| E11 | 22.18 | 17.05 | 0.70 | 306.45 | 338.59 | 360.38 |
| E12 | 20.99 | 18.50 | 0.71 | 259.18 | 263.93 | 314.97 |
| ID | DBH1 (cm) | h1,2 (m) | densb (g cm−1) | BiomassTLS (kg) | BiomassTLS* (kg) | Biomassweight (kg) |
|---|---|---|---|---|---|---|
| P1 | 25.28 | 16.43 | 0.39 | 273.61 | 243.92 | 281.96 |
| P2 | 18.90 | 15.15 | 0.40 | 125.44 | 130.74 | 113.75 |
| P3 | 20.42 | 15.45 | 0.46 | 182.16 | 170.47 | 154.74 |
| P4 | 20.10 | 16.09 | 0.41 | 131.17 | 132.23 | 139.59 |
| P5 | 23.15 | 13.82 | 0.46 | 164.91 | 195.20 | 185.40 |
| P6 | 26.12 | 16.44 | 0.41 | 201.36 | 239.48 | 211.69 |
| P7 | 23.10 | 12.23 | 0.45 | 164.96 | 172.78 | 163.94 |
| P8 | 13.91 | 12.60 | 0.39 | 49.33 | 36.23 | 36.65 |
| P9 | 20.44 | 15.23 | 0.41 | 129.81 | 150.56 | 155.72 |
| P10 | 22.73 | 16.39 | 0.52 | 224.02 | 238.78 | 183.35 |
| P11 | 24.43 | 16.61 | 0.42 | 255.43 | 259.61 | 234.36 |
| P12 | 18.18 | 15.37 | 0.41 | 98.21 | 96.93 | 122.50 |
Conflicts of Interest
References
- IPCC. Agriculture, Forestry and Other Land Use (AFOLU). In Proceedings of the 39th session of the Intergovernmental Panel on Climate Change, Berlin, Germany, 7–11 April 2014. Chapter 11.
- Picard, N.; Saint-André, L.; Henry, M. Manual for Building Tree Volume and Biomass Allometric Equations: From Field Measurement to Prediction; Food and Agricultural Organization of the United Nations : Rome, Italy; Centre de Cooperation Internationale en Recherche Agronomique pour le Developpement: Montpellier, France, 2012. [Google Scholar]
- Zianis, D.; Seura, S.M. Biomass and Stem Volume Equations for Tree Species in Europe; Finnish Society of Forest Science,Finnish Forest Research Institute: Vantaa, Finland, 2005; Volume 4. [Google Scholar]
- GlobeAllomeTree. Available online: http://www.globallometree.org/ (accessed on 26 March 2015).
- Hackenberg, J.; Morhart, C.; Sheppard, J.; Spiecker, H.; Disney, M. Highly Accurate Tree Models Derived from Terrestrial Laser Scan Data: A Method Description. Forests 2014, 5, 1069–1105. [Google Scholar] [CrossRef]
- Leeuwen, M.; Nieuwenhuis, M. Retrieval of forest structural parameters using LiDAR remote sensing. Eur. J. For. Res. 2010, 129, 749–770. [Google Scholar] [CrossRef]
- Simonse, M.; Aschoff, T.; Spiecker, H.; Thies, M. Automatic determination of forest inventory parameters using terrestrial laser scanning. In Proceedings of the ScandLaser Scientific Workshop on Airborne Laser Scanning of Forests, Umea, Sweden, 19 September 2003; pp. 252–258.
- Thies, M.; Pfeifer, N.; Winterhalder, D.; Gorte, B.G. Three-dimensional reconstruction of stems for assessment of taper, sweep and lean based on laser scanning of standing trees. Scand. J. For. Res. 2004, 19, 571–581. [Google Scholar] [CrossRef]
- Bienert, A.; Scheller, S.; Keane, E.; Mullooly, G.; Mohan, F. Application of terrestrial laser scanners for the determination of forest inventory parameters. In Proceedings of the International Archives of Photogrammetry,Remote Sensing and Spatial Information Sciences, Dresden, Germany, 25–27 September 2006. Volume 36.
- Moskal, L.M.; Zheng, G. Retrieving Forest Inventory Variables with Terrestrial Laser Scanning (TLS) in Urban Heterogeneous Forest. Remote Sens. 2011, 4, 1–20. [Google Scholar] [CrossRef]
- Pfeifer, N.; Gorte, B.; Winterhalder, D. Automatic reconstruction of single trees from terrestrial laser scanner data. In Proceedings of the 20th ISPRS Congress, Istanbul,Turkey, 12–23 July 2004; pp. 114–119.
- Tansey, K.; Selmes, N.; Anstee, A.; Tate, N.J.; Denniss, A. Estimating tree and stand variables in a Corsican Pine woodland from terrestrial laser scanner data. Int. J. Remote Sens. 2009, 30, 5195–5209. [Google Scholar] [CrossRef]
- Eysn, L.; Pfeifer, N.; Ressl, C.; Hollaus, M.; Grafl, A.; Morsdorf, F. A Practical Approach for Extracting Tree Models in Forest Environments Based on Equirectangular Projections of Terrestrial Laser Scans. Remote Sens. 2013, 5, 5424–5448. [Google Scholar] [CrossRef]
- Bayer, D.; Seifert, S.; Pretzsch, H. Structural crown properties of Norway spruce (Picea abies [L.] Karst.) and European beech (Fagussylvatica [L.]) in mixed versus pure stands revealed by terrestrial laser scanning. Trees 2013, 27, 1035–1047. [Google Scholar] [CrossRef]
- Edelsbrunner, H.; Mücke, E.P. Three-dimensional Alpha Shapes. ACM Trans. Graph. 1994, 13, 43–72. [Google Scholar] [CrossRef]
- Dassot, M.; Colin, A.; Santenoise, P.; Fournier, M.; Constant, T. Terrestrial laser scanning for measuring the solid wood volume, including branches, of adult standing trees in the forest environment. Comput. Electron. Agric. 2012, 89, 86–93. [Google Scholar] [CrossRef]
- Bucksch, A.; Lindenbergh, R. {CAMPINO} A skeletonization method for point cloud processing. ISPRS J. Photogramm. Remote Sens. 2008, 63, 115–127. [Google Scholar] [CrossRef]
- Bucksch, A.; Lindenbergh, R.; Menenti, M. SkelTre. Vis. Comput. 2010, 26, 1283–1300. [Google Scholar] [CrossRef]
- Bucksch, A. Revealing the Skeleton from Imperfect Point Clouds. Ph.D. Thesis, Technische Universiteit Delft, Delft, The Netherlands, 2011. [Google Scholar]
- Meagher, D. Geometric modeling using octree encoding. Comput. Graph. Image Process. 1982, 19, 129–147. [Google Scholar] [CrossRef]
- Xu, H.; Gossett, N.; Chen, B. Knowledge and Heuristic-based Modeling of Laser-scanned Trees. ACM Trans. Graph. 2007, 26. [Google Scholar] [CrossRef]
- Dijkstra, E. A note on two problems in connexion with graphs. Numer. Math. 1959, 1, 269–271. [Google Scholar] [CrossRef]
- Livny, Y.; Yan, F.; Olson, M.; Chen, B.; Zhang, H.; El-Sana, J. Automatic Reconstruction of Tree Skeletal Structures from Point Clouds. ACM Trans. Graph. 2010, 29, 151:1–151:8. [Google Scholar] [CrossRef]
- Belton, D.; Moncrieff, S.; Chapman, J. Processing Tree Point Clouds Using Gaussian Mixture Models. In Proceedings of the ISPRS Annals of the Photogrammetry,Remote Sensing and Spatial Information Sciences, Antalya, Turkey, 11–13 November 2013; Volume II-5/W2, pp. 43–48.
- Reynolds, D. Gaussian Mixture Models. Encyclopedia of Biometrics; Springer Science + Business Media: New York, NY, USA, 2009; pp. 659–663. [Google Scholar]
- Raumonen, P.; Kaasalainen, M.; Åkerblom, M.; Kaasalainen, S.; Kaartinen, H.; Vastaranta, M.; Holopainen, M.; Disney, M.; Lewis, P. Fast automatic precision tree models from terrestrial laser scanner data. Remote Sens. 2013, 5, 491–520. [Google Scholar] [CrossRef]
- Kaasalainen, S.; Krooks, A.; Liski, J.; Raumonen, P.; Kaartinen, H.; Kaasalainen, M.; Puttonen, E.; Anttila, K.; Mäkipää, R. Change Detection of Tree Biomass with Terrestrial Laser Scanning and Quantitative Structure Modelling. Remote Sens. 2014, 6, 3906–3922. [Google Scholar] [CrossRef]
- Calders, K.; Newnham, G.; Burt, A.; Murphy, S.; Raumonen, P.; Herold, M.; Culvenor, D.; Avitabile, V.; Disney, M.; Armston, J.; et al. Nondestructive estimates of above-ground biomass using terrestrial laser scanning. Methods Ecol. Evol. 2015, 6, 198–208. [Google Scholar] [CrossRef]
- Dassot, M.; Constant, T.; Fournier, M. The use of terrestrial LiDAR technology in forest science: Application fields, benefits and challenges. Ann. For. Sci. 2011, 68, 959–974. [Google Scholar] [CrossRef]
- Fayolle, A.; Doucet, J.-L.; Gillet, J.-F.; Bourland, N.; Lejeune, P. Tree allometry in Central Africa: Testing the validity of pantropical multi-species allometric equations for estimating biomass and carbon stocks. For. Ecol. Manag. 2013, 305, 29–37. [Google Scholar] [CrossRef]
- Ketterings, Q.M.; Coe, R.; Noordwijk, M.V.; Ambagau, Y.; Palm, C.A. Reducing uncertainty in the use of allometric biomass equations for predicting above-ground tree biomass in mixed secondary forests. For. Ecol. Manag. 2001, 146, 199–209. [Google Scholar] [CrossRef]
- Henry, M.; Besnard, A.; Asante, W.A.; Eshun, J.; Adu-Bredu, S.; Valentini, R.; Bernoux, M.; Saint-Andre, L. Wood density, phytomass variations within and among trees, and allometric equations in a tropical rainforest of Africa. For. Ecol. Manag. 2010, 260, 1375–1388. [Google Scholar] [CrossRef]
- Wassenberg, M.; Chiu, H.-S.; Guo, W.; Spiecker, H. Analysis of wood density profiles of tree stems: incorporating vertical variation to optimize wood sampling strategies for density and biomass estimations. Trees-Struct. Funct. 2014. [Google Scholar] [CrossRef]
- Wassenberg, M.; Montwé, D.; Kahle, H.P.; Spiecker, H. Exploring High Frequency densitometry calibration functions for different tree species. Dendrochronologia 2014, 32, 273–281. [Google Scholar] [CrossRef]
- Petersson, H.; Holm, S.; Stahl, G.; Alger, D.; Fridman, J.; Lehtonen, A.; Lundström, A.; Mäkipää, R. Individual tree biomass equations or biomass expansion factors for assessment of carbon stock changes in living biomass—A comparative study. For. Ecol. Manag. 2012, 270, 78–84. [Google Scholar] [CrossRef]
- Teobaldelli, M.; Somogyi, Z.; Migliavacca, M.; Usoltsev, V. A. Generalized functions of biomass expansion factors for conifers and broadleaved by stand age, growing stock and site index. For. Ecol. Manag. 2009, 257, 1004–1013. [Google Scholar] [CrossRef]
- Data Sheet Z + F IMAGER. 5010. Available online: http://www.zf-laser.com/fileadmin/editor/Datenblaetter/Datasheet_Z_F_IMAGER_5010_E_kompr_01.pdf (accessed on 24 September 2014).
- Data Sheet Z + F IMAGER. 5010. Available online: http://www.zf-laser.com/fileadmin/editor/Datenblaetter/Datenblatt_Z_F_IMAGER_5010C_D_kompr.pdf (accessed on 24 September 2014).
- Data Sheet Laser Control. Available online: http://www.zf-laser.com/fileadmin/editor/Broschueren/Z_F_LaserControl_kompr.pdf (accessed on 24 September 2014).
- SimpleTree Project. Available online: http://www.simpletree.uni-freiburg.de/ (accessed on 26 March 2015).
- Schinker, M.G.; Hansen, N.; Spiecker, H. High-frequency densitometry—A new method for the rapid evaluation of wood density variations. IAWA J. 2003, 24, 231–239. [Google Scholar] [CrossRef]
- Wiemann, C.M.; Williamson, G.B. Testing a Novel Method to Approximate Wood Specific Gravity of Trees. For. Sci. 2012, 58, 577. [Google Scholar]
- Ester, M.; Kriegel, H.P.; Sander, J.; Xu, X. A Density-Based Algorithm for Discovering Clusters in Large Spatial Databases with Noise. In Proceedings of the Second International Conference on Knowledge Discovery and Data Mining,, Portland, OR, USA, 2–4 August 1996; pp. 226–231.
- Kukko, A.; Kaasalainen, S.; Litkey, P. Effect of incidence angle on laser scanner intensity and surface data. Appl. Opt. 2008, 47, 986–992. [Google Scholar] [CrossRef] [PubMed]
- Pesci, A.; Teza, G. ; Effects of surface irregularities on intensity data from laser scanning: An experimental approach. Ann. Geophys. 2008. [Google Scholar] [CrossRef]
- Pfeifer, N.; Dorninger, P.; Haring, A.; Fan, H. Investigating terrestrial laser scanning intensity data: Quality and functional relations. In Proceedings of the International Conference on Optical 3-D Measurement Techniques VIII, Zürich,Switzerland, 11 July 2007.
- Rusu, R.D. Semantic 3D Object Maps for Everyday Manipulation in Human Living Environments. Ph.D. Thesis, Computer Science Department, Technische Universitaet Muenchen, Muenchen, Germany, 2009. [Google Scholar]
© 2015 by the authors; licensee MDPI, Basel, Switzerland. This article is an open access article distributed under the terms and conditions of the Creative Commons Attribution license (http://creativecommons.org/licenses/by/4.0/).
Share and Cite
Hackenberg, J.; Wassenberg, M.; Spiecker, H.; Sun, D. Non Destructive Method for Biomass Prediction Combining TLS Derived Tree Volume and Wood Density. Forests 2015, 6, 1274-1300. https://doi.org/10.3390/f6041274
Hackenberg J, Wassenberg M, Spiecker H, Sun D. Non Destructive Method for Biomass Prediction Combining TLS Derived Tree Volume and Wood Density. Forests. 2015; 6(4):1274-1300. https://doi.org/10.3390/f6041274
Chicago/Turabian StyleHackenberg, Jan, Marc Wassenberg, Heinrich Spiecker, and Dongjing Sun. 2015. "Non Destructive Method for Biomass Prediction Combining TLS Derived Tree Volume and Wood Density" Forests 6, no. 4: 1274-1300. https://doi.org/10.3390/f6041274
APA StyleHackenberg, J., Wassenberg, M., Spiecker, H., & Sun, D. (2015). Non Destructive Method for Biomass Prediction Combining TLS Derived Tree Volume and Wood Density. Forests, 6(4), 1274-1300. https://doi.org/10.3390/f6041274