Article

Effects of Buffering Key Habitat for Terrestrial Salamanders: Implications for the Management of the Federally Threatened Red Hills Salamander (Phaeognathus hubrichti) and Other Imperiled Plethodontids

by
Joseph J. Apodaca
1,* and
James C. Godwin
2
1
Department of Environmental Studies and Biology, Warren Wilson College, Asheville, NC 28815-9000, USA
2
Alabama Natural Heritage Program, Auburn University, Auburn, AL 36849, USA
*
Author to whom correspondence should be addressed.
Forests 2015, 6(3), 827-838; https://doi.org/10.3390/f6030827
Submission received: 1 October 2014 / Accepted: 16 March 2015 / Published: 20 March 2015

Abstract

:
Forestry practices are placing ever increasing emphasis on sustainability and the maintenance of ecological processes, biodiversity, and endangered species or populations. Balancing timber harvest and the management of imperiled species presents a particularly difficult challenge during this shift, as we often know very little about these species’ natural history and how and why silviculture practices affect their populations. Accordingly, investigation of and improvement on current management practices for threatened species is imperative. We investigated the effectiveness of habitat buffers as a management technique for the imperiled Red Hills salamander (Phaeognathus hubrichti) by combining genetic, transect, and body-condition data. We found that populations where habitat buffers have been employed have higher genetic diversity and higher population densities, and individuals have better overall body condition. These results indicate that buffering the habitat of imperiled species can be an effective management tool for terrestrial salamanders. Additionally, they provide further evidence that leaving the habitat of imperiled salamanders unbuffered can have both immediate and long-term negative impacts on populations.

1. Introduction

Silviculture practices in temperate regions can have a wide range of negative effects on species richness and abundance [1,2,3,4,5,6], but the face of forestry is changing rapidly, placing more emphasis on sustainability and the maintenance of ecological processes, biodiversity, and endangered species or populations [7,8,9]. Implementing management for imperiled species that balances the needs of silviculture with the needs of the presents a particularly difficult challenge during this shift, as we often know very little about rare species' natural history and how and why timber management practices affect their populations. Accordingly, investigation of and improvement on current management practices for threatened species is imperative.
Often, management practices for imperiled species are implemented without solid evidence that they lead to species recovery, wasting conservation efforts and reducing harvest unnecessarily [7]. This has frequently been the case for amphibians, whose complex life histories make prediction of the effects of habitat fragmentation difficult [9,10]. The Red Hills salamander (Phaeognathus hubrichti) is a textbook example of a species whose continued existence relies on effective habitat management, yet to date no studies have directly investigated the long-term effects of management practices.
Phaeognathus hubrichti is a U.S. federally listed (IUCN endangered [10]) species, endemic to a small (<150 km2) region in the Red Hills of southern Alabama, USA. It is restricted to steep (generally >20°) mature hardwood or mixed conifer slopes, where individuals build their characteristic burrow entrances [11,12]. Individual salamanders spend nearly all of their time, including foraging and development of young, underground or at the entrances to their extensive burrows [13,14]. Destruction and fragmentation of habitat is the major force behind P. hubrichti’s decline and its continued small population sizes [11,12,15,16,17,18]. Because the vast majority of P. hubrichti habitat is within active timber plantations, understanding how management of the remaining habitat affects the current and long-term status of the species is fundamental to its recovery. Typical management guidelines for the species are outlined in habitat conservation plans (HCPs), an agreement maintained by industrial forest landowners in partnership with the US Fish and Wildlife Service. Currently, the range of P. hubrichti is thought to encompass eight areas covered by standing HCPs (J. Smithem, personal communication). The majority of HCP guidelines are derived from recommendations made by Dodd [11] and are based on transect data that focused on the abundance of burrows.
Dodd [11] suggested that the surrounding habitat matrix had a large impact on P. hubrichti populations. His data revealed that heavy ridge-top timber harvest, up to the edge of salamander habitat, resulted in the loss of salamander burrows on the top third of slope habitat. In contrast, locations with a ridge-top buffer harbored salamander burrows on the top two-thirds of the slope. Burrows were uncommon on the lower third of the slope at all sites [11]. Buffered sites therefore theoretically provided twice the amount of habitat provided by unbuffered sites. Accordingly, one of Dodd’s [11] foremost habitat-management recommendations was to provide a buffer above and below remaining salamander habitat during timber harvest. However, not all HCPs follow this recommendation. Furthermore, the effects of a habitat buffer have not been empirically tested, and whether buffers provide a long-term solution for Red Hills salamander management remains unknown, as does whether populations can easily recover from unbuffered timber harvest.
If buffering habitat benefits the species, we would expect to see higher genetic diversity, burrow density, and average body-condition indices (BCIs, an indicator of salamander health and fecundity; see [19,20,21]) at buffered sites, but individuals at unbuffered sites may simply be moving and establishing burrows in the remaining suitable midslope habitat (the retreat hypothesis; [22]). In the latter case we would expect to see similar genetic diversity, burrow density, and BCIs at buffered and unbuffered sites. In addition, we would expect the distribution of burrow entrances to be more clumped at unbuffered sites. Of course, all of these factors can also be correlated to other influences, such as habitat area and management history. However, given that P. hubrichti inhabit a very narrow portion of available slope habitat, generally less than 100 meters, even large habitat patches may be affected by a lack of buffers. Thus, evaluating habitat buffer provides much needed data for the management of public lands and to help guide HCP recommendations.
The objective of our study was to determine whether unbuffered P. hubrichti sites differed from relatively undisturbed buffered sites in burrow distribution and burrow density, salamander body condition, and genetic variability. Specifically, we asked the following questions: (1) Do salamanders at buffered and unbuffered sites differ in extent of genetic diversity or in level of inbreeding? (2) Do buffered and unbuffered sites differ significantly in burrow density? (3) Do buffered and unbuffered sites differ in the aggregation patterns of burrows? (4) Do individuals from buffered and unbuffered sites differ in overall body condition? We also explore the relationship between slope angle and burrow density and aggregation.

2. Experimental Section

2.1. Field Data Collection

Fifteen P. hubrichti sites were selected, 7 buffered and 8 unbuffered (Table 1) from all known locations for this species. We selected buffered sites on the basis of the presence of a relatively intact and mature band of forest of at least 10 m above and below slope habitat. Sites selected were distributed across four of the six Alabama counties known to harbor P. hubrichti: Butler, Conecuh, Monroe, and Wilcox. For each site we conducted line transects to estimate burrow density and distribution on the slope; standard location was taken on each transect. A more detailed description of transect methods can be found in Godwin 2008 [17]. Because of their straightforward identification, burrow entrances can readily be used to survey for P. hubrichti presence and population densities (see, e.g., [11,17]). Though there is some risk of overestimating population density using this method due to the presence of unused burrows, it is generally easy to identify currently occupied burrows by their smooth entrances. Overall slope angle, transect length, and slope aspect were recorded for each transect. Each burrow within 1 m on either side of the transect center line was recorded. For each burrow, we recorded distance from the end and distance and direction from the center line of the transect. We also collected salamander tissue samples from several sites for genetic analysis (Table 1). Salamanders were captured with a size 16 barbless hook and monofilament line using the technique introduced by Mount and Schwaner [23]. For each salamander, we collected a small tissue sample from the tail and stored it in 95% ethanol for preservation. In addition, the standard measurements of snout-vent length (SVL), mass, tail length and width, and sex were recorded. From mass and SVL, an averaged BCI for the population was calculated on the basis of the individual BCI [24]:
BCI = salamander mass/salamander SVL
All juveniles, females with eggs, and individuals with damaged tails were excluded from the BCI analysis.
Table 1. Red Hills salamander (Phaeognathus hubrichti) sites used in this study, in Alabama, USA. Buffered sites are those with buffers of at least 10 m of land above and below the sloped site that are protected from forestry practices.
SiteCountyBufferedBurrow density (burrows/m2)Total number of transects analyzedTotal # of transects analyzed
Hwy 21MonroeN0.344806
McKenzie 14ButlerN0.295876
Pigeon Creek 15ButlerN0.675797
Pigeon Creek 21EButlerN0.3771416
Skinnerton EConecuhN0.249376
Vredenburg 2MonroeN0.3101315
WH 1WilcoxN0.495385
WH ConecuhConecuhN0.754766
Forever Wild 1MonroeY0.7472459
Forever Wild 2MonroeY0.500756
Forever Wild 3MonroeY0.7301007
Haines IslandMonroeY0.89632812
Sepulga RiverConecuhY0.2927614
WH 2WilcoxY0.362444
WilmonMonroeY0.6861108

2.2. Genetic Analyses

We used the Qiagen DNeasy tissue kit and protocol (Qiagen, Valencia, CA USA) to extract DNA from all tissue samples. We amplified eight microsatellite markers using polymerase chain reaction (PCR). Each primer was developed specifically for use with P. hubrichti [25]. Information on each primer as well as PCR conditions can be found in Lance et al. [25]. Each locus was amplified individually and labeled PCR products were run on an ABI 3730 Genetic Analyzer. Samples were genotyped with GeneMapper 3.7 software (Applied Biosystems). Scoring and quality control of data were conducted with GeneMarker V. 1.7 (Softgenetics). Microchecker V2.2.3 [26] was used to check for possible null alleles, linkage disequilibrium, and scoring errors. Quality and repeatability of data were tested by regenotyping of 10 individuals per locus. This test resulted in a repeatability success rate of >99%.
For genetic diversity analyses we pooled individuals by site. Allelic richness, observed heterozygosity (Ho), and FIS (inbreeding coefficient) were calculated in FSTAT version 2.9.3 [27]. A permutation scheme was used to determine whether habitat types differed significantly in allelic richness, Ho, or FIS. Individuals and their respective genotypes were allocated at random to each group (the number of samples in each group was kept constant) 1,000 times. The p-value was calculated as the proportion of randomized sets of data giving higher allelic richness and Ho for buffered sites and a higher and FIS for unbuffered sites. Permutations were done in FSTAT version 2.9.3 [27].

2.3. Transect Data Analyses

Using the transect data, we calculated burrow density (number of salamander burrows per square meter of surveyed transect area) and two indices of aggregation. To remove any random bias that might have resulted from the selection of transect starting points, we used only transects along which more than 10 burrows had occurred, hereafter referred to as burrow-rich transects. This procedure also insured that we compared only the likely highest-quality habitat from both buffered and unbuffered sites. These data are therefore probably a conservative estimate of the differences between the buffered and unbuffered sites. However, to ensure that this approach did not skew the results, we also ran the analysis with all transects that had at least one burrow. Since the results did not differ significantly, we report results from the original analysis below.
We calculated the index of dispersion (ID) and the index of mean crowding (IMC) [28] for each transect to evaluate the level of aggregation that P. hubrichti burrows exhibited at each site. We calculated these matrices by converting each transect into a series of 1-m2 plots. ID is useful in comparing the aggregation of populations because it is independent of mean burrow density [29]. IMC can be thought of as the average number of individuals found within the same plot as a randomly selected focal individual. These indices provide us with an estimate of how individuals are responding in a spatial context. For example, using these matrices, we can infer whether individuals at an unbuffered site are clumping together in the remaining suitable habitat (i.e., show a higher ID) or whether habitat disturbances cause individuals to be less aggregated (i.e., show a lower ID) than at a buffered site. ID and IMC were calculated with the spatial statistics program PASSaGE 2 [30].

2.4. Comparison of Buffered and Unbuffered Habitats

In order to compare the means between buffered and unbuffered sites, we ran a series of least-squares means regressions and nested analyses of variance (ANOVAs) with site as a random factor nested within treatment. All variables were tested for normality and homoscedasticity before statistical analysis. Non-normal variables were either square root (ID and IMC) or log10 transformed (burrow density, length, and BCI) to normality. Transects were pooled by site status (buffered or unbuffered) for all statistical tests. Given that we found a strong relationship between slope and burrow density, we ran an analysis of covariance (ANCOVA), again with site as a random factor, to determine whether the density of salamander burrows at unbuffered sites was significantly different than that at buffered sites when we accounted for slope angle. We also ran a least-squares means ANOVA to determine whether males and females differed significantly in BCI value, because P. hubrichti is known to exhibit sexual dimorphism [31]. Given that BCI has been shown to exhibit biases that can lead to misinterpretations of data, we also used the residual index method as suggested by Jakob et al. [32].

2.5. General Patterns

We pooled all transects to get a general picture of the factors that influence P. hubrichti abundance. We ran a series of regression analyses to investigate the relationship between habitat and burrow characteristics. Specifically, we used least squares means regressions to examine the effect of slope angle on burrow density, ID, and IMC.

3. Results and Discussion

3.1. Genetic Diversity

We collected a total of 110 tissue samples (54 from buffered and 56 from unbuffered sites) from 10 sites (5 buffered and 5 unbuffered; Table 2). Allelic richness was significantly higher at buffered sites (p = 0.02; total allelic richness: buffered sites = 82, unbuffered sites = 70). Buffered sites had a total allelic richness of 82, while unbuffered sites had a richness of 70. Buffered and unbuffered sites did not differ significantly in FIS or Ho (p = 0.5 and p = 0.45; Table 2).
Table 2. Genetic data from the sites used in this study. Ho, observed heterozygosity.
SiteBufferedTissue samplesFixation index (FIS)Ho population meanHo population standard deviationTotal number of alleles
Hwy 21N120.1980.530.1930
Pigeon CreekN120.0410.450.3216
Vredenburg 2N80.2290.450.3230
WH 1N100.130.550.2232
WH ConecuhN140.0750.590.2128
Forever Wild 1Y110.0240.590.2831
Forever Wild 2Y120.0290.590.2639
Haines IslandY110.0270.550.2149
Sepulga RiverY100.0230.540.2135
WilmonY100.1050.540.2237

3.2. Transect Data

In total, we collected data from 1647 transects across the 15 sites (mean 109.8 transects/site; Table 1). Only 107 of the total transects were “burrow-rich transects” and thus were used to calculate ID, IMC, and burrow density (60 at buffered sites, 47 at unbuffered sites; mean of 7.13/site).

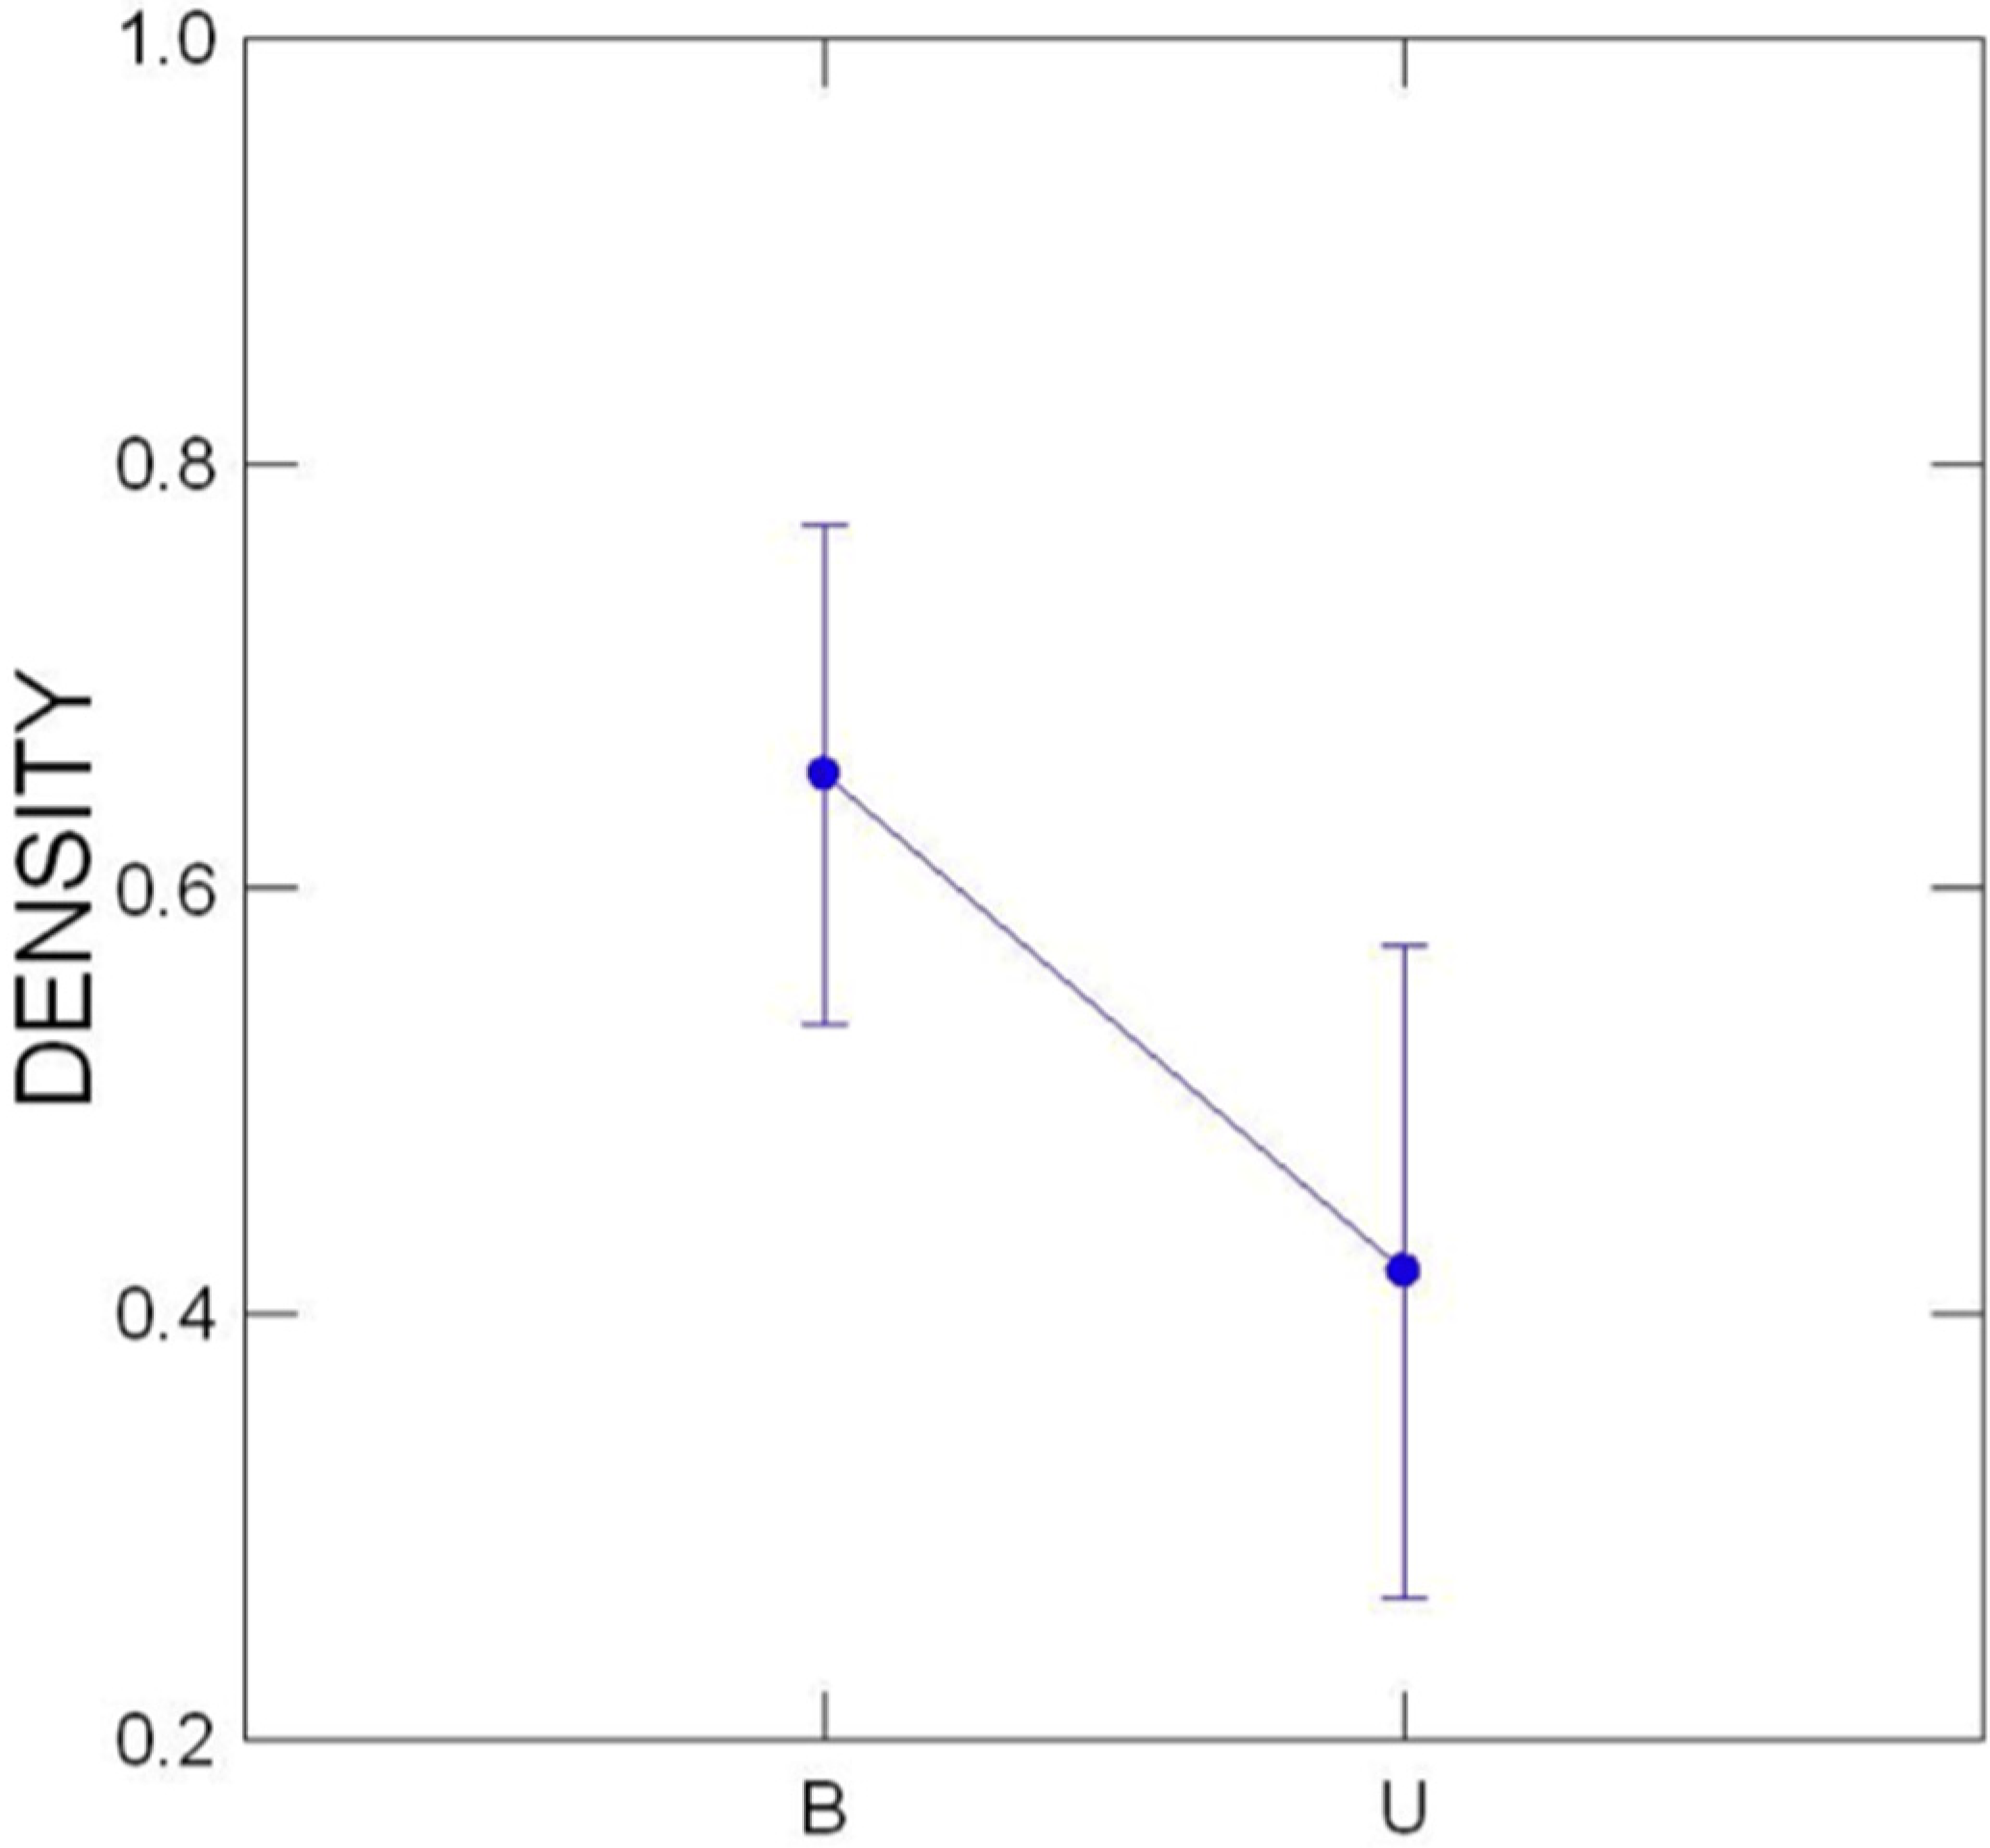
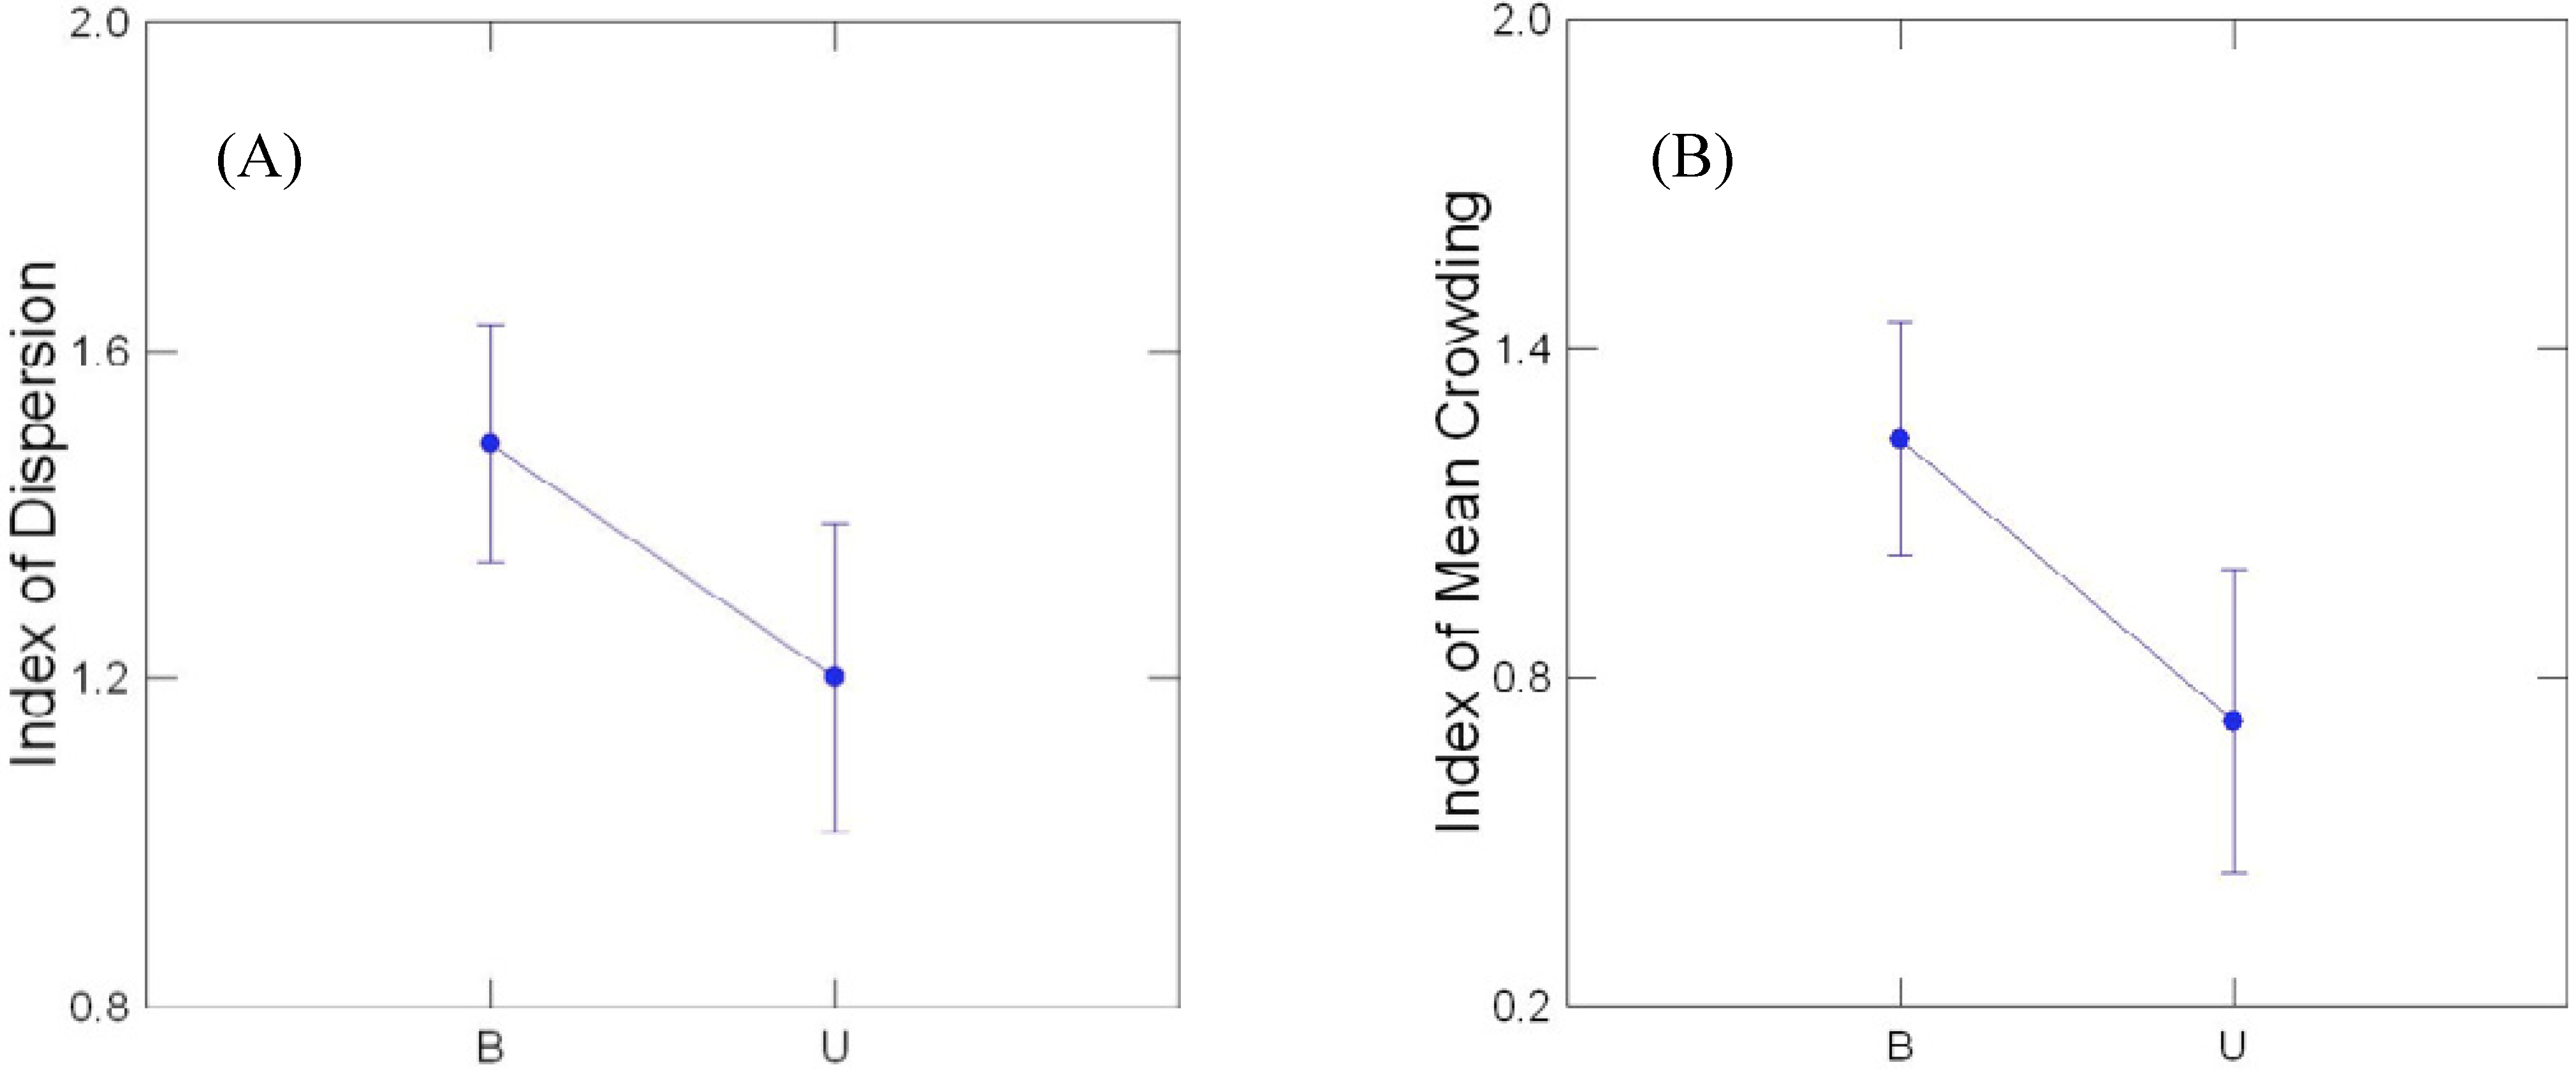
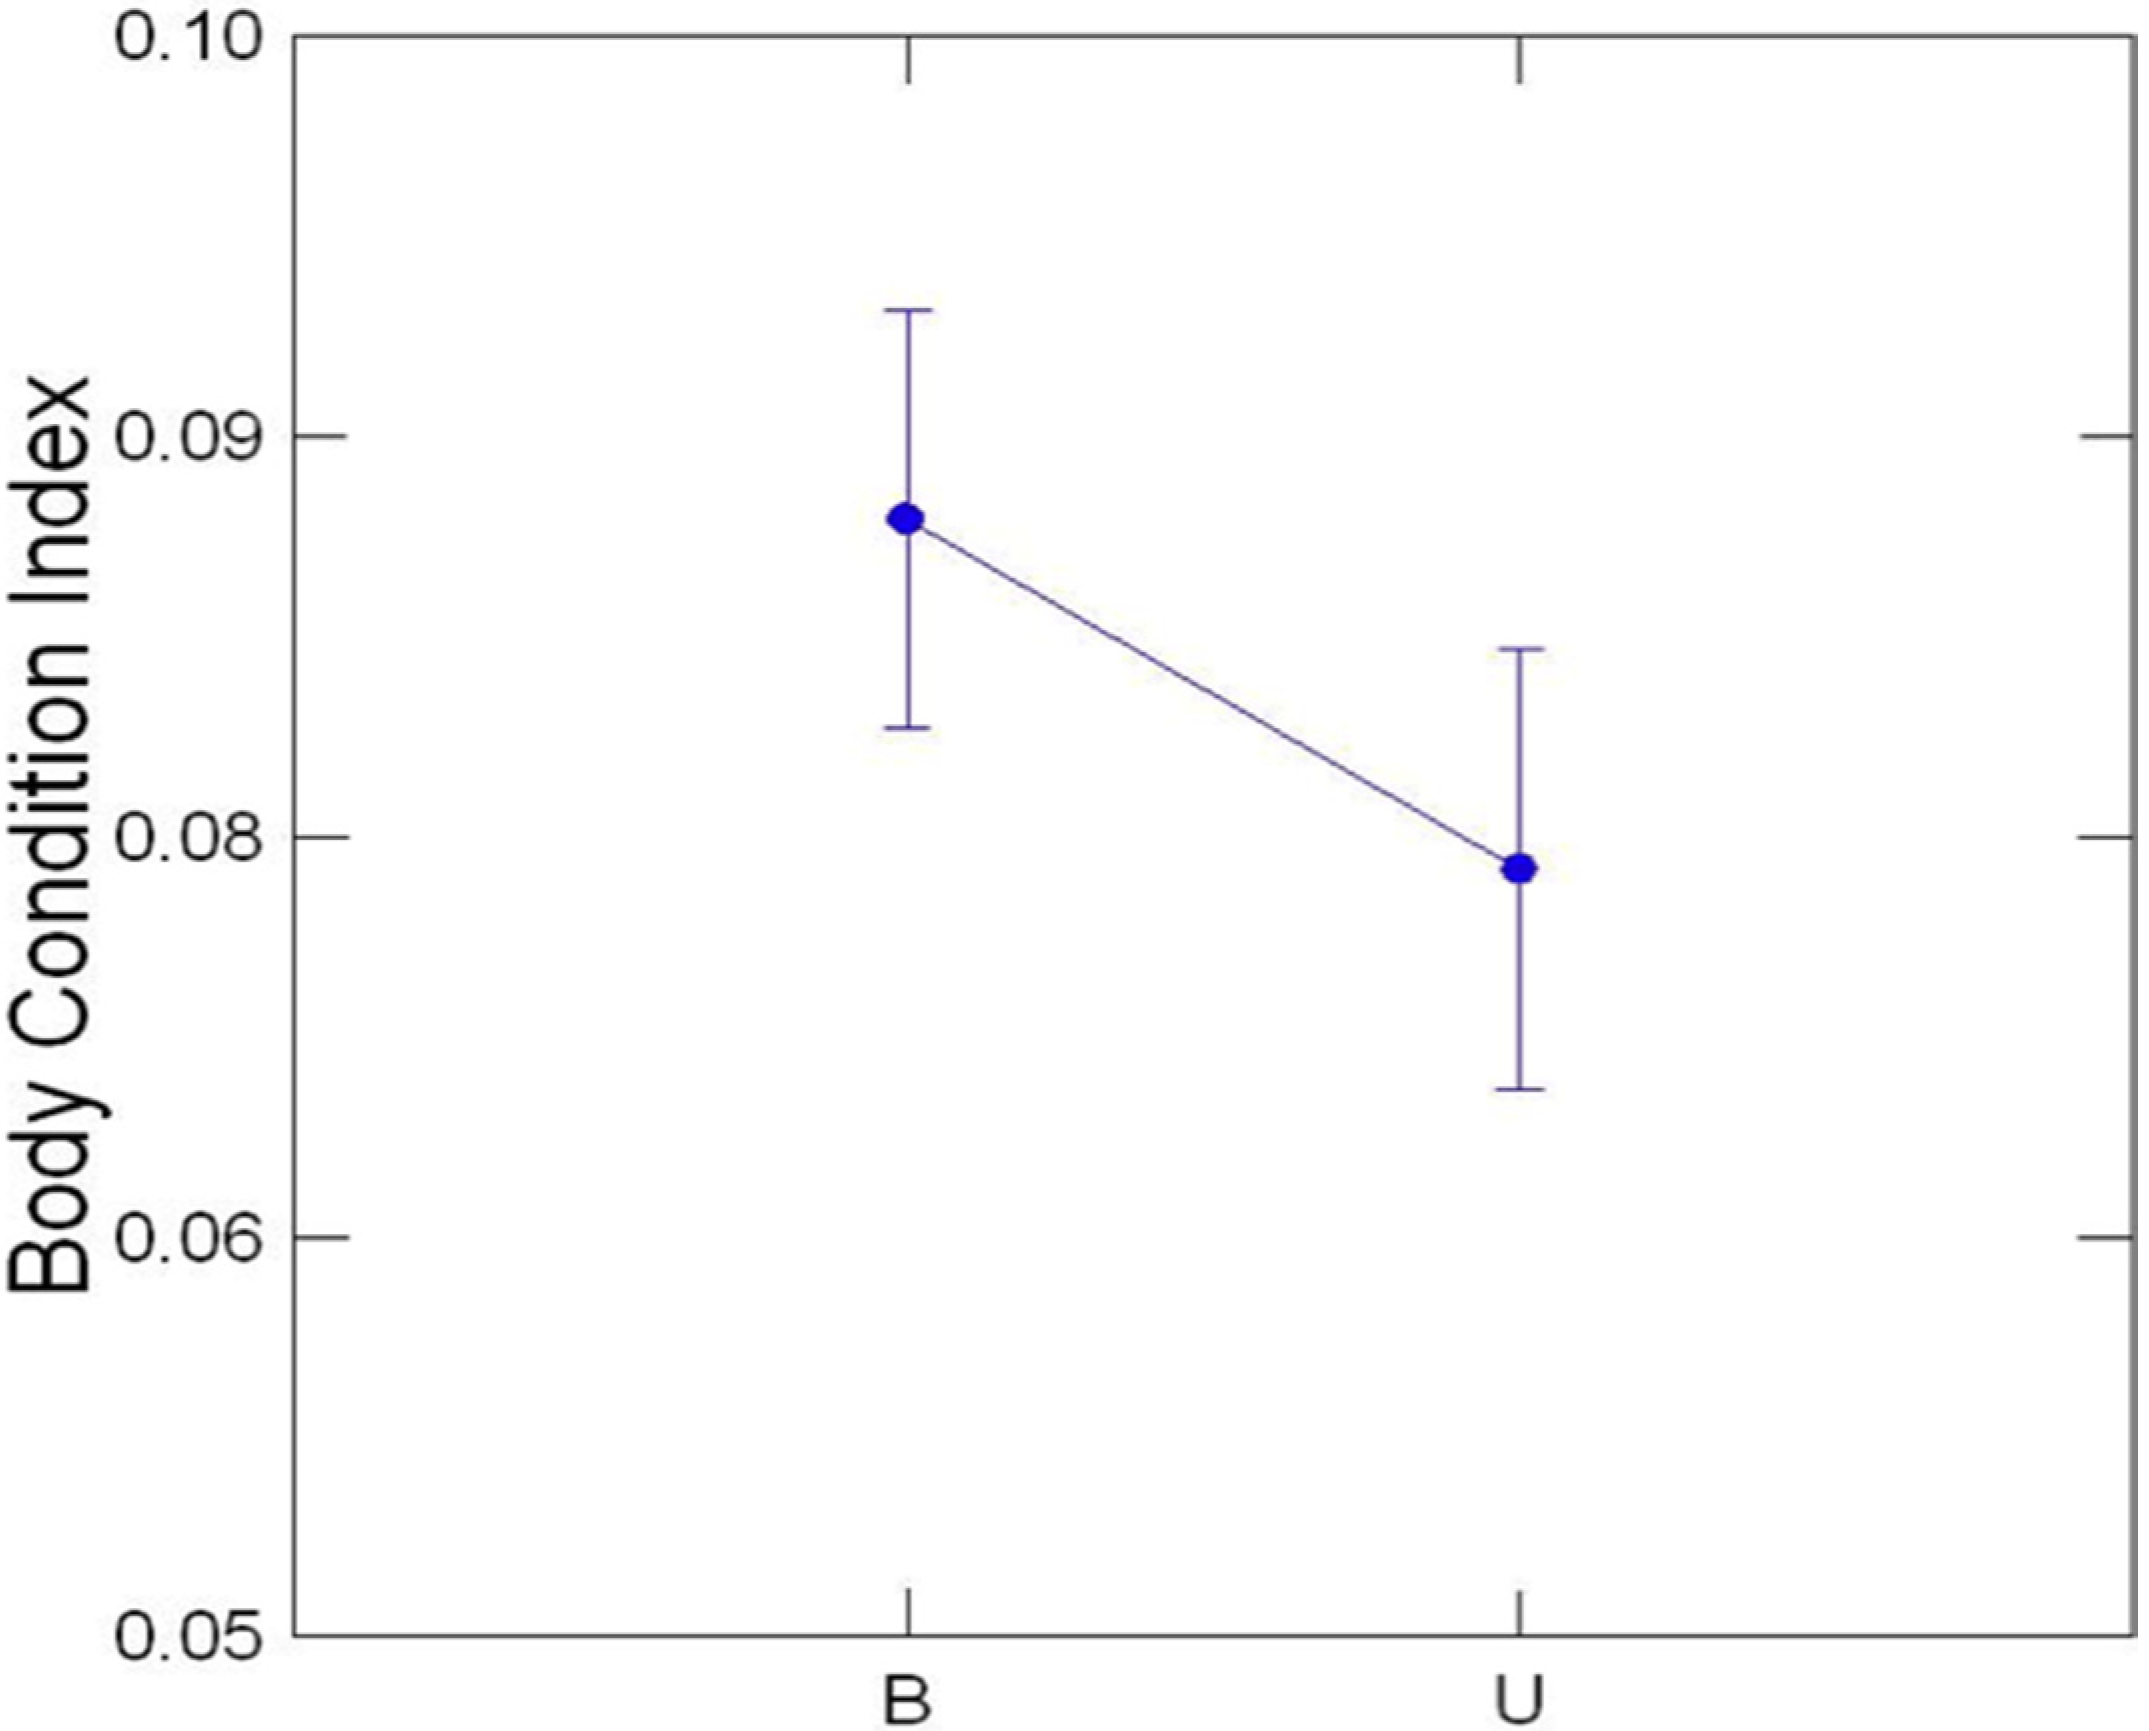
3.3. Comparison of Buffered and Unbuffered Habitats

The ANCOVA revealed that slope angle was a significant covariate of burrow density (F1,106 = 3.948, p = 0.048). After we controlled for angle, we found that burrow density estimates were significantly higher in buffered than in unbuffered habitat (F1,106 = 3.6119, p = 0.026; Figure 1, nested ANOVA). We also found a significant difference between buffered and unbuffered sites in the density-independent aggregation metrics (ID and IMC; Figure 2). ID values were significantly higher (more clumped) in buffered than in unbuffered habitat (F1,106 = 5.675, p = 0.02; Figure 2). Likewise, IMC values were significantly higher in the buffered than in the unbuffered habitat (F1,106 = 8.579, p = 0.004; Figure 2). That is, on average, a burrow in a buffered habitat has roughly 1.25 neighboring burrows per square meter, whereas one in unbuffered habitat has, on average, only roughly 0.75.
Figure 1. Average burrow density of Red Hills salamanders (Phaeognathus hubrichti) (number of burrows/ m2) Alabama, USA, with vertical bars extending to the minimum and maximum values, for buffered (B) and unbuffered (U) sites. Buffered sites are those with buffers of at least 10 m of land above and below the sloped site that are protected from forestry practices.
Forests 06 00827 g001
Figure 2. Aggregation metrics of Red Hills salamander burrows in Alabama, USA. (A) Average index of dispersion (ID) and (B) average index of mean crowding (IMC), with vertical bars extending to the minimum and maximum values, for buffered (B) and unbuffered sites (U).
Forests 06 00827 g002
We also found that salamanders at buffered sites had significantly higher BCI values than unbuffered populations (F1,134 = 5.578, p = 0.020). Males did not differ significantly from females (F1,122 = 2.724, p = 0.11). Results from the residual index did not differ from the initial analysis.

3.4. General Patterns

Our regression analyses revealed a strong positive relationship between slope angle and burrow density (F1,106 = 18.874, p < 0.001, R2 = 0.193). Interestingly, no burrow-rich transects were found at angles greater than 50°. Slope angle was not significantly related to ID (F1,106 = 0.885, p = 0.350) or IMC (F1,106 = 2.894, p = 0.093), so individuals were not more aggregated on steeper slopes.

4. Discussion

Maintaining genetic diversity is fundamentally important to the long-term survival of imperiled species [33], especially for species with small and fragmented populations, such as P. hubrichti [15]. The higher allelic richness we found on buffered sites indicates that leaving a habitat buffer around remaining habitat may aid retention of genetic diversity. This supports the consideration of habitat buffers as a fundamental part of management for this species at actively managed forest sites.
We found no significant difference between site types in level of inbreeding. Although this result may be an artifact of small sample sizes across the individual populations within the treatment types, a discussion of circumstances that could lead to lower genetic diversity in unbuffered sites, in the absence of higher inbreeding, seems worthwhile. The most likely explanation is that unbuffered sites experienced a greater decrease in population size (as shown in the transect data) and that genetic drift therefore caused rare alleles to be lost. Because inbreeding is a change in genotype frequency (and not allele frequency), rare alleles have little effect on the inbreeding level. The high inbreeding level found in all populations is probably due to the fragmentation of the range of the species [15]. An optimal remedy for such high inbreeding levels would be restoration of intervening slope habitat.
The roughly 0.2 more burrows per square meter we found on buffered sites is, given the inherently small population sizes of P. hubrichti, a considerable difference, and because we used burrow-rich transects to calculate them, these estimates are conservative. Hence, leaving a site unbuffered probably has a much more detrimental effect on P. hubrichti burrow density and population size than our data indicated.
We found that unbuffered populations were less aggregated in the highest quality habitat of unbuffered sites than in comparable areas of buffered sites (Table 1; Figure 1 and Figure 2). In this case, therefore, the retreat hypothesis is rejected. The data indicate that leaving habitat unbuffered probably increases the mortality rate throughout the population, not just in peripheral habitat. Whether individuals migrate to other habitat (as in the evacuation hypothesis; [22]) remains to be determined, but because P. hubrichti habitat is so highly fragmented, the mortality rate for emigrates would probably be exceptionally high.
Body-condition indices have been shown to be useful for determining the effects of silviculture practices on salamanders [20], and are a valid measure of fitness, reproductive potential, and growth rate in salamanders [20]. Our results indicated that the effects of leaving a site unbuffered significantly lowered the overall body condition (Figure 3). The mechanism behind this pattern is unclear and warrants future research. Two intriguing hypotheses are that leaving habitat unbuffered decreases prey abundance and that increases in temperature at unbuffered sites raise the energetic cost of maintaining homeostasis [34].
Figure 3. Average body-condition index (BCI), with vertical bars extending to the minimum and maximum values, for buffered (B) and unbuffered (U) sites.
Forests 06 00827 g003

5. Conclusions

Much of the literature on buffering amphibian habitat has dealt with protecting wetlands and the surrounding habitat [8,9,22,35]. We have shown that buffering the habitat of imperiled species can be an effective management tool for terrestrial species. Buffering the edges of P. hubrichti habitat effectively maintained higher population densities and higher genetic diversity. Because preserving genetic diversity is vitally important to the long-term survival of small populations [33], buffering the remaining habitat of P. hubrichti populations is clearly beneficial. We have also shown that leaving a site unbuffered can have a lasting effect on a population by lowering the body condition, and therefore long-term reproductive potential and growth rate, of individuals.
Our findings support consideration of a habitat buffer of at least 10 m from the beginning of the slope (both top and bottom) for populations of P. hubrichti on lands where timber harvest will occur. An ideal buffer would be a natural assemblage of native flora [17] where no harvesting or silviculture practices (e.g., chemical or mechanical preparation) are permitted. Because population sizes of Red Hills salamanders are so small, buffering potential habitat (hardwood slopes) adjacent to known salamander locations would also likely be beneficial. Doing so would allow for population growth and help facilitate gene flow between populations.

Acknowledgments

We thank Kenny Wray, Pierson Hill, Moses Michelson, Nathaniel Herrera, Will Holland, Nathaniel Craig, and Mark Sasser for assisting in the collection of tissue and data. Jessica Homyack and Joe Travis provided further assistance and advice. This project was funded by the Alabama Department of Conservation and Natural Resources. All tissue and data collection was performed under Federal Fish and Wildlife Permit # TE136961-0 and State of Alabama permit # AWFF-SPS-08-02. Weyerhaeuser Timber was extremely helpful and provided access to many of the sites used in this study. Anne Thistle provided editorial services. Three anonymous reviewers contributed thoughtful and helpful comments.

Author Contributions

Both authors collected and analyzed data. The authors co-wrote the paper.

Conflicts of Interest

The authors declare no conflict of interest.

References

  1. Bury, R.B. Differences in amphibian populations in logged and old growth redwood forest. Northwest Sci. 1983, 57, 167–178. [Google Scholar]
  2. Harpole, D.N.; Haas, C.A. Effects of seven silvicultural treatments on terrestrial salamanders. For. Ecol. Manag. 1999, 114, 349–356. [Google Scholar] [CrossRef]
  3. Means, D.B.; Palis, J.G.; Baggett, M. Effects of slash pine silviculture on a Florida population of flatwoods salamander. Conserv. Biol. 1996, 10, 426–437. [Google Scholar] [CrossRef]
  4. Petranka, J.W.; Brannon, M.P.; Hopey, M.E.; Smith, C.K. Effects of timber harvesting on low elevation populations of southern Appalachian salamanders. For. Ecol. Manag. 1994, 67, 135–147. [Google Scholar] [CrossRef]
  5. Putz, F.E.; Sist, P.; Fredericksen, T.; Dykstra, D. Reduced-impact logging: Challenges and opportunities. For. Ecol. Manag. 2008, 256, 1427–1433. [Google Scholar] [CrossRef]
  6. Semlitsch, R.D.; Todd, B.D.; Blomquist, S.M.; Calhoun, A.J.K.; Gibbons, J.W.; Gibbs, J.P.; Graeter, G.J.; Harper, E.B.; Hocking, D.J.; Hunter, M.L., Jr.; et al. Effects of timber harvest on amphibian populations: understanding mechanisms from forest experiments. BioScience 2009, 59, 853–862. [Google Scholar] [CrossRef]
  7. Spence, J.R. The new boreal forestry: Adjusting timber management to accommodate biodiversity. Trends Ecol. Evol. 2001, 16, 591–593. [Google Scholar] [CrossRef]
  8. Veysey, J.S.; Babbitt, K.J.; Cooper, A. An experimental assessment of buffer width: Implications for salamander migratory behavior. Biol. Conserv. 2009, 142, 2227–2239. [Google Scholar] [CrossRef]
  9. Trenham, P.C.; Shaffer, H.B. Amphibian upland habitat use and its consequences for population viability. Ecol. Appl. 2005, 15, 1158–1168. [Google Scholar] [CrossRef]
  10. International Union for Conservation of Nature and Natural Resources (IUCN). The IUCN Red List of Threatened Species, version 3.1. 2011. Available online: http://www.iucnredlist.org/technical-documents/categories-and-criteria/2001-categories-criteria (accessed on 25 May 2012).
  11. Dodd, C.K. The status of the Red Hills salamander Phaeognathus hubrichti, Alabama, USA, 1976–1988. Biol. Conserv. 1991, 55, 57–75. [Google Scholar] [CrossRef]
  12. Jordan, R.J.; Mount, R.H. The status of the Red Hills salamander, Phaeognathus hubrichti Highton. J. Herpetol. 1975, 9, 211–215. [Google Scholar] [CrossRef]
  13. Bakkegard, K.A. Activity patterns of Red Hills salamanders (Phaeognathus hubrichti) at their burrow entrances. Copeia 2002, 3, 851–856. [Google Scholar] [CrossRef]
  14. Means, D.B. Notes on the reproductive biology of the Alabama Red Hills Salamander (Phaeognathus hubrichti). Contemp. Herpetol. 2003, 3, 1–5. [Google Scholar]
  15. Apodaca, J.J. Prioritizing Regions for the Conservation of Amphibians with Special Emphasis on the Red Hills Salamander (Phaeognathus Hubrichti). Ph.D. Thesis, The University of Alabama, Tuscaloosa, AL, USA, 2010. [Google Scholar]
  16. Apodaca, J.J.; Rissler, L.J.; Godwin, J.C. Population structure and gene flow in a heavily disturbed habitat: implications for the management of the imperilled Red Hills salamander (Phaeognathus hubrichti). Conserv. Genet. 2012, 13, 913–923. [Google Scholar] [CrossRef]
  17. Godwin, J.C. Red Hills salamander habitat delineation, breeding bird surveys, and habitat restoration recommendations on commercial timberlands. Unpublished report prepared for The Alabama Department of Conservation and Natural Resources. 2008. Available online: http://www.alnhp.org/reports/Red_Hills_SWG_Final_Report.pdf (accessed on 4 October 2010).
  18. Schwaner, T.D.; Mount, R.H. Notes on the distribution, habits, and ecology of the salamander Phaeognathus hubrichti Highton. Copeia 1970, 3, 571–573. [Google Scholar] [CrossRef]
  19. Harris, R.N. Body condition and order of arrival affect cooperative nesting behaviour in four-toed salamanders Hemidactylium scutatum. Anim. Behav. 2008, 75, 229–233. [Google Scholar] [CrossRef]
  20. Lowe, W.H.; Likens, G.E.; Cosentino, B.J. Self-organization in streams: the relationship between movement behaviour and body condition in a headwater salamander. Freshw. Biol. 2006, 51, 2052–2062. [Google Scholar] [CrossRef]
  21. Lowe, W.H.; McPeek, M.A.; Likens, G.E.; Cosentino, B.J. Linking movement behaviour to dispersal and divergence in plethodontid salamanders. Mol. Ecol. 2008, 17, 4459–4469. [Google Scholar] [CrossRef] [PubMed]
  22. Semlitsch, R.D. Differentiating migration and dispersal processes for pond-breeding amphibians. J. Wildl. Manag. 2008, 72, 260–267. [Google Scholar] [CrossRef]
  23. Mount, R.H.; Schwaner, T.D. A technique for collecting the plethodontid salamander Phaeognathus hubrichti. Copeia 1970, 1, 205–206. [Google Scholar] [CrossRef]
  24. Karraker, N.E.; Welsh, H.H. Long-term impacts of even-aged timber management on abundance and body condition of terrestrial amphibians in northwestern California. Biol. Conserv. 2006, 131, 132–140. [Google Scholar] [CrossRef]
  25. Lance, S.L.; Hagen, C.; Glenn, T.C.; Apodaca, J.J.; Rissler, L.J. Development and characterization of twelve polymorphic microsatellite loci in the threatened Red Hills salamander, Phaeognathus hubrichti. Conserv. Genet. Resour. 2009, 10, 1919–1921. [Google Scholar] [CrossRef]
  26. Van Oosterhout, C.; Hutchinson, W.F.; Wills, D.P.M.; Shipley, P. MICRO-CHECKER: Software for identifying and correcting genotyping errors in microsatellite data. Mol. Ecol. Notes 2004, 4, 535–538. [Google Scholar] [CrossRef]
  27. Goudet, J. FSTAT, a program to estimate and test gene diversities and fixation indices (Version 2.9.3). 2001. Available online: http://www.unil.ch/izea/software/fstat.html (accessed on 12 December 2010).
  28. Lloyd, M. Mean crowding. J. Anim. Ecol. 1967, 36, 1–30. [Google Scholar] [CrossRef]
  29. Pielou, E.C. An Introduction to Mathematical Ecology; John Wiley & Sons: New York, NY, USA, 1969. [Google Scholar]
  30. Rosenberg, M.S.; Anderson, C.D. PASSaGE: Pattern analysis, spatial statistics and geographic exegesis. Version 2. Methods Ecol. Evol. 2011, 2, 229–232. [Google Scholar] [CrossRef]
  31. Bakkegard, K.A.; Guyer, C. Sexual size dimorphism in the Red Hills salamander, Phaeognathus hubrichti (Caudata: Plethodontidae: Desmognathinae). J. Herpetol. 2004, 38, 8–15. [Google Scholar] [CrossRef]
  32. Jakob, E.M.; Marshall, S.D.; Uetz, G.W. Estimating fitness: A comparison of body condition indices. Oikos 1996, 77, 61–67. [Google Scholar] [CrossRef]
  33. Frankham, R.; Ballou, J.D.; Briscoe, D.A. Introduction to Conservation Genetics; Cambridge University Press: Cambridge, UK, 2002. [Google Scholar]
  34. Homyack, J.A.; Haas, C.A.; Hopkins, W.A. Energetics of surface-active terrestrial salamanders in experimentally harvested forest. J. Wildl. Manag. 2011, 75, 1267–1278. [Google Scholar] [CrossRef]
  35. Semlitsch, R.D.; Bodie, J.R. Biological criteria for buffer zones around wetlands and riparian habitats for amphibians and reptiles. Conserv. Biol. 2003, 17, 1219–1228. [Google Scholar] [CrossRef]

