Article

Organic Carbon Accumulation in Topsoil Following Afforestation with Willow: Emphasis on Leaf Litter Decomposition and Soil Organic Matter Quality

by
Benoit Lafleur
1,
Michel Labrecque
2,
Alexandre A. Arnold
3 and
Nicolas Bélanger
1,4,*
1
Centre d'Étude de la Forêt, Université du Québec à Montréal, C.P. 8888, Succ. Centre-Ville, Montréal, QC H3C 3P8, Canada
2
Institut de recherche en biologie végétale, Jardin Botanique de Montréal, 4101 Sherbrooke East, Montréal, QC H1X 2B2, Canada
3
NanoQam, Université du Québec à Montréal, C.P. 8888, Succ. Centre-Ville, Montréal, QC H3C 3P8, Canada
4
UER science et technologie, Université du Québec, 5800 rue Saint-Denis, Bureau 1105, Montréal, QC H2S 3L5, Canada
*
Author to whom correspondence should be addressed.
Forests 2015, 6(3), 769-793; https://doi.org/10.3390/f6030769
Submission received: 11 December 2014 / Revised: 9 February 2015 / Accepted: 12 March 2015 / Published: 19 March 2015

Abstract

:
Short-rotation intensive cultures (SRICs) of willows can potentially sequester carbon (C) in soil. However, there is limited information regarding the factors governing soil organic C (Corg) accumulation following afforestation. The objectives of this study were to: (i) determine whether willow leads to Corg accumulation in the topsoil (0–10 cm) two to six years after establishment in five SRICs located along a large climatic/productivity gradient in southern Quebec, and (ii) assess the influence of leaf litter decomposition and soil organic matter (OM) quality on Corg accumulation in the topsoil. Topsoil Corg concentrations and pools under SRICs were, on average, 25% greater than reference fields, and alkyls concentrations were higher under SRICs. On an annualized basis, Corg accumulation rates in the topsoil varied between 0.4 and 4.5 Mg ha−1 yr−1. Estimated annual litterfall C fluxes were in the same order of magnitude, suggesting that SRICs can accumulate Corg in the topsoil during early years due to high growth rates. Leaf litter decomposition was also related to Corg accumulation rates in the topsoil. It was positively correlated to growing season length, degree-days, and growing season average air and topsoil temperature (r > 0.70), and negatively correlated to topsoil volumetric water content (r = −0.55). Leaf litter decomposition likely occurred more quickly than that of plants in reference fields, and as it progressed, OM became more decay resistant, more stable and accumulated as Corg in the topsoil.

1. Introduction

The establishment of short-rotation intensive cultures (SRICs) for bioenergy production is proposed as a land management practice to reduce the use of fossil fuels and lower greenhouse gas emissions [1,2]. Willows can be used as fast-growing and high-yielding energy crops that perform well on marginal lands. In Canada, hundreds of thousands of hectares of marginal lands are available for short-rotation woody crops [3,4], including willows which have been shown to be among the most productive crops, reaching as much as 20 Mg·ha−1 yr−1 of aboveground dry biomass under optimal conditions [5,6]. In this context, SRICs of willows could partly replace the use of fossil fuel for heat production.
Short-rotation intensive cultures of willows also display a high potential to accumulate carbon (C) in soil, thereby offsetting the use of fossil fuel and greenhouse gas emissions [7,8]. Studies that investigated the potential of SRICs of willows to accumulate soil C in the form of organic matter (OM) have resulted with contradictory results. While some studies reported soil organic carbon (Corg) accumulation over time (i.e., 7–12 years [9,10]), others reported no change [11,12] or decreases [13]. In Canada, preliminary results in southern Quebec also show varying results. Zan et al. [14] reported higher soil Corg under SRICs of willows compared to corn, switchgrass and abandoned fields, whereas Lockwell et al. [15] reported that the conversion of a conventional hay crop to a SRIC of willow did not change soil Corg content in the short term. The inconsistencies among studies suggest that soil Corg accumulation in SRICs of willows is likely site-specific. Therefore, factors governing site response in terms of soil Corg following afforestation with willow deserve more scientific attention.
Soil texture, nutrient availability and climate are important factors explaining site response in soil Corg following afforestation [16,17,18,19]. Indeed, climate, soil properties and their interactions (i.e., pedoclimate) influence soil microbial activity and in turn, control OM decomposition rates and soil Corg accumulation or loss [20]. Other factors that can influence the rates of soil Corg accumulation in SRICs of willows include net primary production, initial soil Corg, plantation age, former land use, management practices, and soil depth [21,22]. Also, many studies have shown that soil OM quality (or its chemical signature) can affect, to some extent, soil Corg recalcitrance and levels [23]. However, very few studies have investigated the relationships between soil OM chemical signatures and Corg changes in the context of afforestation (e.g., [24]), and we are unaware of such studies for SRICs of willow established on agricultural land. As some types of OM may be more decay resistant than others (for instance, alkyl C and carbonyl C were consistently shown to be more decay resistant that O-alkyl C [25]), certain plant species may produce litters with chemical signatures that result in recalcitrant OM and thus tend to accumulate soil Corg faster once they are established.
The main hypothesis was that SRICs of willow in southern Quebec leads to Corg accumulation in the topsoil two to six years after establishment due to high growth rates, extensive litterfall (C) fluxes and the buildup of more recalcitrant Corg from willow litters (foliage or roots). Therefore, the main objective of this study was to compare, two to six years after willow establishment, Corg concentrations and pools in the topsoil of five SRICs and their adjacent agricultural/abandoned fields located along a large climatic/productivity gradient in southern Quebec. Topsoil was also incubated under willow for two years as a means to measure Corg changes. We sought to explain the varying site responses to afforestation in terms of Corg in the topsoil not only based on soil properties and site management and land use history, but we also wanted to relate soil Corg to willow leaf litter decomposition and changes in C:N (nitrogen) ratios over time as well as changes in topsoil OM quality. Ultimately, the data generated from this study could be used to guide deployment strategies that maximize soil Corg accumulation at the landscape level.

2. Materials and Methods

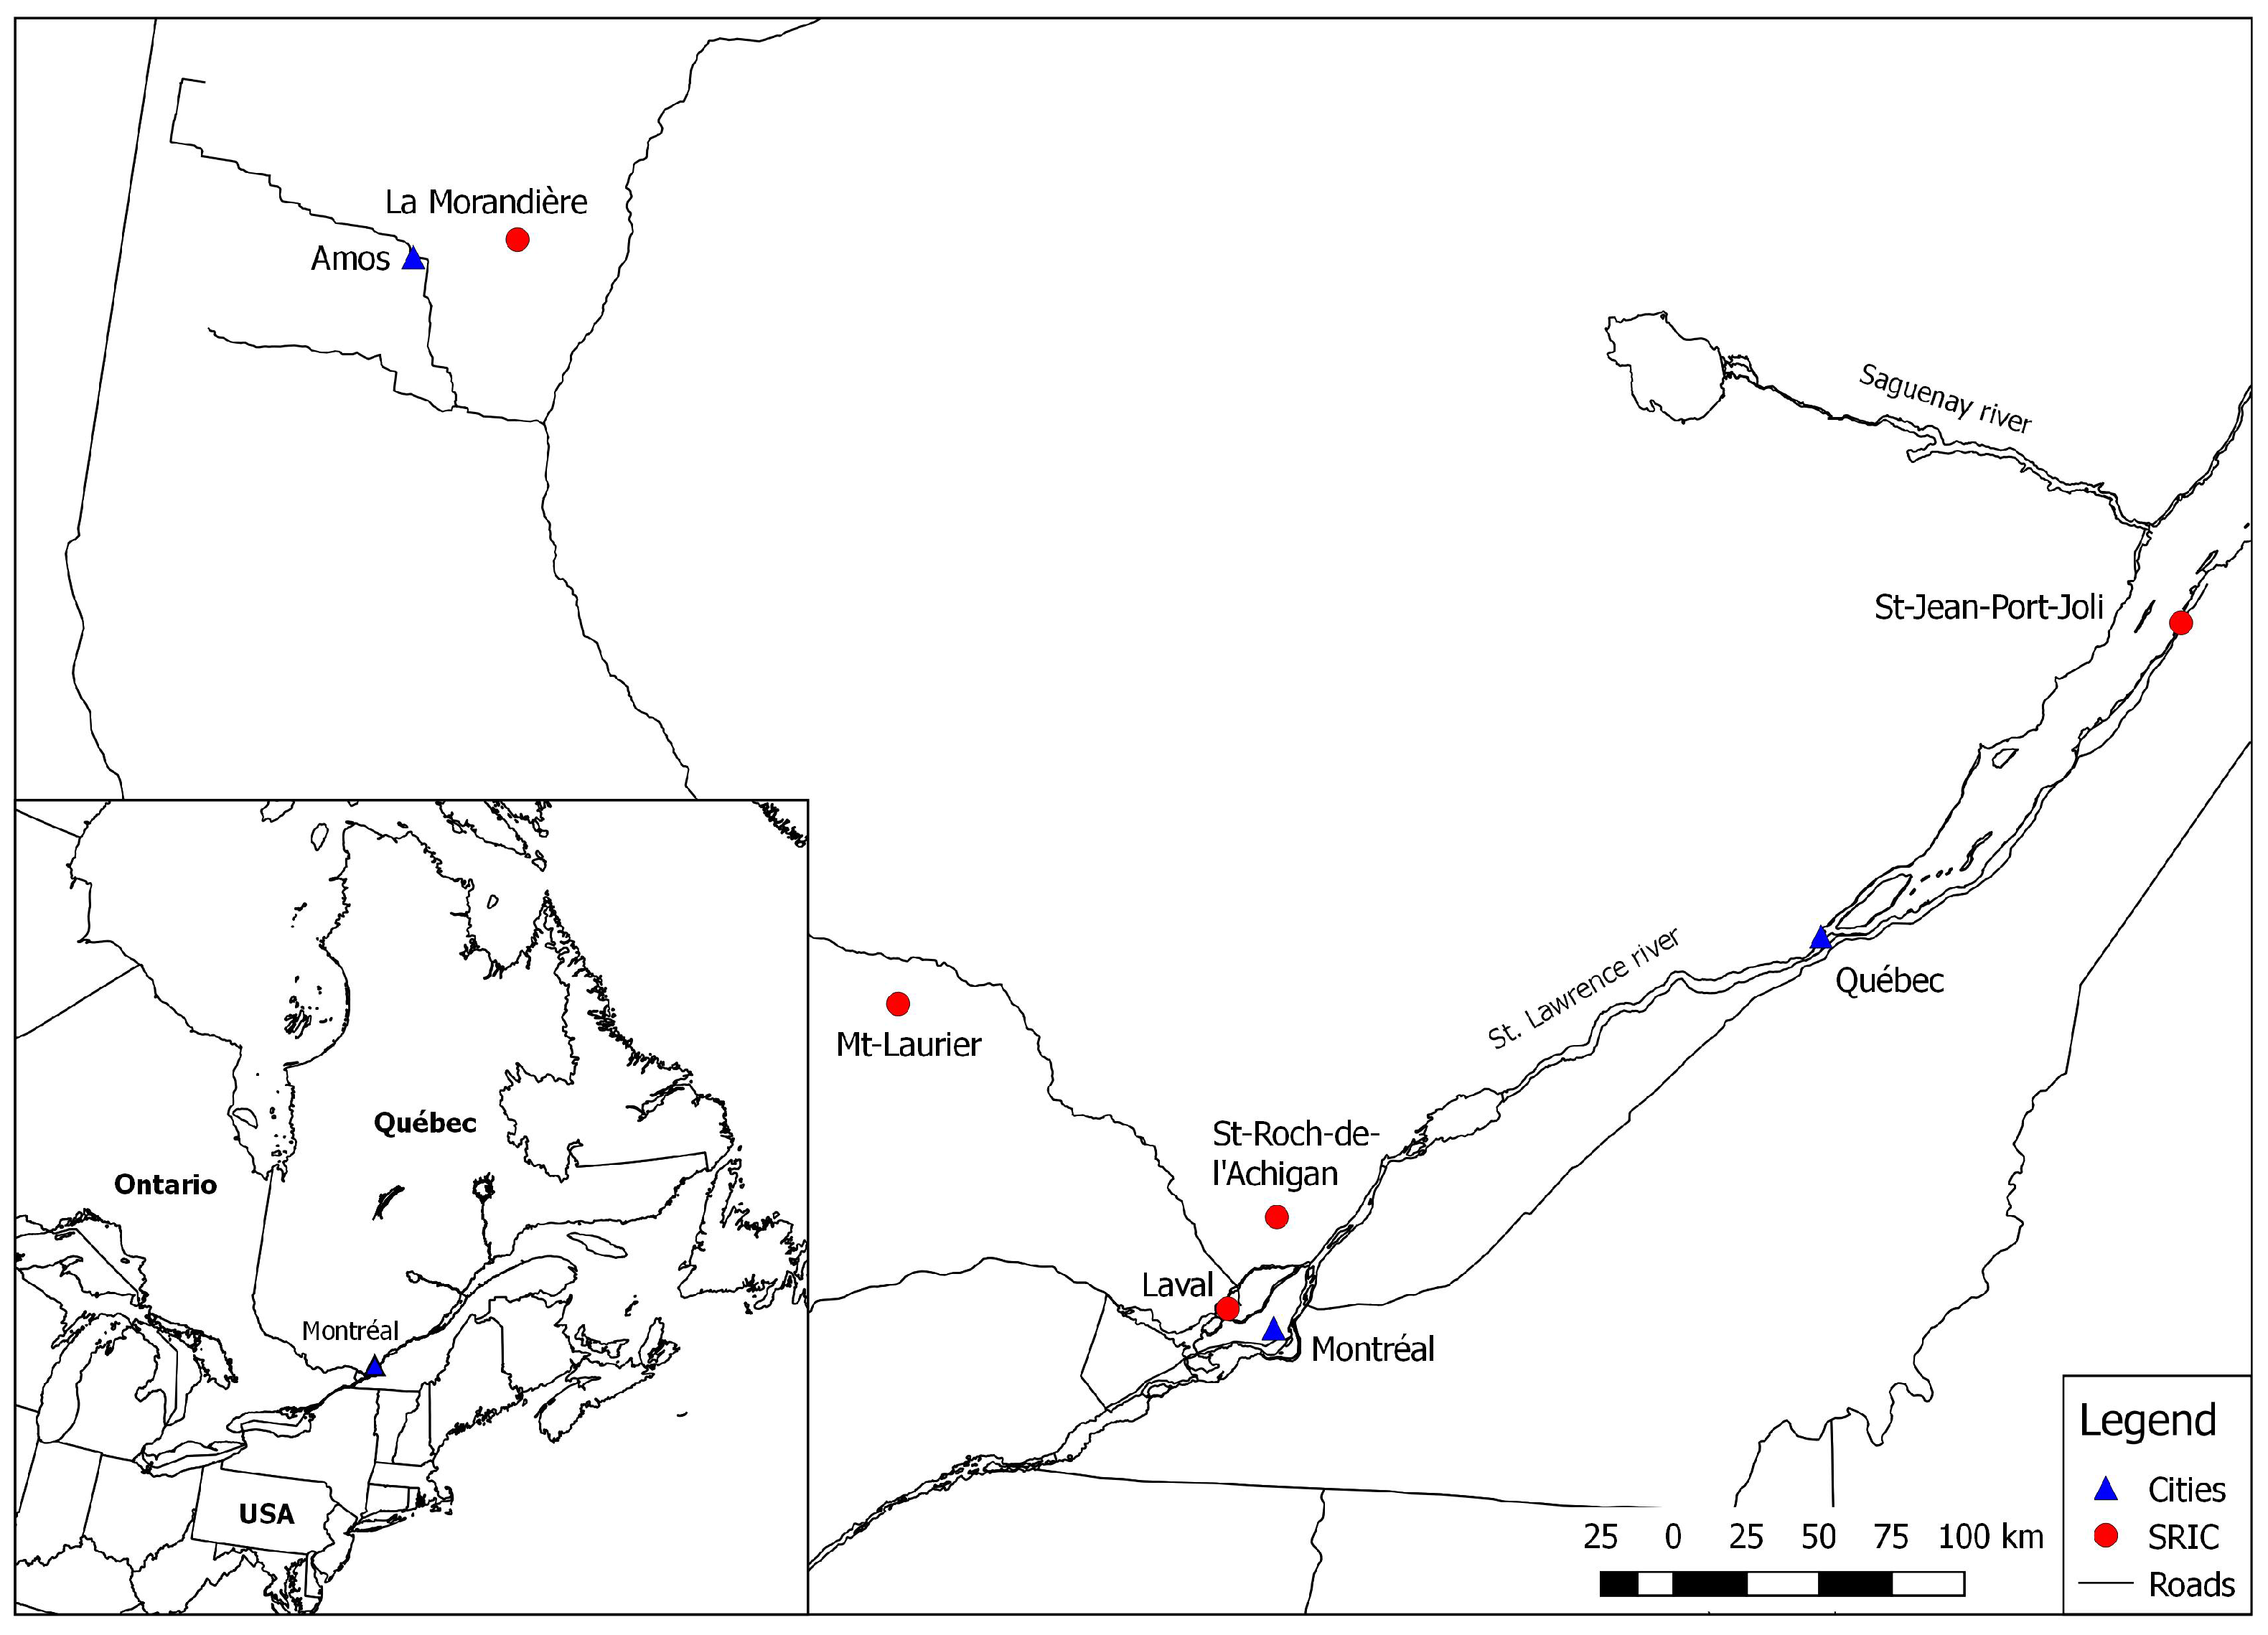
2.1. Study Sites, Management System, and Willow Cultivar

The study was conducted in five SRICs of the willow cultivar Salix miyabeana SX67, identified as one of the most productive in southern Quebec [26,27]. The five SRICs span a relatively large hydroclimatic gradient in southern Quebec (Figure 1, Table 1), Canada, with contrasting soil particle size distributions, N concentrations and C:N ratios (Table 2). These SRICs of SX67 are part of a larger network of SRICs of willows established to study the potential of marginal agricultural lands for biomass production. The southernmost SRICs (i.e., LAV and STR) were located in the most favorable climatic conditions with higher growing season precipitation, average temperature, and degree-days, and longer growing season, whereas the northernmost SRIC (i.e., ABI) had the most unfavorable climatic conditions with lower growing season precipitation and average temperature, lower degree-days and shorter growing season. The topography at all sites is flat. The topsoil at the ABI site is classified as a clay, the LAV and SJPJ sites are classified as a loam, and the STR and MTL sites are classified as a sandy loam and a loamy sand, respectively [28]. The topsoil at the SJPJ site had a significantly higher N concentration and lower C:N ratio (except when compared to ABI) than to all other sites, whereas the topsoil at the MTL site had a significantly lower N concentration (except when compared to LAV and STR) and higher C:N ratio than to all other sites.
In each SRIC, rows were separated by 1.8 m and cuttings were planted along each row with an interval of 0.3 m, corresponding to a density of approximately 18,000 cuttings ha−1. Each SRIC was fertilized with a slow release chemical fertilizer (30:0:0) to provide the equivalent of 100 kg N ha−1 at the beginning of the second growing season. The SRICs are managed based on a 3- or 4-year cycle after they are coppiced at the end of the first growing season. Therefore, a stem is normally younger than its respective stool. The only SRIC that did not undergo early coppicing was the SJPJ site. Only the STR site was in its second rotation (other SRICs had never been harvested). At the start of the study in 2011 (spring), stools and stems were both two years old at SJPJ, three and two years old at ABI and MTL, five and four years old at LAV, and six and two years old at STR.
Figure 1. Location of the five short-rotation intensive cultures of SX67 located along a large pedoclimatic gradient in southern Quebec, Canada.
Forests 06 00769 g001
Table 1. Hydroclimatic characteristics and previous land use of the five short-rotation intensive cultures of SX67.
SiteGrowing season precipitation1 (mm)Growing season average temperature (°C) 2Degree-days 1 (>5 °C)Growing season length1 (days)Previous land use
La Morandière (ABI)47913.51376139Fallow
Laval (LAV)63017.52188204Market gardening
Mt-Laurier (MTL)54315.31813157Mixedwood forest
St-Jean-Port-Joli (SJPJ)55015.91419197Fallow
St-Roch-de-l’ Achigan (STR)57016.82078191Market gardening
1 Information regarding degree-days and growing season precipitation were estimated using the BioSim model [29]. BioSIM was originally designed to assist in the application of temperature-driven simulation models in pest management. Forecasts are made by simulations provided by the system and are based on regional air temperature and precipitation interpolated from nearby weather stations, adjusted for elevation and location differentials with regional gradients; 2 See Methods section 2.2.2.

2.2. Experimental Design and Sampling Procedure

To determine the ability of SX67 to accumulate Corg in the topsoil, soil was first collected at a depth of 0–10 cm (corresponding to the plowed (Ap) horizon) in September 2011 in five randomly selected locations in each SRIC. Since data were lacking on Corg in the topsoil prior to willow establishment, each location under SRICs was paired with an immediately adjoining agricultural or abandoned fields (i.e., latter referred as reference fields). Topsoil was therefore also sampled in the reference fields. This paired sampling was conducted as a means to assess Corg changes following afforestation with willow [13,30]. Reference fields were carefully selected so that they were representative of topsoil in the SRICs (based on texture first determined in the field and validated in the laboratory) and of the land use at the time the SRICs were established. Although some bias may occur using this approach [31], we believe that the well-replicated design across five contrasted sites compensates for the generally high variability in Corg in the topsoil [32]. Soil bulk density was also assessed in each of these locations using a specially machined soil core sampler. The data was used to compare Corg pools in the topsoil between land uses.
Table 2. Topsoil particle size distributions, nitrogen concentrations and C:N ratios (mean ± standard error) of the five short-rotation intensive cultures of SX67.
SiteSand (%)Silt (%)Clay (%)Texture 1Nitrogen (mg g−1)Carbon:Nitrogen
ABI19.4 (1.4)37.5 (2.4)43.1 (3.7)Clay1.9 (0.1)12.3 (0.3)
LAV49.6 (0.5)39.1 (0.4)11.3 (0.9)Loam1.7 (0.1)14.4 (0.4)
MTL74.1 (2.5)22.1 (1.4)3.7 (1.2)Loamy sand1.1 (0.2)16.8 (0.6)
SJPJ30.7 (4.2)46.4 (2.4)22.9 (2.1)Loam3.0 (0.2)11.4 (0.4)
STR59.2 (3.1)32.1 (2.4)8.7 (0.8)Sandy loam1.3 (0.1)13.7 (0.3)
1 According to the Canadian System of Soil Classification [28].
Litterfall of SX67 was sampled in the fall of 2011 in each SRIC by placing five plastic bins within each site, i.e., at the five SRIC sampling locations. Leaf litter was collected from each bin every two weeks from August until mid-October. Samples were preserved and treated individually in the laboratory.
In September 2011, three sampling locations were identified in each SRIC, allowing the monitoring of the decomposition of leaf litter (or new C). We also wanted to monitor the changes in Corg by incubating topsoil samples as a validation of the Corg results obtained by the pairing approach (i.e., SRICs vs. reference fields). Thus, eight leaf litterbags and eight PVC tubes containing topsoil (again collected at a depth of 0–10 cm) were installed in September 2011 in each sampling location (×3) of each SRIC (for a total of 24 litter bags and 24 soil tubes per SRIC). Litter bags consisted of 2 mm nylon mesh filled with ca. 2.5 g fresh weight of recently fallen (green leaves) SX67 leaf litter, thus not distinguishing the canopy position from which the leaves came from. The size of the sample simulated the density (and aggregation) of litterfall at the soil surface. Each site was incubated with leaves collected from the same location. The PVC tubes were filled with 200 g of topsoil collected from the same location where it was incubated. The PVC tubes were 10 cm in length, 5 cm in diameter, and were capped with nylon mesh on bottom and perforated on the sides. Litterbags were deposited at the soil surface, whereas PVC tubes were inserted back in the topsoil, i.e., 0–10 cm. During installation, full contact was assured between the incubated topsoil and soil at the bottom of the tube to avoid an accelerated movement of particles from the topsoil sample before it had fully settled. The top of the tube was left exposed to air. This setup allowed free circulation (vertically and horizontally) of water and dissolved constituents, including Corg, air, clays, roots, microbes and small insects. In each SRIC, nine subsamples (three per sampling location) of SX67 leaf litter and nine subsamples (three per sampling location) of topsoil were collected prior to the experiment to determine their initial concentration in Corg and total N, and initial Corg pools. Starting in June 2012, litterbags and PVC tubes were sampled periodically in order to estimate leaf litter decomposition rates and changes in topsoil Corg levels. One litterbag and one PVC tube from each sampling location were collected in June, July, August and September 2012. The same sampling procedure was repeated in June, July, August and September 2013. Upon sampling, leaf litter and topsoil were dried at 65 °C for 48 h prior to analysis. Leaf litter was weighed on an analytical balance (precision 0.01 g) to determine the remaining mass.
On the one hand, the leaf litter decomposition rate constant (k) and decomposition limit value (DLV; i.e., percent of leaf litter mass loss when decomposition ceases) were determined by fitting the proportion of leaf litter remaining in the litterbags to the following asymptotic decay model [33,34]:
X = A + ( 1 A ) e k t
where X is the proportion of the initial leaf litter mass remaining at time t and assumes that a recalcitrant fraction (A, i.e., asymptote) of the initial litter biomass has a decomposition rate so slow that it is practically zero, whereas another fraction (1 − A) decomposes exponentially at rate k. Although the model allows for complete leaf litter decomposition (i.e., A = 0), a proportion of the litter reaches a stage of relative stability (i.e., near-humus material), where further decomposition is negligible. The DVL was calculated as (1 − A) × 100.
On the other hand, percent change in topsoil Corg during the incubation was calculated as:
Δ C org = [ ( C org i C org f ) / C org i ] × 100
where Corgi is the initial Corg pool in the topsoil (T ha−1) and Corgf is the Corg pool in the topsoil after the incubation period of two years. For the sake of simplicity, only the results at the onset (October 2011) and end (October 2013) of the topsoil incubation experiment are reported here and compared statistically.
In May 2012, air temperature and topsoil temperature and moisture monitoring stations were installed at each SRIC in each location used for testing litter decomposition and incubating the topsoil. Air temperature was monitored at the center of each SRIC at 1 m above the ground (i.e., under the SX67 canopy) using the internal temperature sensor of a WatchDog 1650 Micro Station data logger (Spectrum Technologies, Inc., Plainfield, IL, USA). Topsoil temperature was monitored inside each location (litter decomposition and topsoil incubation study) by burying two temperature data loggers (Thermochron® iButtons, model DS1921G, Maxim Integrated Products, Inc., Sunnyvale, CA, USA) at a depth of 10 cm in each sampling location (six probes per SRIC). Topsoil moisture was monitored by inserting in each sampling location one WaterScout SM 100 Soil Moisture Sensor (which measures volumetric water content, VWC) at a depth of 10 cm (three probes per SRIC). Each moisture sensor was connected to the main WatchDog 1650 logger. The equipment was set to record data every 4 hours and 30 minutes. As the estimation of VWC is sensitive to soil particle size distribution [35], site-specific calibration curves were built in the laboratory using topsoil from each SRIC prior to installation of the probes in the field. The soil moisture data reported in this study is thus adjusted based on the calibration curves.

2.3. Laboratory Analyses

Bulk density of the topsoil was determined via the core method in order to calculate Corg on a volumetric basis (top 10 cm × ha), whereas soil particle size distribution (texture) was analyzed on a Horiba Partica LA-950 laser particle analyzer (Horiba Instruments, Kyoto, Japan). Samples were first treated with NaOCl to decrease Corg levels and the presence of aggregates. Sodium hexametaphosphate (4 mg per sample cell) and sonication for 1 min at level 7 were used on all samples for particle dispersion before measurement.
Upon arrival in the laboratory, leaf litters were carefully cleaned by hand and with pressured air, when necessary, to remove possible contamination by soil [34,36]. Litterfall, leaf litters and topsoil samples were oven-dried at 40 °C to a constant weight. Leaf litters and topsoil samples were then finely ground to pass through a <60 μm sieve before determining Corg and total N concentrations using a Fisons CHNS-O Element Analyzer (model EA1108, Thermo Scientific, Waltham, MA, USA). Annual litterfall fluxes were estimated for each SRIC by calculating the mean of the oven-dried weights measured from each five bins per site. However, litterfall samples were not analyzed for Corg and total N.
We also used solid-state Nuclear Magnetic Resonance (NMR) spectroscopy to characterize OM chemical signatures in SRICs of SX67 and reference fields on topsoil samples collected in October 2011. Prior to NMR spectroscopy, topsoil samples were treated using a 10% HF solution to circumvent the problems arising from small organic matter content and the effects of paramagnetic compounds [37]. For each study site, topsoil samples from the SRIC and those from the reference fields were pooled to obtain one sample per land use per site. Twenty milliliters of 10% HF was added to each sample. The suspensions were shaken for 2 h at room temperature, centrifuged and the supernatant removed. The procedure was repeated 5 times. The residue was washed five times with deionized water to remove salts and residual HF. All spectra were recorded on a Varian Inova 600 spectrometer (Agilent Technologies, Santa Clara, CA, USA) operating at frequencies of 150.87 MHz (13C) and 599.95 MHz for (1H) using a double-resonance 4 mm Magic-angle spinning probe and a spinning frequency of 12.5 kHz. All spectra were obtained using 2 ms long cross-polarization and radio-frequency fields of 70 kHz and 82.5 kHz on 13C and 1H, respectively. A 10% amplitude ramp was applied on 1H during cross-polarization. The recycle delay was 5 s and the acquisition time was 10 ms during which 1H decoupling was applied using TPPM [38] with a radio-frequency field of 82.5 kHz. Approximately 17,000 scans were accumulated for each sample, corresponding to a full experimental time of ca. 24 h per sample. Note that although cross-polarization spectra cannot be analyzed quantitatively on an absolute scale, a comparison between samples, such as the one carried out in this work, is possible. Spectra were processed using MNova (Mestrelab research S.L.) with a 100 Hz exponential line-broadening and externally referenced with respect to TMS by setting the low-field peak of adamantane to 38.48 ppm [39]. The integration ranges and assignment follows the work of Thiffault et al. [40] for forest soils in Quebec: 0–46 ppm, alkyl C; 46–93 ppm, O-alkyl C; 93–112 ppm, di-O-alkyl C; 112–141 ppm, aromatic C; 141–166 ppm, phenolic C; 166–192 ppm, carboxyl C; and 192–241 ppm, aldehydes and ketones.

2.4. Data Analysis

Descriptive statistics were used to compare topsoil particle size distributions, total N concentrations and C:N ratios between the five SRICs. Descriptive statistics were also used to characterize intra- and inter-annual variations in topsoil temperature and volumetric water content for each SRIC. Paired t-tests were used to verify if there were differences in Corg concentrations (mg g−1) and pools (T ha−1) and OM chemical signatures of the topsoil between the SRICs and reference fields (samples collected in 2011). This meant pairing per site using the mean (calculated from the five sampling locations) of each land use. Each of the five sites was therefore considered a replication. Repeated-measures ANOVA were used for each site to test for the differences in Corg pools between topsoil samples at the onset (October 2011) and end (October 2013) of the incubation experiment. All statistical tests were conducted using JMP 10.0 [41]. Differences were considered significant when α ≤ 0.05.
We also used redundancy analysis (RDA) to identify the factors (or mechanisms) controlling willow leaf litter decomposition rate (k) and topsoil response to willow afforestation (expressed as percent increase in Corg pools) using climatic variables (average growing season air temperature, length of the growing season and degree-days), topsoil microclimatic conditions (average growing season temperature and volumetric water content), leaf litter chemical composition (N concentration and C:N ratio), and topsoil clay content and OM chemical signatures. Redundancy analysis is a multivariate direct gradient analysis method in which species response curves (i.e. k and percent increase in Corg pools in the topsoil) are presumed to have linear relationships with environmental gradients (i.e., climatic variables, topsoil microclimatic conditions, leaf litter chemical composition, topsoil clay content and OM chemical signatures). The results of the RDA were expressed in a biplot in which vectors pointing in the same direction were positively correlated, while those pointing in opposite directions were negatively correlated. To support the RDA, Pearson correlations were used to determine the strength of the relationships between the two dependent variables k and percent increase in Corg pools in the topsoil, and environmental variables. Redundancy analysis was performed using Canoco 4.5 [42].

3. Results

3.1. Carbon Concentrations and Pools in the Topsoil under SRICs and Reference Fields

Organic C concentrations and pools in the topsoil varied widely among SRICs of SX67. The SJPJ site had the highest concentrations and pools, whereas the STR and MTL sites displayed the lowest values (Table 3).
Short rotation intensive cultures of SX67 had significantly higher Corg concentrations and marginally higher pools in the topsoil compared to the reference fields (Table 3). On average, Corg concentrations and pools in the topsoil under SRICs of SX67 were about 25% higher than those of the reference fields. However, Corg concentrations and pools in the topsoil at the ABI site were similar between land uses. Also, Corg concentrations and pools in the topsoil at the SJPJ site did not exhibit much higher values under SX67 compared to the reference fields (15.5 and 7.6%).
Table 3. Organic carbon concentrations (mg g−1 ± standard error) and pools (Mg ha−1 ± 1 standard error) in the to.psoil (0–10 cm) of the five short-rotation intensive cultures of SX67 and reference fields (i.e., adjoining agricultural or abandoned fields) (N = 5).
SiteOrganic C concentrationOrganic C pools
SRICReferenceΔ 1 (%)SRICReferenceΔ (%)
ABI22.8 (0.80)22.8 (0.6)0.034.7 (1.3)33.4 (1.6)3.7
LAV24.0 (2.3)14.5 (2.3)39.638.5 (2.5)16.2 (8.7)57.9
MTL19.0 (2.7)11.8 (1.7)37.919.7 (1.3)16.4 (2.8)16.8
SJPJ34.2 (2.0)28.9 (2.0)15.543.2 (6.3)39.9 (6.0)7.6
STR18.0 (0.3)11.9 (0.6)33.931.4 (0.8)18.8 (0.7)40.1
Mean23.6 (2.88)17.9 (3.39)24.233.5 (3.7)24.9 (4.9)25.7
t-test3.59 2.17
p-value0.02 0.09
1 Δ = ((SRIC–Reference)/SRIC) × 100.

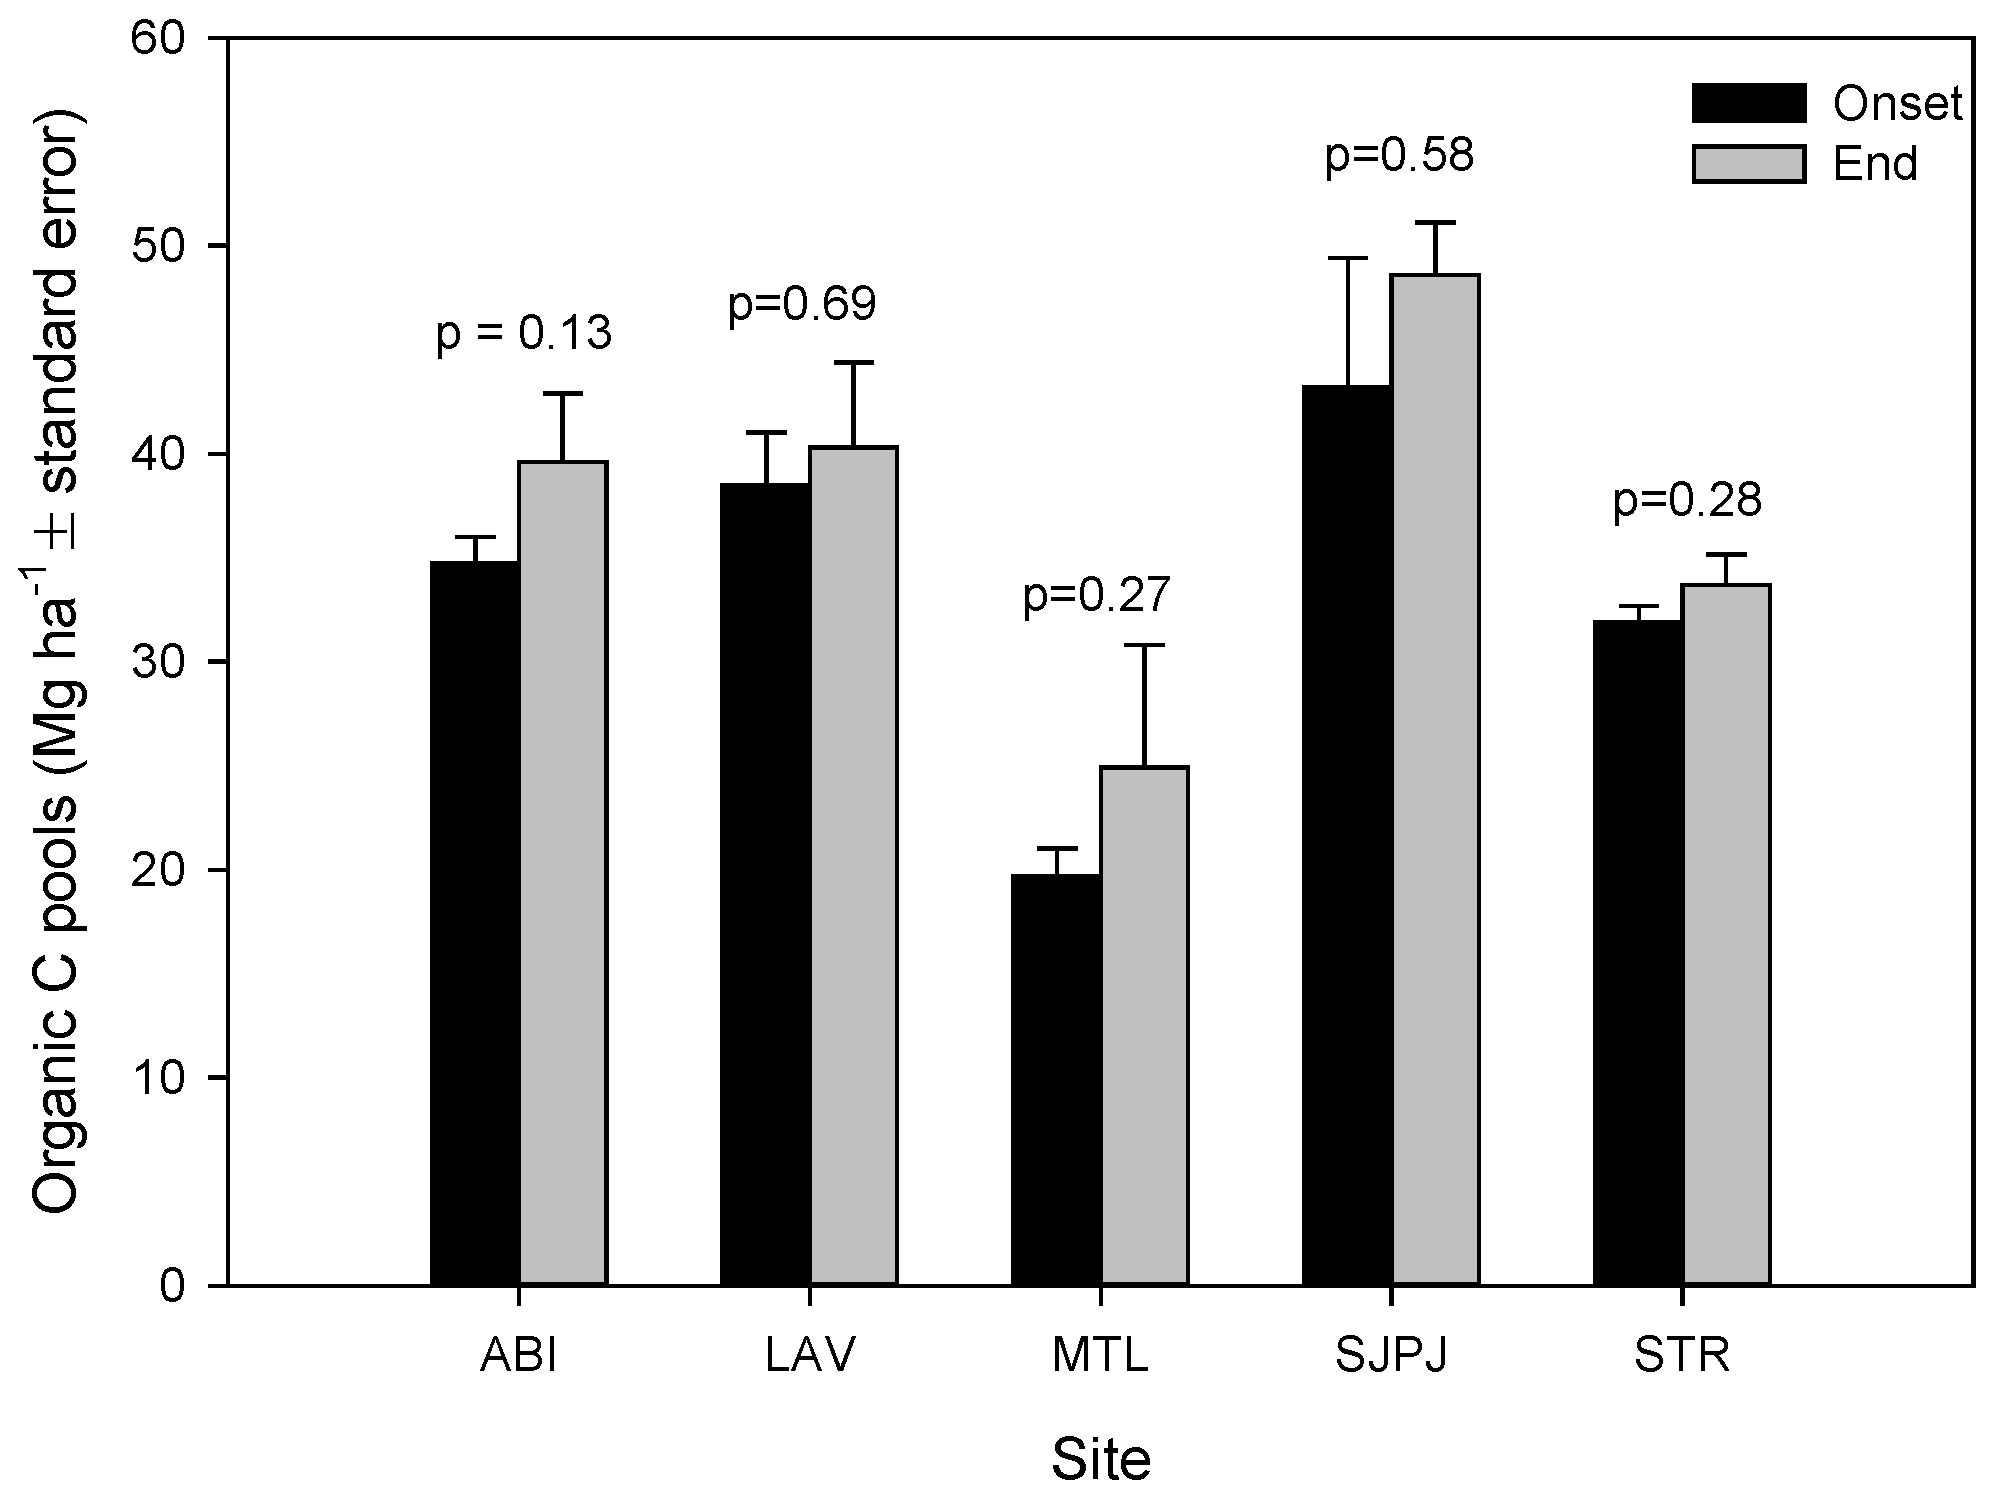
3.2. Organic Carbon Pool Changes in the Topsoil of SRICs over Two Years of Incubation

Although not statistically significant, Corg pools of the incubated topsoil samples under SRICs of SX67 increased over the two years by 19% at the MTL site, 14% at the ABI and SJPJ sites, and less than 5% at the LAV and STR sites (Figure 2). The average increase during the incubation experiment was 11%.

3.3. Organic Matter Chemical Signatures of the Topsoil under SRICs and Reference Fields

All topsoil NMR spectra were dominated by the O-alkyl region, followed by the alkyls and aromatic regions (Table 4). We detected no significant difference in OM chemical signatures between SRICs of SX67 and reference fields, except for alkyls, which were significantly higher (p = 0.05) under SX67. Similarly, the ratio of alkyls to O-alkyls + di-O-alkyls was significantly higher (p = 0.03) under SRICs of SX67 (0.56 ± 0.05) than in the reference fields (0.48 ± 0.03).
Figure 2. Organic carbon pools in the topsoil (0–10 cm) of the five short-rotation intensive cultures of SX67 at the onset (October 2011) and end (October 2013) of the incubation experiment.
Forests 06 00769 g002

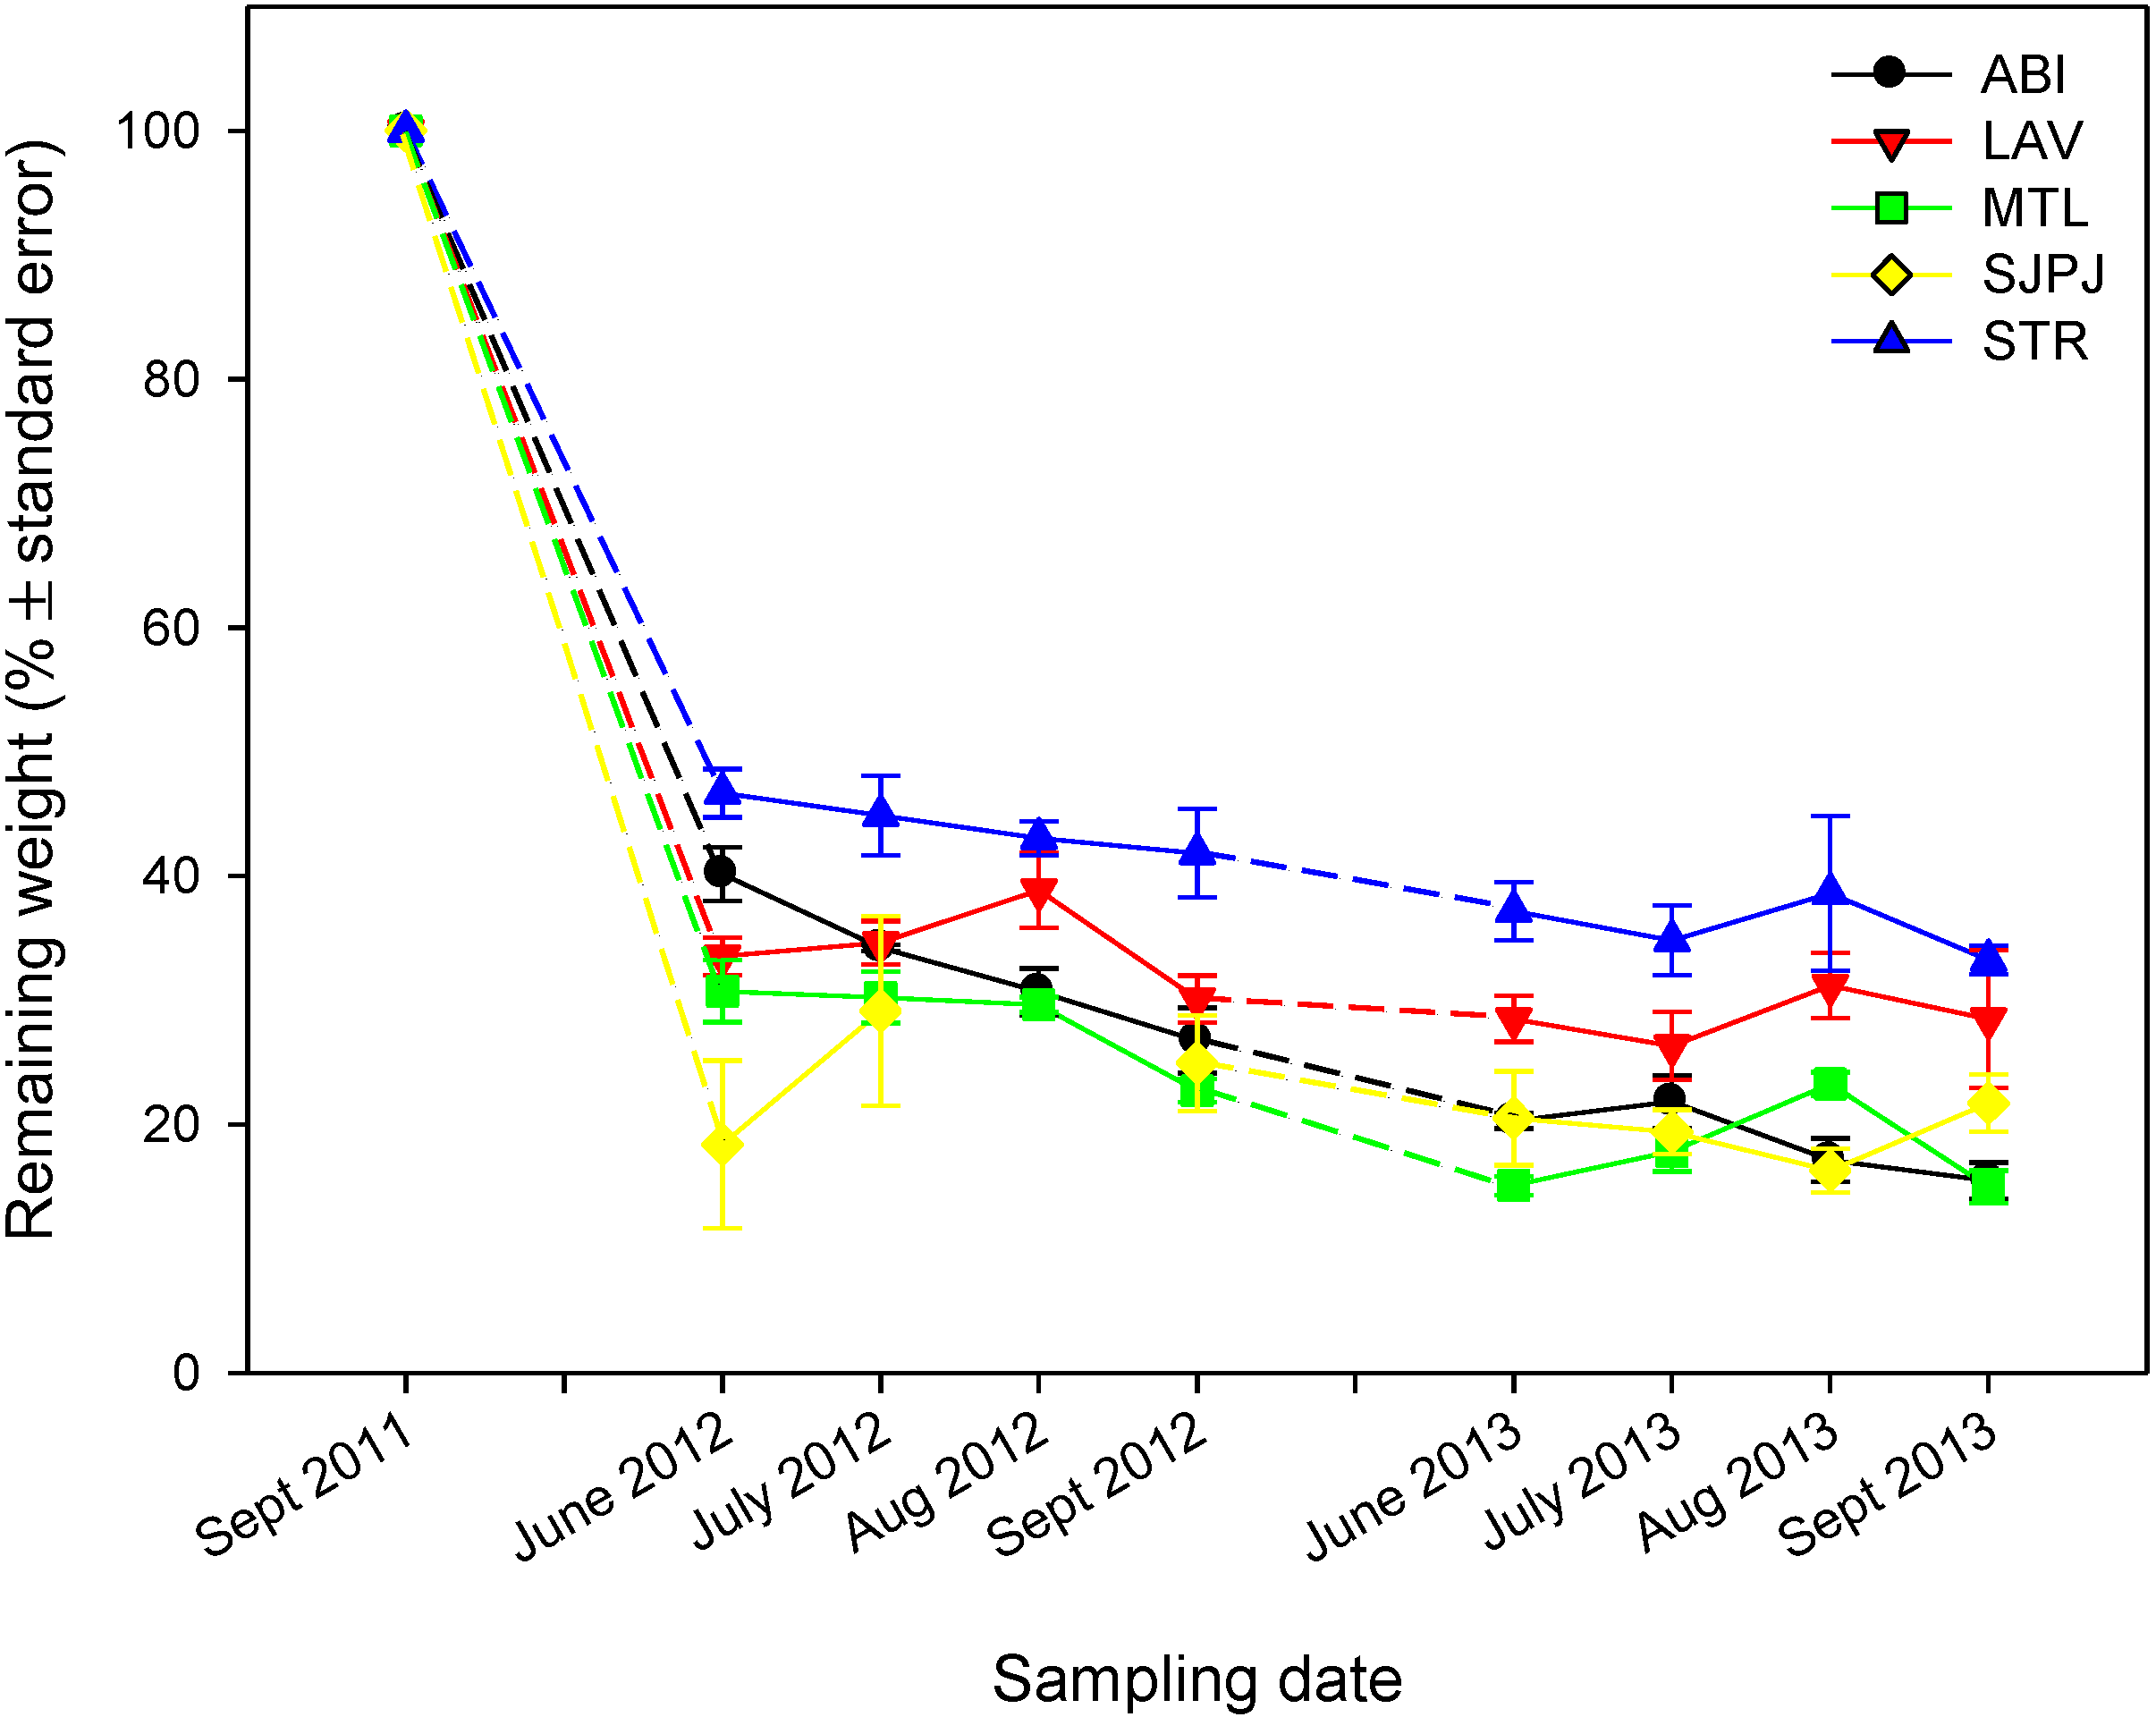
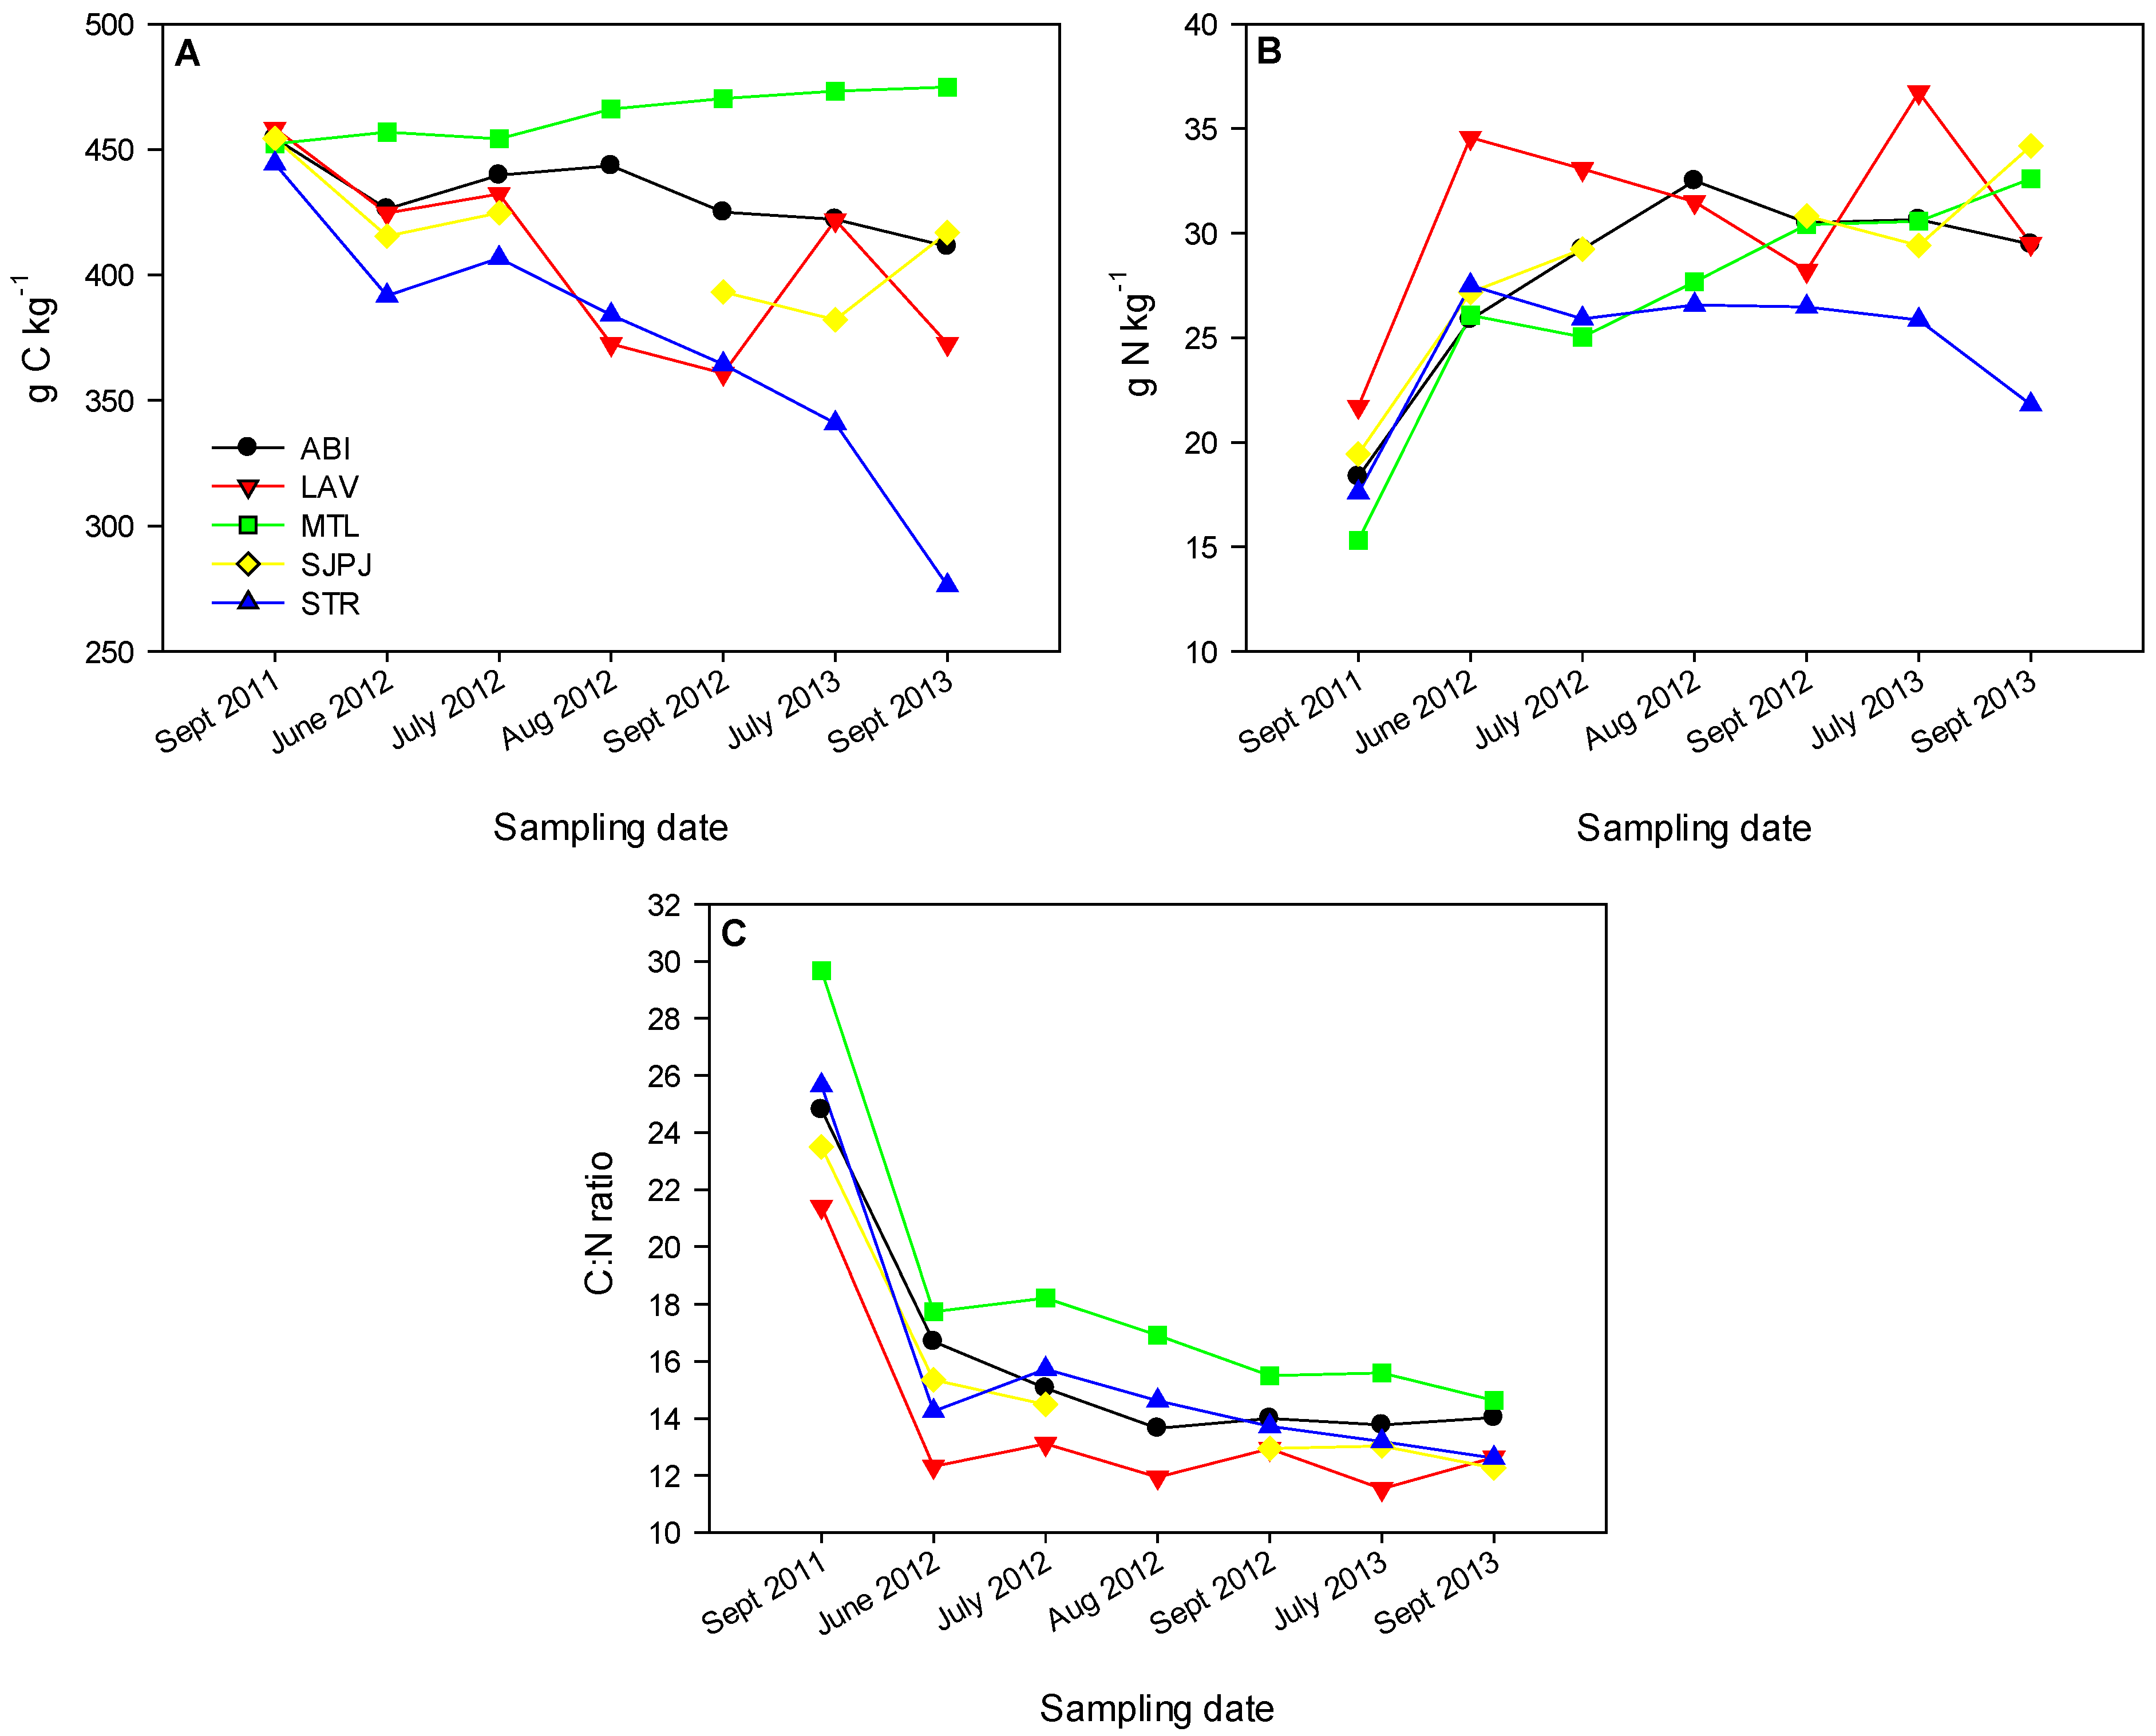
3.4. Willow Leaf Litter Decomposition, Chemical Composition and Litterfall (Leaf Only) Fluxes

During the two years of the leaf litter decomposition experiment, litter mass losses occurred more rapidly during the first few months. Depending on site, approximately 50% to 70% of mass losses occurred between September 2011 and June 2012, whereas mass losses were ca. 65 to 80% after two full years (Figure 3). Across the sites, the average leaf litter k, DLV and A values were 2.1, 77.2 and 0.23, respectively (Table 5). The estimated k was 30% greater at the LAV site compared with the other sites. The estimates DLV was greater at the ABI and MTL sites (85%) and lower at the STR site (67%), whereas the inverse was true for A, with a greater value at the STR site (0.33) and lower values at the ABI and MTL sites (0.15). The correlation between k and A suggests that one is an artifact of the other.
With the exception of the MTL site where leaf litter C concentrations increased slightly over the incubation period, leaf litter C concentrations tended to decrease with time at the other sites (Figure 4A). Decreases in leaf litter C concentrations ranged from 8% to 18% at ABI, LAV and SJPJ from the initial incubation to the final sampling (September 2013). However, the STR site exhibited a 40% decrease. This could be attributed to some contamination by soil [34,36], especially that about half of the decrease occurred during the last two sampling dates, i.e., when litter is decomposed to a point that it becomes more difficult to detect and clean soil. However, this did not appear to impact litter mass losses (and in turn, k, DLV and A). Conversely, leaf litter N concentrations increased with time at all sites (Figure 4B). At the MTL site, leaf litter N concentrations more than doubled over the two years, whereas the average increase in leaf litter N concentrations was ca. 50% for the other sites. Because leaf litter C and N concentrations generally decreased and increased, respectively, C:N ratios decreased substantially from the start (on average ~25) until the end (~15) of the experiment (Figure 4C). Most of the decrease in C:N ratios (>90%) occurred rapidly, i.e., between September 2011 and July 2012.
Figure 3. Leaf litter percent weight remaining (relative to initial mass, 100%) of SX67 at the five short-rotation intensive cultures during the two years of decomposition.
Forests 06 00769 g003
Table 4. Mean of organic matter chemical signatures (% ± standard error) determined by solid-state NMR spectroscopy for the topsoil (0–10 cm) of the five short-rotation intensive cultures of SX67 and reference fields (i.e., adjoining agricultural or abandoned fields) (N = 5).
SiteTreatmentAlkylsO-alkylsdi-O-alkylsAromaticsPhenolicCarboxylAldehydes + ketonesAlkyls / O-alkyls + di-O-alkyls
ABISRIC22459125700.41
Reference18429146810.35
LAVSRIC25368157810.57
Reference25388146710.54
MTLSRIC23399167600.48
Reference22419147600.44
SJPJSRIC29408114700.60
Reference25408125820.52
STRSRIC31367105830.72
Reference253771161030.56
MeanSRIC26.0 (1.7)39.2 (1.7)8.2 (0.4)12.8 (1.2)5.6 (0.6)7.2 (0.4)0.8 (0.6)0.56 (0.05)
Reference23.0 (1.4)39.6 (0.9)8.2 (0.4)13.0 (0.7)6.0 (0.3)7.8 (0.7)1.4 (0.5)0.48 (0.03)
t-test 2.73–0.430.00–0.27–1.00–1.18–1.503.13
p-value 0.050.681.000.800.370.300.210.03
Annual litterfall (leaf only) fluxes at the five SRIC of willow varied between 3.63 and 6.32 Mg ha−1 yr−1 (dry weights). The ABI site had the smallest annual flux (3.63 Mg ha−1 yr−1 ± 0.63 (S.E.)), MTL, STR and SJPJ had average annual fluxes (4.36 ± 1.69, 4.67 ± 1.01 and 5.15 ± 2.04 Mg ha−1 yr−1, respectively) and LAV had the largest annual flux (6.32 ± 2.53 Mg ha−1 yr−1).
Table 5. Mean leaf litter decomposition rate constant (k; year1), decomposition limit value (DLV; %) and asymptote (A) of SX67 at the five short-rotation intensive cultures for the two years of decomposition.
SiteK 1DLV 2A 3
ABI1.784.50.15
LAV2.871.50.28
MTL1.985.00.15
SJPJ2.078.30.22
STR2.066.80.33
Mean (±SD)2.1 (0.4)77.2 (8.0)0.23 (0.08)
1 The proportion of leaf litter biomass remaining after two years of decomposition was fitted to a nonlinear asymptotic model (equation 1) to produce k; 2 (1 – A) × 100; 3 The recalcitrant proportion of initial leaf litter mass with a decomposition rate near zero.
Figure 4. Leaf litter changes in carbon and nitrogen concentrations and carbon:nitrogen ratios (relative to fresh leaf litter, September 2011) of SX67 at the five short-rotation intensive cultures during the two years of decomposition.
Forests 06 00769 g004

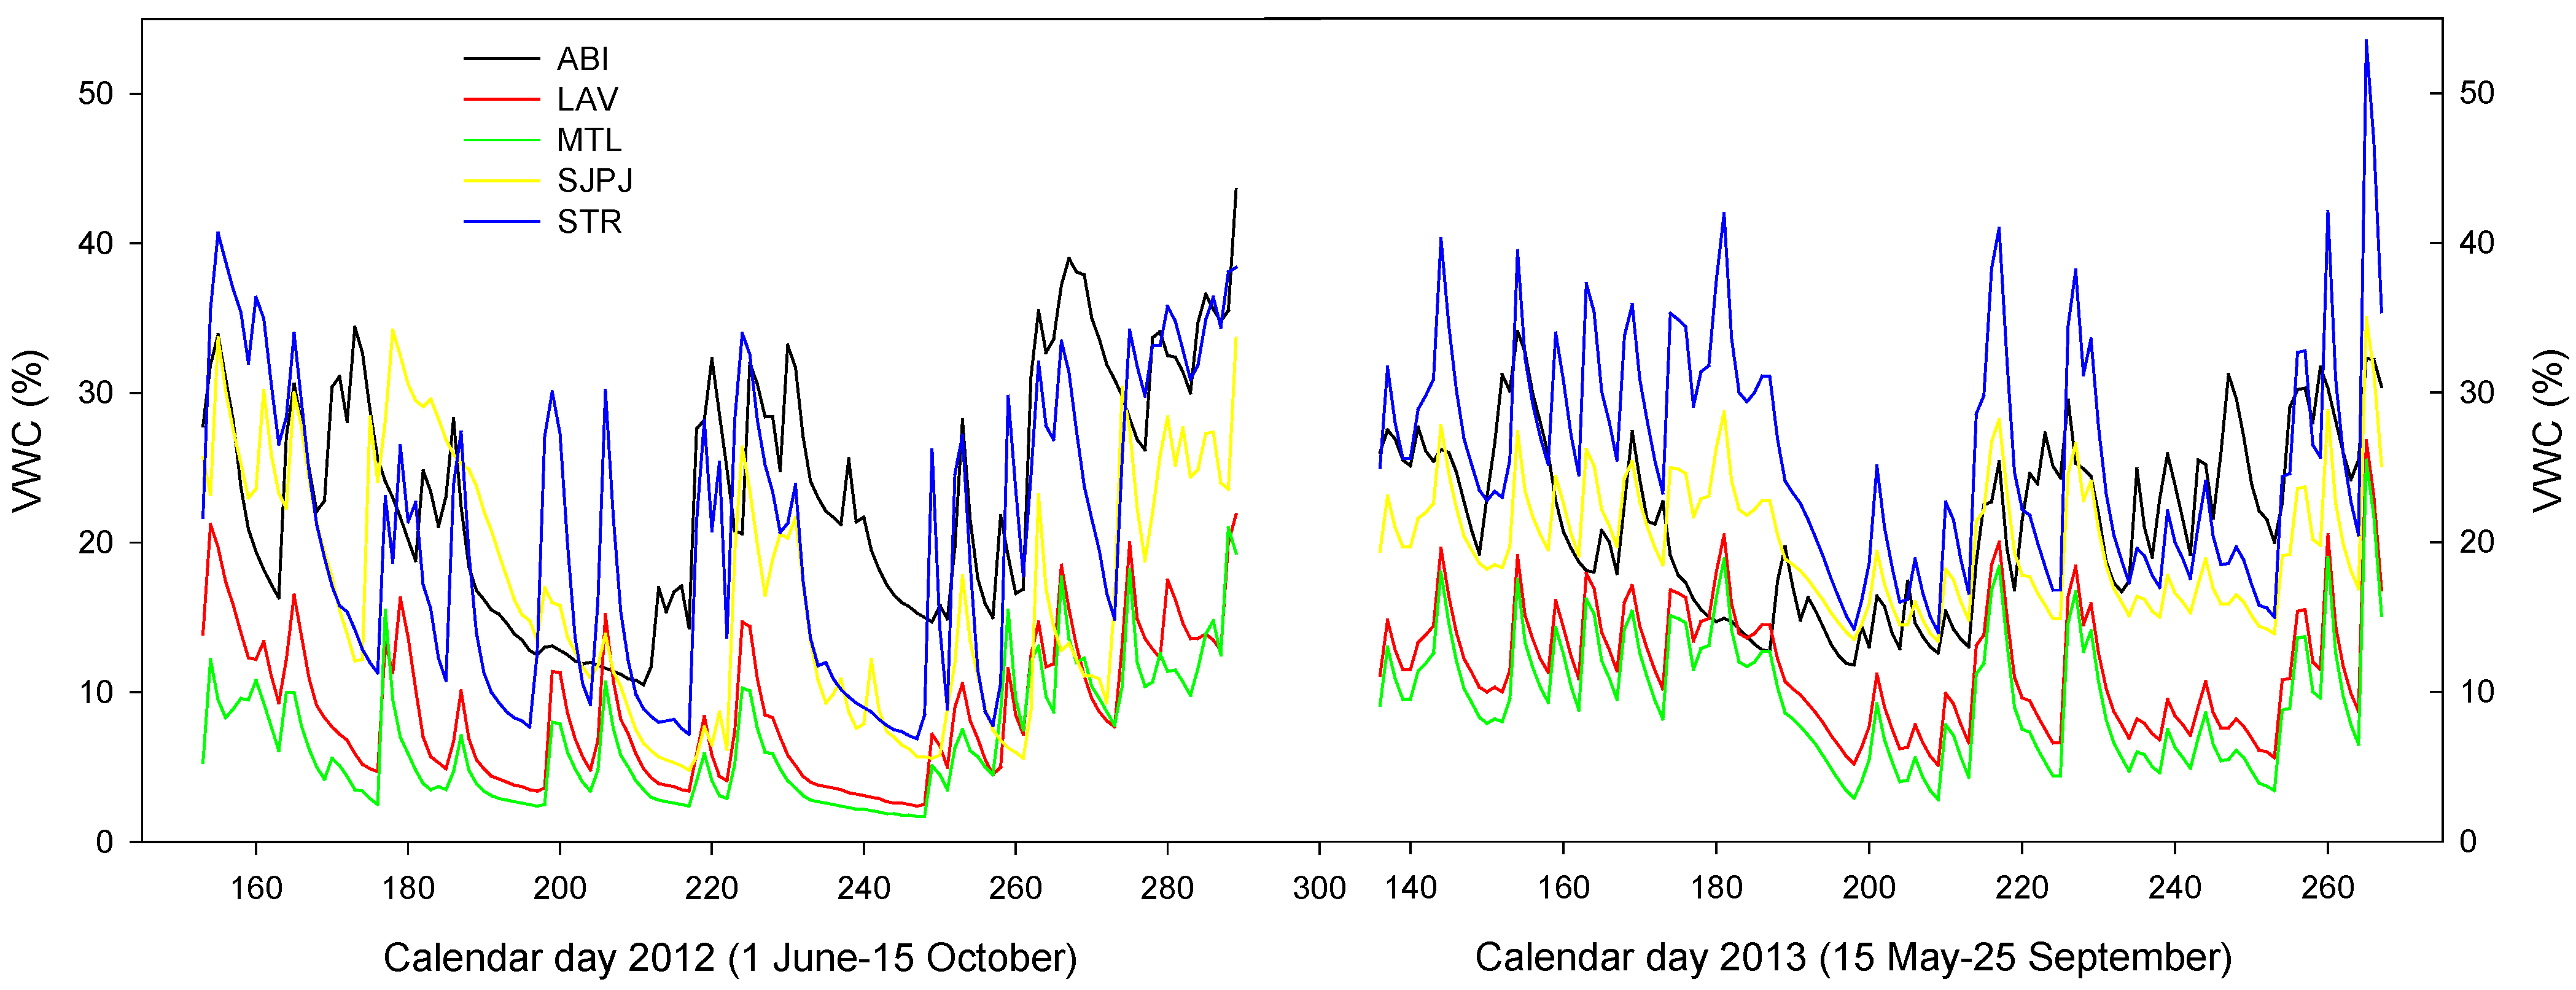
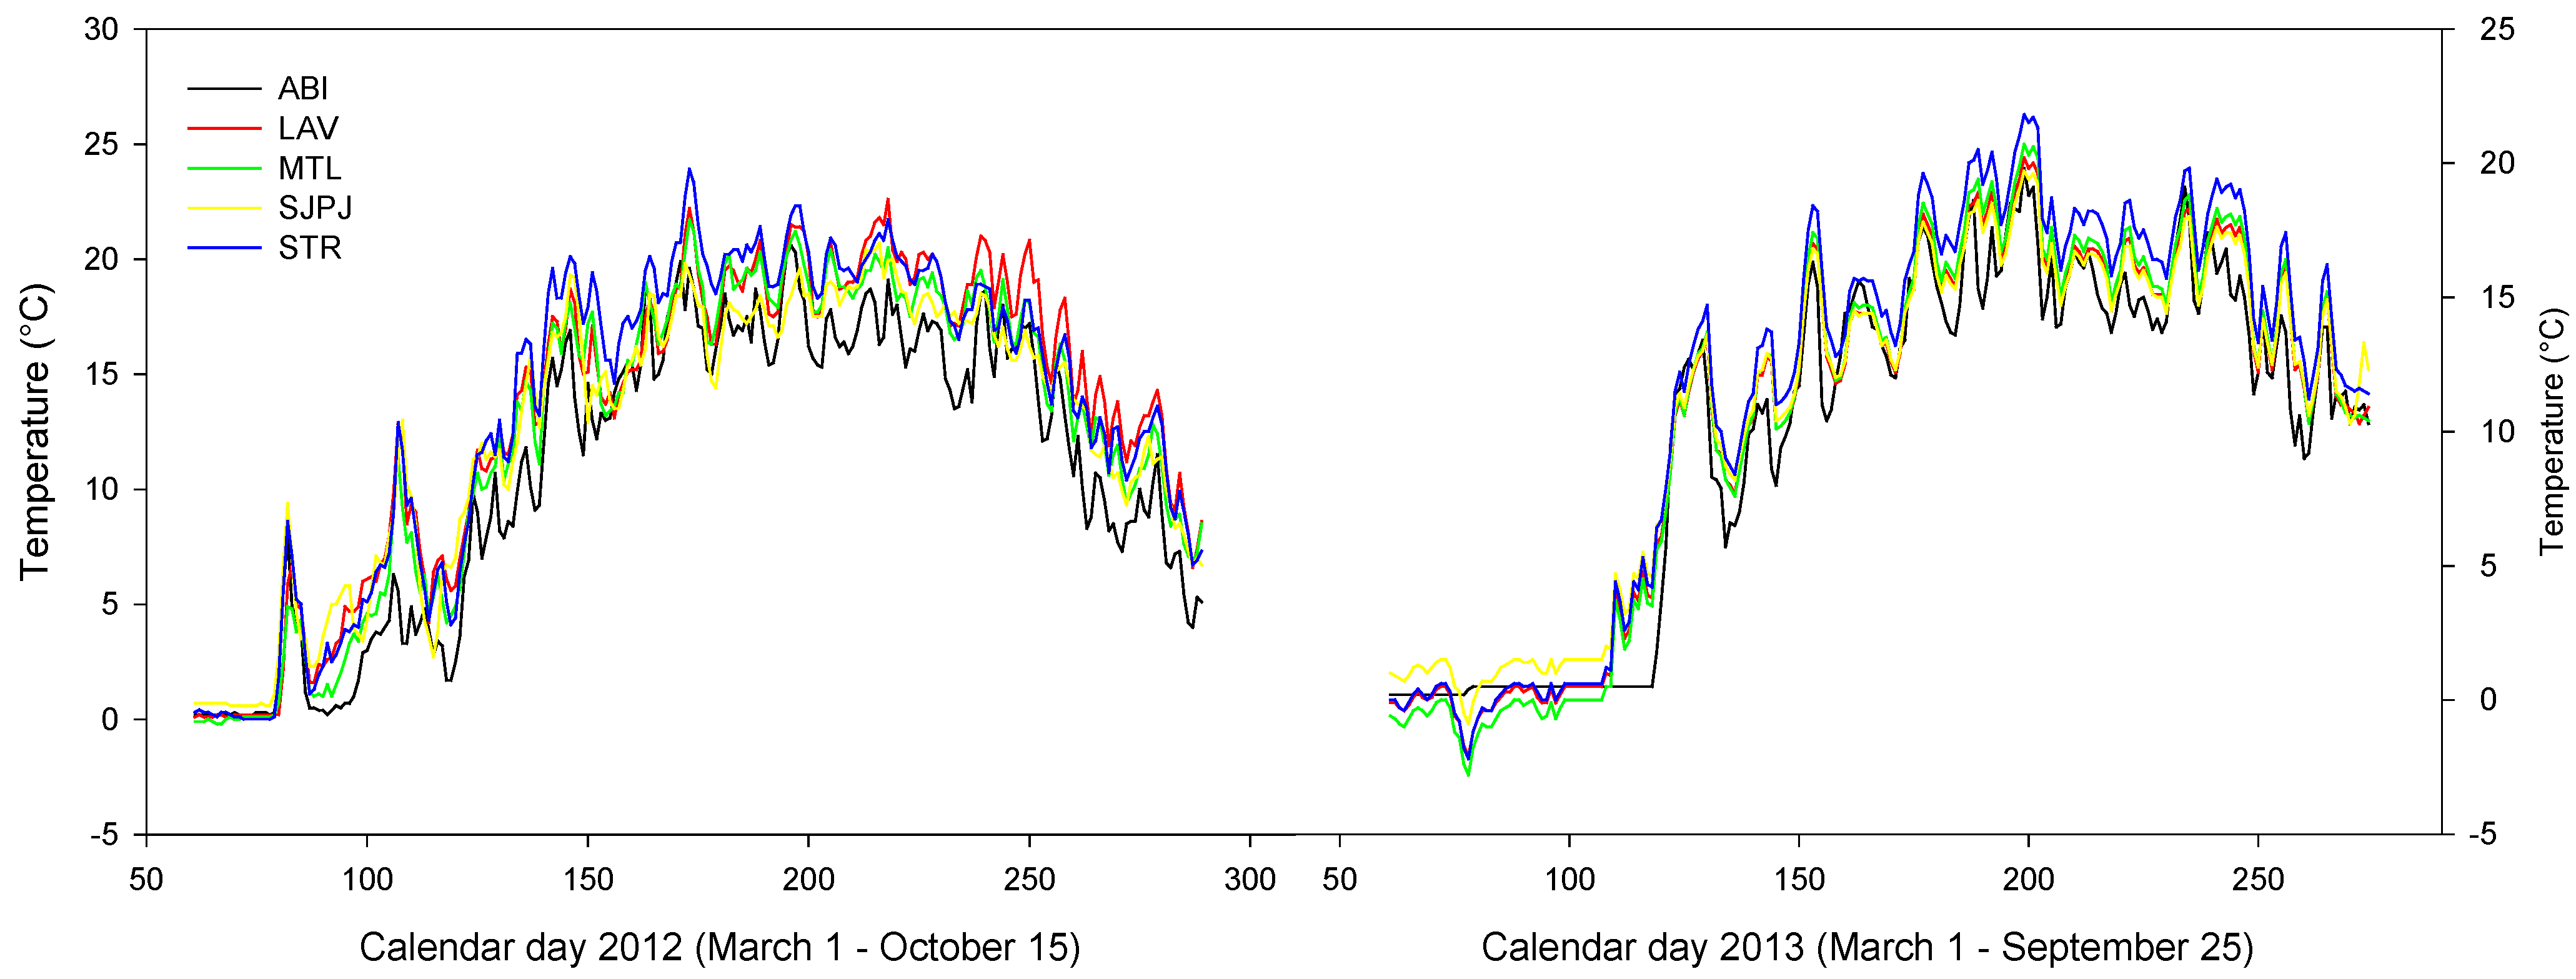
3.5. Microclimate of the Topsoil of the Five SRICs

Across all sites, temperatures in the topsoil followed similar trends during the 2012 and 2013 growing seasons, independently of site (Figure 5). In 2012, temperature was on average highest at the STR and LAV sites and lowest at the ABI site. In 2013, temperature was highest at the STR site and lowest at the ABI site. In 2012, topsoil started displaying temperatures above 0 °C approximately one month earlier than in 2013. Differences in temperature in the topsoil among sites were quite small when investigated on a daily basis (average coefficient of variation = 28%).
Figure 5. Temperature in the topsoil (0–10 cm) during the 2012 and 2013 growing seasons at the five short-rotation intensive cultures of SX67.
Forests 06 00769 g005
The VWC in the topsoil followed similar seasonal trends during the 2012 and 2013 growing seasons, displaying synchronous increases and decreases across the sites (Figure 6). The VWC during both 2012 and 2013 was on average highest at the ABI and STR sites and lowest at the LAV and MTL sites. Differences in daily VWC were larger (average coefficient of variation = 51%) than those of temperature.

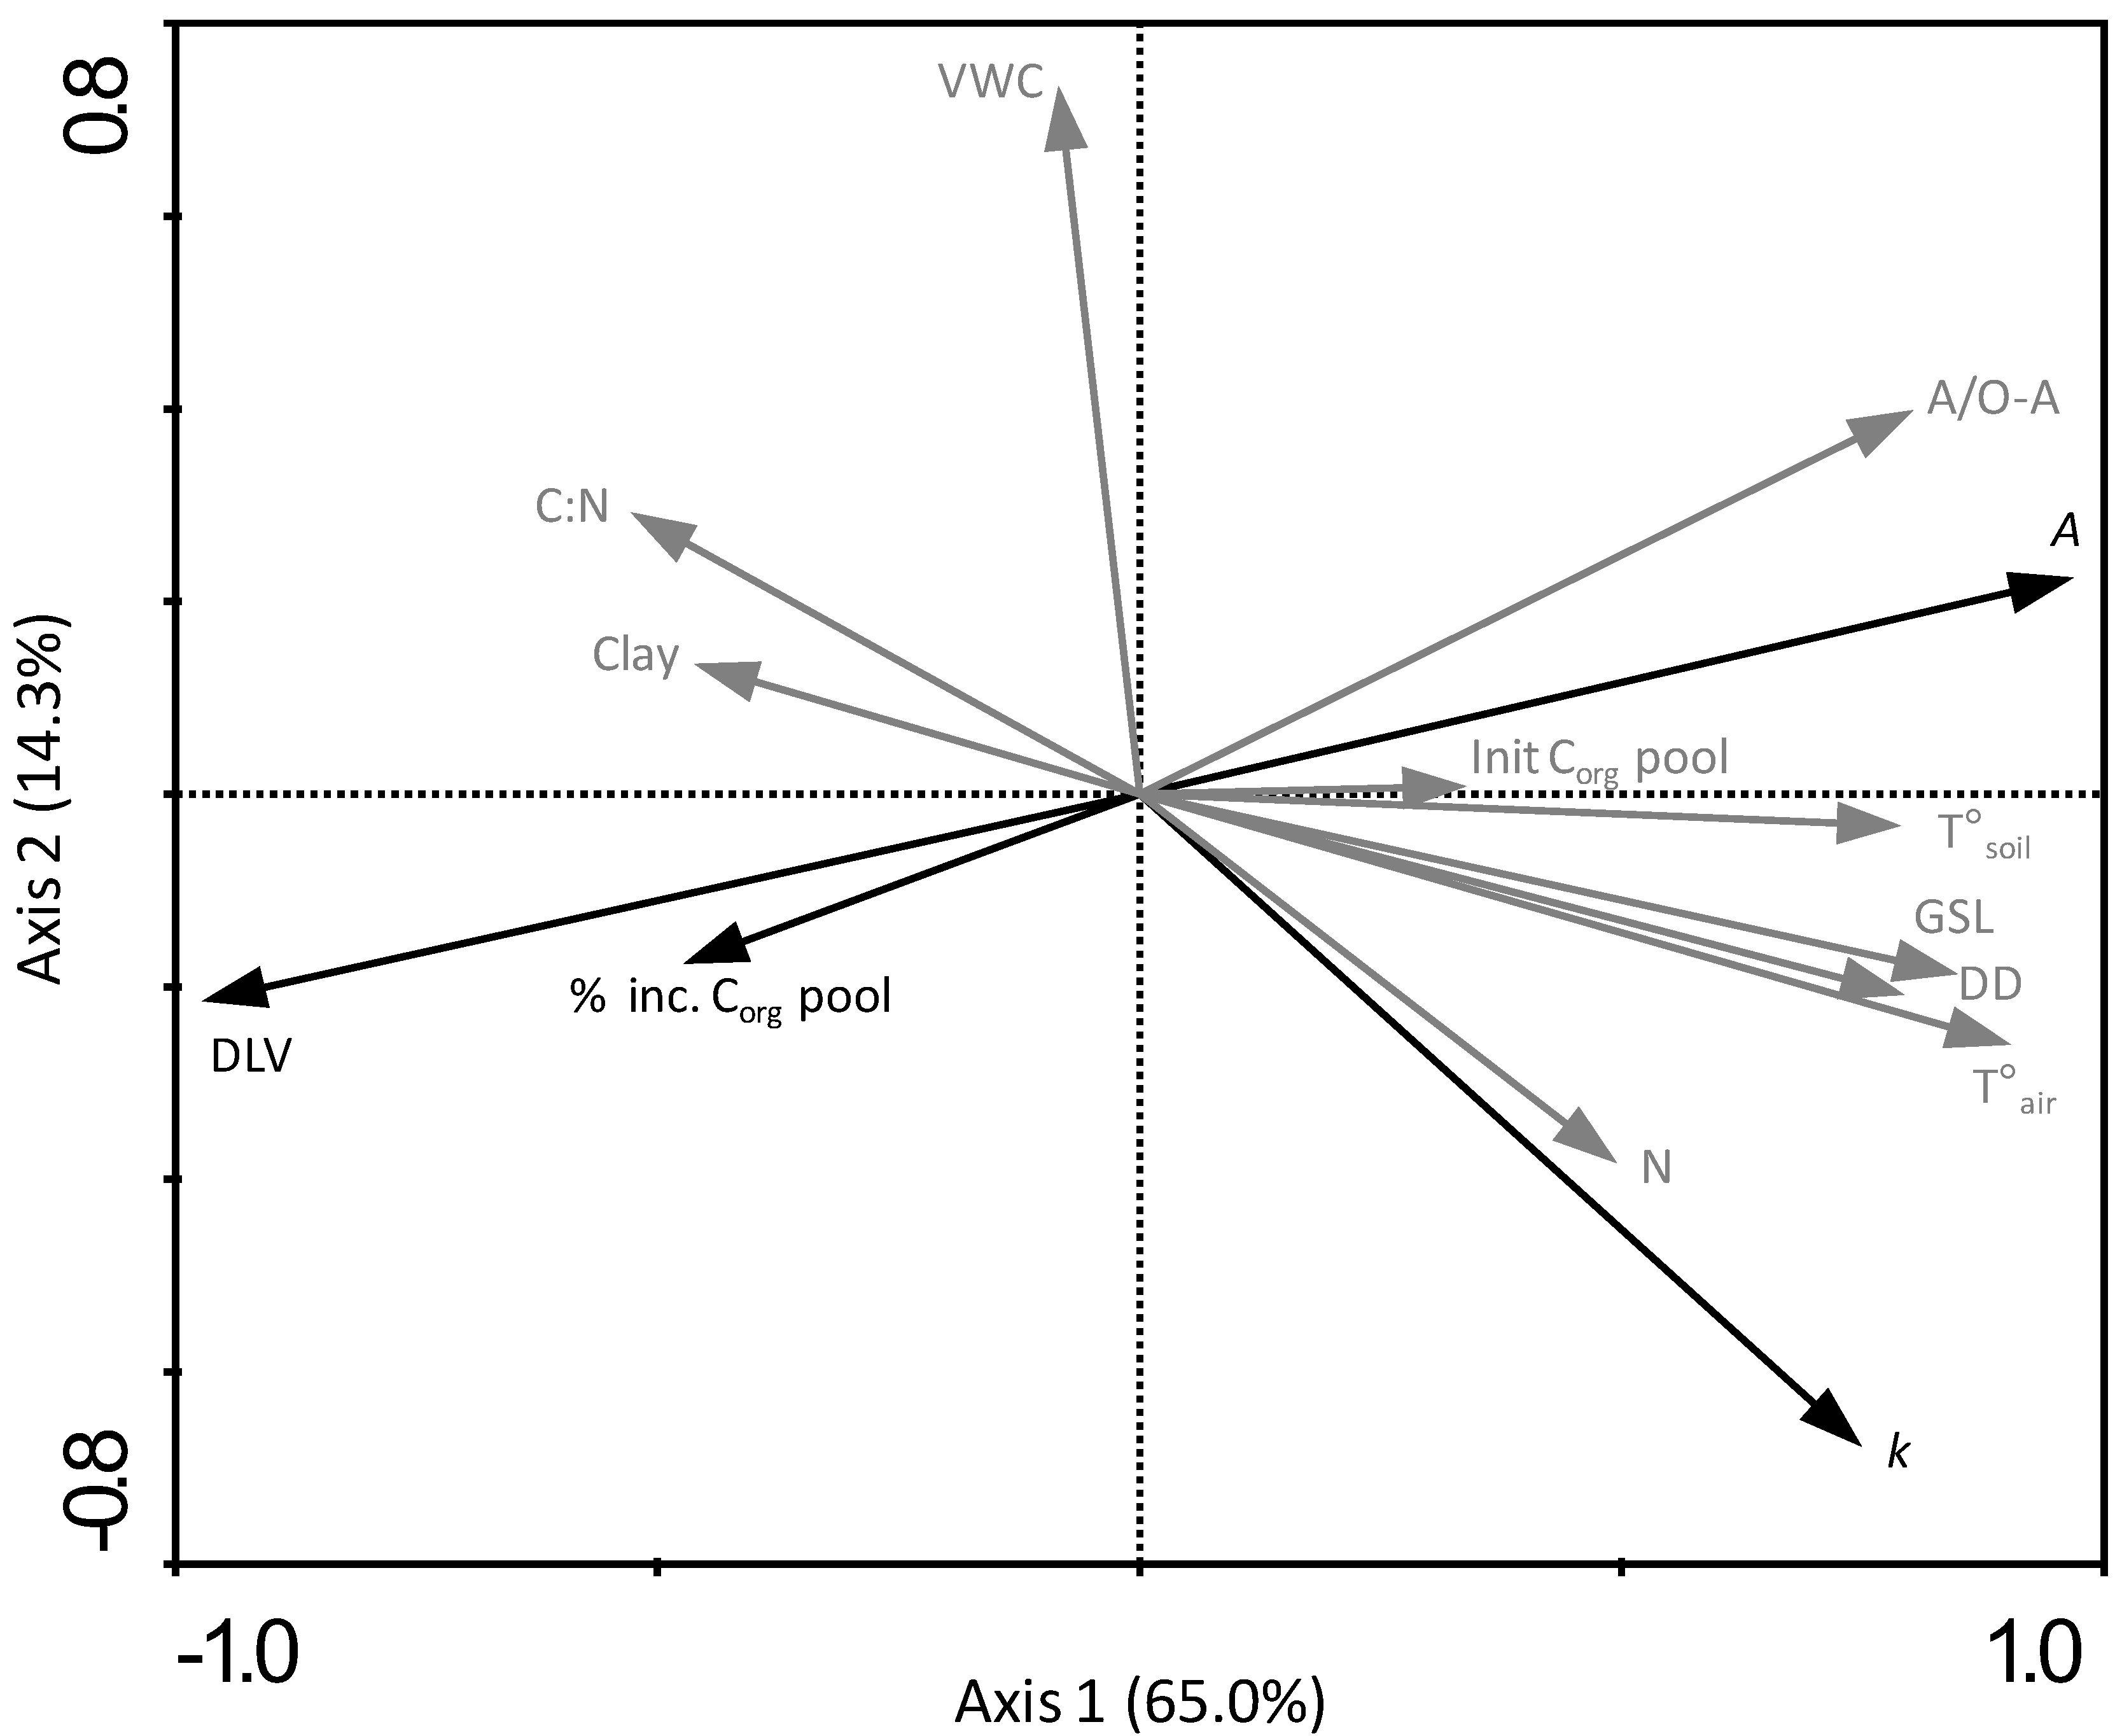
3.6. Relating Leaf Litter Decomposition and Organic Carbon Pool Increases in the Topsoil to Climatic Conditions, Leaf Chemistry and Organic Matter Quality

As illustrated by the RDA biplot (Figure 7) and confirmed by Pearson correlations, willow leaf litter k was positively correlated to climatic factors (r > 0.70; p < 0.01), i.e., growing season length (GSL), degree days (DD) and growing season average air temperature (Tair). Leaf litter k was also positively correlated with growing season average temperature (Tsoil, r = 0.58; p = 0.02) and negatively correlated with VWC (r = −0.55; p = 0.03) in the topsoil. Further, leaf litter k was positively correlated to leaf litter N concentration (r = 0.62; p = 0.01) and negatively correlated to leaf litter C:N ratio (r = −0.56; p = 0.02), and marginally positively correlated to OM alkyls to O-alkyls + di-O-alkyls ratio in the topsoil (A/O-A; r = 0.31; p = 0.09). Contrary to leaf litter k, leaf litter DLV was negatively correlated to climatic factors (i.e., GSL, DD and Tair, r < −0.72; p < 0.01). Leaf litter DLV was also negatively correlated to Tsoil (r = −0.78; p < 0.01) and OM A/O-A ratio (r = −0.89; p < 0.01), and marginally negatively correlated to leaf litter N concentration (r = −0.37; p = 0.08) and marginally positively correlated to leaf litter C:N ratio (r = −0.44; p = 0.06). As for A (i.e., recalcitrant proportion of initial leaf litter), it was positively correlated to climatic factors (i.e., GSL, DD, and Tair, r > 0.71; p < 0.01), Tsoil (r = 0.79; p < 0.01) and A/O-A ratio (r = 0.91; p < 0.01). Asymptote A was also marginally positively correlated to leaf litter N concentration (r = 0.36; p = 0.08) and marginally negatively correlated to leaf litter C:N ratio (r = −0.43; p = 0.06).
Figure 6. Volumetric water (VWC) content in the topsoil (0–10 cm) during 2012 and 2013 growing seasons at the five short-rotation intensive cultures of SX67.
Forests 06 00769 g006
Although the percent increase in Corg pools in the topsoil was not significantly correlated to any of the selected variables, it was marginally negatively correlated to OM A/O-A ratio in the topsoil (r = −0.24; p = 0.11) and to climatic factors (i.e., GSL, DD, and Tair, r = −0.25 to −0.31; p = 0.10 to 0.11) and initial Corg pools (r = −0.33; p = 0.09). As a whole, results suggest that both decomposition of SX67 leaf litter and increase in Corg pools in the topsoil were controlled at the various sites by a combination of climatic and soil factors, litter chemistry and OM quality.

4. Discussion

4.1. Organic Carbon Accumulation Following Afforestation with Willow

Although SRIC has been considered for bioenergy production and C accumulation for more than a decade [9,14,43], surprisingly few studies have directly measured the potential of SRICs of willows to sequester Corg in soil. Within the five SRICs of SX67 studied, Corg concentrations and pools in the topsoil were consistently greater (0 to 58%, average 25%) under SRICs than in reference fields. These results are in accordance with Jug et al. [9] who reported increases ranging from 10% to 90% in the first 10 cm of soil after seven to ten years of willow growth in Germany (see Figure 4 in their paper). Similarly, Kahle et al. [10] measured increases in Corg concentration in the first 20 cm of soil ranging between 33% and 41% after six to seven years of willow, depending of site (see Table 3 in their paper). When reported on an annualized basis, Corg accumulation rates in the topsoil are 4.5, 2.1, 1.6, 1.1 and 0.4 Mg C ha−1 yr−1 at the LAV, SJPJ, STR, MTL, and ABI sites, respectively (Table 3). Annual Corg accumulation rates estimated from the incubated topsoil samples are also in the same range, i.e., 0.7, 0.8, 1.9, 2.6 and 2.9 Mg C ha−1 yr−1 at the LAV, STR, MTL, ABI and SJPJ sites, respectively, (Figure 2). In southern Quebec, Zan et al. [14] reported Corg accumulation rates of 9 Mg ha−1 yr−1 over four years in the first 60 cm of soil in one field planted with Salix alba × glatfelteri L., whereas no change was observed in another field. The effect of afforestation was tested by using a cornfield as the benchmark (see Figure 5 in their paper). Using a budget approach, Rytter [44] estimated a net accumulation rate for the whole soil of 0.4 Mg C ha−1 yr−1 over 20 to 22 years, which is equivalent to our smallest accumulation rates.
Figure 7. Redundancy analysis biplot showing the relationships of SX67 leaf litter decomposition rate constant (k), decomposition limit value (DLV), asymptote (A; i.e. recalcitrant proportion of initial leaf litter), and percent increase in organic carbon pool in topsoil (% inc. Corg pool) (black vectors) with pedoclimatic and biotic site factors (grey vectors). A/O-A is the ratio of alkyls to O-alkyls+di-O-alkyls in the topsoil; C:N is the ratio of carbon to nitrogen of SX67 leaf litter; Clay is the clay content in the topsoil; DD is degree days; GLS is the growing season length; Init Corg pool is the initial (October 2011) organic carbon pool in the topsoil; N is the nitrogen concentration of SX67 leaf litter; Tair is the growing season average air temperature; Tsoil is the growing season average temperature in the topsoil; and VWC is the growing season average volumetric water content in the topsoil.
Forests 06 00769 g007
The greater Corg concentrations and pools in the topsoil under woody plantations compared to agricultural (or abandoned) fields are generally ascribed to greater net primary productivity (NPP) and litter input (via leaves or roots) [17,45]. Our estimates of annual litterfall fluxes at the five SRICs of SX67 are quite high. We did not measure C concentrations in litterfall. However, for the sake of simplicity, if C is assumed to be half of the total weight of willow leaf litter, this corresponds to an annual aboveground C flux ranging from 1.81 to 3.16 Mg dry weight C ha−1. These fluxes are in the same order of magnitude (or above) as our estimates of Corg accumulation rates in the topsoil. The conversion of arable land to SRICs of willows also implies a shift from a shorter to a longer residence time of C by replacing annual crops with a long-lived and productive perennial woody species [26,44]. Within two to six years of planting, our results therefore suggest that Corg accumulated in the topsoil under SX67, providing a relatively high aboveground and belowground biomass production of these five SRICs (and in turn, a large C inputs from leaf and root litters) after a short tenure time. Using ingrowth cores set within the first 20 cm of soil, fine root production at the five SRICs was measured at 1.2 to 2.4 Mg dry weight ha−1 yr−1, or about half as C, in the same SRICs and sampling locations as this study and during the same period. Rytter [46] also reported fine root mortality to be 0.5 to 6.8 Mg ha−1 yr−1 in SRICs of Salix viminalis with four-year-old stools. Clearly, root litter also represents a considerable flux of C to the topsoil at our sites. It should be noted, however, that our data is for the first 10 cm of soil and that some studies reported small decreases in Corg concentrations and pools below 20 cm after willow shrubs were established, which resulted in no net change in Corg from afforestation at some sites [9,17]. This response is apparently site-specific and depends, in part, on cultivation and cropping history and soil factors such as texture, which all affect OC levels and distributions in the soil profile. It can also be due to the rooting profile of willow. In the case of SX67, fine roots are mostly distributed within the first 20 cm of soil [47].
Interestingly, the net accumulation of Corg in the topsoil under SX67 was observed despite the possible Corg losses that were induced due to mechanical soil preparation at the time of plantation establishment—tillage breaks up soil aggregates and reduces the structuring effect of earthworms, thus decreasing soil stability and increasing soil Corg losses [48], and it tends to increase soil temperature, which accelerates the loss of soil Corg by the mineralization of OM [49,50]. According to Polglase et al. [30], changes in soil Corg following afforestation depend not only on cultivation history but also on many other factors, e.g. plantation age, climate, soil type including particle size distribution and chemical composition (initial Corg), site management such as stocking, thinning, fertilization as well as harvesting and management of residues. These factors affect the amount of leaf and root litters produced and the rate of decomposition, which in turn, impact soil Corg levels and distributions. Unfortunately, very few studies aimed to identify (and quantify) the pedoclimatic and biotic factors affecting OM decomposition and thus, soil Corg accumulation under willows. In this context, our study of SRICs of SX67 established along a large geographical gradient in southern Quebec with varying soils and climates provides insights on some important factors controlling soil Corg accumulation. The later discussion emphasizes on leaf litter decomposition and soil OM quality.

4.2. Willow Leaf Litter Decomposition

Leaf litter decomposition is key to C cycling and soil Corg accumulation [51,52]. Soil Corg accumulation occurs when the rate of OM inputs exceeds the rate of C losses (via CO2 in the air or dissolved C forms in leachate) induced by microbial decomposition. The rate of litter decomposition is determined by factors such as climate, soil chemical composition, microbial and invertebrate activity, and litter quality [53,54]. The estimated k, DLV and A values for SX67 leaf litter across the five SRICs in southern Quebec were in the same range as values reported by Hangs et al. [34] for seven willow cultivars under the drier climates of southern Saskatchewan and those generally reported in the literature for deciduous tree species [55]. Our three coldest sites, i.e., ABI, SJPJ and MTL, had the lowest k and A values but the highest DLV (Table 1 and Table 5). The warmer (and most southern) LAV and STR sites had the lowest DLV values but the highest A values and the highest k at LAV. Redundancy analysis and Pearson correlations also revealed that leaf litter decomposition varied across the sites according to climatic factors (Figure 7). Specifically, it was positively correlated to growing season length, degree-days and growing season average air temperature. Additionally, leaf litter decomposition was related to moisture (negatively) and temperature (positively) in the topsoil. The literature generally suggests that warmer conditions lead to faster leaf litter decomposition (e.g., [53,54]). This climatic effect on leaf litter decomposition was captured by the large geographical gradient covered with the experimental design. High soil moisture is also well recognized to slow down leaf litter decomposition through the negative effects of reduced soil temperature and aeration on microbial activity [53,56]. Soil microbial decomposition is optimal when soil water-filled pore space (WFPS) is 60%, whereas it is decreased when WFPS is 70% and above [57]. We calculated WFPS to range between 10% and 60% across the SRICs when using averaged growing season VWC (data not shown). However, using the 100 highest VWC values for each SRIC over the two years, WFPS ranged from 23% to 100% (data not shown). More specifically, the ABI (0.49–0.85), SJPJ (0.51–0.85) and STR (0.41–100) sites, respectively, reached WFPS values above 60% at least 40, 49 and 125 times, whereas the WFPS at LAV (0.24–0.55) and MTL (0.23–0.45) were always below 60%. Across the SRICs, leaf decomposition rate was negatively correlated to the maximum growing season WFPS (r = −0.62, p < 0.01), suggesting that soil moisture was sufficiently high at ABI, SJPJ and STR during wet periods of the growing season to reduce leaf litter decomposition rates. Hence, the array in moisture conditions in the topsoil represented by the five SRICs in this study was large enough to exert a substantial impact on leaf litter decomposition.
The inverse relationship between DLV values vs. k and A (Figure 7) for our five SRICs of SX67 is also one that was observed by Hangs et al. [34] with willow cultivars in Saskatchewan and is consistent with our understanding of leaf litter decomposition dynamics [58]. High leaf litter quality (especially initial high N concentration or low C:N ratio) typically supports high decomposition rate in early stages, but it also leads to a larger fraction of recalcitrant biomass remaining (i.e., A). As a result, initial leaf litter N concentration is frequently positively correlated to A [55]. Similarly, willow leaf litter k and A were positively correlated to leaf litter N concentration and negatively correlated to leaf litter C:N ratio (Figure 7) for the five SRICs studied, whereas the opposite was true for DLV. During the early stage of decomposition (<1 year), litter quality is the primary regulator of k. But as decomposition advances, lignin concentration increases and becomes a key factor for further decomposition [59]. Also, litter decomposition may be inhibited by the enrichment of low molecular weight N compounds. These compounds may react with lignin to create more recalcitrant aromatic compounds and decrease the production of ligninolytic enzymes by soil fungi [60]. Leaf litter N enrichment (and thus, a decrease in C:N ratio) was evident over the two years of incubation at all five SRICs (average increase in N levels = 60%).
The time to reach a new soil Corg equilibrium (i.e., a balance between inputs and outputs) following afforestation may be quite short under warm climates because of the higher decomposition rates of OM [61]. However, C losses can be large under such climates, thus resulting in lower net soil Corg accumulation. Conversely, leaves with high levels of tannins and phenolics (e.g., conifers) have slower decay rates, forming recalcitrant complexes with other substrates such as cellulose or protein rates [61,62]. Tannin- and phenolic-containing litters may slow down microbial activity and thus inhibit OM decomposition [63]. Colder environments and/or acidic soils also inhibit organic matter decomposition. Therefore, boreal forest ecosystems tend to accumulate large amounts of soil Corg (mainly as forest floor), but the equilibrium after disturbance (e.g., fire) takes longer to be reached [64]. In the case of willow under temperate climates, Schofield et al. [65] showed that leaf litter phenolics and tannins decrease quickly and essentially disappear within six weeks of leaf fall, suggesting that changes in Corg in the topsoil can occur quite quickly in such systems. Our results suggest that only two or three years of litterfall and root inputs were sufficient for net Corg accumulations to occur in the topsoil following afforestation with SX67 in southern Quebec.
Organic C accumulations in the topsoil were more pronounced at the LAV, MTL and STR sites (Figure 2). Soils consisting of mostly coarse particles (sand and silt) and containing low levels of clay are more susceptible to rapid decomposition of organic matter, oxidation of C as well as soil erosion and organic matter losses [66]. The low Corg values in the topsoils of the reference fields at the LAV, MTL and STR sites are thus attributed to their low clay content (11.3, 3.7, and 8.7%, respectively). Additionally, the LAV and STR sites have had a long cultivation history prior to the establishment of willow, which has likely contributed to significant Corg losses in the plowed layer prior to willow establishment [16]. The low Corg values in the topsoil at the MTL site are also explained by the fact that this SRIC was established on a former forest soil (podzol (or spodosol) formed from a mixedwood of white spruce, balsam fir and birch spp.) developed from coarse sands and characterized by upper mineral horizons (diagnostic eluviated A and illuvial B horizons) with very low OM [67,68]. With a large new flux of OM to the soil from leaf litter and roots under SRIC of SX67, the sites with initially lower Corg levels in the topsoil therefore had a greater potential for Corg accumulation [22,45]. Also, the LAV and STR sites had high A values (0.28 and 0.33, respectively) and thus low DLV values, suggesting that the more incomplete decomposition of leaf litter contributed to Corg accumulation in the topsoil. The recalcitrant portion of leaf litter is suggested as an important component leading to soil Corg accumulation under SRICs of willows [34].
Conversely, high Corg levels in the topsoil at the ABI and SJPJ sites can be explained by their high clay content (45% and 23%, respectively). Soil Corg concentrations have been shown to be positively linked to high clay content (i.e., >20%), thus favoring the formation of chemically stable organo-inorganic compounds that physically protect Corg from bacterial activity [17,45,69]. The potential for these latter sites to accumulate Corg in the topsoil was therefore smaller than the three other sites. In fact, the Corg levels in the topsoil after the first three years of willow growth at the ABI site were not different from Corg levels of the reference fields. However, the three coldest sites, including ABI and SJPJ, showed the greatest Corg changes during the two years (October 2011 to October 2013) of the latter topsoil incubation experiment (19% over two years or 1.9 Mg C ha−1 yr−1 at MTL, and 14% over two years or, respectively, 2.6 and 2.9 Mg C ha−1 yr−1 at ABI and SJPJ) (Figure 2). The fact that increases in Corg levels in the topsoil came latter at ABI and SJPJ could be due to their lower k and A and higher DVL values as slower leaf litter decomposition rates may lead to a slower soil response to afforestation. Thus, multiplying annual litterfall fluxes for each SRIC by their corresponding A values provides another estimate of the potential rate of Corg accumulation in the topsoil for each SRIC, again assuming a C fraction of 0.5. In this case, the yearly Corg accumulation rates would be 0.27 Mg ha−1 at ABI, 0.28 Mg ha−1 at MTL, 0.56 Mg ha−1 at SJPJ, 0.77 Mg ha−1 at STR and 0.88 Mg ha−1 at LAV. The differences between SRICs using this approach are smaller than those of estimated (pairings of SRICs and reference fields) or measured (incubation study) yearly Corg accumulation rates. Values are also more conservative and within or above those reported (0.15 to 0.28 Mg ha−1) for SRICs of willows in southern Saskatchewan [34], Germany [10] and Sweden [44]. Assuming that half of fine roots die every year and a C fraction of 0.5, fine roots likely provide an additional flux of 0.3 to 0.6 Mg ha−1 yr−1 at the sites (according to [30]). The ascending order of litterfall C fluxes (ABI < MTL < SJPJ < STR < LAV) also follows a similar order using pairings of SRICs of SX67 and reference fields (ABI < MTL < STR < SJPJ < LAV). In this case, the pairing approach seems to have been suitable for characterizing the relative Corg response of the sites to willow afforestation.
Our results also support that willow leaf litter decomposition varied across the sites. In addition to k and A being positively related to leaf litter N concentration and negatively correlated to litter C:N (or the opposite for DLV), there were positive correlations between leaf and soil N concentrations (r = 0.39, p = 0.07) and between leaf and soil C:N ratio (r = 0.50, p = 0.04) (results not shown). Since the same willow clone was used at all five SRICs, our results suggest that soil type influences leaf litter quality which, in turn, impacts leaf litter decomposition and the level of recalcitrant OM incorporating the topsoil [55]. However, the effects of soil type were only partly tested with the RDA (clay content) because we wanted to avoid having more input variables than study locations in the model.

4.3. Soil Organic Matter Quality

According to Prescott [70], the decomposition rate of litter is largely determined by its chemical quality, which depends not only on C and N concentrations, but also on the relative proportions of the major C compounds. Solid-state NMR spectroscopy spectra suggest that OM in the topsoil is dominated by the O-alkyls and alkyls regions (Table 4). A significant difference between SRICs of SX67 and reference fields was found for alkyls (p = 0.05), showing higher concentration under willow. Similarly, the ratio of alkyls to O-alkyls + di-O-alkyls of OM in the topsoil was significantly higher (p = 0.03) under willow (0.56 ± 0.05) than reference fields (0.48 ± 0.03). Also, A and DLV were positively and negatively correlated to OM alkyls to O-alkyls + di-O-alkyls ratio, respectively, whereas percent increase in Corg pools in the topsoil was marginally negatively correlated to OM alkyls to O-alkyls + di-O-alkyls ratio (Figure 7). Plant material decomposition was previously found to result in a relative accumulation of alkyls and a relative decrease in O-alkyls [71,72,73,74,75]. The alkyls to O-alkyls + di-O-alkyls ratio was therefore recommended as an index of soil OM decomposition—an increasing ratio of alkyls to O-alkyls + di-O-alkyls suggest an increasing degree of decomposition [71,75,76]. On the one hand, alkyls are comprised of compounds resistant to decomposition, such as fatty acids, waxes and resins. On the other hand, O-alkyls and di-O-alkyls are comprised of O- or N-substituted aliphatic C, including lignin, amino acids, amino sugars and carbohydrates, which are less decay resistant than alkyls. Hence, the higher alkyls levels and alkyls to O-alkyls + di-O-alkyls ratios in the topsoils studied under SX67 suggest that its litter (either leaf, roots or both) has become more decay resistant during the process than the litters produced by crop species or herbaceous species in the reference fields. In a meta-analysis on litter decomposition covering more than 800 species belonging to different functional types, Cornwell et al. [77] found that woody species produced litters that decomposed faster than herbaceous species. They explained these differences in decomposition by the differences in litter lignin content. As a whole, our results therefore support the idea that willow leaf litter decomposition occurred more quickly than that of plants in reference fields, and as it progressed and its byproducts of decomposition incorporated the topsoil, organic matter became more decay resistant, more stable and accumulated in as Corg.

5. Conclusions

Following afforestation of agricultural or abandoned fields, soil Corg storage capacity and rate of sequestration depend on various factors such as climate, initial soil Corg pools, soil type (i.e., clay content), tree species and yields, management practices (including fertilization), and land use history [15,38]. This study, conducted along a relatively large pedoclimatic gradient, suggests that Corg accumulation in the topsoil under SRICs of willows can occur rapidly due to a high flux of C from litterfall and roots. Site response to afforestation is largely controlled by: (1) the initial soil Corg levels which are affected in large part by particle size distribution and cultivation history; (2) leaf litter decomposition rate, which is impacted by climatic and soil microclimatic conditions, leaf litter chemistry and soil type; and (3) soil OM quality which can result in a greater amount of recalcitrant OM. Our study also supports the conclusion of Rytter [44] that litter decomposition and soil Corg accumulation studies applied to SRICs of willows and for various climatic zones are needed for improving the predictions of Corg accumulation. Such data could eventually be used to guide deployment strategies of SRICs that maximize soil Corg accumulation at the landscape level.

Acknowledgments

We thank Florence Bélanger, Carol Bouchard, Simon Constantineau, Mario Fontana, Nicola Fontana, Alexandre Fouillet, Fanny Gagné, Pierre Gagné, Claude Labrecque, Julien Mourali, Jean Teodorescu and Gilbert Tremblay for their assistance in the field and laboratory, and Agnieska Adamowicz, Dominic Bélanger, Jean-François Hélie, Marie-Claude Turmel for their work in the laboratory. We also thank Francis Allard, Roger Chamard, Alice Chagnon, Jean-François Lavoie and Alain Guay for providing access to the SRICs of willow used in this study. This project was funded via a FRQ-NT grant—Programme de recherche en partenariat contribuant à la réduction et à la séquestration des gaz à effet de serre (2011-GZ-138839).

Author Contributions

Initial ideas and financing of the research: Nicolas Bélanger and Michel Labrecque; experimental design, and data collection and analysis: Benoit Lafleur; C forms analysis: Aalexandre A. Arnold; manuscript drafting: Benoit Lafleur and Nicolas Bélanger; revising successive drafts: all authors.

Conflicts of Interest

The authors declare no conflict of interest.

References

  1. Graham, R.L.; Wright, L.L.; Turhollow, A.F. The potential for short-rotation woody crops to reduce U.S. CO2 emissions. Clim. Chang. 1992, 22, 223–238. [Google Scholar] [CrossRef]
  2. Bonin, C.; Lal, R. Bioethanol potentials and life cycle assessments of biofuel feedstocks. Crit. Rev. Plant Sci. 2012, 31, 271–289. [Google Scholar] [CrossRef]
  3. Amichev, B.Y.; Kurz, W.A.; Smyth, C.; van Rees, K.C.J. The carbon implications of large-scale afforestation of agriculturally marginal land with short-rotation willow in Saskatchewan. GCB Bioener. 2012, 4, 70–87. [Google Scholar] [CrossRef]
  4. Guidi, W.; Pitre, F.E.; Labrecque, M. Short-rotation coppice of willows for the production of biomass in eastern Canada. In Biomass Now—Sustainable Growth and Use; Matovic, M.D., Ed.; InTech: Rijeka, Croatia, 2013; pp. 421–448. [Google Scholar]
  5. Ens, J.A.; Farrell, R.E.; Bélanger, N. Rapid biomass estimation using optical stem density of willow (Salix spp.) grown in short rotation. Biom. Bioener. 2009, 33, 174–179. [Google Scholar] [CrossRef]
  6. Labrecque, M.; Teodorescu, T.I. Biomass yield and nutrient uptake of Salix clones after two 3-year coppice rotations on southern Quebec, Canada. Biom. Bioener. 2003, 25, 135–146. [Google Scholar] [CrossRef]
  7. Hammar, T.; Ericsson, N.; Sundberg, C.; Hansson, P.-A. Climate impact of willow grown for bioenergy in Sweden. Bioener. Res. 2014. [Google Scholar] [CrossRef]
  8. Caputo, J.; Balogh, S.B.; Volk, T.A.; Johnson, L.; Puettmann, M.; Lippke, B.; Oneil, E. Incorporating uncertainty into a life cycle assessment (LCA) model of short-rotation willow biomass (Salix spp.) crops. Bioener. Res. 2009, 7, 48–59. [Google Scholar] [CrossRef]
  9. Jug, A.; Hofmann-Schielle, C.; Makeschin, F.; Rehfuess, K.E. Short-rotation plantations of balsam poplars, aspen and willows on former arable land in the Federal Republic of Germany III. Soil ecological effects. For. Ecol. Manag. 1999, 121, 85–99. [Google Scholar] [CrossRef]
  10. Kahle, P.; Hildebrand, E.; Baum, C.; Boelcke, B. Long-term effects of short rotation forestry with willows and poplar on soil properties. Arch. Agron. Soil Sci. 2007, 53, 673–682. [Google Scholar] [CrossRef]
  11. Pacaldo, R.S.; Volk, T.A.; Briggs, R.D. No significant differences in soil organic carbon contents along a chronosequence of shrub willow biomass crop fields. Biom. Bioener. 2013, 6, 252–262. [Google Scholar]
  12. Walter, K.; Don, A.; Flessa, H. No general soil carbon sequestration under Central European short rotation coppices. GCB Bioener. 2014. [Google Scholar] [CrossRef]
  13. Ens, J.; Farrell, R.E.; Bélanger, N. Early effects of afforestation with willow (Salix purpurea, “Hotel”) on soil carbon and nutrient availability. Forests 2013, 4, 137–154. [Google Scholar] [CrossRef]
  14. Zan, C.S.; Fyles, J.W.; Girourard, P.; Samson, R.A. Carbon sequestration in perennial bioenergy, annual corn and uncultivated systems in southern Quebec. Agric. Ecosyst. Environ. 2001, 86, 135–144. [Google Scholar] [CrossRef]
  15. Lockwell, J.; Guidi, W.; Labrecque, M. Soil carbon sequestration potential of willows in short-rotation copice established on abandoned farm lands. Plant Soil 2012, 360, 299–318. [Google Scholar] [CrossRef]
  16. Lal, R. Soil carbon sequestration impacts on global climate change and food security. Science 2004, 304, 1623–1627. [Google Scholar] [CrossRef] [PubMed]
  17. Laganière, J.; Angers, D.A.; Paré, D. Carbon accumulation in agriculture soils after afforestation: A meta-analysis. Glob. Change Biol. 2010, 16, 439–453. [Google Scholar] [CrossRef]
  18. Heywood, P.; Turpin, S. Variation in soil carbon stocks with texture and previous landuse in north-western NSW, Australia. Sust. Agric. Res. 2013, 2, 124–133. [Google Scholar]
  19. Dang, Y.; Ren, W.; Tao, B.; Chen, G.; Lu, C.; Yang, J.; Pan, S.; Wang, G.; Li, S.; Tian, H. Climate and land use controls on soil organic carbon in the Loess Plateau region of China. PLoS ONE 2014, 9, e95548. [Google Scholar] [CrossRef] [PubMed]
  20. Schmidt, M.W.I.; Torn, M.S.; Abiven, S.; Dittmar, T.; Guggenberger, G.; Janssens, I.A.; Kleber, M.; Kögel-Knabner, I.; Lehmann, J.; Manning, DA.A.C.; Nannipieri, P.; Rasse, D.P.; Weiner, S.; Trumbore, S.E. Persistence of soil organic matter as an ecosystem property. Nature 2011, 478, 49–56. [Google Scholar] [CrossRef] [PubMed]
  21. Grogan, P.; Matthews, R. Review of the Potential for Soil Carbon Sequestration under Bioenergy Crops in the U.K; MAFF report on contract NF0418; Institute of Water and Environment, Cranfield University: Silsoe Bedfordshire, UK, 2001; p. 38. [Google Scholar]
  22. Routhier, M.; Lafleur, B.; Bélanger, N. Accumulation des stocks de carbone dans les sols sous des cultures bioénergétiques de Populus spp., Salix spp., et Panicum virgatum. VertigO 2014. [Google Scholar] [CrossRef]
  23. Lützov, M.V.; Kögel-Knaber, I.; Ekschmitt, K.; Matzner, E.; Guggenberger, G.; Marschner, B.; Flessa, H. Stabilization of organic matter intemperate soils: Mechanisms and their relevance under different soil conditions—A review. Eur. J. Soil Sci. 2006, 57, 426–445. [Google Scholar] [CrossRef]
  24. Zinn, Y.L.; Resck, D.V.S.; da Silva, J.E. Soil organic carbon as affected by afforestation with Eucapyptus and Pinus in the Cerrado region of Brazil. For. Ecol. Manag. 2002, 166, 285–294. [Google Scholar] [CrossRef]
  25. Skjemstad, J.O.; Clarke, P.; Golchin, A.; Oades, J.M. Characterisation of soil organic matter by solid-state 13C NMR spectrometry. In Driven by Nature: Plant Litter Quality and Decomposition; Cadisch, G., Giller, G.E., Eds.; CAB International: Wallingford, UK, 1997; pp. 253–271. [Google Scholar]
  26. Labrecque, M.; Teodorescu, T.I. Field performance and biomass production of 12 willow and poplars in short-rotation coppice in southern Quebec (Canada). Biom. Bioener. 2005, 29, 1–9. [Google Scholar] [CrossRef]
  27. Fontana, M.J.; Lafleur, B.; Labrecque, M.; Courchesne, F.; Bélanger, N. Productivity of Salix miyabeana SX67 in southern Quebec: Stool age, coppicing and site effects. 2015; submitted for publication. [Google Scholar]
  28. Soil Classification Working Group. The Canadian System of Soil Classification, 3rd ed.; Research Branch, Agricultural and Agri-Food Canada, Publication 1646; NRC Research Press: Ottawa, ON, Canada, 1998. [Google Scholar]
  29. Régnière, J.; St-Amant, R. BioSim 9 User’s Manual; Information Report LAU-X-134; Natural Resources Canada, Canadian Forest Service, Laurentian Forestry Centre: Quebec, QC, Canada, 2008. [Google Scholar]
  30. Polglase, P.J.; Paul, K.I.; Khanna, P.K.; Gwinyai Nyakuengama, J.; O’Connell, A.M.; Grove, T.S.; Battaglia, M. Change in Soil Carbon Following Afforestation or Reforestation, National Carbon Accounting System; Technical report no. 20; Australian Greenhouse Office: Canberra, Australia, 2000. [Google Scholar]
  31. Lal, R. Forest soils and carbon sequestration. For. Ecol. Manag. 2005, 220, 242–258. [Google Scholar] [CrossRef]
  32. Don, A.; Schumacher, J.; Scherer-Lorenzen, M.; Scholten, T.; Schulze, E.-D. Spatial and vertical variation of soil carbon at two grassland sites—Implications for measuring soil carbon stocks. Geoderma 2007, 141, 272–283. [Google Scholar] [CrossRef]
  33. Hobbie, S.E.; Eddy, W.C.; Buyarski, C.R.; Adair, E.C.; Ogdahl, M.L.; Weisenhorn, P. Response of decomposing litter and its microbial community to multiple forms of nitrogen enrichment. Ecol. Monogr. 2012, 82, 389–405. [Google Scholar] [CrossRef]
  34. Hangs, R.D.; Schoneau, J.J.; van Rees, K.C.J.; Bélanger, N.; Volk, T. Leaf litter decomposition and nutrient-release characteristics of several willow varieties within short-rotation coppice plantations in Saskatchewan, Canada. Bioener. Res. 2014, 7, 1074–1090. [Google Scholar] [CrossRef]
  35. Maroufpoor, I.; Emamgholizadeh, S.; Torabi, H.; Behzadinasab, M. Impact of soil texture on the calibration of TDR for water content measurement. J. Appl. Sci. 2009, 9, 2933–2940. [Google Scholar] [CrossRef]
  36. Slapokas, T.; Granhall, U. Decomposition of litter in fertilized short-rotation forests on a low-humified peat bog. For. Ecol. Manag. 1991, 41, 143–165. [Google Scholar] [CrossRef]
  37. Schmidt, M.W.I.; Knicker, H.; Hatcher, P.G.; Kögel-Knabner, I. Improvement of 13C and 15N CPMAS NMR spectra of bulk soils, particle size fractions and organic material by treatment with 10% hydrofluoric acid. Eur. J. Soil Sci. 1997, 48, 319–328. [Google Scholar] [CrossRef]
  38. Bennet, A.E.; Rienstra, C.M.; Auger, M.; Lakshmi, K.A.; Griffin, R.G. Heteronuclear decoupling in rotating solids. J. Chem. Phys. 1995, 103, 6951–6958. [Google Scholar] [CrossRef]
  39. Morcombe, C.R.; Zilm, K.W. Chemical sshift referencing in MAS solid state NMR. J. Magn. Reson. 2003, 162, 479–486. [Google Scholar] [CrossRef] [PubMed]
  40. Thiffault, E.; Hannam, K.D.; Quideau, S.A.; Paré, D.; Bélanger, N.; Oh, S.-W.; Munson, A.D. Chemical composition of forest floor and consequences for nutrient availability after wildfire and harvesting in the boreal forest. Plant Soil 2008, 308, 37–53. [Google Scholar] [CrossRef]
  41. SAS. JMP version 10. SAS Institute Inc: Cary, NC, USA, 2012. [Google Scholar]
  42. Ter Braak, C.J.F.; Smilauer, P. CANOCO Reference Manual and CanoDraw for Windows User’S Guide: Software for Canonical Community Ordination (version 4.5); Microcomputer Power: MIthaca, NY, USA, 2002. [Google Scholar]
  43. Grogan, P; Matthews, R. A modeling analysis of the potential for soil carbon sequestration under short rotation coppice willow bioenergy plantations. Soil Use Manag. 2002, 18, 175–183. [Google Scholar] [CrossRef]
  44. Rytter, R.-M. The potential of willow and poplar plantations as carbon sinks in Sweden. Biom. Bioener. 2012, 36, 86–95. [Google Scholar] [CrossRef]
  45. Sartori, F.; Lal, R.; Ebinger, M.H.; Parrish, D.J. Potential soil carbon sequestration and CO2 offset by dedicated energy crops in the USA. Crit. Rev. Plant Sci. 2006, 25, 441–472. [Google Scholar] [CrossRef]
  46. Rytter, M.R. Fine-root production and turnover in a willow plantation estimated by different calculation methods. Scand. J. For. Res. 1999, 14, 526–537. [Google Scholar] [CrossRef]
  47. Tremblay, G. Séquestration de carbone atmosphérique dans la biomasse racinaire de plantations de saules. Master’s Thesis, Master’s ThesisDépartement de géographie, Université de Montréal, Montréal, Canada, 2014. [Google Scholar]
  48. Six, J.; Elliott, E.T.; Paustian, K. Aggregate and soil organic matter dynamics under conventional and no-tillage systems. Soil Sci. Soc. Am. J. 1999, 63, 1350–1358. [Google Scholar] [CrossRef]
  49. VandenBygaart, A.J.; Gregorich, E.G.; Angers, D.A. Influence of agricultural management on soil organic carbon: A compendium and assessment of Canadian studies. Can. J. Soil Sci. 2003, 83, 363–380. [Google Scholar]
  50. Lal, R. Soil carbon sequestration to mitigate climate change. Geoderma 2004, 123, 1–22. [Google Scholar] [CrossRef]
  51. Martens, D.A. Plant residue biochemistry regulates soil carbon cycling and carbon sequestration. Soil Biol. Biochem. 2000, 32, 361–369. [Google Scholar] [CrossRef]
  52. Stockmann, U.; Adams, M.A.; Crawford, J.W.; Field, D.J.; Henakaarchchi, N.; Jenkins, M.; Minasny, B.; McBratney, A.B.; de Courcelles, V.R.; Singh, K.; et al. The knows, known unknowns and unknowns of sequestration of soil organic carbon. Agric. Ecosyst. Environ. 2013, 164, 80–99. [Google Scholar] [CrossRef]
  53. Coûteaux, M.M.; Bottner, P.; Berg, B. Litter decomposition, climate, and litter quality. Trends Ecol. Evol. 1995, 10, 63–66. [Google Scholar] [CrossRef] [PubMed]
  54. Aerts, R. Climate, leaf litter chemistry and leaf litter decomposition in terrestrial ecosystems: A triangular relationship. Oikos 1997, 79, 439–449. [Google Scholar] [CrossRef]
  55. Berg, B.; McClaugherty, C.A. Plant Litter, 2nd ed.; Springer: Berlin, Germany, 2008. [Google Scholar]
  56. Fisher, R.F.; Binkley, D. Ecology and Management of Forest Soils; Wiley & Sons: New York, NY, USA, 2000; p. 489. [Google Scholar]
  57. Linn, D.M.; Doran, J.W. Effect of water-filled pore space on carbon dioxide and nitrous oxide production in tilled and non-tilled soils. Soil Sci. Soc. Am. J. 1984, 48, 1267–1272. [Google Scholar] [CrossRef]
  58. Berg, B.; Ekbohm, G. Litter mass-loss rates and decomposition patterns in some needle and leaf litter types. Long-term decomposition in a Scots pine forest. VII. Can. J. Bot. 1991, 69, 1449–1456. [Google Scholar] [CrossRef]
  59. Berg, B. Litter decomposition and organic matter turnover in northern forest soils. For. Ecol. Manag. 2000, 133, 13–22. [Google Scholar] [CrossRef]
  60. Aweto, A.O. Secondary succession and soil fertility restoration in south-western Nigeria. II. Soil fertility restoration. J. Ecol. 1981, 69, 609–614. [Google Scholar] [CrossRef]
  61. Hättenschwiler, S.; Vitousek, P.M. The role of polyphenols in terrestrial ecosystems nutrient cycling. Trends Ecol. Evol. 2000, 15, 238–243. [Google Scholar] [CrossRef] [PubMed]
  62. Prescott, C.E.; Vesterdal, L.; Preston, C.M.; Simard, S.W. Influence of initial chemistry on decomposition of foliar litter in contrasting forest types in British Columbia. Can. J. For. Res. 2004, 34, 1714–1729. [Google Scholar] [CrossRef]
  63. Rahman, M.M.; Moitur, R.M. Quantitative chemical defense traits, litter decomposition and forest ecosystem functioning. In Forest Ecosystems—More than Just Trees; Blanco, J.A., Lo, Y.-H., Eds.; InTech: Rijeka, Croatia, 2012; pp. 295–314. [Google Scholar]
  64. Zak, D.R.; Grigal, D.F.; Gleeson, S.; Tilman, D. Carbon and nitrogen cycling during olf-field succession: Constraints on plant and microbial biomass. Biogeochemistry 1990, 11, 111–129. [Google Scholar] [CrossRef]
  65. Schofield, J.A.; Hagerman, A.E.; Harold, A. Loss of tannins and other phenolics from willow leaf litter. J. Chem. Ecol. 1998, 24, 1409–1421. [Google Scholar] [CrossRef]
  66. Van Veen, J.A.; Kuikman, P.J. Soil structural aspects of decomposition of organic matter by microorganisms. Biogeochemistry 1990, 11, 213–233. [Google Scholar] [CrossRef]
  67. Foote, R.L.; Grogan, P. Soil carbon accumulation during temperate forest succession on abandoned low productivity agricultural lands. Ecosystems 2010, 13, 795–812. [Google Scholar] [CrossRef]
  68. Sanborn, P.; Lamontagne, P.; Hendershot, W. Podzolic soils of Canada: Genesis, distribution, and classification. Can. J. Soil Sci. 2011, 91, 843–880. [Google Scholar] [CrossRef]
  69. Baldock, J.A.; Skjemstad, O.J. Role of the soil matrix and minerals in protecting natural organic materials against biologic attack. Org. Geochem. 2000, 31, 697–710. [Google Scholar] [CrossRef]
  70. Prescott, C.E. Decomposition and mineralization of nutrients from litter and humus. In Nutrient Acquisition by Plants; BassiriRad, H., Ed.; Springer: New York, NY, USA, 2005; pp. 15–41. [Google Scholar]
  71. Preston, C.M.; Axelson, D.E.; Lévesque, M.; Mathur, S.P.; Dinal, H.; Dudley, R.L. Carbon-13 NMR and chemical characterization of particle-size separates of peats differing in degree of decomposition. Org. Geochem. 1989, 14, 393–403. [Google Scholar] [CrossRef]
  72. Trofymow, J.A.; Preston, C.M.; Prescott, C.E. Litter quality and its potential effect on decay rates of materials from Canadian forests. Water Air Soil Poll. 1995, 82, 215–226. [Google Scholar] [CrossRef]
  73. Kögel-Knabner, I. 13C and 15N NMR spectrometry as a tool in soil organic matter studies. Geoderma 1997, 80, 243–270. [Google Scholar] [CrossRef]
  74. Webster, E.A.; Chudes, J.A.; Hopknis, D.W. Carbon transformations during decomposition of different components of plant leaves in soil. Soil Biol. Biochem. 2000, 32, 301–314. [Google Scholar] [CrossRef]
  75. Baldock, J.A.; Preston, C.M. Chemistry of carbon decomposition in forests as revealed by solid state carbon-13 nuclear magnetic resonance. In Carbon Forms and Function in Forest Soils; McFee, W.W., Kelly, J.M., Eds.; Soil Science Society of America: Madison, WI, USA, 1995; pp. 89–117. [Google Scholar]
  76. Baldock, J.A.; Oades, J.M.; Nelson, P.N.; Skene, T.M.; Golchin, A.; Clarke, P. Assessing the extent of decomposition of natural organic materials using solid-state 13C NMR spectroscopy. Aust. J. Soil Res. 1997, 35, 1061–1083. [Google Scholar] [CrossRef]
  77. Cornwell, W.K.; Cornelissen, J.H.C.; Amatangelo, K.; Dorrepaal, E.; Eviner, V.T.; Gogod, O.; Hobbie, S.E.; Hoorens, B.; Kurokawa, H.; Pérez-Harguindeguy, N.; et al. Plant species traits are the dominant control on litter decomposition rates within biomes worldwide. Ecol. Lett. 2008, 11, 1065–1071. [Google Scholar] [CrossRef] [PubMed]

