Article

Forest Biomass Energy Resources in China: Quantity and Distribution

Institute of Geographic Sciences and Natural Resources Research, CAS, Beijing 100101, China
*
Authors to whom correspondence should be addressed.
Forests 2015, 6(11), 3970-3984; https://doi.org/10.3390/f6113970
Submission received: 25 May 2015 / Revised: 16 September 2015 / Accepted: 20 October 2015 / Published: 4 November 2015

Abstract

:
As one of the most important renewable and sustainable energy sources, the forest biomass energy resource has always been the focus of attention of scholars and policy makers. However, its potential is still uncertain in China, especially with respect to its spatial distribution. In this paper, the quantity and distribution of Chinese forest biomass energy resources are explored based mainly on forestry statistics data rather than forest resource inventory data used by most previous studies. The results show that the forest biomass energy resource in China was 169 million tons in 2010, of which wood felling and bucking residue (WFBR),wood processing residue (WPR), bamboo processing residue, fuel wood and firewood used by farmers accounted for 38%, 37%, 6%, 4% and 15%, respectively. The highest resource was located in East China, accounting for nearly 39.0% of the national amount, followed by the Southwest and South China regions, which accounted for 17.4% and 16.3%, respectively. At the provincial scale, Shandong has the highest distribution, accounting for 11.9% of total resources, followed by Guangxi and Fujian accounting for 10.3% and 10.2%, respectively. The actual wood-processing residue (AWPR) estimated from the actual production of different wood products (considering the wood transferred between regions) showed apparent differences from the local wood processing residue (LWPR), which assumes that no wood has been transferredbetween regions. Due to the large contribution of WPR to total forestry bioenergy resources, the estimation of AWPR will provide a more accurate evaluation of the total amount and the spatial distribution of forest biomass energy resources in China.

1. Introduction

Resource shortages and environmental problems have become major constraints for realizing the dream of a rapid development of society and economy, a good eco-environment and a happy life in China. The promotion of renewable energy is assumed as an effectiveand alternative way to achieve the sustainable development of energy in China [1]. As one of the raw materials with the highest potential [2,3,4], forest biomass accounts for 40% of the total global biomass resource potential [5], and Chinese forest biomass accounts for about one third of the whole national biomass energy resources [6,7].
Currently, forest biomass energy development is still in the initial stage in China [8]. Although several studies have been conducted to estimate the global bioenergy potential of forest biomass [9,10,11], the potential and distribution of energy resources from forest biomass are still unclear in China, which appears as an important bottleneck for the development of the bioenergy industry [2]. A domestic study on forest biomass energy resources started in 2000 and has rapidly increased since 2006. However, previous studies mostly made simple estimationsof the total national biomass resources based on forest inventory data and the results were also quite different due to different data and/or methods applied [7]. At the same time, fewer studies were conducted on the spatial pattern of forest bioenergy resources to provide robust support for the layout of the bioenergy industry in China. Therefore, a detailed study on forest biomass energy resources and their spatial distribution is still lacking.
As for the forest biomass energy resource in China, the previous studies were mainly conducted using national forestry inventory data, and then the wood residue for bioenergy was estimated based on the local forestry production of different provinces. One importantassumptionhas been that the local forestry biomass was only processed on the spot, without cross-regional wood transfer to provide the residues for bioenergy production [12,13,14,15]. Such an assumption ignored the impact of non-local forest biomass resource processing, which is quite different from the actual situation, and probably resulted in the apparent bias in the spatial distribution and total amount. In this study, the forest biomass energy resource and its spatial distribution are evaluated based on the actual wood production and product processing of different provinces in China. The results will be helpful to provide support for the policy decision on bioenergy development in China.

2. Data and Methods

2.1. Definition of Different Forest Biomass Energy Resources

In the study, forest biomass energy resources refer to resources that can be collected as raw biomass materials for biofuel production, including mainly wood residue and wood for burning. The wood residue usually refers to three kinds of residues, i.e., felling residue, bucking residue and processing residue. The processing residue indicates the residue produced from the processes of different wood and bamboo products. The wood for burning refers to fuel wood and firewood cut for self-utilization by local farmers. The oil-seedsof forests are not considered in this paper due to the limited data.

2.2. Estimation of Wood Residues and Wood for Burning

In previous studies, a constant coefficient of residue production was applied to estimate the residue resource from forestry biomass inventory information, regardless whether forestry production was utilized or not. At the same time, those studies also assumed that the wood resource was only processed locally without wood transfer among provinces; this assumption was different from the actual situation.
According to the definition of forest biomass energy resources indicated in Section 2.1 of this study, the total forest biomass energy resources in this study were calculated as
Rtotal = Rburning + Rresidue
in which Rtotal refers to total forest biomass energy resources (ton); Rburning means wood resource for burning (ton); and Rresidue refers to the wood residue resource (ton).
For the estimation of Rburning,
Rburning = (Woodfuel + Woodfire) × ρ1
in which Woodfuel refers to fuel wood harvesting amount (m3) and Woodfire refers to firewood cut and used by farmers (m3). ρ1 is the equivalent weight coefficient (ton m−3).
The estimation of Rresidue can be divided into three components, i.e., wood felling and bucking residue (WFBR), wood processing residue (WPR) and bamboo processing residue (BPR).
Rresidue = BPR + WFBR + WPR
Since the forest is harvested mainly for acquiring timber and fuel wood, BPR can be calculated based on the actual production of various bamboo materials. WFBR can be estimated according to actual wood production and self-used wood cut by farmers. WPR can be assessed from the actual production of main products from the forestry industry. For BPR,
BPR = (M1 × ρ2+ M2) × β
M1 refers to bamboo and Artemisia bamboo production (piece); M2 refers to the production of tiny miscellaneous bamboo (ton); ρ2 refers to the equivalent weight coefficient of Moso bamboo (kg piece−1); β refers to the ratio of bamboo processing residue (%). For WFBR,
WFBR = (W/ω + N) × (1−ω) × ρ1
in which W is wood production (m3), ω is the output rate (%), and N refers to wood harvested and self-used by farmers (m3). For WPR,
WPR = ∑Zi × αi × ρ3
in which Zi refers to processing production of the i-th forestry wood product (m3); αi refers to the residue proportion of the i-th forestry wood product processing. ρ3 is the equivalent weight coefficient (ton m−3). The data source and parameters of ω, ρ1, ρ2, and ρ3 are indicated in Section 2.3.
Two different situations were considered in the estimation of WPR. Previous studies usually assumed that wood was not transferred among provinces and the wood was only processed locally, while this study considered that the wood was transferred across different provinces in China. In order to clarify the difference between these two approaches in the estimation of WPR, one was expressed as local wood processing residue (LWPR), which assumed that the wood was just processed locally, and the other one as actual wood processing residue (AWPR), which considered that the wood was transferred. The meaning of each abbreviation is listed in Table 1.
Table 1. Abbreviations used in the text.
AbbrFull NameContent
WFBRWood Felling and Bucking ResidueResidue produced from the wood felling and bucking activities
WPRWood Processing ResidueResidue produced from the processing of different wood products
LWPRLocal Wood Processing ResidueWPR was estimated based on the assumption that the wood resource is only processed on the spot without wood transfer among provinces
AWPRActual Wood Processing ResidueWPR was estimated from the actual wood processing, including wood transfer among provinces and specific conversion parameters for different wood products
BPRBamboo Processing ResidueResidue produced from the processing of different bamboo products

2.3. Data Source and Parameter Determination

As the most authoritative and official published forestry statistics, the China Forestry Statistical Yearbook [16] was adopted in this study to extract the basic information for the estimation of different forestry bioenergy resources, including wood production, bamboo production, direct felling consumption, firewood production, farmer firewood harvest and the production of wood products of each province in 2010. Such data were utilized to evaluate Woodfuel, Woodfire, BPR and WFBR with Equations (1)–(5), respectively.
Based on actual investigations and statistics, the yearbook also includes the production of timber and different wood products of each province in China, and such production reflects the actual wood consumption in that province regardless whether the wood is imported from other provinces or produced locally. Such records provide unique information and an alternative approach to evaluate the actual residue production during the wood processing in each province. Therefore, AWPR was estimated with the actual production of different wood products in each province and the corresponding parameters (Table 2) using Equation (6).
Contrary to the previous studies that a constant coefficient was applied to estimate WPR using the forestry biomass, the specific parameters for different residues from different wood processes were also extracted from the published literature, including the residue proportion in wood plywood and other wood-based panel production and processing [17], bamboo production and remaining processing proportion [18], the specific output rate of wood for each province [19], and the equivalent weight coefficients of various forest and bamboo resources [6]. These parameters are listed in Table 2. At the same time, LWPR was also estimated based on the forestry biomass resource [16] for comparison with AWPR.
Table 2. Parameters for the estimation offorest biomass energy resources.
CategoryFelling and BuckingConverted Timber and Other Wood ProductsPlywoodOther Wood Man-Made BoardMoso Bamboo and Artemisia BambooTiny BambooWood for Burning
Residue proportion1-ω0.580.50.10.60.61
Equivalent weight coefficient1.17 (ρ1, ton m−3)0.90.90.95_1.17
3, ton m−3)3, ton m−3)3, ton m−3)2, kgpiece−1)1, ton m−3)

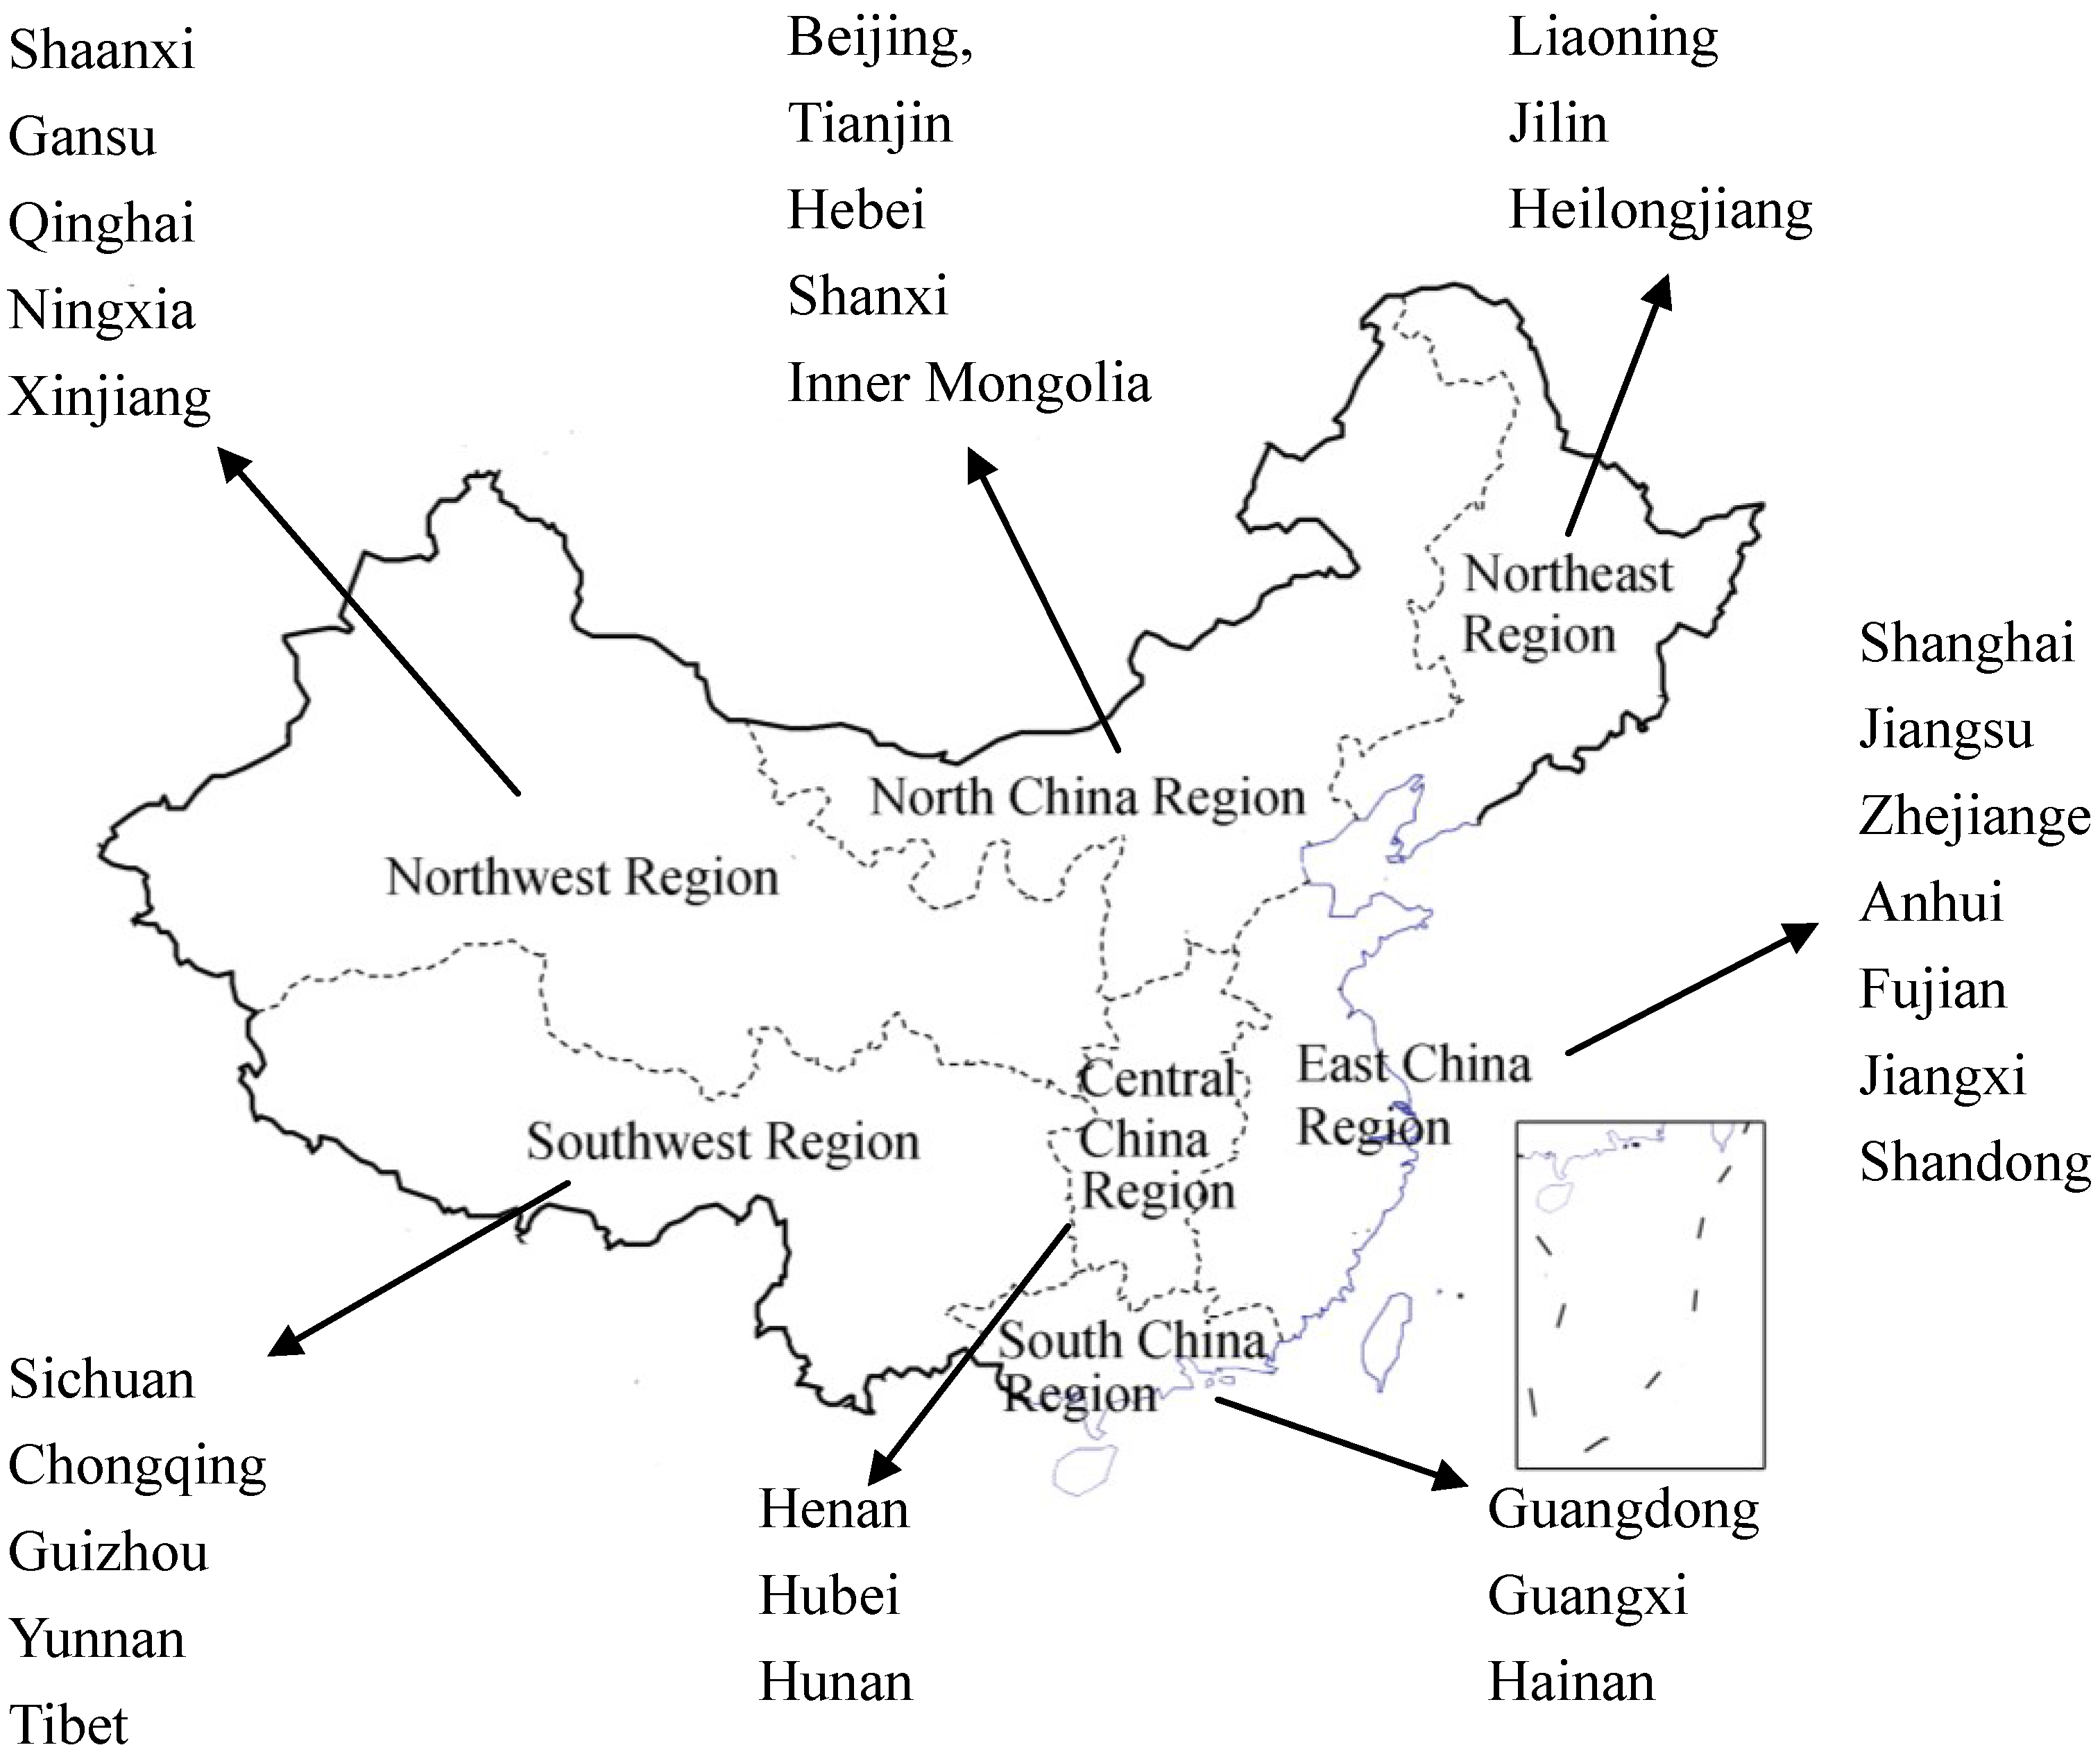
2.4. Regional Division

Previous related studies were mainly conducted to explore the total resources of forest biomass energy at a national scale. However, the spatial distribution of forest biomass energy resources at regional and even provincial scales will provide important references for the development and layout of the bioenergy industry in China. According to their geographical position, the 31 provinces of China were grouped into seven regions(Figure 1). However, Hongkong SAR, Macao SAR and Taiwan province are not includeddue to limited data.
Figure 1. Division of different regions in China. The provinces that are included in each region are also listed.
Forests 06 03970 g001

3. Results

3.1. Total Forest Biomass Energy Resourcesin China

The total forest biomass energy resources in China were approximately 169 million tons in 2010, which were mainly composed of wood processing residue (WPR) and wood felling and bucking residue (WFBR), followed by firewood, bamboo residue and fuel wood (Figure 2). The two kinds of biomass resources, wood residues and bamboo residues, accounted for 81% of the total resources, wherein WFBR, WPR and the bamboo residues accounted for 47%, 45% and 8% of the total residue resources, respectively. Wood resources for burning, including fuel wood and firewood, only accounted for 19% of the total resources, and the fuel wood and firewood used by farmers accounted for 21% and 79% of the total wood for burning, respectively.
Figure 2. Composition of Chinese forestry biomass energy resources in 2010.
Forests 06 03970 g002

3.2. Forestry Biomass Energy Resources in Different Provinces

Figure 3 presents the amount of different forestry biomass energy resources in each province. First, Fujian had the highest resource of wood for burning, which was as high as 51.3% of the local total forestry biomass energy resources and 27.4% of total wood for burning in China. Yunnan was the second highest resource of wood for burning, which accounted for 46.3% of the total local forest biomass energy resources and 17.5% of the total resource of wood for burning in China. However, the resource of wood for burning in Tianjin, Shanghai, Gansu, Ningxia was very low, or even zero. The spatial pattern of wood for burning was mainly related to the energy consumption habit of local farmers and the amount of local forest resources.
Second, Shandong, Guangxi and Heilongjiang had the highest wood residue resource, and WFBR in Guangxi, Heilongjiang, Fujian, Guangdong, and Yunnan was higher than in other provinces. Both WFBR and WPR were very low in Shanghai, Ningxia, Qinghai, Beijing, Tianjin and Gansu. Figure 3 also indicates that the higher WPR does not always appear synchronously with WFBR across different provinces, probably due to the influence of wood transfer among provinces.
Third, the bamboo residue was much higher in Sichuan, Yunnan and Fujian, which accounted for 25.6%, 15.0% and 14.9% of the total bamboo residue resources, followed by Guangxi, Guangdong and Zhejiang, which accounted for 10.1%, 9.5% and 7.2%, respectively. There was a low distribution in other provinces, which were generally lower than 5%. This pattern was mainly influenced by the distribution of bamboo.
With respect to the total forestry biomass energy resources in each province (Figure 4), Shandong had the highest distribution accounting for 11.9% of total resources, followed by Guangxi and Fujian, which accounted for 10.3% and 10.2%, respectively. These resources were relatively lower in Gansu, Qinghai, Ningxia, Beijing, Shanghai, and Shanxi. Generally, the provinces with high forestry bioenergy resources were mainly distributed in the eastern and southern regions of China.
Figure 3. Comparison of different forestry bioenergy resources at a provincial scale in China.
Forests 06 03970 g003
Figure 4. Spatial distribution of forest biomass energy resources across different provinces in China in 2010.
Forests 06 03970 g004

3.3. Contributions of Forestry Bioenergy Resources from Different Regions

The spatial distribution of forestry bioenergy resources across different regions was evaluated based on the provincial estimation (Figure 5). Wood for burning was mainly distributed in the eastern and southern regions, in whichEast China and Southwest Chinaaccounted for nearly 3/4 of the total resource of wood for burning. Central China, South China and Northeast China accounted for 23% of the total amount in China. The wood for burning was less distributed in Northwest and North China, which only accounted for 2% and 1%, respectively (Figure 5a).
Figure 5. Contributions of forestry biomass energy resources from different regions of China in 2010. Wood for burning includes fuel wood and firewood; Total Wood Residues refer to the sum of wood felling and bucking residue (WFBR) and wood processing residue (WPR).
Forests 06 03970 g005
Generally, WFBR, WPR and the total residue resources were distributed in eastern region (East China and Northeast) > southern region (South China and Southwest) > central region (Central China) >and northern region (North China and Northwest). The proportions of WFBR, WPR and totalresidues in East China were 24%, 52% and 38% of the national amounts, respectively (Figure 5b–d). For South China, central China and north China, these proportions were less variable in each region, and the average ratio for the three regions were about 18%, 11% and 8%, respectively.
Figure 5 also indicates that the proportion of WPR of East China is much higher than that of WFBR (more than 2-fold), while WPR tended to decrease in the Northeast and Southwest regions compared with the proportions of both WFBR and the total residue. Such variation was more apparent in Shandong province in East China (Figure 3). The residue distribution was mainly determined by the spatial differences in wood production regions and wood processing regions if the wood transfer was considered in the estimation of WPR.
The residue resource from bambooproduction and processing was mainly distributed in the Southwestern region, accounting for 45.3% of the total bamboo residue in China (Figure 5e), followed by the East China region (29.4%), South China region (20.1%), Central region (4.8%) and Northwest regions (0.4%), whereas there was no distribution in North China and Northeast China.
For the total forest biomass energy resources (Figure 5f), the contribution from East China was the highest, accounting for nearly 39% of the national amount, followed by the Southwest and South China regions, which accounted for 17.4% and 16.3%, respectively. The Northeast and Central regionsaccounted for 10.9% and 10.1%, respectively. There was low distribution in North China and the Northwest region, which only accounted for 6.3% and 1.1%,respectively.

4. Discussion

4.1. Comparison of Estimations of Forest Biomass Energy Resources

In recent years, more studies have been conducted to quantify the forest biomass energy resources in China; however, the results are inconsistent (Table 3). Such differences probably resulted from the following reasons. On the one hand, the definition and category of utilizable biomass energy resources were different. It was apparent that different results were presented, even when using the same database [7,13,15,20,21]. In this study, the forest biomass energy resources included WFBR, WPR, bamboo residue, fuel wood, firewood and self-used wood residue for farmers. Some studies considered the residues not only from forest production, but also from tending and thinning processes [6,15,20,21]. However, as the latter residues are usually included in the former residues, such a calculation probably resulted in a double estimate of part of the resources, and the results were also higher than this study. On the contrary, firewood and self-used wood residue for farmers were not considered in some studies [7], which resulted in lower resource estimates.
On the other hand, the data sources were different. Most studies were conducted using forestry inventory data; however, different forestry inventory data were applied. For example, the 4–7th national forest resources inventory data were applied in previous studies. At the same time, with the addition of the different definitions and categories of biomass energy resources, the results obviously varied. It is still hard to identify the long-term variations in forest biomass energy resources at different periods.
Table 3. Comparison of forest biomass energy resource research results in China.
LiteratureResource Amount (108 t)Data SourceResources Category
Liu and Shen (2007) [6]2.91The 5th National Forest Resources Inventory ReportFirewood forest; forestry production harvesting, processing residue as well as tending and intermittent cutting of forest
Liao et al.,(2004) [22]2.27The 4th National Forest Resources Inventory DataTimber forest, shelter belts, firewood forest, forest for special purpose, economic forest, woodland, shrub and orchard
Yuan (2005) [23]1.58No annotationAnnual rational harvest of timber
Chinese Forest Biomass Energy Research Group (2006) [20]3.0The 6th National Forest Resources Inventory DataFirewood forest; forest harvesting surplus and tending and intermittent cutting of forest; economic forest, bamboo forest shearing and timber processing, shrub cutting and others.
Qian (2007) [13]2.11The 6th National Forest Resources Inventory DataHarvesting afforestation, timber processing residue and waste timber
Yang et al., (2010) [21]4.99The 6th National Forest Resources Inventory DataFirewood forest; forest harvesting, timber processing residue; tending and intermittent cutting of forest
Shi (2011) [7]1.25The 6th National Forest Resources Inventory ReportTimber harvesting, processing residue and afforestation residue
Zhou et al., (2011) [14]1.97The 7th National Forest Resources Inventory DataSix forest resources of timber forest, shelter belts, firewood forest, forest for special purpose, economic forest, etc.
Cai, et al. (2012) [15]5.5The 6th National Forest Resources Inventory Data, National Forest Limited Cutting Amount and other Statistic DataForest growth residue (including shrubs, economic forest, urban greening, surrounding trees and woodland), forestry production residue (including forest harvesting, timber processing, scrap wood products, tending and intermittent cutting of forest and afforestation) and energy forest
This study1.69China Forestry Statistical Yearbook2010Forest harvesting, bucking and processing surplus; fuel wood; firewood cut and used by farmers, farmer self-used timber harvesting surplus

4.2. Spatial Distribution of Forest Biomass Energy Resources

The contribution of forest biomass energy resources from East China was the highest, which accounted for nearly 39% of the national amount and the contribution from both the Southwest and South China regions accounted for about 34%, whereas the Northeast and Central regionsaccounted for 10.9% and 10.1%, respectively. There was low distribution in North China and the Northwest region, which only accounted for 6.3% and 1.1%,respectively. The top five provinces with the highest forest biomass energy resources were Shandong, Guangxi, Fujian, Yunnan and Sichuan, which are located in the East China, Southwest and South China regions. Therefore, such a spatial pattern implied that the potential of these provinces or regions was more favorable for the development of the forestry bioenergy industry in China.
WPR plays an important role in the spatial distribution of forestry bioenergy resources. Two kinds of WPR were estimated in this study. On the one hand, AWPR was estimated based on the actual wood products in each province, from China Forestry Statistical Yearbook 2010. On the other hand, LWPR was estimated from the amount of forest biomass, which assumed that the harvested woodwas only processedlocally[6,13]. LWPR appeared to follow a similar spatial pattern to WFBR across different provinces (Figure 6).The reason was that both the WFBR and the LWPR were positively proportional to the wood production, and the parameter of proportion for WFBR was higher than that of LWPR (Table 2).
Figure 6. Comparisons of the wood processing residue (WPR) based on actual processing and assumed local processing in different provinces.
Forests 06 03970 g006
On the contrary, the spatial pattern of AWPR showed apparent differences from that of both LWPR and WFBR, and a large difference between the LWPR and the AWPR occurred in several provinces, such as Shandong, Guangxi, Jiangsu, Hebei, Heilongjiang and Yunnan, etc. The reason is that the estimation of AWPR was based on the actual wood production and wood processing in each province, which including the wood transfer among provinces. For example, according to the national forestry statistics, the wood production in Shandong province only accounts for 3.7% of the national timber production, but the wood products were the highest and resulted in the maximum WPR in China. Although the wood production was the highest in Heilongjiang, its WPR was much lower, which implied that a considerable amount of wood was transferred to other provinces for wood processing. Additionally, the higher amount of wood imported from neighboring countries also partly contributed to the higher WPR in the coastal provinces of East China; however, the influence on WPR was still difficult to quantify due to limited data.
Moreover, the residue proportions for different types of wood production were also specified based on published literature, while the proportion for LWPR was constant across different wood products in other studies. Therefore, the estimation of WPR from the actual production of wood products will provide a more accurate evaluation of the total amount and the spatial distribution of forest biomass energy resources in China.

4.3. Potential of Forest Biomass Energy Resources in China

The forest biomass energy resources in China amount to 169 million tons, including wood residue and wood for burning. Actually, the energy forests expanded rapidly in recent years; however, the energy forest was not included in the evaluation due to data limitations. According to the National Forestry Biomass Energy Development Plan (2001–2020), an energy forest of 8.38 million hectares will be planted in China until 2015, of which about 4.9 million hectares can be utilized for forestry bioenergy production [4]. If this target can be realized, such an energy forest can provide forestry biomass ofmore than 20 million tons, and the total forest biomass energy resourceswill be close to 190 million tons compared with the current value, which can replace about 100 million tons of standard coal.
On the other hand, as a large proportion of total forestry biomass energy resources, the accurate evaluation of WPR is still important. A more reasonable evaluation method was applied in this study. The residues produced from the processes of different wood and bamboo products were estimated based on the actual wood and bamboo products from different provinces. However, because the forestry biomass market in China is still characterized by low competitiveness and insufficient development, this results in the uncertain supply of forestry production residues from the multiple utilization of forest biomass. At the same time, the cross-regional transfer of forestry biomass and product processing is influenced by the local economy, which will also affect the supply of forestry production residues for forestry bioenergy. Additionally, the uncertainty of parameters for residue estimation from different wood products requires more attention to provide an accurate evaluation of WPR. Therefore, more studies that combine the production of local forestry products, processing techniques and economic development are still needed to provide a more accurate evaluation and prediction of forestry biomass energy resources in China.

5. Conclusions

Based on the national forestry statistics, the forest biomass energy resources and their spatial distribution were evaluated. The results showed that
(1)
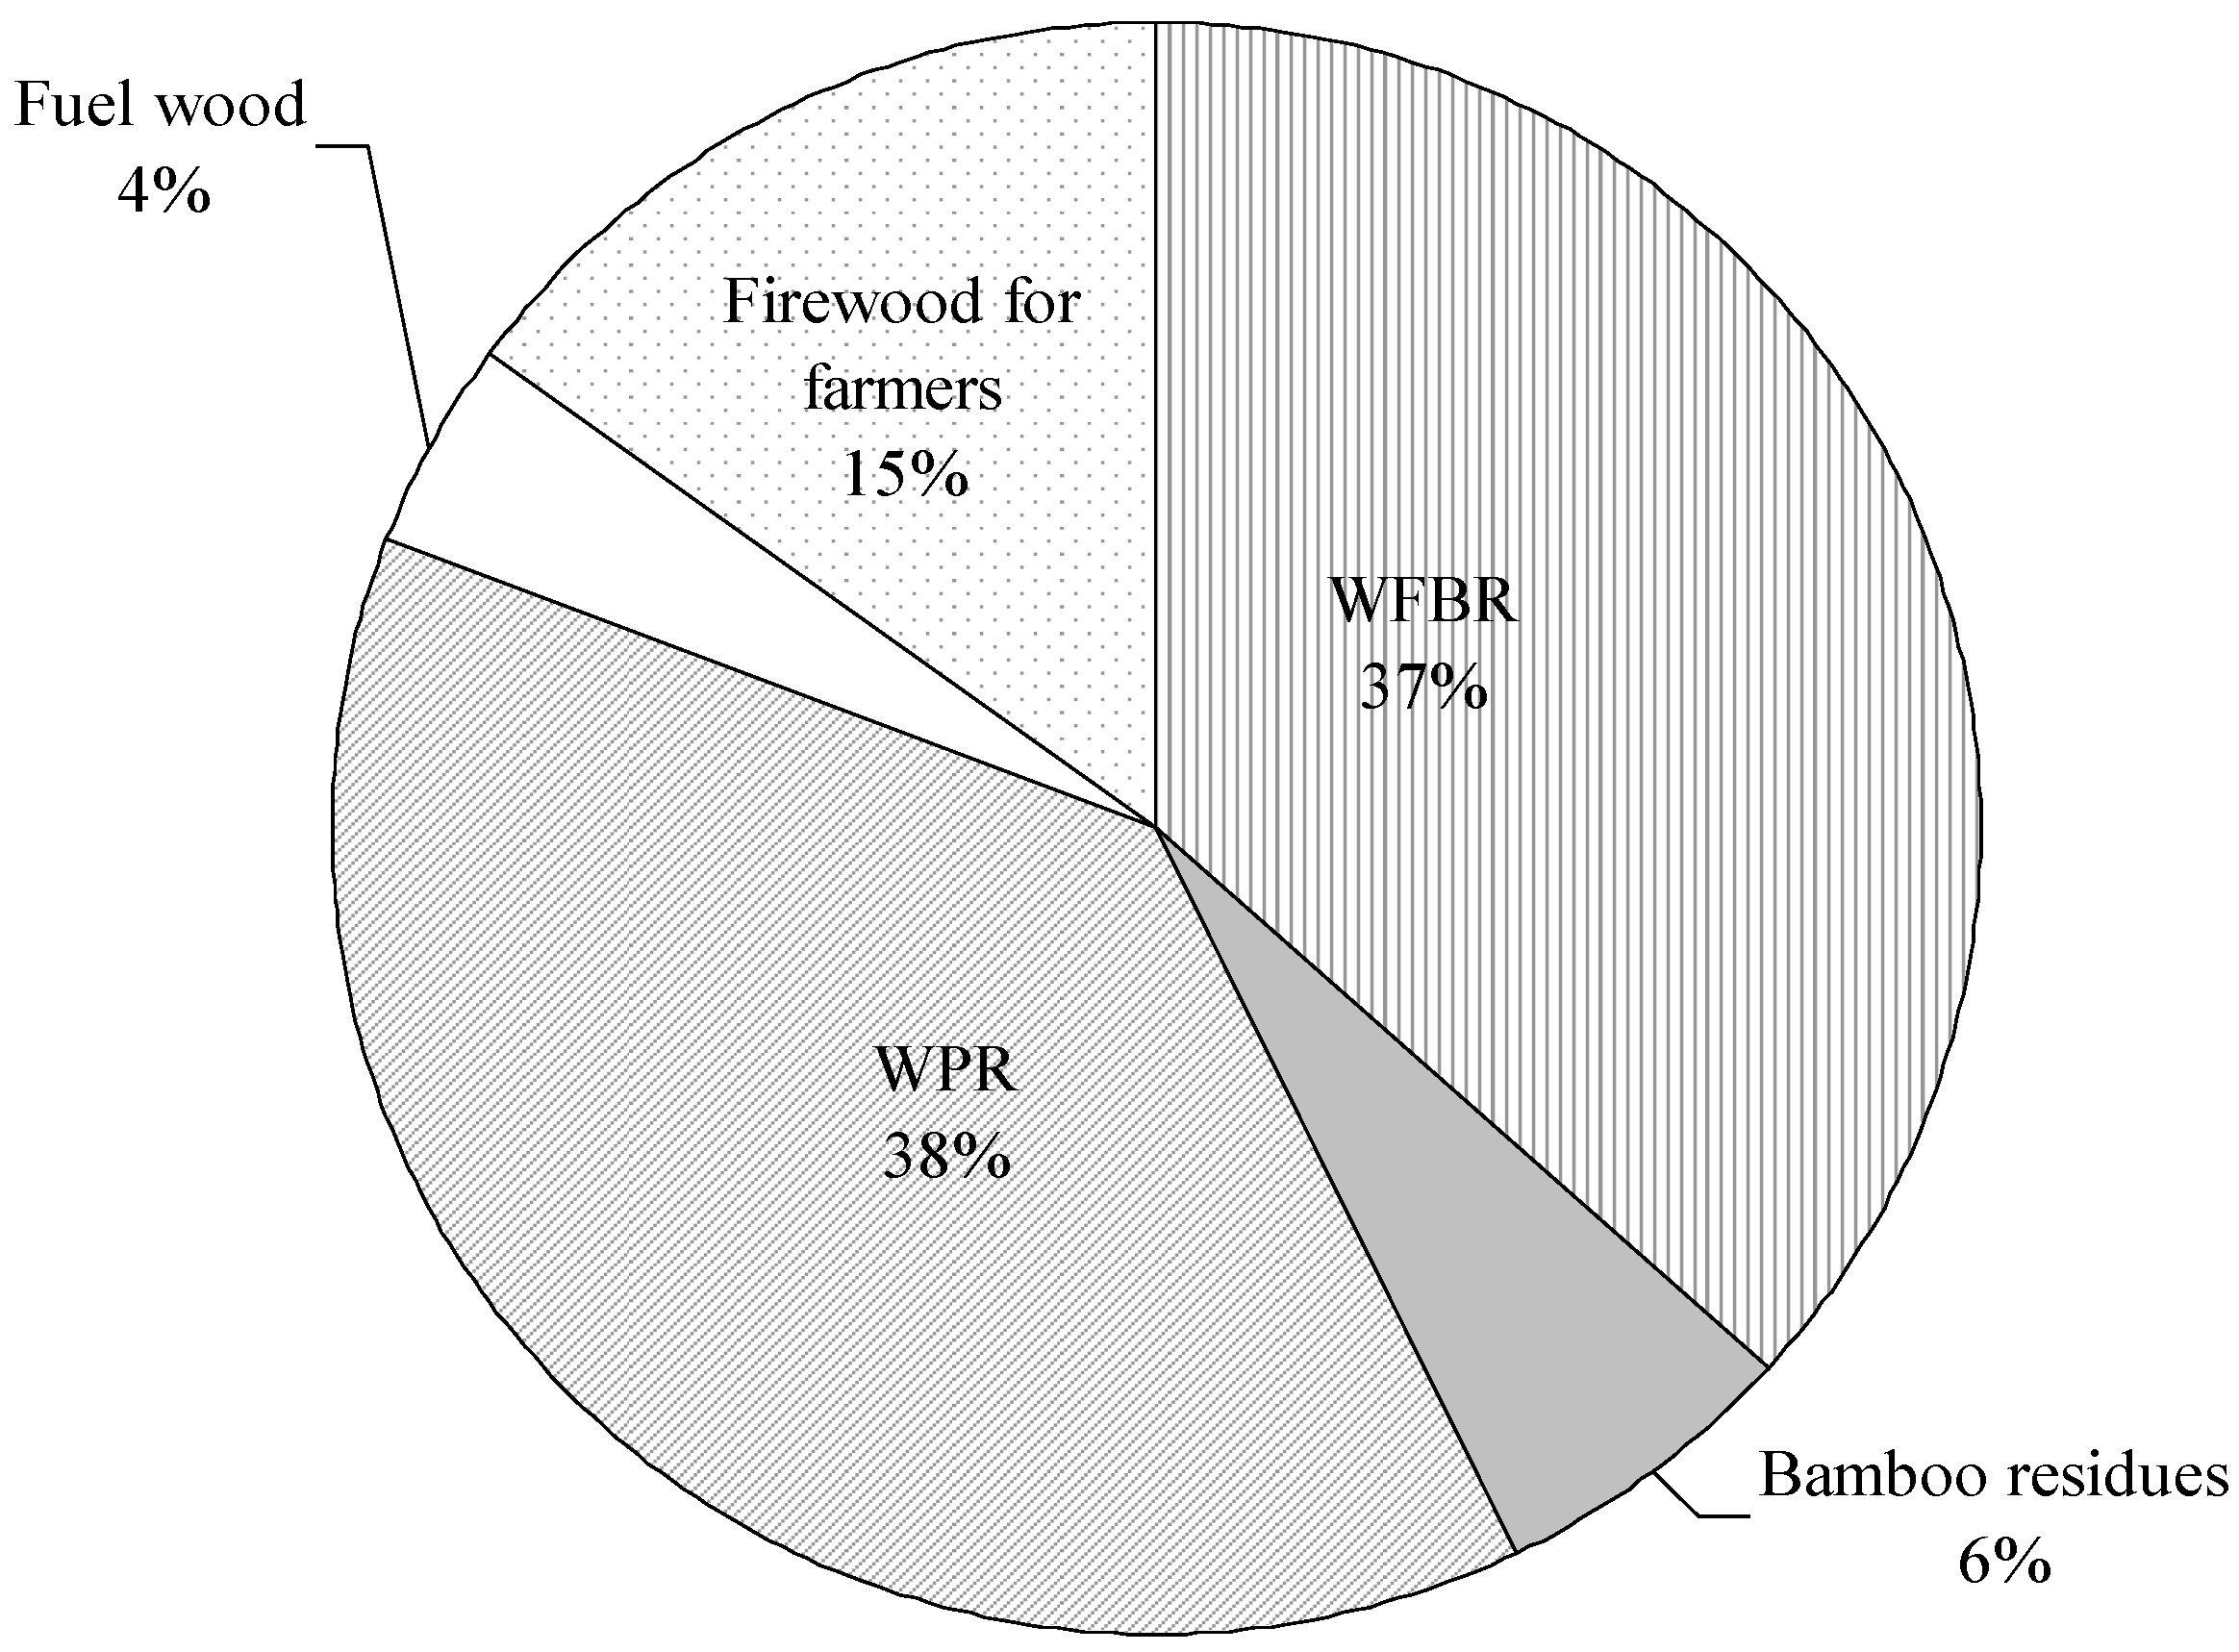
The total forest biomass energy resources in China were approximately 169 million tons in 2010, in which the wood processing residue (WPR), wood felling and bucking residue (WFBR), bamboo processing residue, fuel wood and firewood used by farmers accounted for 38%, 37%, 6%, 4% and 15%, respectively.
(2)
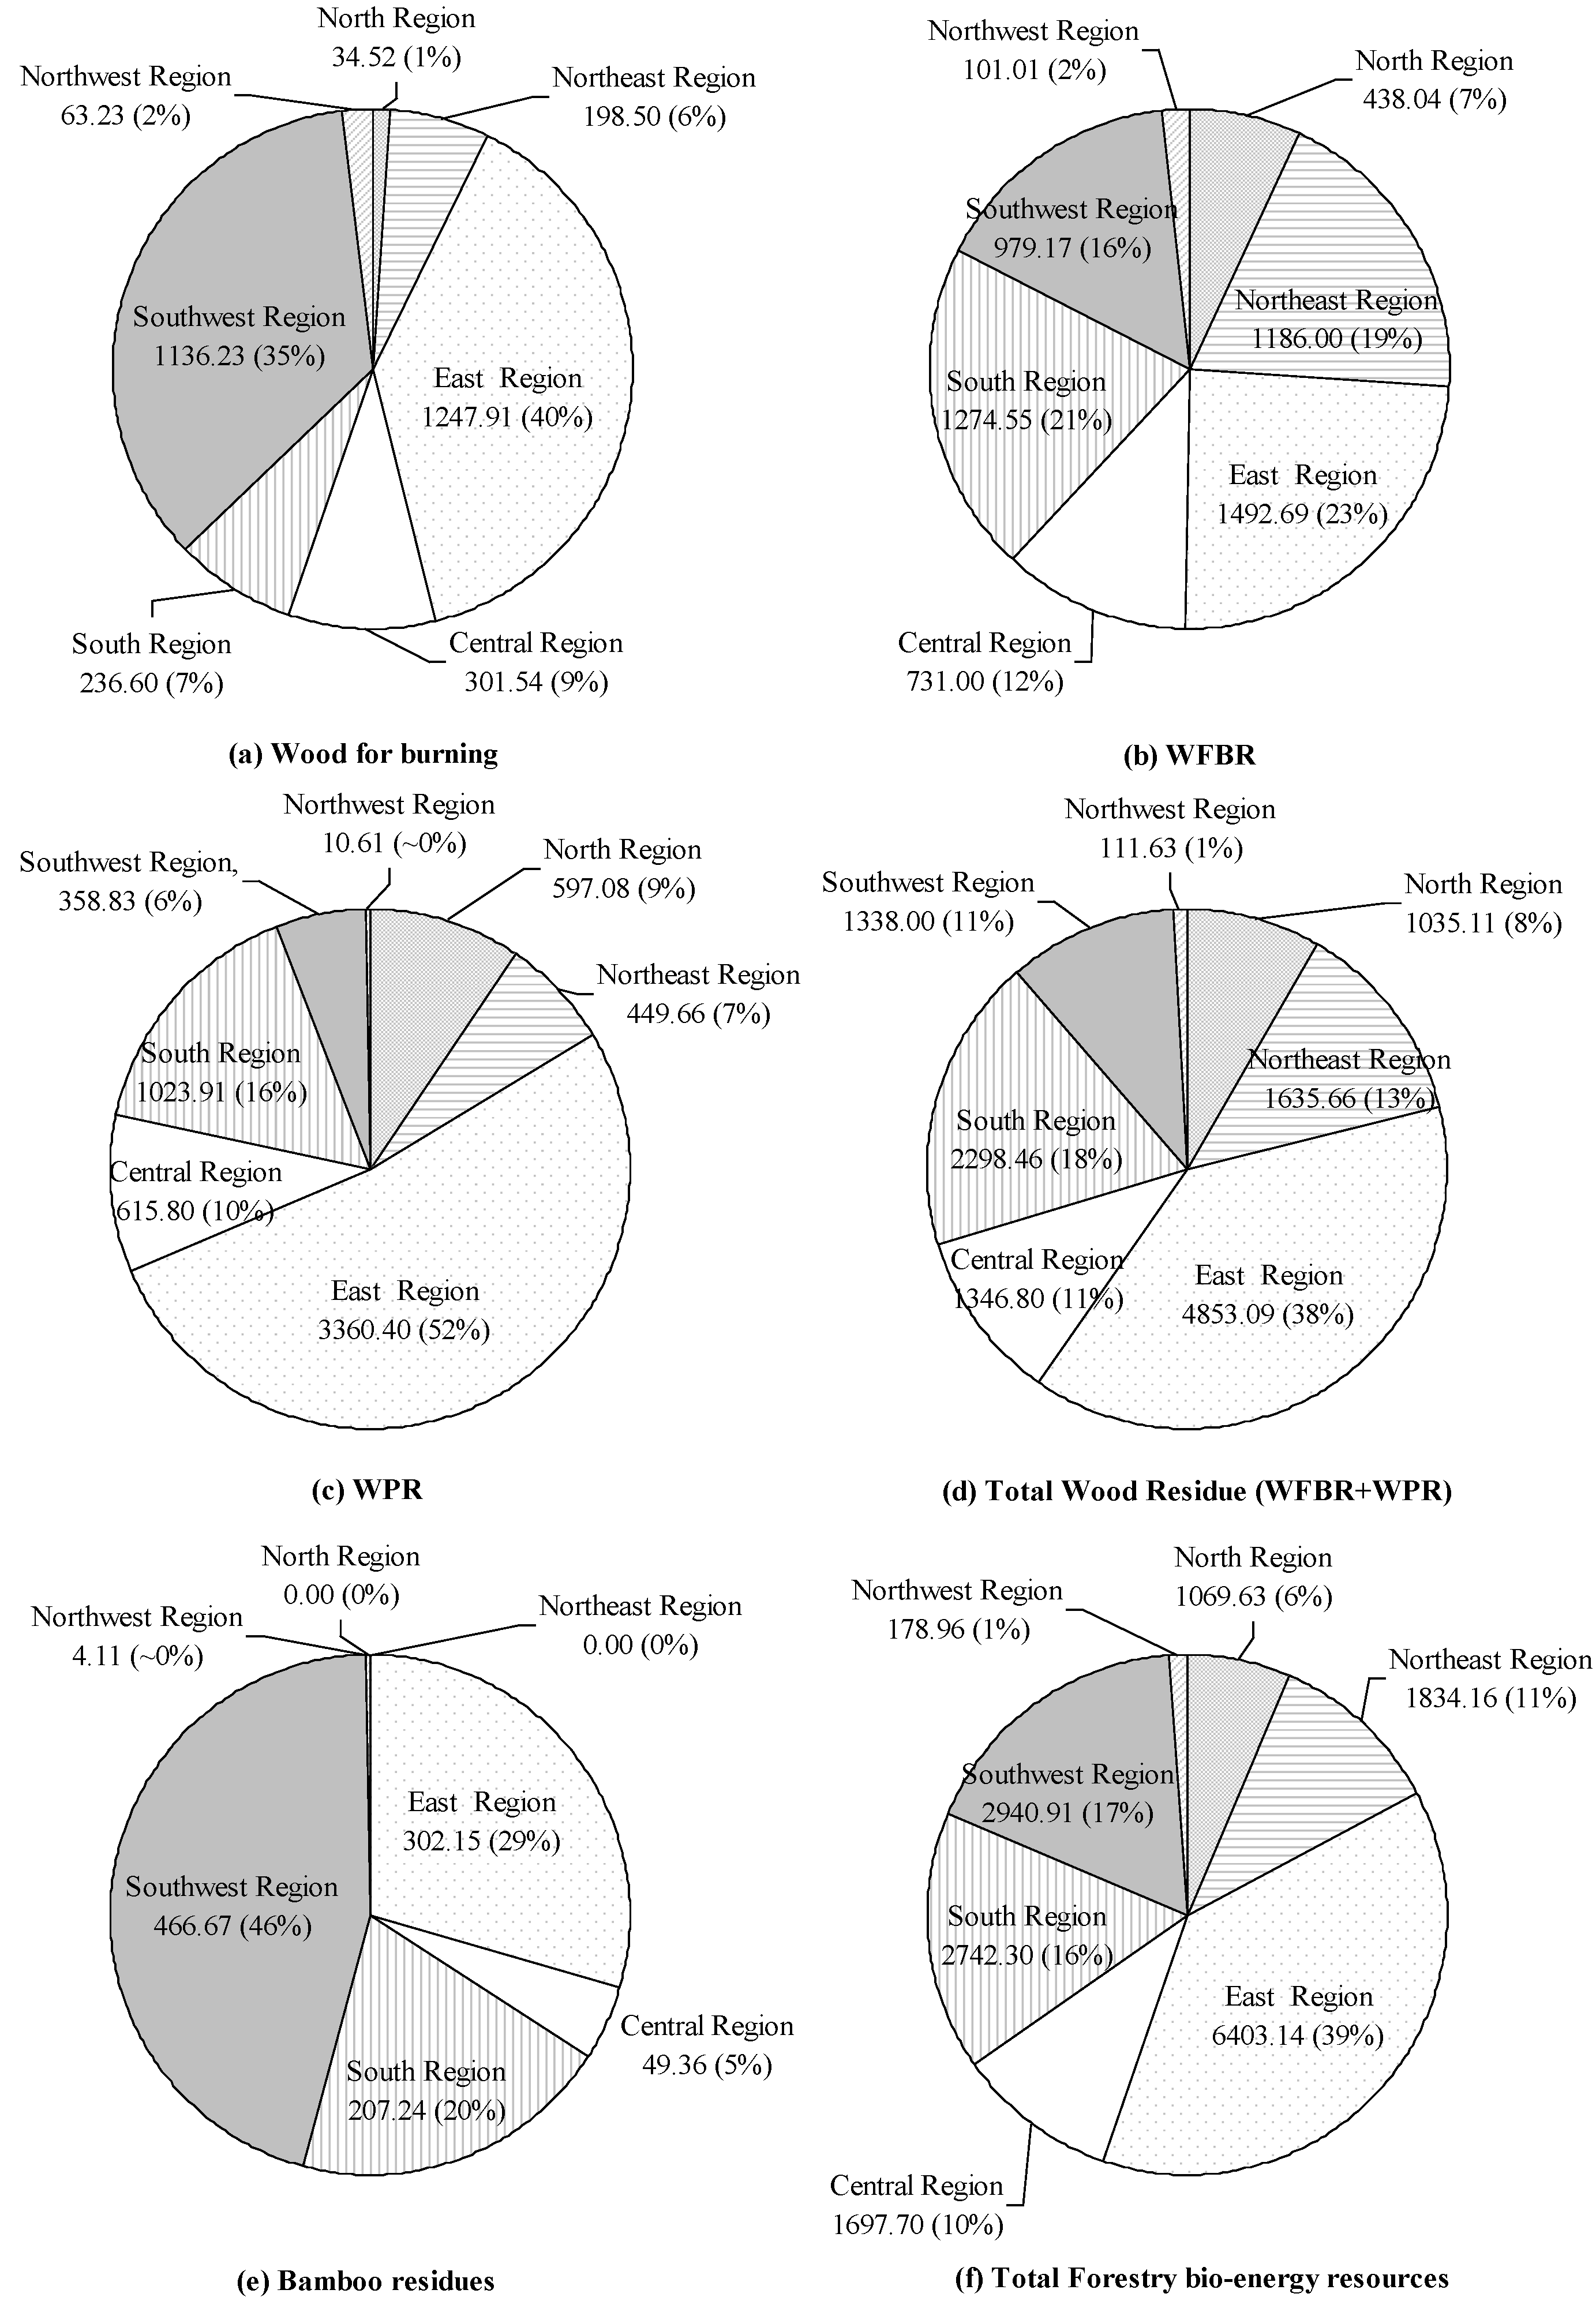
Wood for burning is mainly concentrated in East China and Southwest China, which accounted for nearly 3/4 of the total resource of wood for burning. Fujian and Yunnan have relatively more wood for burning, which accounted for 27.4% and 17.5%, respectively, of the total wood for burning in China.
(3)
The spatial distribution of WFBR,WPR and the total residue resources, were ranked as follows: eastern region (East China and Northeast) southern region (South China and Southwest), central region (Central China), and northern region (North China and Northwest). The proportions of WFBR, WPR and the total residue were 24%, 52% and 38%, respectively, of the national amounts.The residue resourcefrom the production of bamboo products was mainly distributed in the southwestern region (45.3%), followed by the East China region (29.4%) and the South China region (20.1%).
(4)
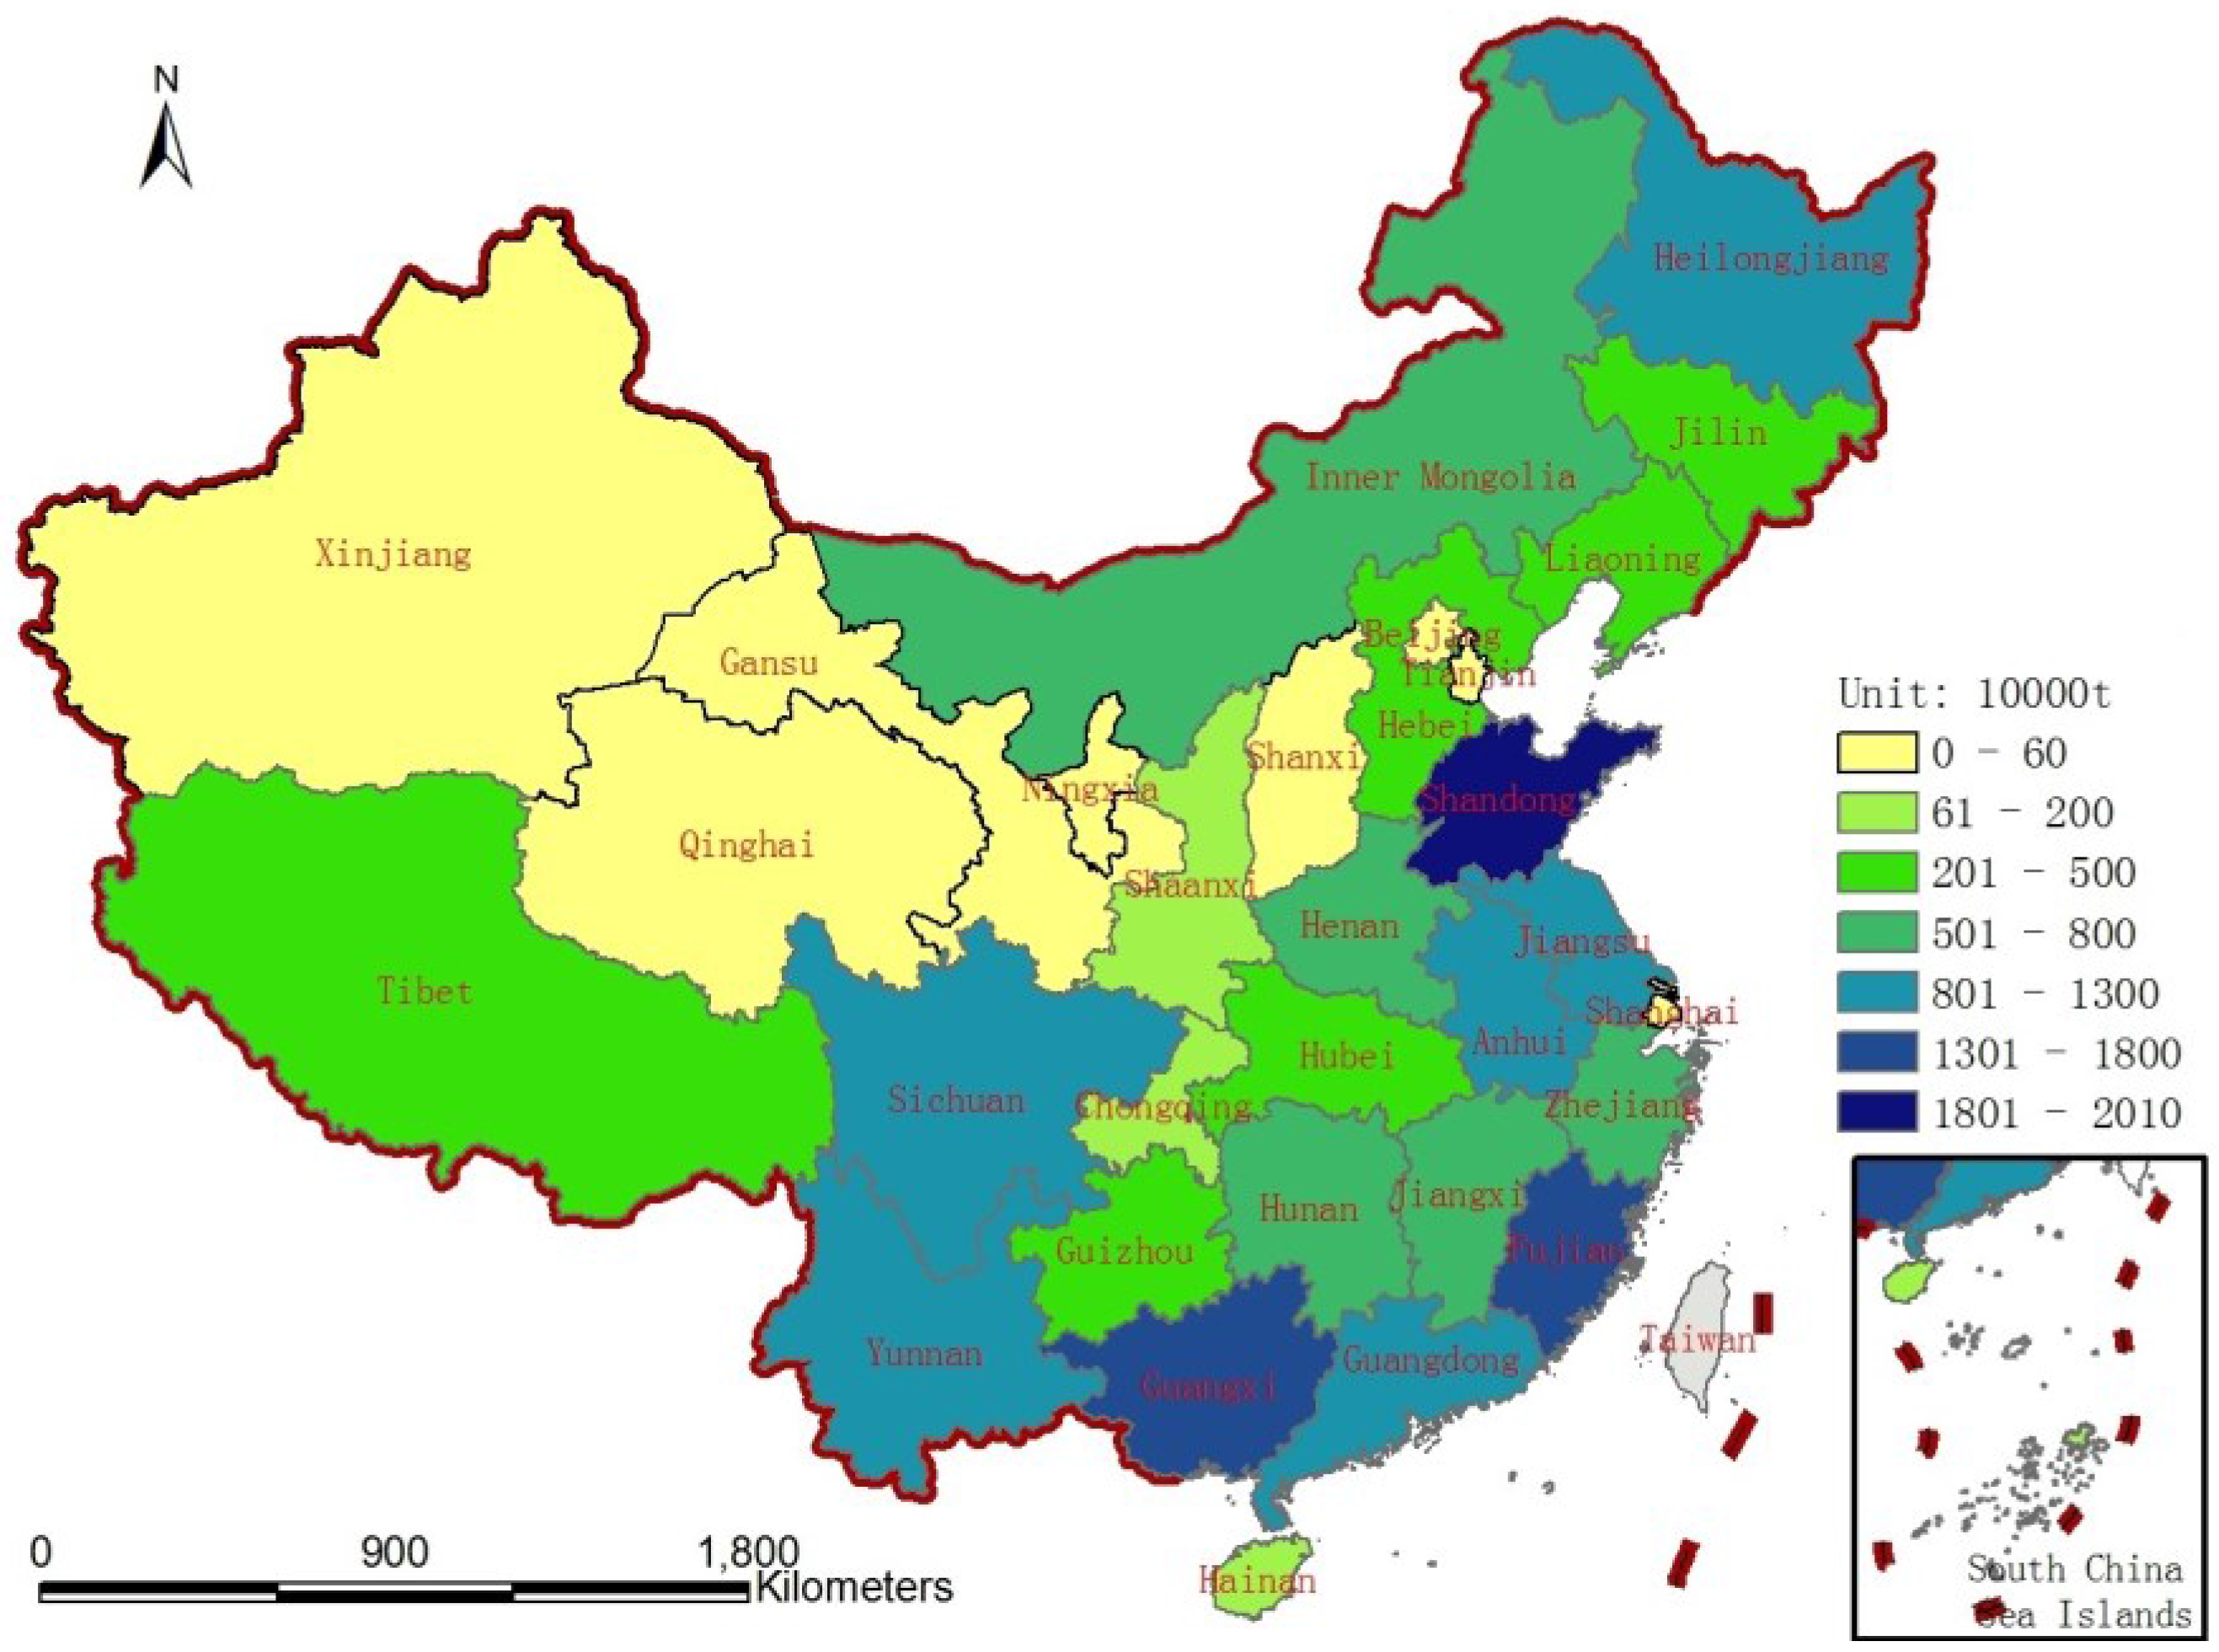
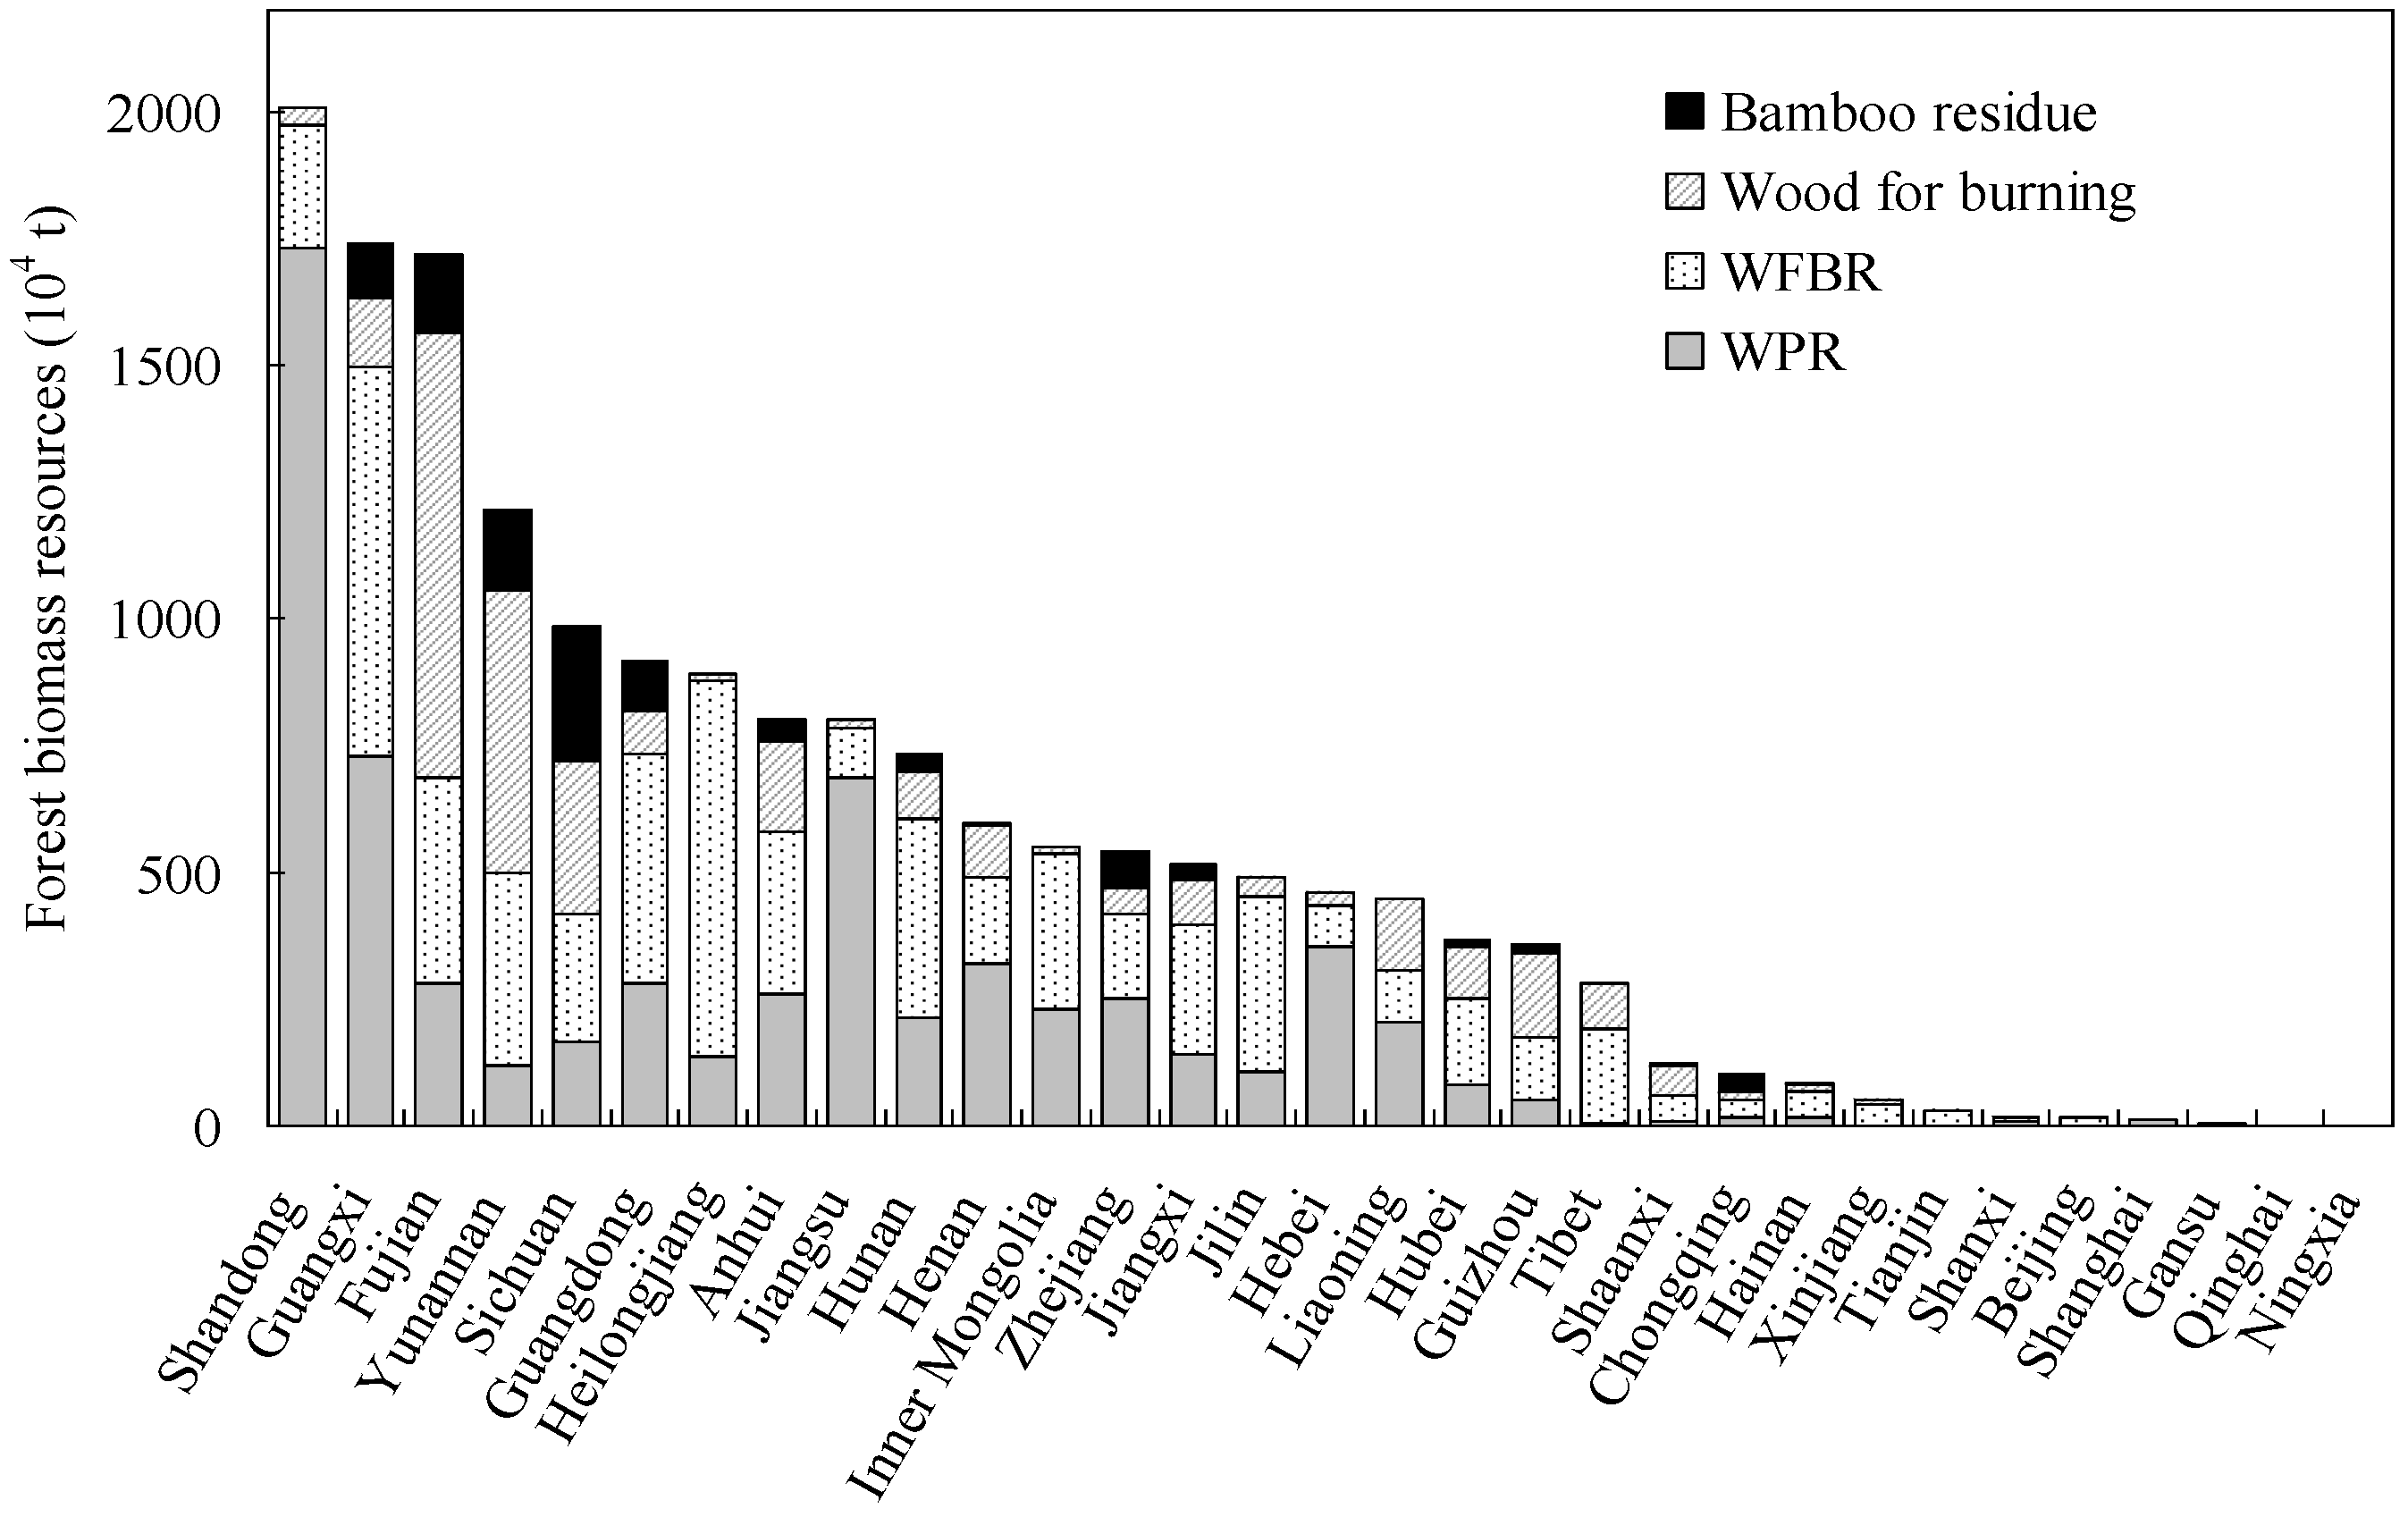
Forest biomass energy resources were the highestin East China, accounting for nearly 39% of the national amount, followed by the Southwest and South China regions, which accounted for 17.4% and 16.3%, respectively. The Northeast and Central regions accounted for 10.9% and 10.1%, respectively. Among the different provinces, Shandong had the highest distribution, accounting for 11.9% of the total resources, followed by Guangxi and Fujian, which accounted for 10.3% and 10.2%, respectively.
(5)
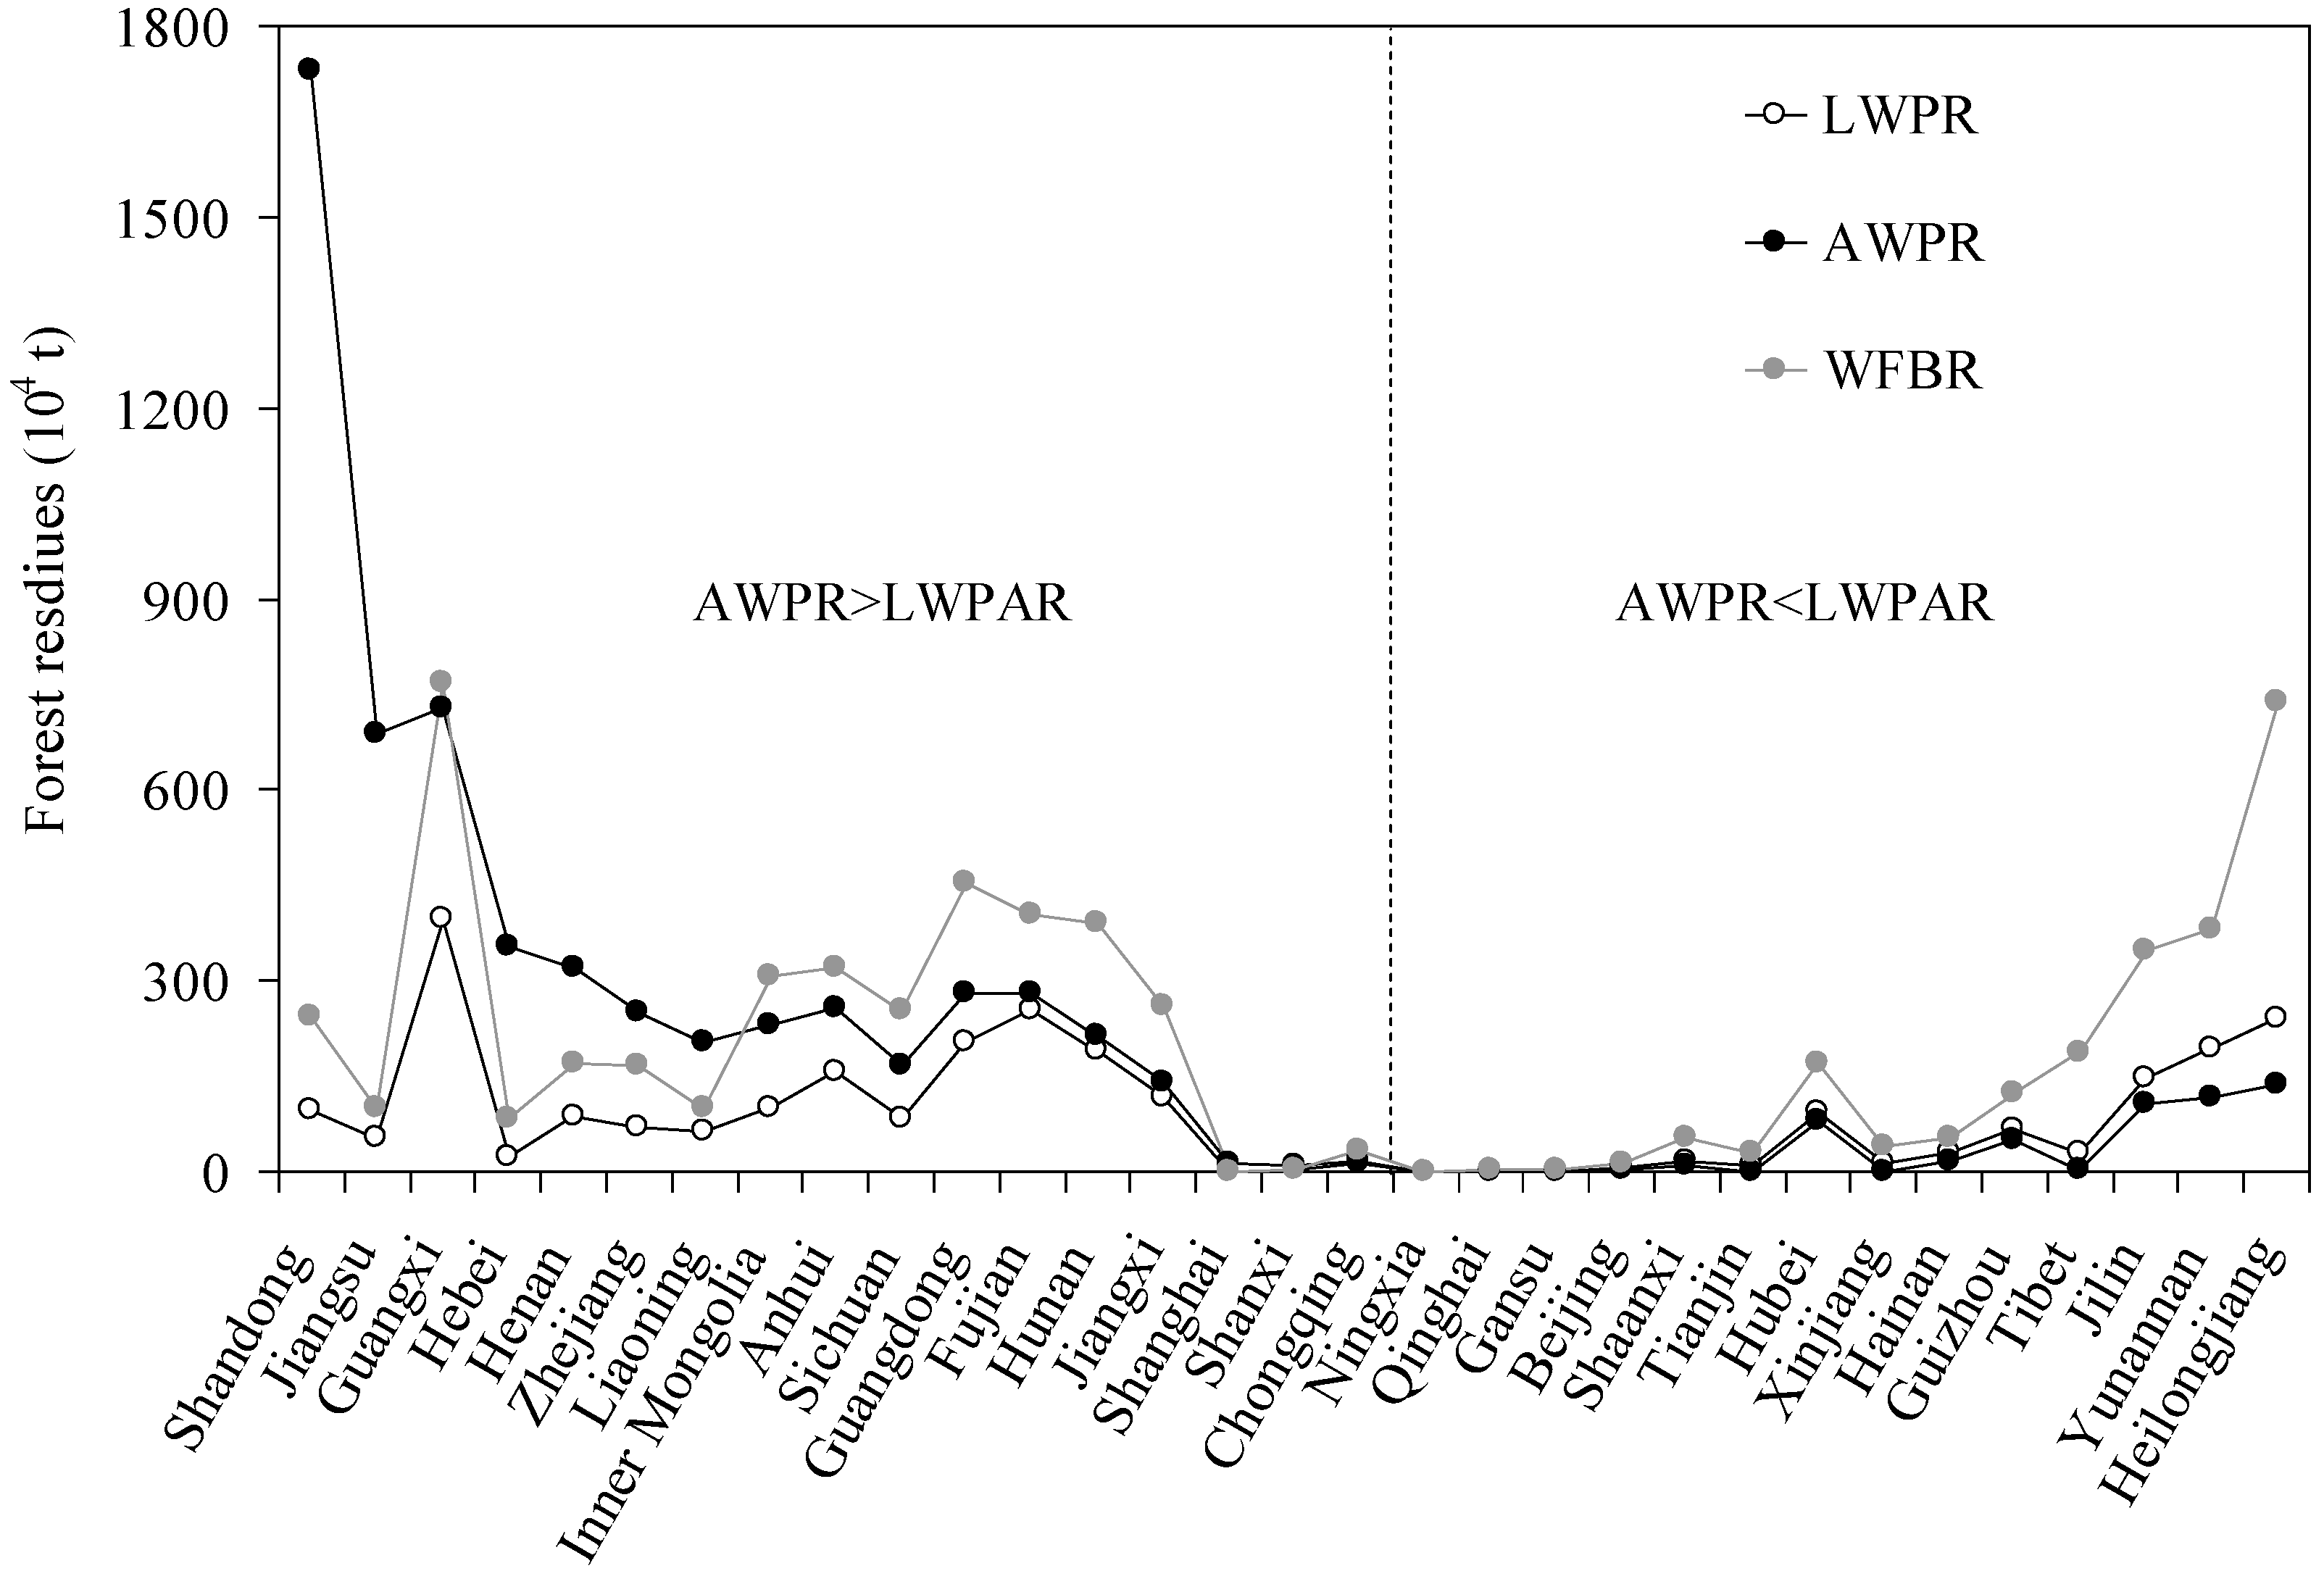
The spatial pattern of AWPR showed apparent differences from that of both LWPR and WFBR, and even a large difference between the LWPR and the AWPR appeared in several provinces, such as Shandong, Guangxi, Jiangsu, Hebei, Heilongjiang and Yunnan. The estimation of WPR considering the actual wood production can provide a more accurate evaluation of the total amount and the spatial distribution of forest biomass energy resources in China.

Acknowledgments

The study is co-supported by the National Natural Science Foundation of China (41101539), the Strategic Priority Research Program of the Chinese Academy of Sciences (XDA05050208) and the National “Twelfth Five-Year” Plan for Science & Technology Support (2013BAC03B05).

Author Contributions

Gaodi Xie contributed the idea and made modifications. Leiming Zhang was responsible for data collection. Caixia Zhang processed and analyzed the data. All the authors were involved in preparing the manuscript.

Conflicts of Interest

The authors declare no conflicts of interest.

References

  1. Zhao, X.G.; Liu, P.K. Focus on bioenergy industry development and energy security in China. Renew. Sustain. Energy Rev. 2014, 32, 302–312. [Google Scholar] [CrossRef]
  2. Qu, M.; Mei, Q.; Ahponen, P.; Tahvanainen, L.; Pelkonen, P. Chinese academic experts’ assessment for forest bio-energy development in China. Energy Policy. 2010, 38, 6767–6775. [Google Scholar] [CrossRef]
  3. Zhang, L.; Zhang, C.H. Potentials of forest bioenergy in China based on forest ecological security. In LISS 2012, Proceedings of 2nd International Conference on Logistics, Informatics and Service Science, Beijing, China, 12–15 July 2012; Zhang, Z.J., Zhang, R.T., Zhang, J.L., Eds.; Springer-Verlag Berlin and Heidelberg GmbH & Co. K: Beilin, Germany, 2013. [Google Scholar]
  4. National forestry biomass energy development plan (2011–2020). Available online: http://www. ccchina.gov.cn/archiver/ccchinacn/UpFile/Files/Default/20130614090957368659.pdf (accessed on 22 December 2014).
  5. Parikka, M. Global biomass fuel resources. Biomass Bioenergy. 2004, 27, 613–620. [Google Scholar] [CrossRef]
  6. Liu, G.; Shen, L. Quantitive Appraisal of Biomass Energy and Its Geographical Distribution in China. J. Nat. Resour. 2007, 22, 9–19. [Google Scholar]
  7. Shi, Y.C. China’s resources of biomass feedstock. Eng. Sci. 2011, 13, 16–23. [Google Scholar]
  8. Yang, J.; Dai, G.H.; Ma, L.Y.; Jia, L.M.; Wu, J.; Wang, X.H. Forest-based bioenergy in China, Status, opportunities, and challenges. Renew. Sustain. Energy Rev. 2013, 18, 478–485. [Google Scholar] [CrossRef]
  9. Summary for Policymakers. In IPCC Special Report on Renewable Energy Sources and Climate Change Mitigation; Edenhofer, O.; Pichs-Madruga, R.; Sokona, Y.; Seyboth, K.; Matschoss, P.; Kadner, S.; Zwickel, T.; Eickemeier, P.; Hansen, G.; Schlömer, S.; et al. (Eds.) Cambridge University Press: Cambridge, UK and New York, NY, US, 2011.
  10. Slade, R.; Bauen, A.; Gross, R. Global bioenergy resources. Nat. Clim. Chang. 2014, 4, 99–105. [Google Scholar] [CrossRef]
  11. Field, C.B.; Campbell, J.E.; Lobel, D.B. Biomass energy: The scale of the potential resource. Trends Ecol. Evol. 2008, 23, 65–72. [Google Scholar] [CrossRef] [PubMed]
  12. Lv, W.; Wang, C.F.; Wang, G.S.; Yu, G.S.; Zhang, C.H.; Zhang, D.H.; Liu, J.L. Preliminary research of wood energy development potential in China. Energy China 2005, 27, 21–26. [Google Scholar]
  13. Qian, N.Z. The status and potential of forestry biomass energy resource in China. Chem. Ind. 2007, 25, 1–5. [Google Scholar]
  14. Zhou, X.P.; Wang, F.; Hu, H.W.; Yang, L.; Guo, P.H.; Xiao, B. Assessment of sustainable biomass resource for energy use in China. Biomass Bioenergy. 2011, 35, 1–11. [Google Scholar] [CrossRef]
  15. Cai, F.; Zhang, L.; Zhang, C.H. Potential of woody biomass energy and its availability in China. J. Beijing For. Univ. (Soc. Sci.) 2012, 11, 103–107. [Google Scholar]
  16. The State Forestry Administration of China. Chinese Forestry Statistical Yearbook 2010; China Forestry Publishing House: Beijing, China, 2011; pp. 94–114.
  17. Sun, J. Resource and significance of wood residues used as energy sources. Renew. Energy. 2002, 105, 8–11. [Google Scholar]
  18. Wu, Z.Z.; Xia, E.L.; Wang, S.D.; Zhong, Z.K. Development and utilization of bamboo bio-energy and its prospects in China. World For. Res. 2013, 26, 60–64. [Google Scholar]
  19. Notice of the State Forestry Administration’s audit opinion on the annual forest cutting quota in the areas during the “Eleven Five” period approved by the State Council. Bull. State Counc. People’s Repub. China 2006, 5, 24–30.
  20. China Forest Biomass Energy Development Potential Research Group. China forest biomass energy development potential research report. China For. Ind. 2006, 1, 5–11. [Google Scholar]
  21. Yang, Y.L.; Zhang, P.D.; Zhang, W.L.; Tian, Y.S.; Zheng, Y.H.; Wang, L.S. Quantitative appraisal and potential analysis for primary biomass resources for energy utilization in China. Renew. Sustain. Energy Rev. 2010, 14, 3050–3058. [Google Scholar] [CrossRef]
  22. Liao, C.P.; Yan, Y.J.; Wu, C.Z.; Huang, H.T. Study on the distribution and quantity of biomass residues resource in China. Biomass Bioenergy. 2004, 27, 111–117. [Google Scholar] [CrossRef]
  23. Yuan, Z.H.; Wu, C.Z.; Ma, L.L. The Principle and Technology of Utilization of Biomass Energy; Chemical Industry Press: Beijing, China, 2005; pp. 1–392. [Google Scholar]

