Article

A Bayesian Spatial Model Highlights Distinct Dynamics in Deforestation from Coca and Pastures in an Andean Biodiversity Hotspot

by
Maria Alejandra Chadid
1,*,
Liliana M. Dávalos
2,
Jorge Molina
3 and
Dolors Armenteras
1
1
Laboratorio de Ecología del Paisaje y Modelación de Ecosistemas ECOLMOD, Departamento de Biología, Facultad de Ciencias, Cra 30 # 45-03,Universidad Nacional de Colombia, Bogotá 111321, Colombia
2
Department of Ecology and Evolution and Consortium for Inter-Disciplinary Environmental Research, 650 Life Sciences Building, Stony Brook, NY 11794-5245, USA
3
Departamento de Geociencias y Ambiente, Universidad Nacional de Colombia, Medellín 050041, Colombia
*
Author to whom correspondence should be addressed.
Forests 2015, 6(11), 3828-3846; https://doi.org/10.3390/f6113828
Submission received: 13 August 2015 / Revised: 5 October 2015 / Accepted: 26 October 2015 / Published: 30 October 2015

Abstract

:
The loss of tropical forests has continued in recent decades despite wide recognition of their importance to maintaining biodiversity. Here, we examine the conversion of forests to pastures and coca crops (illicit activity) on the San Lucas Mountain Range, Colombia for 2002–2007 and 2007–2010. Land use maps and biophysical variables were used as inputs to generate land use and cover change (LUCC) models using the DINAMICA EGO software. These analyses revealed a dramatic acceleration of the pace of deforestation in the region, with rates of conversion from forest to pasture doubling from the first to the second period. Altitude, distance to other crops, and distance to rivers were the primary drivers of deforestation. The influence of these drivers, however, differed markedly depending on whether coca cultivation or pastures replaced forest. Conversion to coca was more probable farther from other crops and from settlements. In contrast, proximity to other crops and to settlements increased conversion to pasture. These relationships highlight the different roles of coca and pastures in forest loss, with coca tending to open up new forest frontiers, and pastures tending to consolidate agricultural expansion and urban influence. Large differences between LUCC processes for each period suggest highly dynamic changes, likely associated with shifting underlying causes of deforestation. These changes may relate to shifts in demand for illicit crops, land, or mining products; however, the data to test these hypotheses are currently lacking. More frequent and detailed monitoring is required to guide actions to decrease the loss of forest in this highly vulnerable biodiversity hotspot in the Northern Andes.

1. Introduction

Tropical forests have been widely recognized as key ecosystems that maintain local, regional, global biological, and physical processes [1]. They provide habitats for a great diversity of plant and animal species [2]; regulate ecological processes such as speciation, dispersal, migration, competition, and extinction [2]; and provide a variety of ecosystem services [3]. The global use of resources provided by these ecosystems has led to degradation and deforestation, generating habitat loss over large tracts of forest. Studies have reported that during the 2000–2012 period, up to 2.3 million km2 of forests have been lost [4]. The highest rates of forest loss in the tropics were recorded in South America, losing 2101 km2/year of rainforests, and dry forests at a rate of 459 km2/year [4].
Tropical deforestation is driven by many factors that can vary from place to place, and through time in a single study area [5]. Drivers of deforestation are mostly associated with human activities and can be differentiated into underlying and direct causes [6]. Underlying causes can be demographic, socioeconomic, political and/or institutional factors that influence direct causes [7,8,9]. Direct causes can be defined as human activities that directly affect the environment and cause a change in the forest cover. They can be grouped into three categories: wood extraction, agricultural expansion, and expansion of infrastructure [6]. The interactions between these causes affect forest cover, and also have impacts on climate change, food production and the livelihoods of the people who depend on tropical forests to survive [10]. Researchers studying tropical deforestation recognize the value of spatial analysis to assess the causes of deforestation and better understand the dynamics of land use change.
The tropical Andes of northern South America are of particular interest because of their vulnerability to climate change and their importance as global biodiversity “hot spots”. The northern Andes also have high social and economic importance, providing water to vast human populations, and experience high rates of deforestation [11]. In Colombia, Andean forests are the second most fragmented natural habitat and harbor the highest human population density. In recent decades, both shifting cultivation of illicit crops and conversion to pastures for cattle ranching have been some of the direct causes of deforestation reported in the Andean ecoregion [11,12].
The San Lucas Mountain Range is located to the northeast of the central Andes in Colombia [13,14], and its forests are home to a large number of plants and animals endemic to the northern Andes biodiversity hotspot [14,15]. Lacking any government or private protection, this mountain range is vulnerable to deforestation and biodiversity loss [14,15,16]. Armed conflict and the replacement of forests into coca crops, pastures and mining areas threaten local biodiversity [14]. One important consequence of the insecurity in San Lucas is the lack of research, which explains why only a few studies have been conducted on this mountain range. Since the late 1990s, fewer than a handful of studies have described and analyzed the biodiversity of San Lucas, and the conservation challenges arising from local political and socioeconomic circumstances [14,15,17].
To date, the local deforestation dynamics of San Lucas have not been formally analyzed. Given the importance of San Lucas and the lack of recent deforestation analyses, we aimed to quantify and analyze region-specific changes in forest cover. We also aimed to analyze the dynamics of forest cover change for two periods (2002–2007, 2007–2010), and calibrate and validate a spatial model of land use change to investigate the determinants of deforestation [18,19]. We focused our analyses on the change from forest to the cultivation of coca and conversion to pastures. We specifically address three outstanding questions: (i) What are the dynamics of forest loss for the 2002–2007 and 2007–2010 periods? (ii) What is the spatial relationship between forest cover loss and other land uses such as crops and settlements? Additionally; (iii) What is the influence of specific biophysical variables on the land use change of forest cover to pastures and coca crops?

2. Study Area

The San Lucas Mountain Range is located at the northeast end of the central Andes of Colombia, and its natural boundaries are the Magdalena River to the east, the Nechí River to the west, and the Cauca River to the north [15]. San Lucas is located in the transition zone between the Caribbean and the Andean climate regimes [14,15] (Figure 1). The mountain range encompasses approximately two million hectares of tropical and subtropical forests that span an altitudinal gradient of 0–2500 m [14,15].
The study area encompasses four departmentos or provinces (Antioquia, Bolivar, Sucre, and Cordoba) and 25 municipalities, although the degree to which political units correspond to the mountain range itself varies (Figure 1). The most recent census by the National Department of Statistics (DANE) in 2005 recorded approximately 525,000 inhabitants in these municipalities [20]. Most of the population in San Lucas is concentrated in towns and villages characterized by weak institutional infrastructure and state control, as well as economic underdevelopment [14]. With approximately 20,000 inhabitants [20], Santa Rosa del Sur in Bolivar is the most prominent town in San Lucas, and is effectively the spearhead of colonization into the mountain range [14]. The local road network is underdeveloped, in many cases created by local inhabitants, and is used to support the transportation of different products [14].
Given the lack of security in the area and the presence of armed groups, few biological studies have been attempted [12,21]. A brief biological survey revealed a great wealth of endemic animals and plants [15]. During the last few decades, these forests have undergone deforestation and their ecosystem services have degraded. The direct causes of these changes are largely anthropic and include gold mining, expansion of the colonization frontier, cattle ranching, and coca cultivation [14,15].
Figure 1. Location and digital elevation model of the study area.
Forests 06 03828 g001

3. Methods

3.1. Data

Our primary data consists of a set of land cover maps that were developed by the “Sistema Integrado de Monitoreo de Cultivos Ilícitos” (Integrated Illicit Crop Monitoring System, SIMCI). SIMCI is a project of the United Nations Office on Drugs and Crime that conducts an annual census of the illicit crops coca and opium poppy in Colombia using remote sensing tools [22]. The maps used for this study are the final product of the visual interpretation and classification of Landsat Enhance Thematic Mapper Plus (ETM+) multispectral satellite images taken in 2002, 2007, and 2010. Given the biophysical conditions of the study area, the maps corresponding to these years were selected mainly based on the quality of the images, including a low percentage of gaps and clouds. The availability and quality of the maps selected enabled analyses for the first period with a five-year window (2002–2007), and a three-year window for a second period (2007–2010). All maps were georeferenced to the Transverse Mercator projection, Bogota Observatory Datum [23]. Cell size is 30 m, and the error in horizontal position satisfies the requirements of the cartography at scale 1:100,000.
The SIMCI land cover maps also have strict verification of the final product through ground and aerial truthing [22,24]. In conjunction with the national anti-narcotics police, SIMCI conducts flights primarily focused on areas where new coca cultivation is recorded in the satellite imagery, and reaching up to 10% of these new areas. These flight-assisted aerial truthing data are then used to adjust interpretation of the satellite imagery [25].
The original SIMCI maps were classified into 11 categories. For the purposes of this study, we reclassified maps into six categories: (a) coca crops; (b) forest; (c) pastures; (d) other covers; (e) other crops; and (f) routes. “Coca crops” are of particular interest as areas planted with illicit crops. Given the scale of the maps and the size of the coca plots (small number of pixels), these are difficult to identify initially, and are subject to partial verification by SIMCI. “Forest” areas correspond to primary and secondary vegetation grouped as a single natural land use. The “pastures” designation is used to identify artificial grasslands for cattle ranching and farming. Both coca and pastures are direct causes of deforestation. By attracting colonists to newly opened forests, coca is also an indirect cause of deforestation. “Other cover” represents covers that are considered secondary to the study (e.g., bare soil, rock outcrops, sand, flood plains, clouds, and gaps). “Other crops” corresponds to areas with shifting cultivation, while “routes” corresponds to primary roads that allow communication between the different municipalities across the mountain.
The original SIMCI maps were modified in two ways: (1) by setting up an initial mask of forest to analyze deforestation through time; and (2) all maps were set with the same gaps and clouds to avoid under or overestimations of forest loss. After these modifications all maps had the same total of 8.81% of gaps and clouds. These geoprocessing adjustments improve the quality of the data, even as they reduce the total pixels available for analyses.
The data for rivers was obtained from the geographic information system for planning and the Land Management National Geographic Institute Agustin Codazzi (SIGOT). The Shuttle Radar Topography Mission’s (SRTM) 90 m resolution digital elevation models, detailed data of roads, the slope, and the aspect were obtained from the Geographic Institute Agustín Codazzi. Detailed road maps were not available for different time steps, so that the specificity of these layers is lower than that of land use, reducing model complexity. In short, the data on roads captured state-maintained roads and not the locally developed network, or its change over time.

3.2. Land Use Change Spatial Model

To analyze the dynamics of deforestation we used the software DINAMICA EGO, which involves a multi-step stochastic simulation with dynamic spatial transition probabilities to reproduce the dimensions and forms of landscape change [26,27,28,29]. DINAMICA has been widely used for different purposes, among others: simulating spatial patterns of land use through the expansion of the colonization frontiers in Amazonia [26]; and modeling future land use change scenarios in Brazilian savannas [30] and national parks [31], Kenya’s Eastern Arc Mountains [32], and tropical forest in Lao People’s Democratic Republic [33]. These diverse applications show the flexibility of DINAMICA EGO as a modeling platform, as it allows adjusting different parameters to fit the model to the variables and dynamics of the case of study.
The model follows a series of steps (Figure 2) to simulate deforestation [19] in: 2002–2007, 2007–2010, and 2002–2010. In the first step, the model calculates transition matrices that describe the net change in a landscape through discrete periods [18,34]. The single step matrix corresponds to a single time step, while the multiple-step matrix corresponds to a time step unit specified by dividing the time period by a number of time steps [19].
Figure 2. Steps in the land cover change simulation model (adapted from [21]).
Forests 06 03828 g002
Based on our research goal and the general conditions of the San Lucas data, we needed to analyze spatial statistics on areas with little data. We therefore selected the “weight of evidence” (WoE) method for discrete multivariate statistical analyses [27]. WoE is based on the “Bayes theorem of conditional probability” [35]. The theorem uses prior and posterior probabilities to delineate the relative importance of data. These probabilities can be calculated with the number of occurrence samples, with the whole assessed samples and the probability of existence of the phenomena when the predictor variable exists [27]. It assigns positive or negative weight values (WoE+/WoE−) to each map pixel that contains the variables that may influence the transition of interest, in this case, from forest to another land use In other words, the weight values represent the influence of each variable on the spatial probability of a transition occurrence [28,36]. Thus, variables with positive weight values (WoE+) promote deforestation associated with a particular transition, while variables with negative weight values (WoE−) do not. We used the WoE to analyze the influence of the variables, and to generate a deforestation probability map for each period of study.
To apply this modeling approach, it was necessary to categorize all the continuous (or gray-tone variables of Figure 2) variables into discrete bins. These quantitative variables included distance to rivers, distance to roads and settlements, and slope, as these are potential determinants of the transitions of interest [19]. Once these continuous variables were categorized in step 2, it was possible to estimate a WoE for each bin or range and then determine the influence of these variables in the transition from forest to coca crops or to pastures (Figure 2). The model selects the number of intervals and the size of buffers used to calculate ranks while attempting to preserve the original structure of the continuous data variable [19]. The variables considered in the spatial analysis were: (a) distance to roads; (b) distance to rivers; (c) altitude; (d) distance to other crops; (e) aspect; (f) slope; and (g) distance to settlements.
After the calculation of the WoE for each variable, a spatial correlation analysis was performed (step 4) to determine whether the variables were independent from each other, and to identify their degree of association. To measure the degree of independence, we used two statistics: Cramer’s coefficient and the joint information uncertainty principle. The first one is based on chi-square (X2), and the second one is based on the joint uncertainty between two distributions computed from entropies. The range for these figures was 0–1, with values below 0.5 indicating a weaker association and higher independence between two variables [19,28,37].
Each time period (2002–2007, 2007–2010, and 2002–2010) was calibrated and validated independently. For calibration two transition algorithms were used to allocate cover changes in each period. These functions patcher and expander, whose functions generate new patches through a seed formation mechanism and the expansion of previously existing patches for the covers of interest [32]. These algorithms scan the initial maps for each period and sort out cells with the highest change probabilities, arranging them in a data array. Some of the cells are then selected randomly and the initial cover map is scanned one more time to perform the selected transitions [31]. The mean and the variance of the patches, were also calibrated using the mentioned algorithms and also a final parameter, the patch isometry index, which is related with the compaction of the patches, in which lower values reflect more fragmented formations [32]. Next, each of the models ran its modeled scenario, and these were visually compared to the end-state of the period. These visual analyses helped adjust model parameters to improve the simulated maps. Two types of map were obtained as results: (1) map of probability of transitions that shows the areas with high and low probabilities of forest cover change into pastures and coca crops; and (2) simulated cover map for each of the periods. The latter were used during the validation process.
For validation, we used multiple-resolution windows to compare simulated and observed landscapes for each period. This method uses pairwise comparisons of initial and simulated land cover maps, and between initial and final landscape of reference for each period [26,31,32]. These comparisons deal with one type of change at the time and the two-way similarity measure can be applied to the entire map. At the same time, the inherited similarity between the initial and simulated map is eliminated from this comparison by ignoring the null cells from the overall count [32]. These approaches are useful when comparing maps that do not exactly match on a cell-by-cell basis, but still present similar spatial patterns within certain cell vicinity [26]. The validation procedure also retrieves a fuzzy similarity index within a gradually expanding window in which a representation of a cell is influenced by the cell itself and by the cells in its vicinity [32]. The comparison results in a map that specifies for each pixel the degree of similarity on a scale of 0–1, so that zero represents total disagreement and one represents identical maps [31].

4. Results

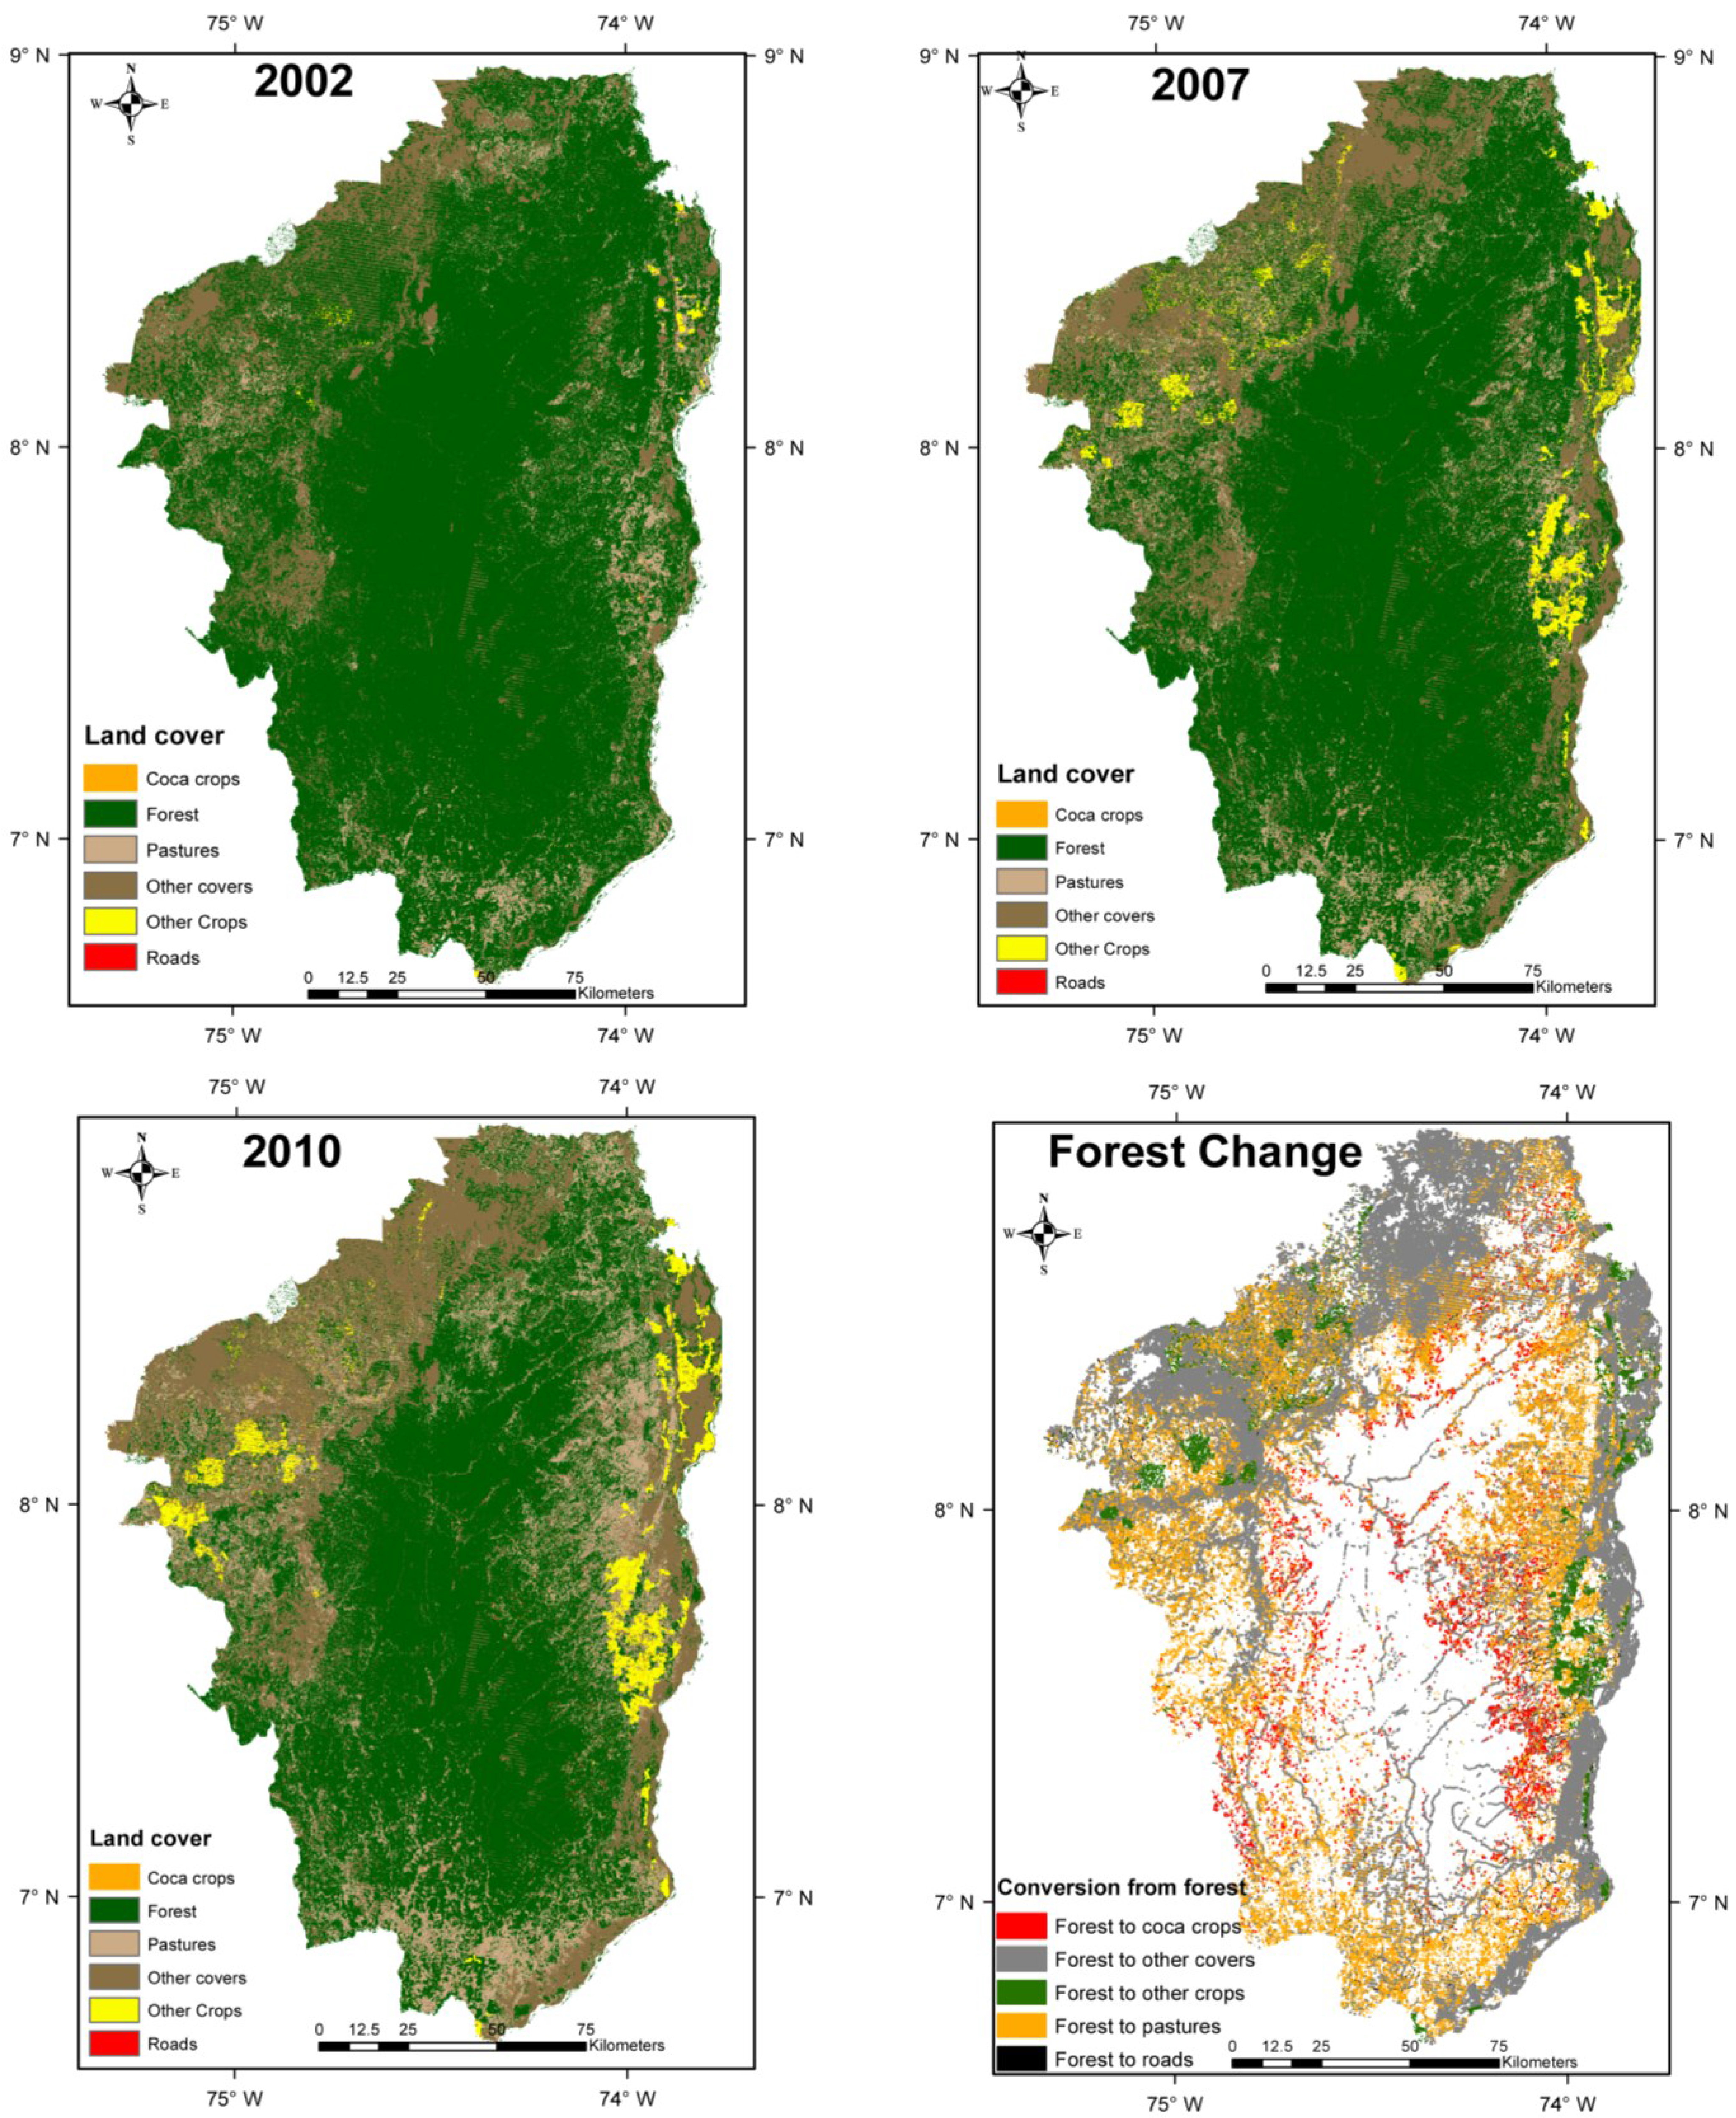
Figure 3 shows that forests decreased, while illicit crops and pastures increased over time. An estimated 312,019 Ha of forest were lost from 2002–2007, while illicit crops increased by 4438 Ha and pastures by 270,409 Ha. From 2007–2010, 340,842 Ha of forest were lost, while 633 Ha of illicit crops and 225,279 Ha of pastures were added (Table 1).
Table 1. Land use cover recorded at each time.
Land Use/Ha per Year200220072010
Forest2,227,9311,915,9131,574,470
Coca crops9415379.56013
Pastures228,558270,638495,917
Figure 3. Land cover maps for 2002, 2007, and 2010, and conversion of forest to other covers between 2002 and 2010.
Forests 06 03828 g003
No substantial spatial correlations were observed between any of the variables. The maximum Cramer index value obtained for the transition from forest to coca was 0.26, and the uncertainty index was 0.11. For the transition from forest to pasture, the maximum Cramer index value was 0.25, and the uncertainty index was 0.11. This indicated spatial independence between variables and made removing portions of the previous model unnecessary.
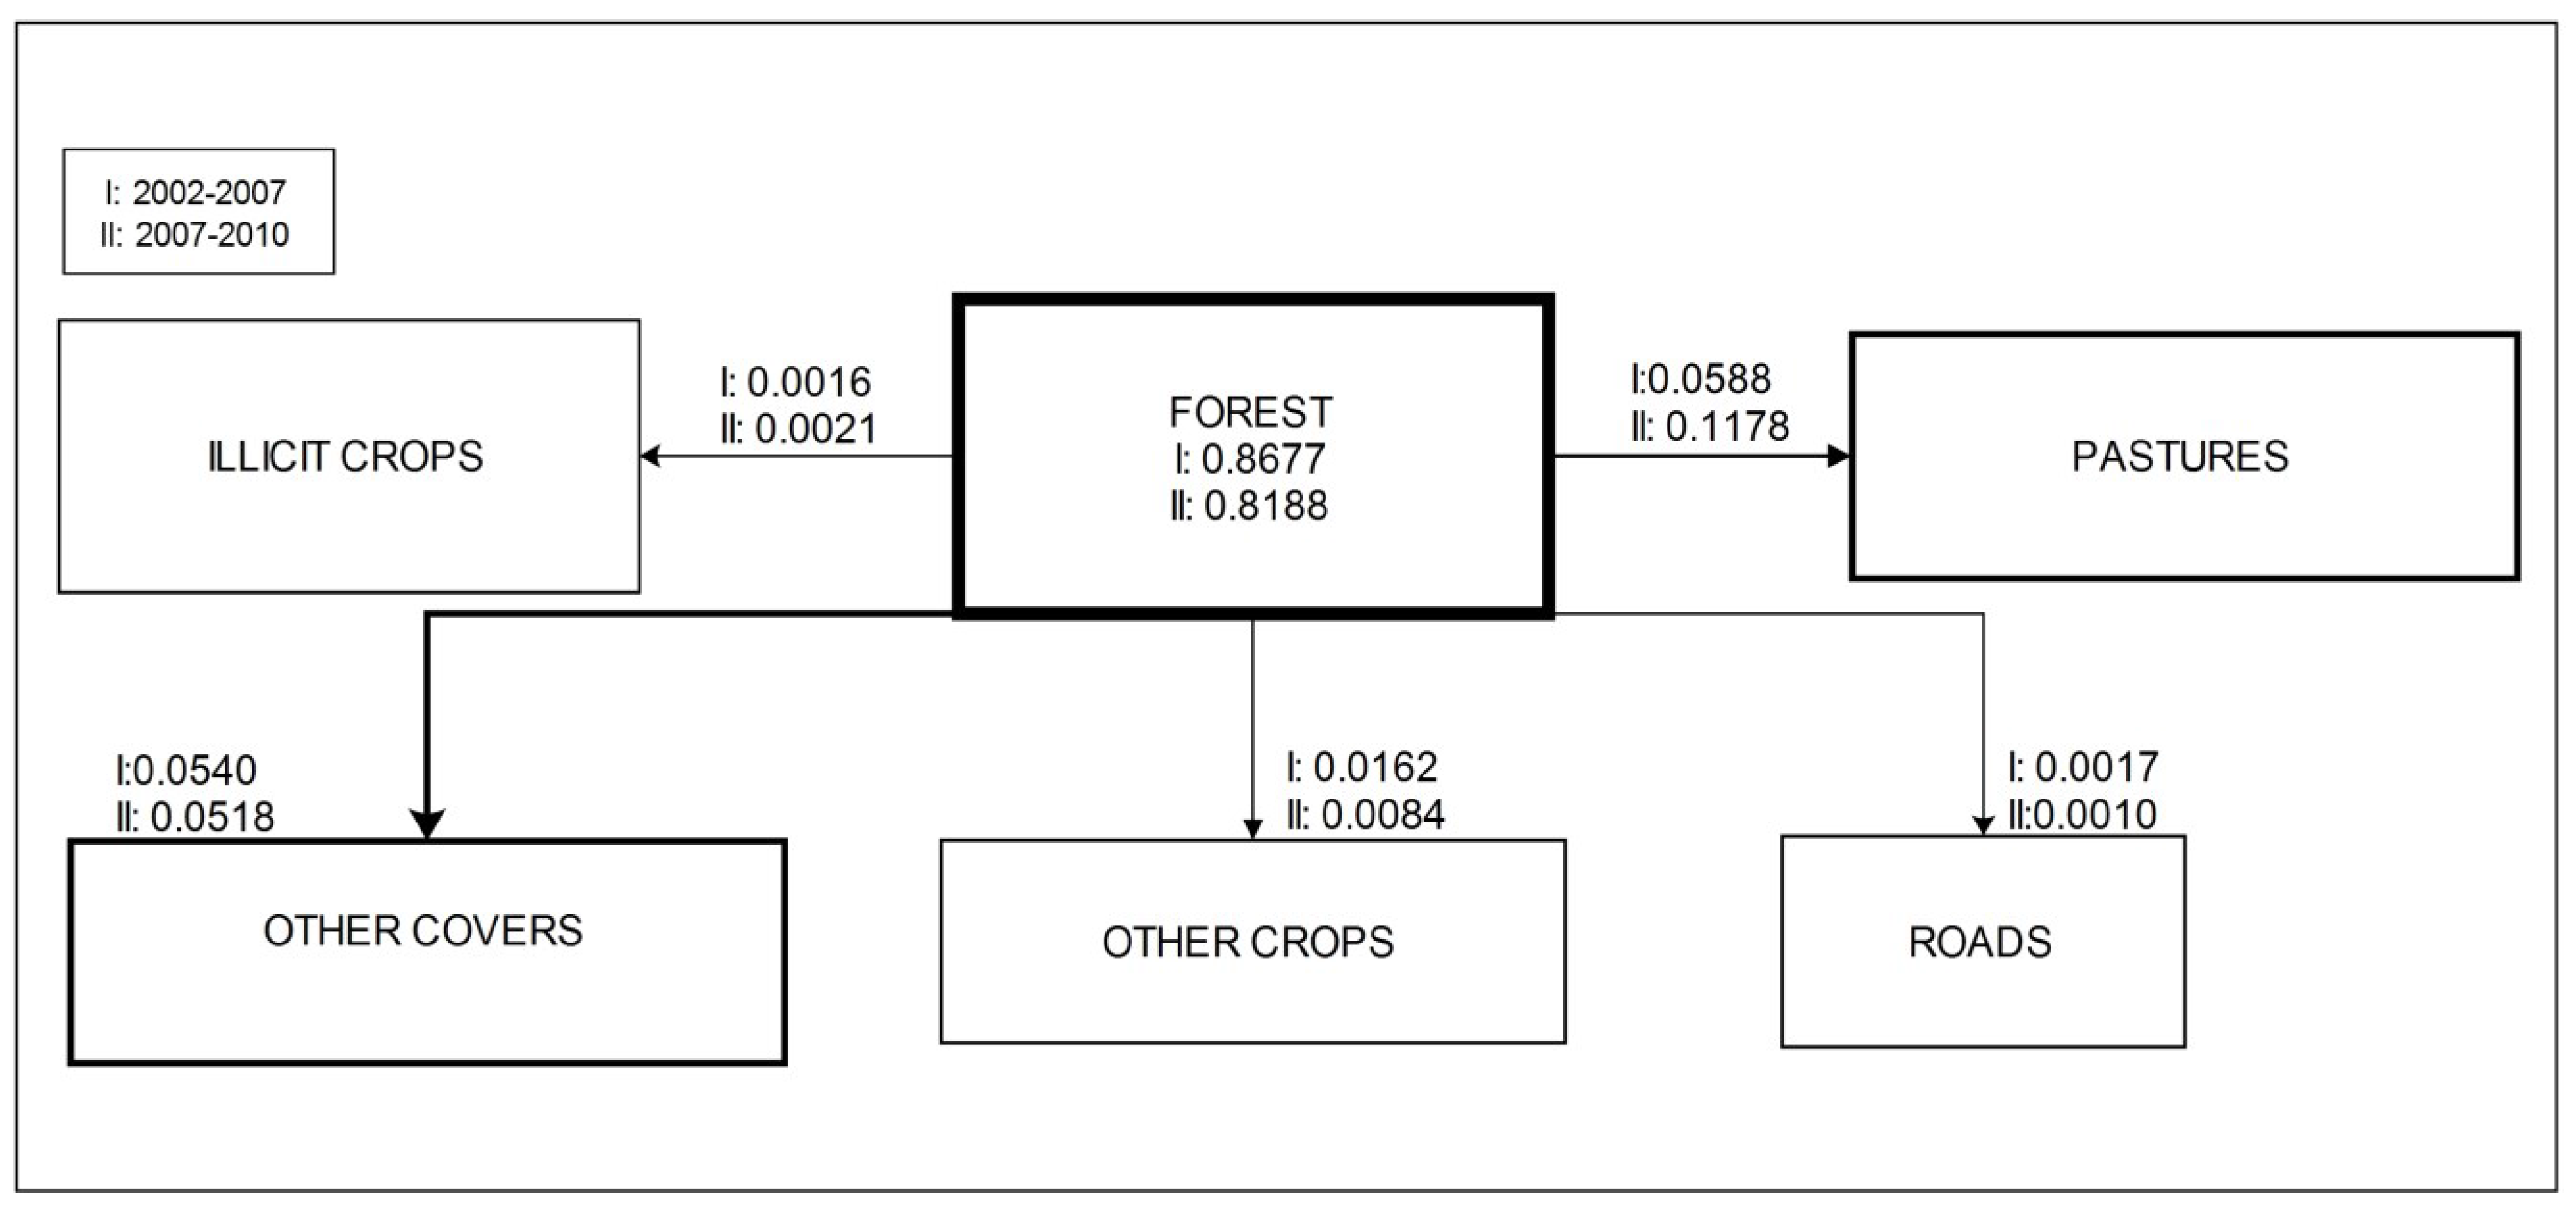
From 2002–2007, the greatest probabilities of transition were from forest to pastures (0.0588) and forest to other covers (0.0540); the probability of conversion from forest to illicit crops was 0.0016. These trends accelerated from 2007–2010 for most transitions. During this later period, the greatest probabilities of transition were again from forest to pastures (0.1178) and to other covers (0.0518), while the probability of conversion to coca remained low at 0.0021 (Figure 4).
Figure 4. Transition matrix from forest to other covers of interest: (a) 2002–2007; (b) 2007–2010.
Forests 06 03828 g004

Model Calibration and Validation

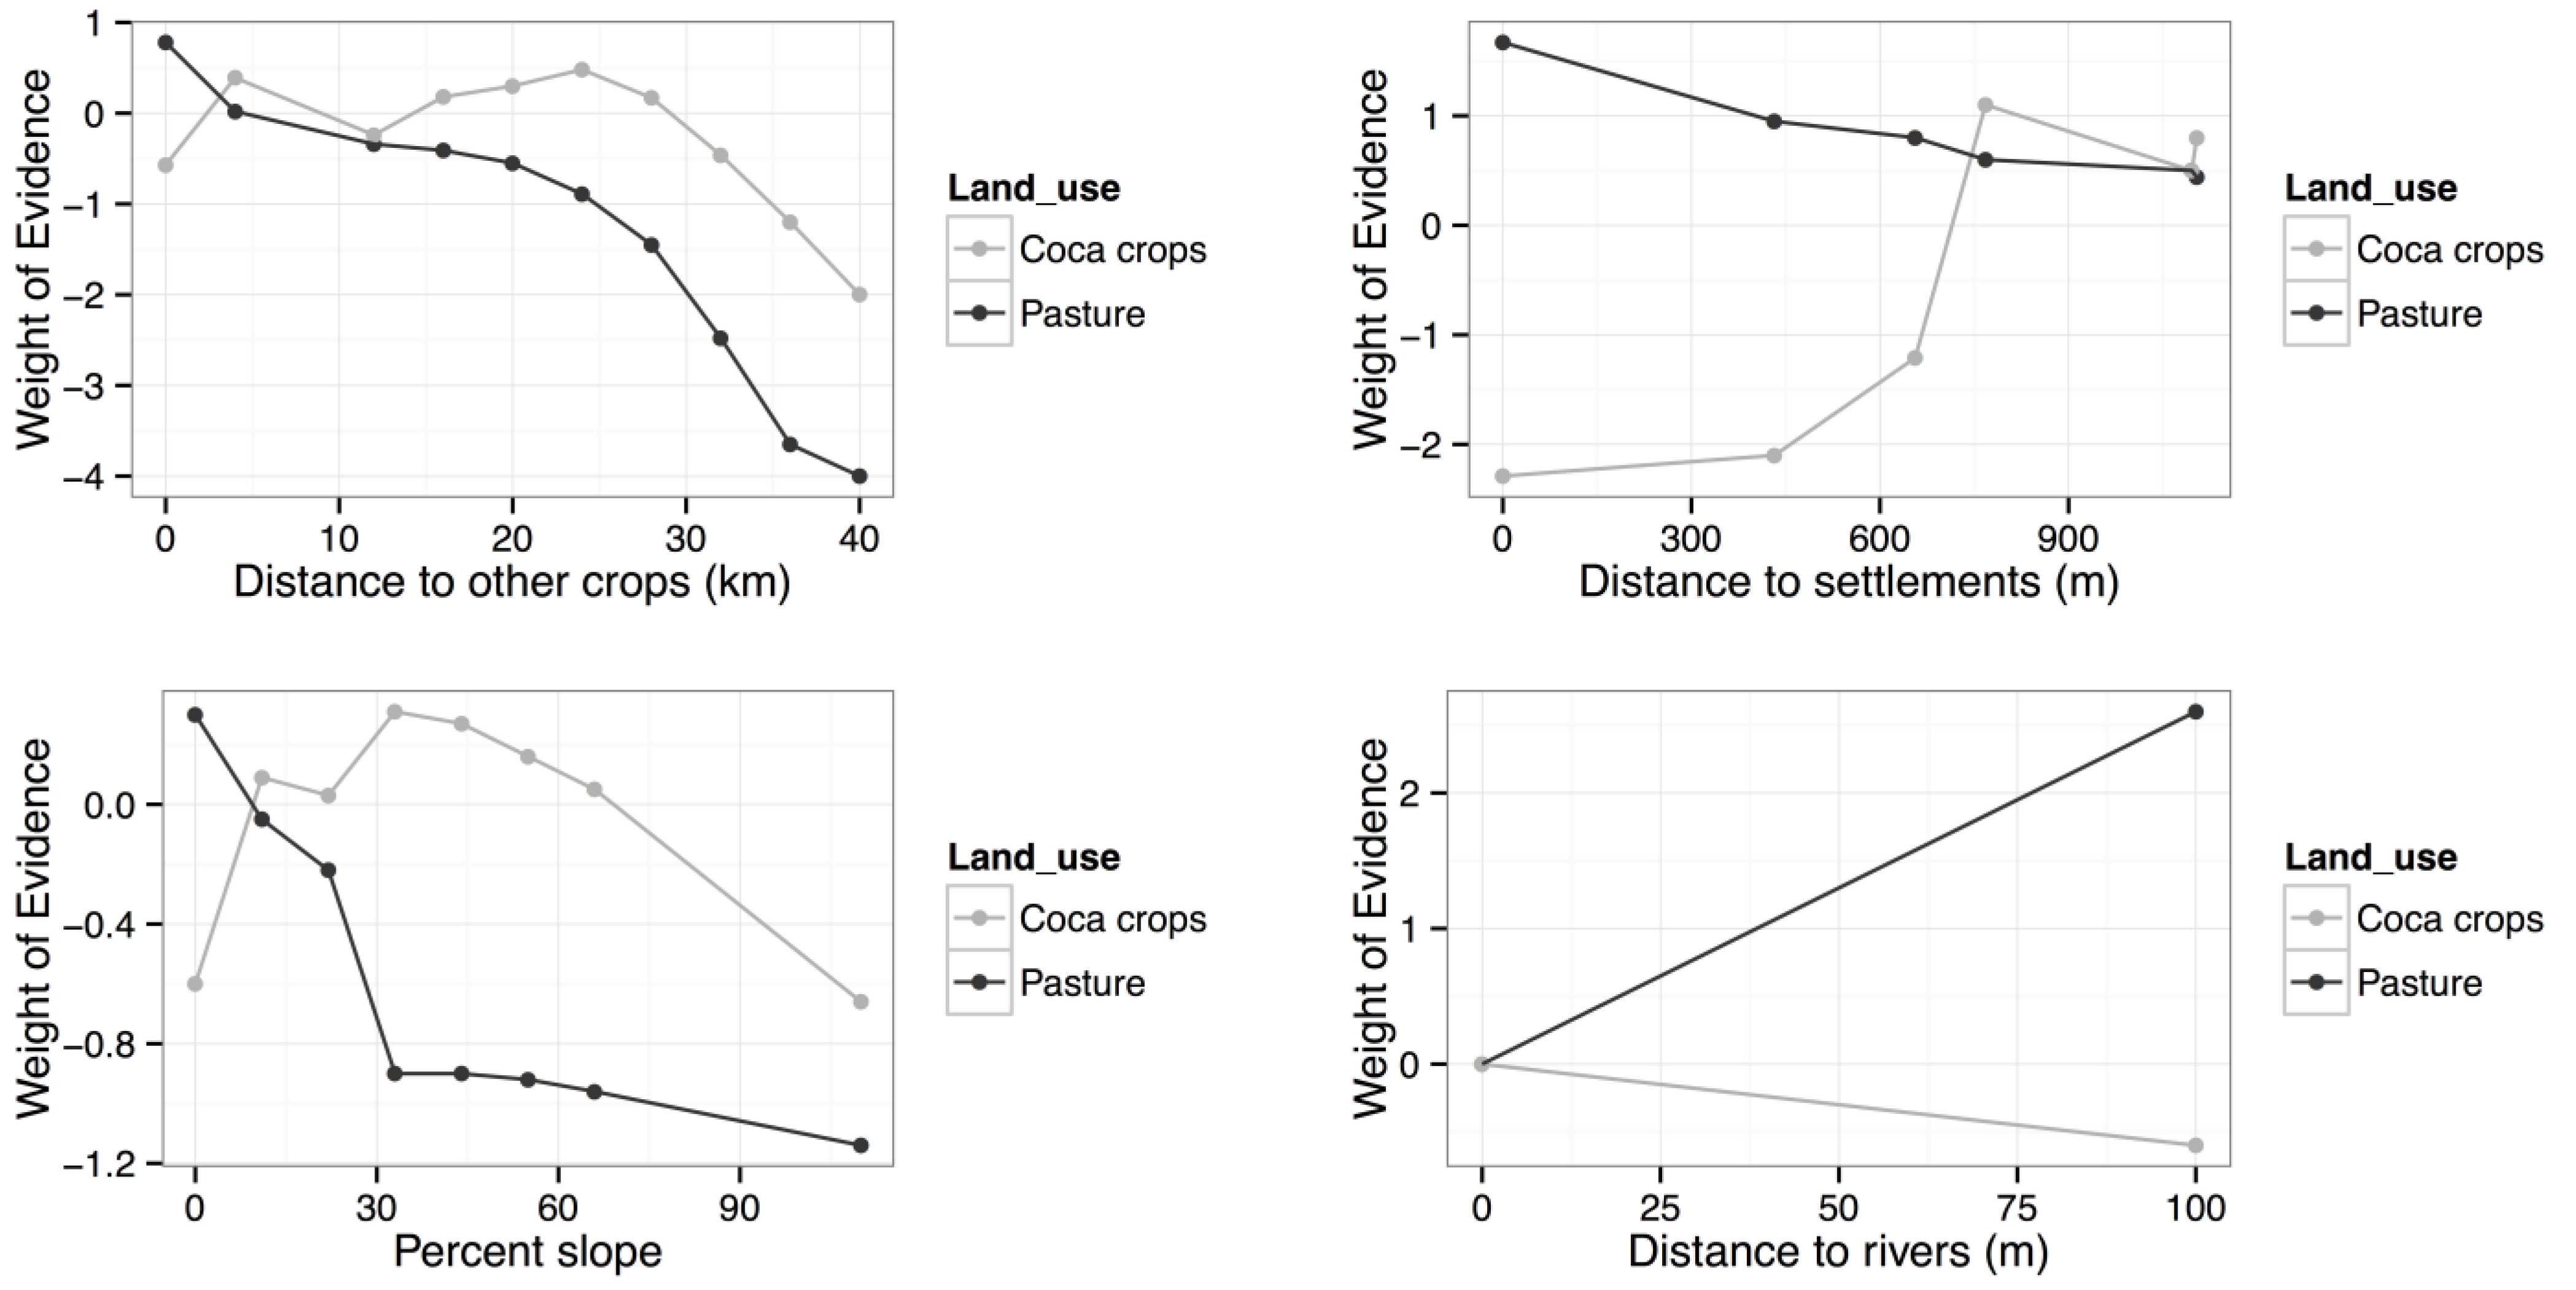
For the three periods, the variable distance to other crops showed little influence on the transition into coca crops. No relationship was found for distance to roads. Distance to rivers had negative weight values (WoE−), indicating higher probability of coca deforestation close to rivers. Distance to other crops strongly influenced the transition of pastures. As the distance to other crops decreased, the probability of forest conversion to pasture increased. Distance to rivers, was positively correlated with forest loss from pastures, with positive weight values (WoE+). Distance to official roads had WoE values close to zero for both periods, this variable was unrelated to deforestation.
Aspect was positively related to transition probabilities from forest to crops or pastures, especially for areas facing north, east, and south. Altitude and slope variables showed positive influence on the transition into coca crops, so that mountainous areas with some slope had greater probability of conversion to coca. Low slope and altitude influenced the transition into pastures, so that the probability of transition to pastures decreased in high and very mountainous areas. As the distance to settlements increased, the probability transition to coca crops increased. In contrast, the probability of transition to pastures increased with decreasing distance to settlements. Figure 5 shows the results of the influence and the WoE of selected variables for the first period (2002–2007).
Figure 5. Influence of selected variables on transitions from forest to coca or pastures for the 2007–2010 period.
Forests 06 03828 g005
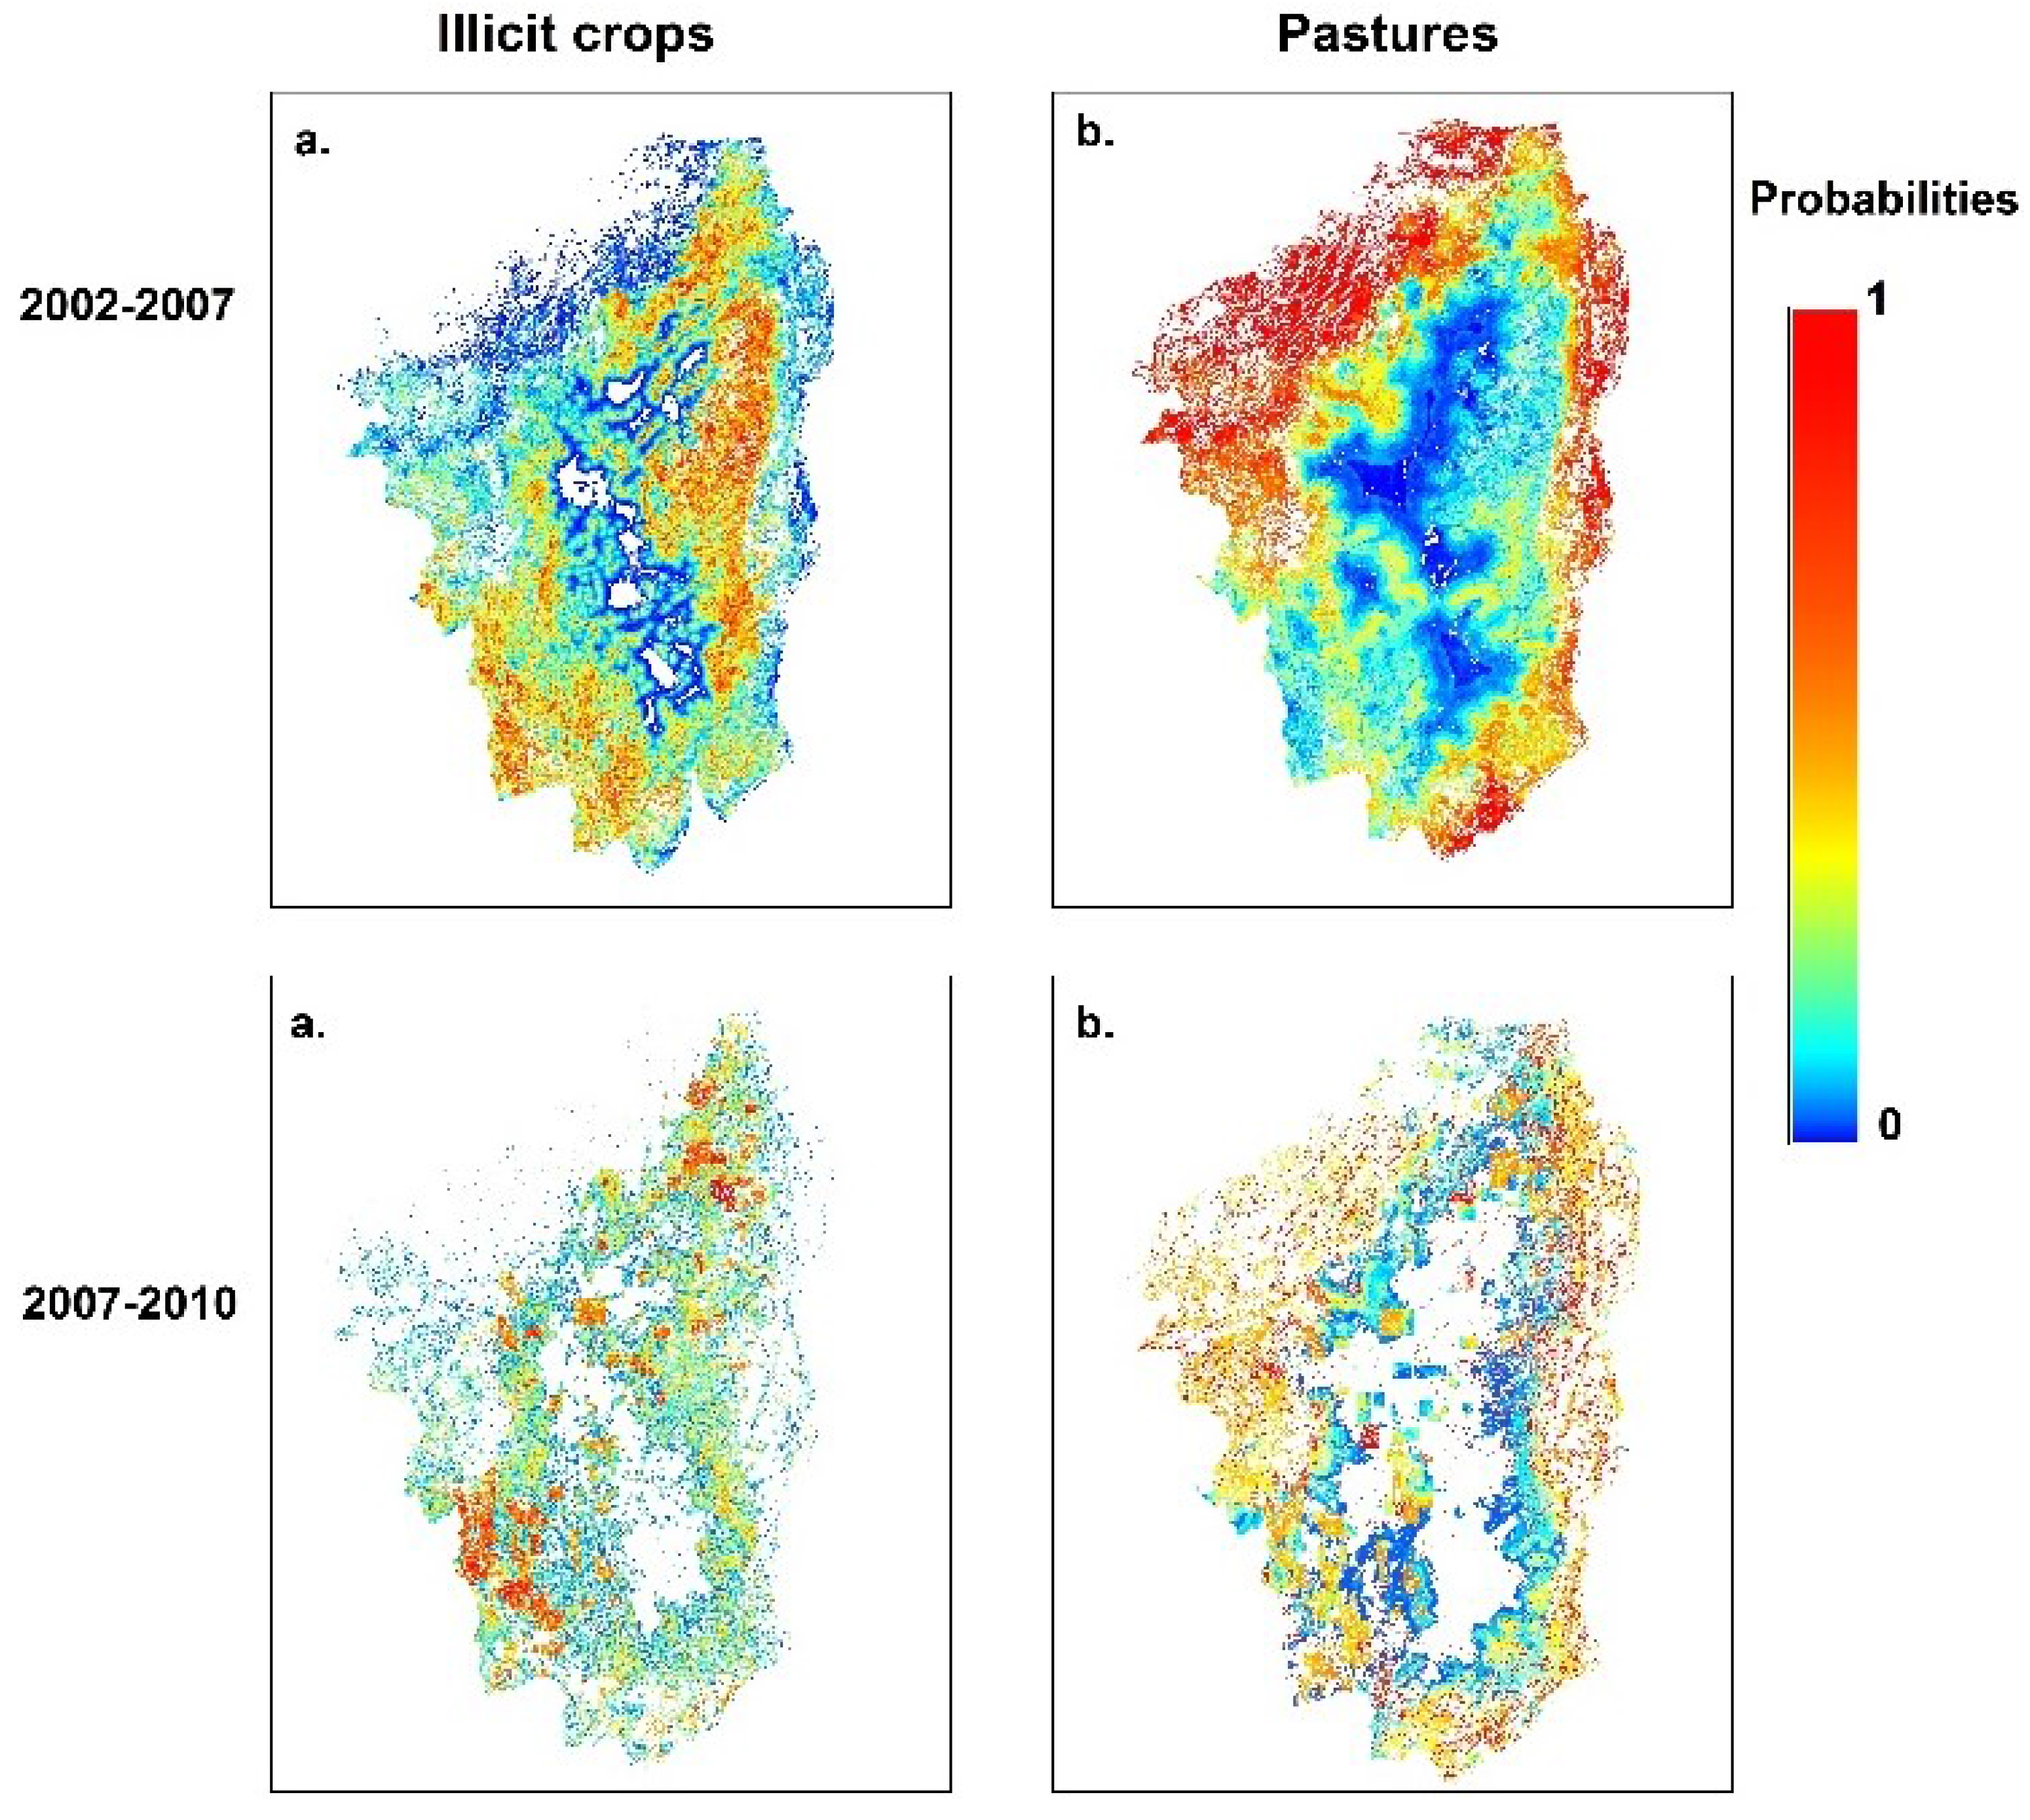
Transition potential maps represent the probability that a particular land cover will be subject to change based on the interaction of the WoE of the variables. Red and yellow indicate higher probabilities of transition, while blue indicates a lower probability (Figure 6). The probabilities of transition for pastures and coca crops have higher values during the first period. The second period showed lower values, with decreased probabilities for both transitions.
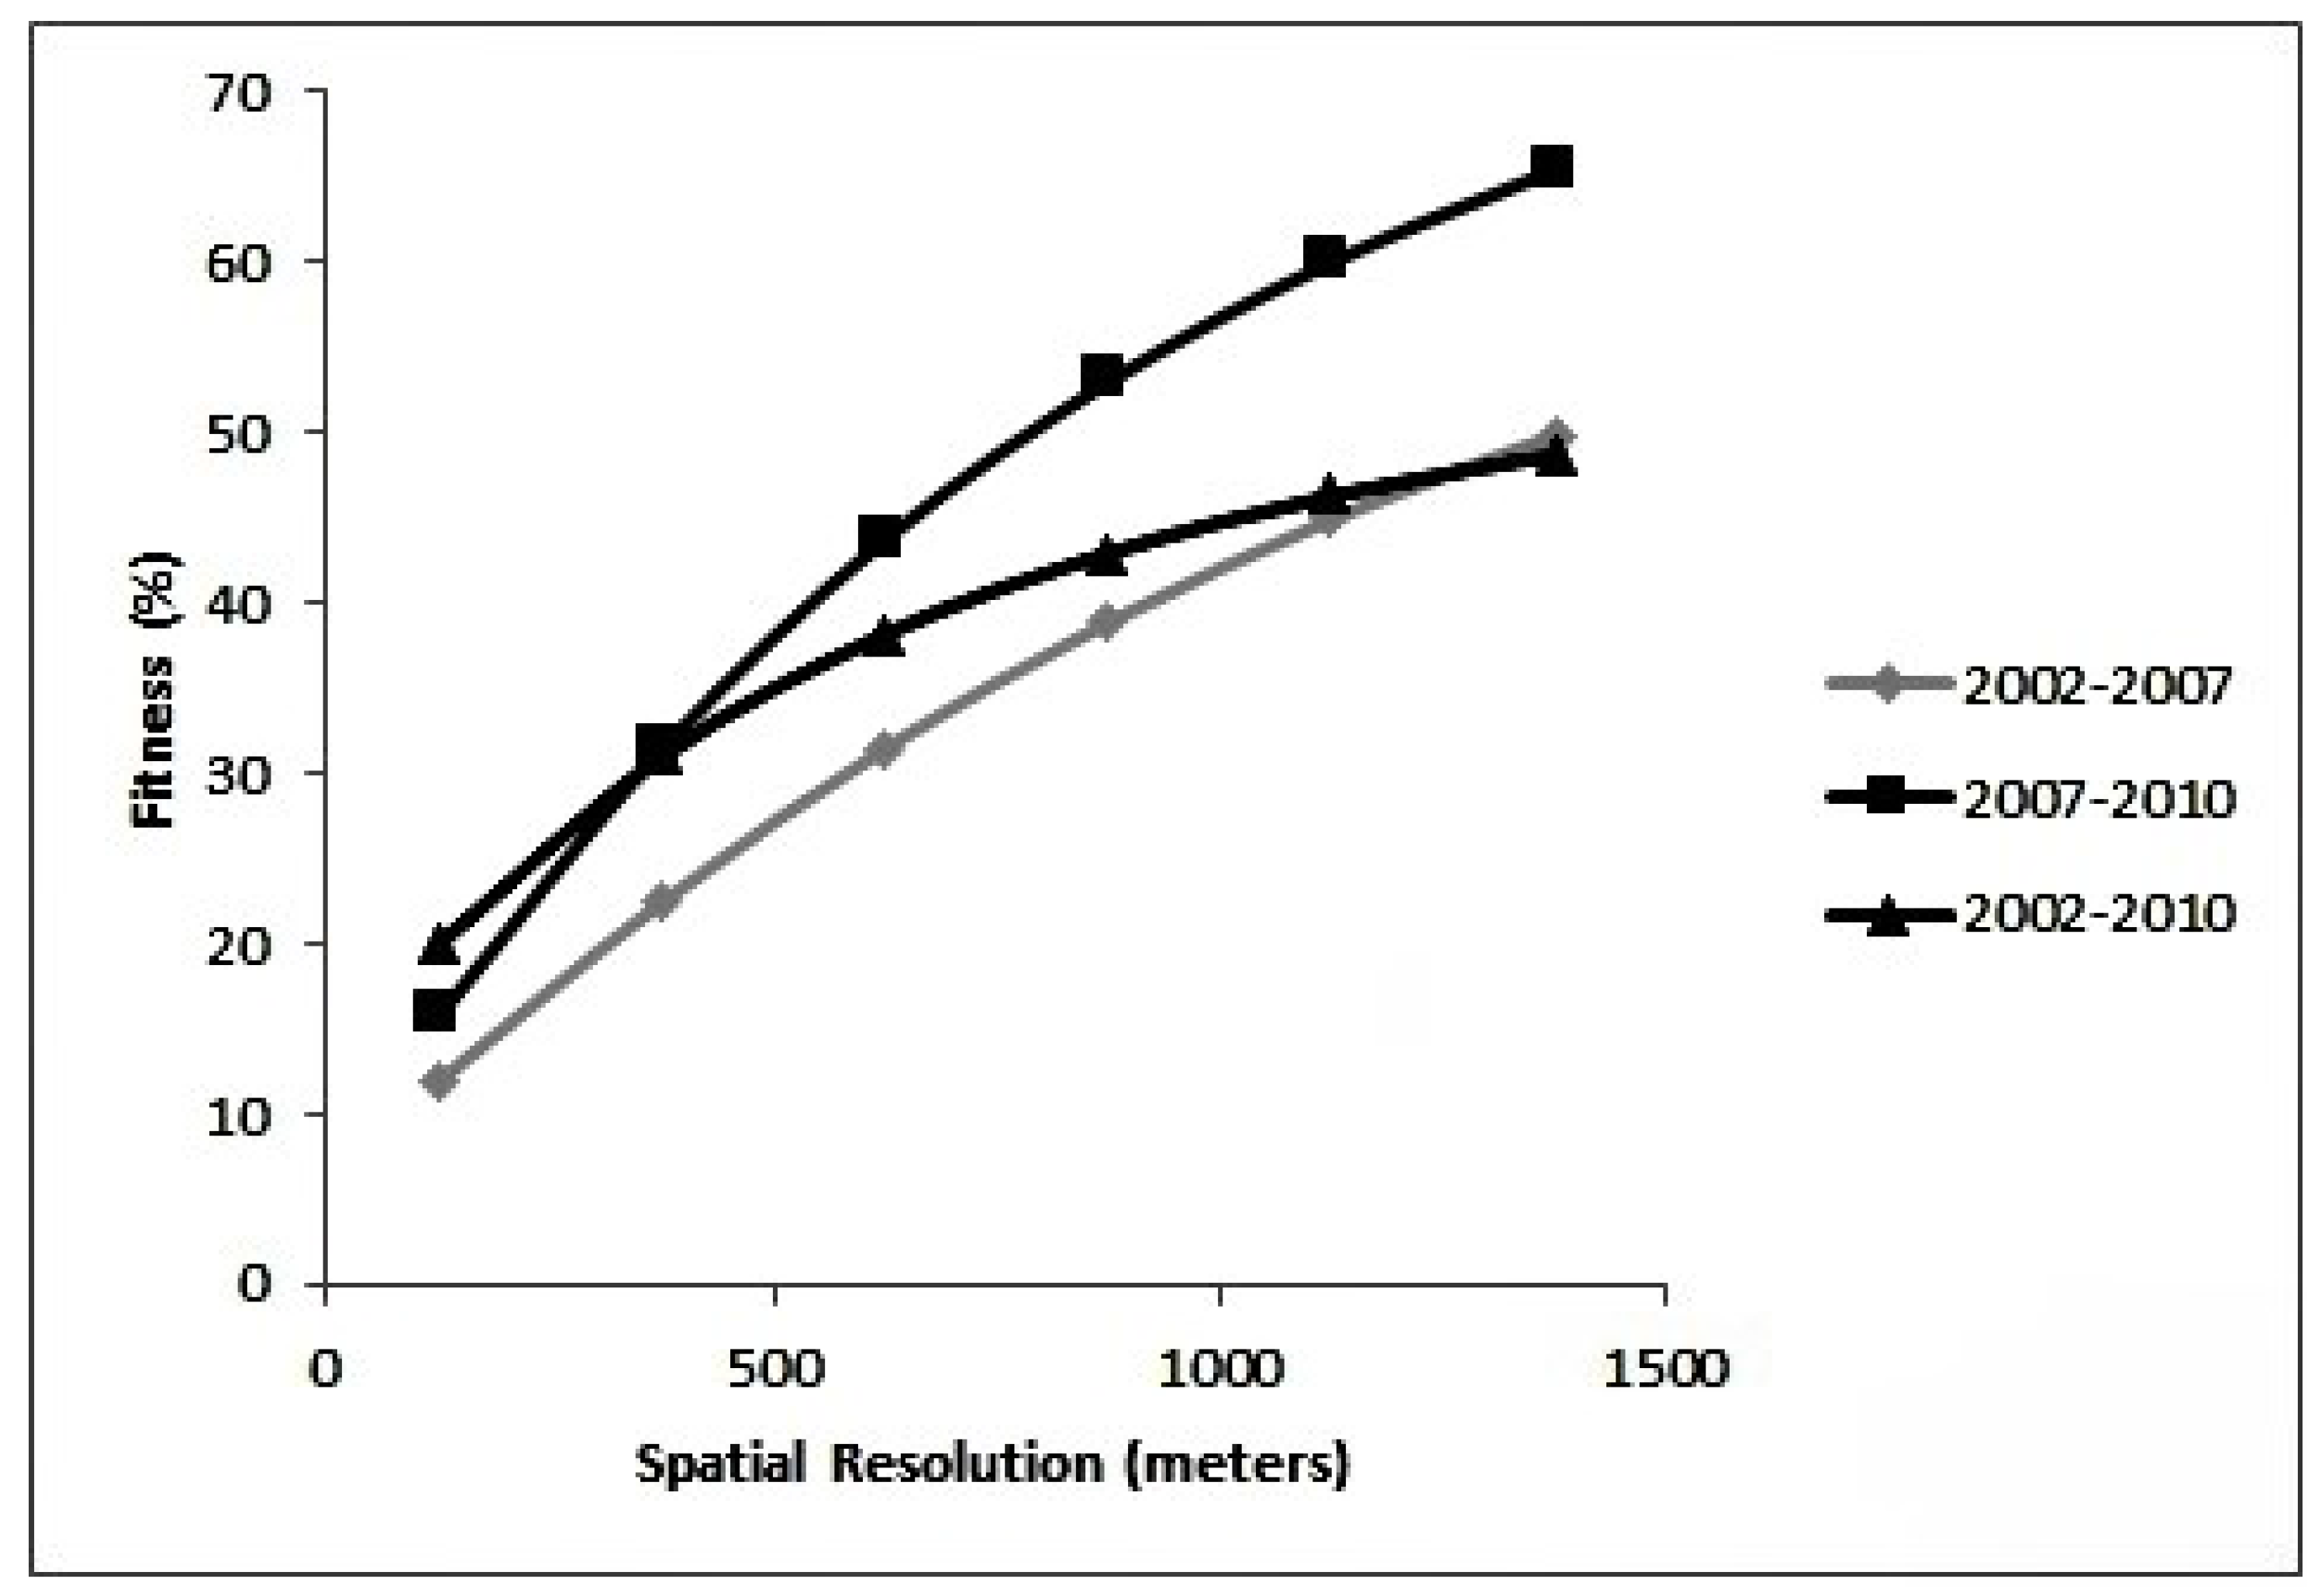
Validation for the 2002–2007 period resulted in fitness values of 11.9% for sampling window sizes of 1 × 1 cells, and 49.8% for windows of 11 × 11 cells. For the second period, fitness values were 15.8% for 1 × 1 windows and 65.4% for 11 × 11 windows. For the third period 2002–2010, fitness values were 20.0% for 1 × 1 windows and 48.7%. The 2002–2007 model showed a fitness value over 20% at a spatial resolution of approximately 500 m, the 2007–2010 model showed a fitness value over 30% at the same resolution and the 2002–2010 model showed a fitness value over 30% as well (Figure 7). Since the validation values were the lowest for the longest period and the variables had similar behaviors for all transitions, our discussion focused on the analysis of the dynamics of change of 2002–2007 and 2007–2010. These shorter windows allowed us to understand in detail the complexity of the dynamic of change.
Figure 6. Potential change maps from forests to illicit crops (a) and pastures; (b) based on the interaction of the different variables.
Forests 06 03828 g006
Figure 7. Model fitness as a function of cell spatial resolution. This allows assessing model fitness for changes at different locations.
Forests 06 03828 g007

5. Discussion

5.1. Model Calibration and Distinct Dynamic

These first quantitative analyses of deforestation in the San Lucas mountain range reveal two distinct sets of dynamics in time. Visual analyses of the differences between maps for each time period highlight the intensity of land use changes. Quantitative analyses of these changes are shown in maps of transition probabilities of interest and transition potential maps (Figure 6). For example, forest areas with high probabilities of change in the 2002–2007 map correspond to the establishment of many anthropic land uses in the 2007–2010 map. Both qualitative and quantitative analyses indicate that forest loss in the 2007–2010 period were greater and more intense than the losses incurred between 2002 and 2007.
In general, the interaction between underlying causes such as land tenure and unsatisfied basic needs generate the conflict between human activities and forests that drives deforestation [12,38,39,40,41,42,43]. In the San Lucas Mountain Range, diverse agents of deforestation are present in an area where armed actors make land tenure insecure, and illicit crops have taken hold. With this background, we focused on two important land uses in Colombia: pastures and coca crops. These land uses are of particular importance because pastures are the end state of many long-term colonization processes, and coca is both a direct agent of deforestation and a catalyst of colonization to new forest sites. The results of these spatially explicit Bayesian analyses highlight the differences in dynamics, extent, and physical determinants and constraints for these two land uses.
Transitions to coca and pasture differed in important ways. Illicit crop eradication policies may promote deforestation in remote areas by forcing growers to relocate their coca to more isolated areas to avoid detection [16,32,42]. This interaction between underlying causes and direct agents, coca growers, results in higher coca deforestation rates in remote medium slope areas, where people may use available land for illicit crops with greater ease [9,12]. Given the illegality of coca and the fact that these crops are associated with armed groups, coca tends to be hidden away in the forest in small plots in ways that reduce the risk of discovery and elimination. Our analyses confirm this, as transitions to coca were less probable in closest proximity to other crops. Slope and aspect play an important role in the agricultural characteristics of coca, because they may affect the production and growth rate of this crop [38]. This is consistent with previous studies [12] that demonstrated that optimal growth of these crops occurs in an altitude range of 0–2200 m.
Distance to rivers is another variable that highlights the differences between transitions from forest to coca or pasture. Being distant from the river decreases the probability of transition to coca, but increases the probability of transition to pasture. This highlights the relationship between access by river and deforestation, where rivers can be used as a transport system by colonists and also can serve as a source of natural resources for the establishment of colonies. This is consistent with other cases in Colombia, particularly in southern parks such as La Macarena, Nukak and Chiribiquete, where proximity to rivers generally promotes deforestation [43,44,45].
In contrast to coca dynamics, transitions to pasture are more probable at lower distance to other crops. These agents of deforestation prefer level land at lower altitude [11,12,46]. The conversion of forests to pastures and the establishment of cattle are closely linked, first as a means to generate revenue [47], and second as a way of claiming tenure. Clearing the forest establishes priority for claims to the land and is a prerequisite for land tenure. Cattle strengthen land claims and can be a source of credit in addition to direct revenue from trading. Finding that proximity to other crops increases the probability of conversion to pasture reinforces the establishment and expansion of the colonization frontier as an ongoing dynamic that has not stabilized [34,43].
The factor that best exemplifies the difference between forest loss to coca and loss to pasture is the distance to settlements. Settlements facilitate the expansion of the agricultural and colonization frontier through agriculture for pastures or legal crops, and enhance property values, increasing land claims. In contrast, settlements make coca easier to spot, and easier to eradicate by the government. We believe migration into the region is increasing local population density, as well as generating more land claims across affected municipalities. The boom of activities such as gold mining may cause this migration process, placing more pressure on the forest [11,14]. There are no migration or land claim data that allow us to test this hypothesis. We anticipate that field work and a validation process with the local agents of deforestation are necessary to evaluate the underlying causes that generate forest loss in the San Lucas mountain range [48,49].
Although we expected to find a relationship between deforestation and distance to roads, official, government-sanctioned roads were unrelated to forest conversion in San Lucas. This differs from several other studies [40,43,47,50]. This key difference may be explained by the quality of the data available for this variable. The official road map included only 2592.25 kilometers of primary roads, and not the locally-developed roads and trails that dominate the region. Data on new roads such as tertiary roads, and unpaved trails are needed. These small roads are decades old, and may influence forest conversion in ways that could not be modeled in our analyses. High-resolution data are necessary to discover these roads and uncover the relationship between distance to roads and trails, and deforestation.

5.2. Model Validation and Future Improvements

We used a multiple-resolution method to validate the model using a sampling window of different sizes, moving over the image, and calculating the average fit between the real and simulated scene. This allows a comparative analysis between the absolute number of pixels that belong to the same class on both scenes given a specific window [28]. Using this approach, the model for 2007–2010 was better than the 2002–2007 model. This may be because during the first period much of these activities were starting, and much of the expansion of the agricultural frontier was just beginning. The second period showed the consolidation of several of those processes, in which the relationship among the studied variables and deforestation was clearer and stronger. The time window for each model may also affect the results, so that the shorter period more adequately captures forest loss dynamics than the five-year period. The longer period may mask forest loss and some early regrowth, while the three-year period is focused completely on loss.
The calibration and validation results are lower in our analyses than in other studies [31,32,51]. This may be explained by, among others, the quality of variables and their resolution, the lack of spatial information for variables related with underlying causes, and the percentage of gaps and clouds that increases uncertainty of the covers. Despite the relatively low performance of the models, previous research shows the WoE estimates are robust to low-performing overall models [52,53,54]. Future comparisons with different methods such as the ROC (the receiver operating characteristic, an analysis widely applied to assess the performance of spatial models) may illuminate the regions of parameter space in which the models presented here underperform. Previous analyses, however, have shown that the WoE can be validated using methods with a variety of mathematical foundations [54], and is relatively robust as an estimate of covariate influence.
The aim of the validation procedure is to approximate groups of neighboring cells at different spatial resolutions [18,19,28,55]. The poor validation values for the 2002–2007 model may be related to the beginning of the expansion of the colonization frontier that does not show a clear spatial pattern yet, in the latter period those patterns were established and it became easier for the model to recognize them, increasing accuracy. As discussed before, critical data on small roads and trails are missing, as are important underlying causes including data on migration and land claims. Once these variables become available, additional models may more fully explain the land use conversions on the San Lucas mountain range.
Cultivation of illicit crops is both a direct and indirect cause of deforestation in Colombia [56]. In San Lucas, coca cultivation is strongly associated with armed conflict. Even if the region encompasses suboptimal areas for the cultivation of coca, armed groups collect income from illicit crops and develop illegal trade networks [11,12,38,44,45,57]. As a result, some researchers suggest that the presence of armed groups is another variable that should be considered when simulating deforestation [42]. More variables that better explain the transition from forest to coca crops, such as those related to armed conflict, violence, political development, and eradication, could improve the deforestation model and its fitness [39,40]. Finally, the quality of the information used is an important issue to consider, as this can affect both the calibration and validation of the models. Future improvements to the models introduced here may include developing additional cover classes, reducing gaps in the data, and increasing the number of explanatory variables used to capture additional direct causes of forest loss.

6. Conclusions

This first spatially explicit Bayesian analysis exercise for the San Lucas Mountain Range has revealed an increasing pace of regional deforestation, and distinct dynamics for the conversion of forest into two alternate land uses: coca cultivation and pastures. Conversion of forest to coca cultivation was associated with greater distance to other crops and to settlements. In contrast, conversion to pastures was more probable immediately beside other crops and in proximity settlements. Compared to findings for the 2002–2007 period, the rate of forest conversion to pasture doubled in the 2007–2010 period, highlighting the accelerating pace of forest loss and rapid, unplanned expansion of the agricultural frontier. The land cover maps and analyses introduced here can inform future monitoring of deforestation hotspots, as well as further analyses of the underlying and direct causes of deforestation in the region.

Acknowledgments

To the National University of Colombia, for all the resources offered; to Leonardo Correa, Orlando González and Sandra Rodriguez from SIMCI for providing access to the maps and technical help; to the jurors of the master’s thesis of this work, Cesar Valdes and Alberto Boada and to two anonymous reviewers for their comments that improved this manuscript. This work was supported by the CYTED network IBEROREDD + under Grant P411RT0559; “Convocatoria nacional apoyo para el fortalecimiento de grupos de investigación o creación artística que soporten programas de posgrado de la Universidad Nacional de Colombia-2012”; and “Convocatoria del programa nacional de internacionalización del conocimiento 2013–2015” posgrado de la Universidad Nacional de Colombia.

Author Contributions

Maria Alejandra Chadid ran all models. Dolors Armenteras, Maria Alejandra Chadid and Liliana M. Dávalos designed the study. Dolors Armenteras and Maria Alejandra Chadid collected data. Dolors Armenteras, Maria Alejandra Chadid and Liliana M. Dávalos wrote the manuscript. All authors interpreted data and contributed to revisions of the paper.

Conflicts of Interest

The authors declare no conflict of interest.

References

  1. Wright, S.J. Tropical forests in a changing environment. Trends Ecol. Evol. 2005, 20, 553–560. [Google Scholar] [PubMed]
  2. Arroyo-Rodríguez, V.; Mandujano, S. The importance of tropical rain forest fragments to the conservation of plant species diversity in Los Tuxtlas, Mexico. Biodivers. Conserv. 2006, 15, 4159–4179. [Google Scholar] [CrossRef]
  3. Díaz, S.; Tilman, D.; Fargione, J.; Chapin, F.S.; Dirzo, R.; Kitzberger, T.; Gemmill, B.; Zobel, M.; Vilá, M.; Mitchell, C.; et al. Biodiversity regulation of ecosystem services. In Ecosystems and Human Well-Being: Current State and Trends; Island Press: Washington, DC, USA, 2005; pp. 297–329. [Google Scholar]
  4. Hansen, M.C.; Potapov, P.V.; Moore, R.; Hancher, M.; Turubanova, S.A.; Tyukavina, A.; Thau, D.; Stehman, S.V.; Goetz, S.J.; Loveland, T.R.; et al. High-resolution global maps of 21st-century forest cover change. Science 2013, 342, 850–853. [Google Scholar] [CrossRef] [PubMed]
  5. Rudel, T.K. Changing agents of deforestation: From state-initiated to enterprise driven processes, 1970–2000. Land Use Policy 2007, 24, 35–41. [Google Scholar] [CrossRef]
  6. Geist, H.J.; Lambin, E.F. What Dirves Tropical Deforestation? A Meta-Analysis of Proximate and Underlying Causes of Deforestation Based on Subnational Case Study Evidence; International Human Dimensions Programme on Global Environ.: Louvain, Belgium, 2001. [Google Scholar]
  7. Geist, H.J. Lambin proximate causes and underlying driving forces of tropical deforestation. Bioscience 2002, 52, 8. [Google Scholar] [CrossRef]
  8. Rudel, T.K. Shrinking tropical forests, human agents of change, and conservation policy. Conserv. Biol. 2006, 20, 1604–1609. [Google Scholar] [CrossRef] [PubMed]
  9. Armenteras Pascual, D.; Villa García, C.M. Deforestación y Fragmentación de Ecosistemas Naturales en el Escudo Guayanés Colombiano; Grey Comercializadora Ltda: Bogotá, Colombia, 2006. [Google Scholar]
  10. Foley, J.A.; Defries, R.; Asner, G.P.; Barford, C.; Bonan, G.; Carpenter, S.R.; Chapin, F.S.; Coe, M.T.; Daily, G.C.; Gibbs, H.K.; et al. Global consequences of land use. Science 2005, 309, 570–574. [Google Scholar] [CrossRef] [PubMed]
  11. Armenteras, D.; Rodríguez, N.; Retana, J.; Morales, M. Understanding deforestation in montane and lowland forests of the Colombian Andes. Reg. Environ. Chang. 2011, 11, 693–705. [Google Scholar] [CrossRef]
  12. Armenteras, D.; Cabrera, E.; Rodríguez, N.; Retana, J. National and regional determinants of tropical deforestation in Colombia. Reg. Environ. Chang. 2013, 13, 1181–1193. [Google Scholar] [CrossRef]
  13. Salaman, P.; Donegan, T.; Cuervo, A. New distributional bird records from Serrania de San Lucas and adjacent central cordillera of colombia. Br. Ornithol. Club 2002, 122, 285–303. [Google Scholar]
  14. Dávalos, L.M. The San Lucas mountain range in Colombia : How much conservation is owed to the violence ? Biodivers. Conserv. 2001, 10, 69–78. [Google Scholar] [CrossRef]
  15. Salaman, P.; Donegan, T.; Gonzalez, C.; Bustos, X.; Cuervo, A. Presenting the first biological assessment of Serranía San Lucas.; Colombian EBA Project Report Series No. 3; Fundación ProAves: Bogotá, Colombia, 2001. [Google Scholar]
  16. Fundacion Colibri Evaluación ecológica rápida de la Serranía de San Lucas. Available online: http://www.thc-fc.org/PDF/SerraniaSanLucas.pdf (accessed on 15 Mar 2013).
  17. Álvarez, M.D. Forests in the Time of Violence. J. Sustain. For. 2003, 16, 47–68. [Google Scholar] [CrossRef]
  18. Kolb, M. Dinámica del uso del Suelo y Cambio Climático en la Planeación Sistemática Para la Conservación: un caso de Estudio en la Cuenca Grijalva-Usumacinta; Universidad Nacional Autónoma de México: México, DF, México, 2013. [Google Scholar]
  19. Soares Filho, B.S.; Rodrigues, H.O.; Costa, W.L. Modeling Environmental Dynamics with Dinamica EGO; Centro de Sensoriamento Remoto. Universidade Federal de Minas Gerais: Belo Hotizonte, Brazil, 2009. [Google Scholar]
  20. Departamento Administrativo Nacional de Estadística Sistema de Consulta Información Censal; DANE: Bogotá, Colombia, 2005. Available online: http://systema59.dane.gov.co/cgibin/RpWebEngine.exe/PortalAction?&MODE=MAIN&BASE=CG2005BASICO&MAIN=WebServerMain.inl (accessed on 15 September 2015).
  21. Rodriguez, N.; Armenteras, D.; Morales, M.; Romero, M. Ecosistemas de los Andes Colombianos; Segunda.; Instituto de Investigación de Recursos Biológicos Alexander von Humboldt: Bogotá, DC, Colombia, 2006. [Google Scholar]
  22. UNODC. Análisis Multitemporal de Cultivos de Coca Periodo 2001–2006; Oficina de las Naciones Unidas contra la droga y el delito: Bogotá, DC, Colombia, 2008. [Google Scholar]
  23. SIMCI II-UNODC Norma Técnica de Metadatos. Available online: http://www.biesimci.org/Satelital/Original/Landsat/indices/B071L11-S009055E006.html (accessed on 1 January 2015).
  24. UNODC. Monitoreo de Cultivos de Coca 2010; Oficina de las Naciones Unidas contra la droga y el delito: Bogotá, DC, Colombia, 2011. [Google Scholar]
  25. UNODC. Monitoreo de Cultivos de Coca 2014; Oficina de las Naciones Unidas contra la droga y el delito: Bogotá, DC, Colombia, 2015. [Google Scholar]
  26. Soares-Filho, B.S.; Coutinho Cerqueira, G.; Lopes Pennachin, C. Dinamica—A stochastic cellular automata model designed to simulate the landscape dynamics in an Amazonian colonization frontier. Ecol. Modell. 2002, 154, 217–235. [Google Scholar] [CrossRef]
  27. Hosseinali, F.; Alesheikh, A.A. Weighting Spatial Information in GIS for Copper Mining Exploration. Am. J. Appl. Sci. 2008, 5, 1187–1198. [Google Scholar] [CrossRef]
  28. De Almeida, C.M.; Vieira Monteiro, A.M.; Câmara, G.; Soares-Filho, B.S.; Coutinho Cerqueira, G.; Lopes Pennachin, C.; Batty, M. GIS and remote sensing as tools for the simulation of urban land-use change. Int. J. Remote Sens. 2005, 26, 759–774. [Google Scholar] [CrossRef]
  29. Yanai, A.M.; Fearnside, P.M.; de Alencastro Graça, P.M.L.; Nogueira, E.M. Avoided deforestation in Brazilian Amazonia: Simulating the effect of the Juma Sustainable Development Reserve. For. Ecol. Manag. 2012, 282, 78–91. [Google Scholar] [CrossRef]
  30. Ferreira, M.E.; Ferreira, L.G.; Miziara, F.; Soares-Filho, B.S. Modeling landscape dynamics in the central Brazilian savanna biome: Future scenarios and perspectives for conservation. J. Land Use Sci. 2013, 8, 403–421. [Google Scholar] [CrossRef]
  31. Maeda, E.E.; de Almeida, C.M.; de Carvalho Ximenes, A.; Formaggio, A.R.; Shimabukuro, Y.E.; Pellikka, P. Dynamic modeling of forest conversion: Simulation of past and future scenarios of rural activities expansion in the fringes of the Xingu National Park, Brazilian Amazon. Int. J. Appl. Earth Obs. Geoinf. 2011, 13, 435–446. [Google Scholar] [CrossRef]
  32. Maeda, E.E.; Clark, B.J.F.; Pellikka, P.; Siljander, M. Modelling agricultural expansion in Kenya’s Eastern Arc Mountains biodiversity hotspot. Agric. Syst. 2010, 103, 609–620. [Google Scholar] [CrossRef]
  33. Kamusoko, C.; Wada, Y.; Furuya, T.; Tomimura, S.; Nasu, M.; Homsysavath, K. Simulating Future Forest Cover Changes in Pakxeng District, Lao People’s Democratic Republic (PDR): Implications for Sustainable Forest Management. Land 2013, 2, 1–19. [Google Scholar] [CrossRef]
  34. Lanly, J. Los Factores de la Deforestación y de la Degradación de los Bosques; XII Congreso Forestal Mundial: Quebéc, City, 2003; p. 10. [Google Scholar]
  35. Mas, J.; Kolb, M.; Houet, T.; Paegelow, M.; Camacho Olmeda, M.T. Éclairer le choix des outils de simulation des changements des modes d’occupation et d’usages des sols. Une approche comparative. Rev. Int. Géomatique 2011, 21, 405–430. [Google Scholar] [CrossRef] [Green Version]
  36. Van Westen, C.J. Use of Weights of Evidence Modeling for Landslide Susceptibility Mapping; International Institute for Geoinformation Science and Earth Observation: Enschede, The Netherlands, 2002. [Google Scholar]
  37. De Maria Almeida, C.; Batty, M.; Vieira Monteiro, A.M.; Câmara, G.; Soares-Filho, B.S.; Cerqueira, G.C.; Pennachin, C.L. Stochastic cellular automata modeling of urban land use dynamics: empirical development and estimation. Comput. Environ. Urban Syst. 2003, 27, 481–509. [Google Scholar] [CrossRef]
  38. Dávalos, L.M.; Bejarano, A.C.; Hall, M.A.; Correa, H.L.; Corthals, A.; Espejo, O.J. Forests and drugs: Coca-driven deforestation in tropical biodiversity hotspots. Environ. Sci. Technol. 2011, 45, 1219–1227. [Google Scholar] [CrossRef] [PubMed]
  39. Dávalos, L.M.; Holmes, J.S.; Rodríguez, N.; Armenteras, D. Demand for beef is unrelated to pasture expansion in northwestern Amazonia. Biol. Conserv. 2014, 170, 64–73. [Google Scholar] [CrossRef]
  40. Andrade, G.I. Selvas sin Ley. Conflicto, drogas y globalización de la deforestación de Colombia. In Guerra, Sociedad y Medio Ambiente; Fescol: Bogotá, DC, Colombia, 2004; pp. 107–173. [Google Scholar]
  41. García Romero, H. Deforestación en Colombia : Retos y perspectivas; Fededesarrollo: Bogotá, DC, Colombia, 2014. [Google Scholar]
  42. Sabogal, A. Levantamiento de una Línea de Base Sobre Minería Ilegal de oro en Colombia; Fededesarrollo: Bogotá D.C., Colombia, 2012. [Google Scholar]
  43. Barber, C.P.; Cochrane, M.A.; Souza, C.M.; Laurance, W.F. Roads, deforestation, and the mitigating effect of protected areas in the Amazon. Biol. Conserv. 2014, 177, 203–209. [Google Scholar] [CrossRef]
  44. UNODC. Monitoreo de Cultivos de coca 2012; Oficina de las Naciones Unidas contra la droga y el delito: Bogotá, DC, Colombia, 2013. [Google Scholar]
  45. Armenteras, D.; Rudas, G.; Rodriguez, N.; Sua, S.; Romero, M. Patterns and causes of deforestation in the Colombian Amazon. Ecol. Indic. 2006, 6, 353–368. [Google Scholar] [CrossRef]
  46. Mas, J. Modelling deforestation using GIS and artificial neural networks. Environ. Model. Softw. 2004, 19, 461–471. [Google Scholar] [CrossRef]
  47. Mahecha, L.; Gallego, L.A.; Peláez, F.J. Situación actual de la ganadería de carne en Colombia y alternativas para impulsar su competitividad y sostenibilidad. Rev. Colomb. Ciencias Pecu. 2002, 15, 213–225. [Google Scholar]
  48. Redo, D.J.; Aide, T.M.; Clark, M.L. The relative importance of socioeconomic and environmental variables in explaining land change in Bolivia, 2001–2010. Ann. Assoc. Am. Geogr. 2012, 102, 778–807. [Google Scholar] [CrossRef]
  49. Moreira, E.; Costa, S.; Aguiar, A.P.; Câmara, G.; Carneiro, T. Dynamical coupling of multiscale land change models. Landsc. Ecol. 2009, 24, 1183–1194. [Google Scholar] [CrossRef]
  50. De Luca, G.D. Roads, Development and Deforestation: A Review; Development Research Group, World Bank: Washington, DC, USA, 2007. [Google Scholar]
  51. Mas, J.-F.; Kolb, M.; Paegelow, M.; Camacho Olmedo, M.T.; Houet, T. Inductive pattern-based land use/cover change models: A comparison of four software packages. Environ. Model. Softw. 2014, 51, 94–111. [Google Scholar] [CrossRef] [Green Version]
  52. Vieilledent, G.; Grinand, C.; Vaudry, R. Forecasting deforestation and carbon emissions in tropical developing countries facing demographic expansion: A case study in Madagascar. Ecol. Evol. 2013, 3, 1702–1716. [Google Scholar] [CrossRef] [PubMed] [Green Version]
  53. Kolb, M.; Mas, J.-F.; Galicia, L. Evaluating drivers of land-use change and transition potential models in a complex landscape in Southern Mexico. Int. J. Geogr. Inf. Sci. 2013, 27, 1804–1827. [Google Scholar] [CrossRef]
  54. Malek, Ž.; Boerboom, L.; Glade, T. Future Forest Cover Change Scenarios with Implications for Landslide Risk: An Example from Buzau Subcarpathians, Romania. Environ. Manag. 2015, 56, 1228–1243. [Google Scholar] [CrossRef]
  55. Soares-Filho, B.; Alencar, A.; Nepstad, D.; Cerqueira, G.; Vera Diaz, M.D.C.; Rivero, S.; Solorzano, L.; Voll, E. Simulating the response of land-cover changes to road paving and governance along a major Amazon highway: The Santarem-Cuiaba corridor. Glob. Chang. Biol. 2004, 10, 745–764. [Google Scholar] [CrossRef]
  56. UNODC. Cultivos de Coca: Estadísticas Municipales Censo 31 de Diciembre de 2012; Oficina de las Naciones Unidas contra la droga y el delito: Bogotá, DC, Colombia, 2013. [Google Scholar]
  57. Rincón Ruiz, A.; Pascual, U.; Romero, M. An exploratory spatial analysis of illegal coca cultivation in Colombia using local indicators of spatial association and socioecological variables. Ecol. Indic. 2013, 34, 103–112. [Google Scholar] [CrossRef]