Abstract
Surface lignite coal mines in east Texas are commonly reforested using loblolly pine (Pinus taeda L.) following mining and reclamation activities. Due to the nature of such an extreme disturbance, altered growth patterns, growth rates, and productivity could be expected. We destructively sampled above- and belowground tissue to develop prediction equations specific to these sites. These prediction equations differed statistically from those found in the literature regarding unmined land. At the stand level, biomass and volume productivity appeared similar with young stands on reclaimed mineland performing slightly poorer than similarly managed unmined sites. Allometric partitioning of above- and belowground biomass differed statistically from the unmined allometric model previously studied. The allometric pattern on reclaimed mineland indicated greater partitioning of biomass belowground for young stands of low quadratic mean diameter relative to unmined stands. Older stands on reclaimed mineland exhibited no allometric partitioning differences from unmined stands, indicating the normal allometric pattern is resumed for stands greater than 10 years of age.
1. Introduction
Strip mining is a large scale disturbance which disrupts virtually all existing characteristics of the site [1,2]. As such, there is potential for drastically altered growth and partitioning patterns for timber stands grown on these reclaimed minelands. Few studies have specifically investigated these relationships, although carbon (C) storage in soil and biomass have been studied [3,4,5,6]. Much of this research depends on biomass prediction models developed for unmined land which could therefore be subject to error [7,8].
Although lasting negative effects from mining can occur in some regions under certain types of mining, such as mountaintop removal in the Appalachian Mountains [9,10,11], research in east Texas has generally found no lasting negative effects for soil and water quality [12,13,14,15,16]. This may be due in part to the fact that the topography is relatively level on the upper Coastal Plain, and the parent materials are less rocky than in other regions. Lignite strip-mining occurs throughout Texas and follows multiple phases of reclamation which must meet standards specified by the Railroad Commission of Texas (RCT). These phases include restoring the topography, hydrologic functions, and growth capabilities on the mine site. Reclamation of topography requires that the approximate original contour be restored, which is accomplished not by replacing the terrain in any specific location, but rather creating a post-mining landscape that mimics the distributions of different slope gradients that were found pre-mining. The final phase is deemed complete when vegetative productivity is restored, with a minimum of five years at the required levels. Loblolly pine (Pinus taeda L.) plantations are commonly used in forestry post-mining land use [17]. Differences in tree growth on reclaimed minelands in east Texas have previously been documented [18,19]. However, site index (a site quality estimate using height at an index age for comparison) following mining in east Texas was not significantly different from site index prior to mining; although some model parameters (e.g., height–age curve shape) were significantly different [20].
Allometric relationships which do not differ between various edaphic conditions or silvicultural treatments are termed ontogenetic. In other words, trees of a given size tend to have similar partitioning patterns regardless of age. Multiple studies have found ontogeny, synonymous with development, is the primary factor influencing changes in partitioning in loblolly pine [21,22,23]. The ratio of belowground to aboveground biomass is one commonly studied allometric relationship. Most studies have found the root-shoot ratio in loblolly is highly ontogenetic, especially for long-term data on different resource gradients [24,25,26]. Coyle, et al. [25] has provided a composite of the literature concerning loblolly root-shoot allometry. In their paper, Coyle, et al. [25] displayed log transformed biomass data on a per hectare basis with a strong linear relationship (R2 = 0.9833) between root and shoot fractions. Albaugh, et al. [27] found a similar linear relationship without transformation between coarse root biomass and stem biomass in the SETRES study. Therefore, differences in root-shoot allometry for loblolly pine appear to be primarily under ontogenetic control, and do not directly vary as a result of resource availability. Given the differences in growth patterns of loblolly pine on reclaimed mineland, biomass partitioning could also differ from unmined sites in response to harsh site conditions following mining.
Allometric analyses are necessary to distinguish whether partitioning changes are ontogenetic or if they are actually attributable to trees responding to site factors by directly altering partitioning [22]. For example, trees grown in a low-nutrient environment might allocate more to root biomass in order to attain sufficient nutrients. Trees compared at an equal age rather than at an equal size may lead to the misconception that ontogeny is not responsible for observed differences [28]. If trees grown with less available nutrients were similar in size to trees on more fertile sites when comparisons are made, the differences in biomass partitioning may be negligible. Allometric analyses use this principle to compare treatments on a similar size basis.
The use of one or more easily-measured size variables to create prediction models is a common method of estimating biomass or volume in forestry applications. These models are essential for estimating per hectare biomass, as destructive sampling of large areas is not feasible. As biomass prediction models have not been specifically created for reclaimed mineland in east Texas, such model fitting of destructively sampled trees from the site is necessary to determine allometry. Many of these models use diameter at breast height (DBH) and total height or a combined variable such as DBH squared multiplied by total height [29,30]. These models can be created to predict green or dry biomass (e.g., stem, branch, foliage, aboveground, belowground, etc.) or volume (e.g., stem, branch). These tools are commonly available for unmined plantation forestry [31], and range in applicable scale from region-wide [32,33,34] to more local [35,36]. These models can be used to estimate C storage in woody biomass by use of simple ratios at tree (e.g., 50% C by mass) or component tissue (e.g., 45%–52% C by mass [37]) levels, or by fitting similar model forms which utilize diameter or other variables to directly predict C storage [38,39]. Biomass and C are important variables to quantify accurately as value of timber harvests, biomass harvests, and C sequestration projects are directly dependent on these estimates.
Our study utilized a chronosequence with an age range of 30 years, representing several orders of magnitude in biomass difference from the youngest to oldest plots. Our objectives were to compare biomass partitioning with unmined land (from the literature), create prediction equations useful to reclamation managers at mine sites, and determine C storage in pine plantation biomass. Our hypotheses were: (1) belowground biomass allocation will differ from unmined loblolly populations on an allometric (i.e., not purely attributable to ontogeny) basis; and (2) C stored in woody biomass will be lower on reclaimed minelands than unmined lands. Unmined comparisons were obtained from the literature including both region-wide [25,31,32] and local biomass equations [35]. The models developed here will additionally provide tools to assist mine managers in estimating productivity, carbon sequestration, and the technical data needed for developing solutions to other situations involving forest plantations (e.g., fuel loading for wildfire risk analysis).
2. Experimental Section
2.1. Study Site
Our study site was an active Luminant mine site in east Texas (Figure 1). Luminant Mining Company’s Beckville Mine is a lignite coal surface mine utilizing draglines to perform overburden removal in the process of strip-mining. This mine is located in Rusk and Panola Counties. Average annual rainfall for the past 30 years is 130.3 centimeters, average daily high temperature is 24.6 degrees Celsius, and mean annual temperature is 18.4 degrees Celsius [40]. Prior to mining, soil series at the site included Bowie, Lilbert, Kirvin, Kullit, Cuthbert, Sacul, Tenaha, Iuka, and Darco [41]. Luminant is the primary owner the mine area, which is approximately 12,000 hectares. Beckville Mine has been operated since the early 1970s under different names, but without drastic changes in management.
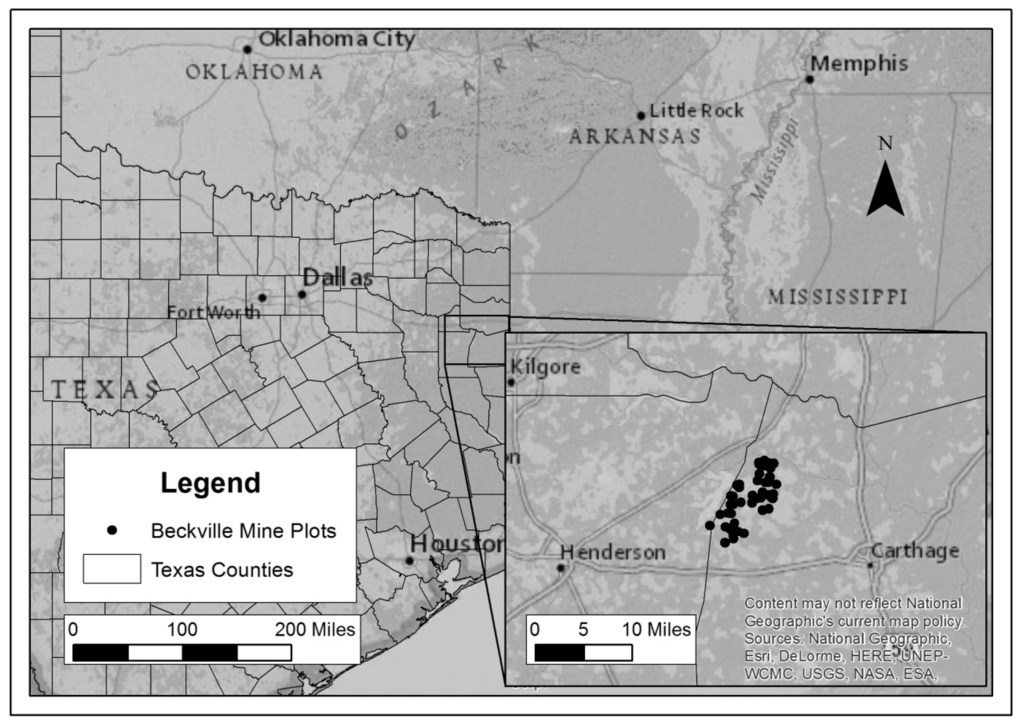
Figure 1.
Plot locations on Luminant’s Beckville Mine in east Texas.
2.2. Experimental Design
A series of 48 plots were spatially distributed across the Beckville mine to incorporate all available age classes. A total of 26 of the 48 plots were selected based on their use in a previous study [19]. Stands were randomly selected within 5 year age classes, with the exception of the youngest age class which only included stands 2–5 years of age. Any stand not sufficient in size to support a plot was excluded. Plot locations were also excluded on the basis of proximity to recent anthropogenic disturbances (e.g., oil/gas well pad, roads, etc.). Stands were selected so that there would be an even distribution among five-year age classes (i.e., 2–5 years, 6–10 years, etc.). Each plot was 0.1 ha (20 m by 50 m) with the long axis oriented perpendicular to the planting rows. A single large plot in each stand best represents extreme spatial variability of reclaimed minesoil, which can change drastically over a short distance [42]. Every live or dead standing pine tree within a plot was tallied and DBH, total height, live crown ratio, and crown classification were recorded for each. DBH was recorded as the geometric mean of two 90 degree angle measurements using calipers accurate to 0.25 centimeters. Trees shorter than breast height (1.37 m) were measured by the same method at the ground line. Height measurements were made using a 2013 TruPulse 360R laser clinometer (Laser Technology, Inc., Centennial, CO, USA). Crown position was visually assigned to crown classification categories according to Kraft [43] or listed as dead if no green needles were observed.
2.3. Destructive Sampling
2.3.1. Tree Selection
Based on the stand data collected above, dominant or codominant trees which were among the 10 tallest trees within each 0.1 ha plot were identified and a minimum acceptable height was produced for each plot. The sample tree was then selected randomly by finding the first acceptable tree from plot center along a list of randomly generated azimuths used only at a single plot. A potential bias in tree selection due to sampling from the ten tallest trees and therefore from dominant or co-dominant crown classes was an unavoidable criterion for this project, as these trees were also used to develop site index curves [20].
2.3.2. Aboveground Sampling Methods
Aboveground destructive harvest of 47 trees occurred in December 2013 and January 2014, within the dormant season. The selected trees were manually felled by chainsaw as near to ground line as possible or between cookie sampling heights for larger trees.
2.3.3. Limbs, Needles, and Cones
All live and dead branches were removed at the bole. Total combined live branch, needle, and cone green weight was obtained by weighing all living branches (i.e., green needles were still attached) on a hanging electronic MSI-7200 Dyna-Link dynamometer rated to 907 kg and accurate to the nearest 0.9 kg (Measurement Systems International, Seattle, WA, USA). Three live branches from the top, middle, and lower portions of the crown were selected for each tree. Branches without green needles were considered dead branches and were weighed separately from other tree components. Dead branch samples were chosen by diameter. Typically a small, medium, and large dead branch were retrieved; however, younger trees had few to none dead branches. All samples were bagged for transportation to cold storage at 4 °C. Sample branches were later sectioned into branch, needle, and seed cone components, oven dried at 65 °C to a stable weight, and weighed. The green weight to oven-dried weight, and component (branch, needle, seed cone) weight to total weight ratios of the three branches were used to scale weights to a whole-tree, oven-dried basis by component.
2.3.4. Stem
Following field branch removal, the bole was weighed using the same method as live branches with minimal sectioning for greater accuracy. Following weighing, the bole was cut by chainsaw into 1.22 m increments using DBH as the origin. Another cross-section was taken at 0.46 m above the ground-line. Cookies approximately 5 cm in thickness were then removed by chainsaw from the top end of each sectioned log. The green weight of cookie samples was obtained in the lab using a Mettler-Toledo PB3002-S/FACT scale accurate to 0.01 grams (Mettler-Toledo, Inc., Columbus, OH, USA). The diameter inside and outside the bark was recorded for each while still green. Cookies were oven dried at 65 °C to a stable weight. Bark was then removed from cookies and dry weight of bark and wood were obtained. The percentage of dry weight to green weight and percentage of bark weight to stem weight for the cookies of an individual tree were used to determine stem dry weight, and stem bark weights.
2.3.5. Belowground Components
Additional belowground sampling for 12 of the trees previously harvested occurred in January–March 2014. Coarse root biomass samples were only obtained from 11 trees due to loss of samples prior to analysis and therefore total root biomass was only estimated for 11 trees. Two randomly selected plots per age class were sampled, representing a wide range of tree sizes. The 12 plots were completed by April to reduce biomass loss to decomposition and respiration. Sample pits were 1 m diameter, with the taproot pit centered on the stump and the coarse root pit located 1.22 m from the center of the stump. The coarse root pit methodology was tested by sampling in three 1 m diameter pits on the largest sample tree prior to sampling any other locations. These pits were located 1.22, 1.52, and 1.83 m from the tree center. The 1.22 m pit proved to be closest to the mean of all three pits (less than 12% difference in total root biomass). The 1.22 m pit was offset 30 degrees from the row, which provided consistent distance from the sample tree and next adjacent tree within the row (Figure 2). This location likely prevented overestimation as compared to sampling directly within the row, as well as preventing possible underestimation which may result from sampling the mid-point between four adjacent trees. The 1.22 m pit best represented the average biomass along a gradient of root biomass which is greatest at the stump and lowest at the mid-point between surrounding trees [44].
2.3.6. Taproot Sampling
Twelve trees were sampled for taproot biomass using a one meter deep taproot sampling pit. More intensive sampling of four trees selected to represent a range of sizes (e.g., 3, 9, 15, 21 m in height) was used to estimate the percentage of biomass below the sampling depth in other plots. The intensive sampling involved an additional half meter of taproot excavation using manual procedures followed by excavation of any additional taproot deeper than 1.5 m by a diesel powered John Deere 310SJ backhoe loader (Deere & Company, Moline, IL, USA). An air knife (Supersonic Air Knife, Inc. Model X-ST2, Allison Park, PA, USA) was used in concert with hand digging to sample all taproot and coarse root pits for any pine roots > 2 mm. The air knife is a 1 meter long tube with a valve that is attached to an industrial diesel-powered air compressor with a flow rate of 0.09 cubic meters per second and pressure of 862 kPa. Air is fired through a tapered nozzle at speeds exceeding 340 m per second. The pressurized air breaks up soil and assists removing soil from root structures, although roots, including fine roots, are not damaged by this process [45]. Heavy equipment (e.g., backhoe loader) was used in conjunction to sample deep taproots and to create access trenches surrounding samples (Figure 2). The use of a backhoe to create a trench adjacent to the sample has been done before in Australia [46] and can be conducted to minimize damage to the sample [47,48]. Trenching around the samples also allows more accurate discrimination of depth. The backhoe did not extract any sample roots from less than a meter deep. All coarse (>2 mm diameter) live pine roots within each pit were sampled, and were processed in the lab as described below. Fine roots were not sampled in this study as the relative mass of these components is typically less than 5% [49].
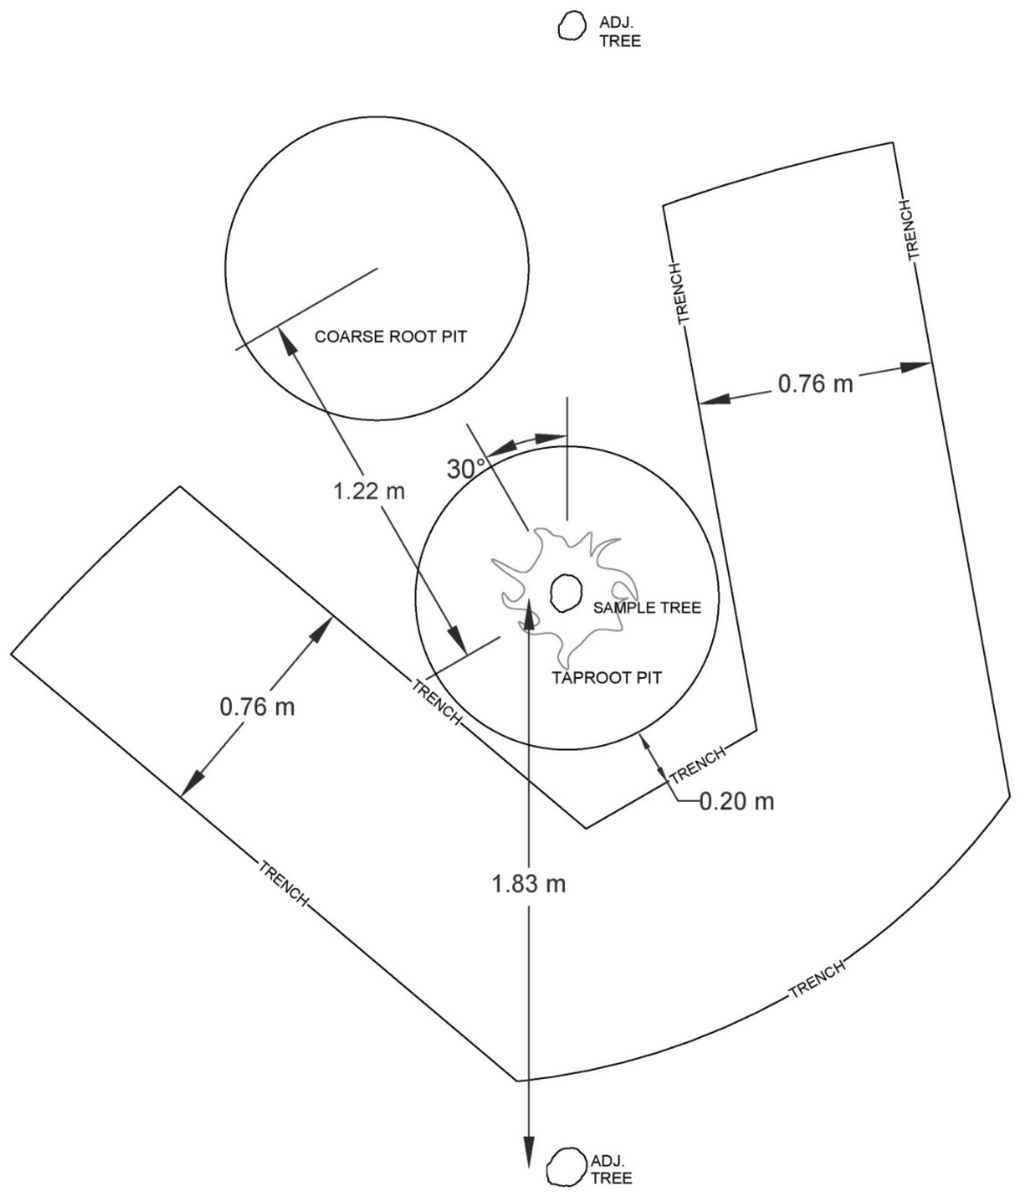
Figure 2.
Representation of trench excavation methods. Location of 1 meter diameter taproot and coarse root sample pits relative to the sample tree. Trench excavation conducted by John Deere 310SJ backhoe loader with approximate minimum clearance of 0.2 m. This belowground sampling procedure was designed for planted stands on 1.83 meter within-row spacing.
2.3.7. Coarse Root Sampling
Coarse roots between trees (i.e., those not found in the tap root pits) were sampled using a single pit to extrapolate coarse root mass per tree. Tree scaling of coarse root data relied on stand density data for the plot. This data was validated using 2 m color infrared imagery from the National Agriculture Imagery Program to ensure proper estimation of tree growing space. In the event of erroneous approximated growing space from density data, average growing space of the ten largest trees (selected by crowns width) in the plot was substituted. This was calculated by averaging the distance to trees within a row, and then doing the same for distance between rows, for these ten trees. These distances were then used to calculate a rectangular area for each tree. The aerial imagery growing space estimates were similar to density based estimates, even for heavily thinned stands or stands with openings. Corrections from aerial imagery provided logical tree growing space estimates for two young stands where extreme mortality impacted inventory data (e.g., a 4 year old tree estimated to have 9.6 m2 of growing space by aerial imagery was estimated to have 17.7 m2 using density based growing space estimates). Coarse root pits were 0.5 m deep stratified into 10 cm layers. On the four more intensively sampled plots, coarse root pits were 1 m deep. Miller, et al. [50] determined that over 75% of loblolly pine coarse root biomass could be sampled within 0.5 m of the soil surface, and that sampling to 1 m generally captured greater than 90% of root biomass in the pit.
2.3.8. Laboratory Procedures
All roots collected in the field were transported back to the Stephen F. Austin State University campus, where they remained refrigerated at 4 °C until processing. Roots were processed to excise all fine roots < 2 mm in diameter prior to oven drying at 65 °C. Once weight stabilized, dry weights were recorded. Due to their excessive size and weight, seven of the largest excavated stumps were kept in a closed location but unrefrigerated.
2.4. Statistical Analyses
Data were analyzed in SAS 9.3 (SAS Institute, Cary, NC, USA). All variables were transformed as necessary to meet assumptions of normality checked using PROC UNIVARIATE. Regressions of stem dimensions to biomass partitioning were implemented in PROC REG and PROC NLIN. Assumptions of heteroscedasticity were also evaluated through residual plots and Furnival’s Index of Fit, and for biomass and volume prediction models heteroscedasticity was corrected using the combined variable D2H (where D is diameter at breast height and H is total tree height) [51] as a weight. Use of D2H as a regression or weight variable in forestry has been summarized by Schreuder, et al. [52] who concluded that more complex variable forms provided no advantage over the simple combined variable. Linear, exponential, and power function model forms were compared using Furnival’s Index of Fit to determine best weighted models.
2.4.1. Non-Linear Regression
Models previously used for biomass estimation of individual components were fit to develop equations for reclaimed minelands [31]. Model forms evaluated included combined variable models and which are linear models differing only by the intercept parameter. The non-linear model form which does not include an intercept parameter was also evaluated for use in predicting various tree components’ biomass and volume. These models only require measurement of diameter at breast height (D) and total tree height (H), which promotes ease of use. Individual models were fit to allow estimation of total bole volume, total aboveground biomass, and total belowground biomass.
2.4.2. Root Biomass Sampling Correction
As belowground biomass is not sampled in its entirety, corrections and scaling of sample biomass to the tree level were necessary prior to fitting biomass prediction equations. Regressions of rooting depth and root biomass to tree size were used to determine if sample pit depth was adequate to sample at least 95% of actual root biomass. If root biomass sampled was not at least 95% of predicted biomass based on linear regression of fully sampled trees, a correction was applied which utilized expected rooting depth and linear regressions of biomass to diameter at each 10 cm sampling layer. The biomass was estimated for each successive layer until biomass reached 95% of expected coarse root sample biomass. Sampled biomass ranged from 80% to 97% of the corrected total biomass, with an average of 87.15% sampled. Following corrections to root samples to account for shallow sampling depths, whole tree coarse root biomass was estimated. As roots from the sample tree and adjacent trees were not distinguished, calculating growing space for the sample tree was necessary. This method assumes root biomass entering the growing space is equal to root biomass of the sample tree exiting the growing space. The sampled coarse root biomass could then be scaled to the tree level based on area available to the sample tree. Once coarse root data were properly scaled to tree level, total root biomass was found by adding sampled taproot biomass with any necessary corrections for sampling depth. Corrections for sampling depth were only performed for four sample trees, and only for coarse roots. No trees required correction of the taproot component. As was previously done for aboveground biomass, an appropriate weighted model form was created using untransformed data. The models for total belowground biomass, coarse root biomass, and taproot biomass all utilized DBH as the sole independent variable. The total root biomass prediction equation was applied to the stand level data to determine belowground biomass per hectare.
2.4.3. Allometric Analysis
Allometric analyses were conducted at a stand scale using estimates of aboveground and belowground biomass. The use of logarithmic transformations enables linear modeling, whereas non-linear modeling would require greater overlap of tree sizes to reach any type of conclusion [53]. The log-linear model parameters can then be tested for significance between various treatments (e.g., mined and unmined sites). Plots were considered as the experimental unit for statistical modeling and comparison. Data compiled from a number of research papers as summarized in Coyle, et al. [25] served as the unmined comparison. The 95% confidence intervals of this unmined allometric model were used to determine if loblolly pine stands on reclaimed mineland differ in partitioning patterns from unmined stands.
3. Results
3.1. Individual Tree Prediction Equations
3.1.1. Aboveground Biomass
Appropriate model forms were determined for each dependent variable using Furnival’s Index of Fit (definitions for acronyms in Table 1). The model form shown in Table 2, Equation (1) was the best fit for green TAGB, dry TAGB, green STEM, VOB, and VIB predicted variables. Equation (1) is similar to one used in previous studies [31,36,54] with only the addition of an intercept parameter. Residual plot analysis indicated the conventional model form was inadequate for predicting biomass and volume of small trees (Figure 3). Equation (1) also provided good fit for the dry STEM variable without AGE as an independent variable. However, a model form (Table 2, Equation (2)) incorporating AGE was the best fit for the dry STEM variable. Equation (2) is similar to a model form previously used by Gonzalez-Benecke, et al. [31], but was modified by including an intercept parameter to improve fit.
A non-linear exponential model provided the best fit for the remaining components (Table 2, Equations (3) and (4)). This model form did not perform better with an intercept parameter. Equation (3) was the best fit for green FOLIAGE and dry FOLIAGE. An additional model form (Equation (4)), while not the best fit for any component as determined by Furnival’s Index of Fit, did allow biomass estimation without the independent variable AGE. Equation (4) was the best non-AGE fit for green FOLIAGE and dry FOLIAGE. As age may not always be available, any components which were best predicted using age as an independent variable are also displayed with the best fitting model form which does not incorporate age (Table 3). Dry STEM was fit to both Equations (1) and (2), with Equation (2) being the best fit model. Green FOLIAGE and dry FOLIAGE were both fit to Equations (3) and (4), with Equation (3) being the best fit model for both. All parameter estimates and model statistics are displayed in Table 3.

Table 1.
List of acronyms.
| Name | Meaning |
|---|---|
| DBH | Diameter at breast height |
| HT | Total tree height |
| AGE | Stand age in years |
| QMD | Quadratic mean diameter |
| TAGB | Total aboveground biomass |
| STEM | Bole biomass |
| FOLIAGE | Needle biomass |
| TBGB | Total belowground biomass of a tree |
| TAPROOT | Root biomass within a 1 m diameter pit centered on the stump |
| COARSE | Root biomass outside the taproot sample pit |
| VOB | Volume outside bark (wood and bark) |
| VIB | Volume inside bark (wood only) |
Table 2.
List of prediction equation model forms.
| Equation Number | Model Form |
|---|---|
| 1 | |
| 2 | |
| 3 | |
| 4 | |
| 5 | |
| 6 |
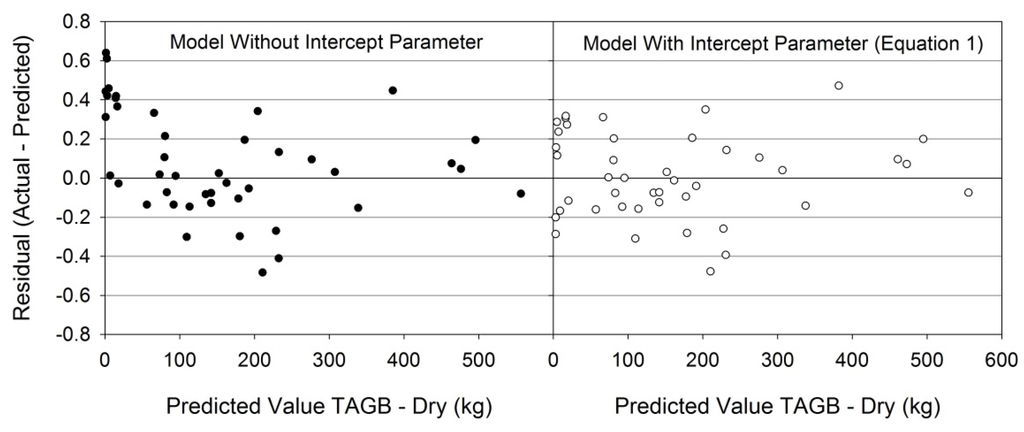
Figure 3.
Residuals of two model forms evaluated for predicting total aboveground biomass (dry). A conventionally used model form [31,54] which did not include an intercept parameter appeared to underestimate TAGB in small trees (left panel). The addition of an intercept parameter to the conventional model form improved predictions for small trees (right panel). Other tree components predicted using the model with intercept parameter (Equation (1)) displayed similar residual plot improvement over the conventional model form.
Table 3.
Above- and belowground biomass prediction equations in green and dry condition for loblolly pine on reclaimed mineland in east Texas. Model forms are displayed in Table 2.
| Condition | Component | Model (Table 2) | Parameter | Estimate | SE | ADJ R2 | RMSE (kg) | Weight |
|---|---|---|---|---|---|---|---|---|
| Green * | TAGB | 1 | B0 | 4.6133 | 0.9480 | 0.98 | 0.3300 | 1.1 |
| B1 | 0.1540 | 0.0361 | ||||||
| B2 | 1.9112 | 0.1519 | ||||||
| B3 | 0.6923 | 0.1574 | ||||||
| STEM | 1 | B0 | 1.1633 | 0.2149 | 0.99 | 0.0400 | 1.5 | |
| B1 | 0.0644 | 0.0114 | ||||||
| B2 | 1.6411 | 0.1332 | ||||||
| B3 | 1.2093 | 0.1309 | ||||||
| FOLIAGE | 3 | B0 | 1.8009 | 0.4549 | 0.92 | 0.1700 | 0.9 | |
| B1 | 1.0718 | 0.2109 | ||||||
| B2 | 0.0424 | 0.0157 | ||||||
| B3 | −0.5464 | 0.2097 | ||||||
| 4 | B0 | 1.4010 | 0.3876 | 0.90 | 0.2700 | 0.8 | ||
| B1 | 0.6938 | 0.2009 | ||||||
| B2 | 0.0356 | 0.0164 | ||||||
| Dry | TAGB | 1 | B0 | 2.4584 | 0.5413 | 0.99 | 0.2300 | 1.0 |
| B1 | 0.0779 | 0.0168 | ||||||
| B2 | 1.7712 | 0.1291 | ||||||
| B3 | 0.8581 | 0.1372 | ||||||
| STEM | 2 | B0 | 0.5320 | 0.1543 | 0.99 | 0.0400 | 1.3 | |
| B1 | 0.0304 | 0.0053 | ||||||
| B2 | 1.4854 | 0.1150 | ||||||
| B3 | 1.1174 | 0.1796 | ||||||
| B4 | 0.2745 | 0.1062 | ||||||
| 1 | B0 | 0.5274 | 0.1358 | 0.99 | 0.0300 | 1.4 | ||
| B1 | 0.0342 | 0.0064 | ||||||
| B2 | 1.4205 | 0.1294 | ||||||
| B3 | 1.4453 | 0.1306 | ||||||
| FOLIAGE | 3 | B0 | 1.0462 | 0.2467 | 0.92 | 0.0800 | 0.9 | |
| B1 | 1.1188 | 0.1999 | ||||||
| B2 | 0.0481 | 0.0149 | ||||||
| B3 | −0.7153 | 0.2064 | ||||||
| 4 | B0 | 0.7185 | 0.1955 | 0.90 | 0.1300 | 0.8 | ||
| B1 | 0.6649 | 0.2006 | ||||||
| B2 | 0.0360 | 0.0166 | ||||||
| TBGB | 5 | B0 | 2.5288 | 0.5525 | 0.95 | 0.4000 | 2.3 | |
| B1 | 0.1389 | 0.0084 | ||||||
| TAPROOT | 6 | B0 | 0.5722 | 0.0720 | 0.96 | 0.0022 | 2.2 | |
| B1 | 0.0251 | 0.0087 | ||||||
| B2 | 2.3346 | 0.1208 | ||||||
| COARSE | 5 | B0 | 1.7645 | 0.5639 | 0.83 | 0.3551 | 2.4 | |
| B1 | 0.1258 | 0.01330 |
* Green condition is in-field green weight during dormant season. Dry condition is weight of biomass following drying at 60 °C. DBH = Diameter at 1.37 m height (cm). HT = Total tree height (m). TAGB = Total aboveground biomass (kg). STEM = Bole biomass including bark (kg). FOLIAGE = Live needle biomass (kg). TBGB = total belowground biomass greater than 2 mm diameter (kg). TAPROOT = all root biomass greater than 2 mm diameter located in a circular sample pit 1 m diameter centered on the stump (kg). COARSE = all root biomass greater than 2 mm diameter located outside the taproot sample pit and within the tree growing space (kg). SE = Standard error of the parameter estimate. ADJ R2 = 1 − ((SSE/DFerror)/(SST/DFtotal)). RMSE = Square root of the mean square error (kg). Weight = Exponent of D2H in the weight variable applied to the model. All parameter estimates significant at the 0.05 confidence level.
3.1.2. Belowground Biomass
Rooting depth, for both taproot and coarse root sample pits, was correlated with age and tree height, but not highly correlated to diameter. This correlation was used to determine if any coarse root biomass was located below sampling depth. Taproots were estimated to reach depths of 98, 197, and 296 cm at ages 10, 20, and 30 years, respectively (R2 = 0.7797). Coarse root biomass was estimated to reach depths of 60, 86, and 113 cm at ages 10, 20, and 30, respectively (R2 = 0.7681).
The only model form (Table 2, Equation (5)) for estimating total root biomass and coarse root biomass which had significant model parameters utilized only DBH as the independent variable. Another model form (Table 2, Equation (6)) was necessary for prediction of taproot biomass only, as this component was sampled entirely which eliminated the need to scale to tree level. As a result the relationship to DBH was different from the relationship of other belowground biomass components. The scaled components generally followed a similar pattern when related to DBH, whereas components which were not scaled followed a different pattern. This resulted in the need for a different model form or equation, even though using the same model form would have been preferable.
3.1.3. Comparison to Research on Unmined Land
The models for biomass were compared to existing data in the literature both locally and regionally. Appropriate model forms were fit to the reclaimed mineland data in order to make comparisons of the parameter estimates. Belowground biomass prediction equations could not be compared to unmined sites as no appropriate unmined dataset contained the necessary prediction equations. For the available datasets, all comparisons indicated greater biomass of aboveground woody components in trees on reclaimed mineland than trees on unmined land when comparing on the basis of similar diameter and height (Figure 4).
Total Aboveground Biomass
The total aboveground biomass model for green weight was compared to Coble, et al. [54] for non-mined lands in east Texas and western Louisiana. The model form used by Coble, et al. [54] did not include an intercept parameter and only the slope parameter of the mined and unmined models was found to be statistically different at the 0.05 confidence level. The slope parameter for our data was larger than the unmined model (p = 0.0137), indicating trees of a given diameter and height will have greater aboveground green biomass on reclaimed mineland than on unmined land (Figure 4).
The aboveground biomass of dry components was compared to the comprehensive models of Gonzalez-Benecke, et al. [31], which includes many datasets across the southeastern United States. The total aboveground biomass model used by Gonzalez-Benecke, et al. [31] did not include an intercept parameter and the model parameters were statistically different between mined and unmined sites for the slope parameter (p = 0.0016) and DBH exponent parameter (p = 0.0232). The slope parameter was larger for reclaimed mineland and the DBH exponent parameter was larger for unmined sites, yet the overall estimates for total aboveground biomass were greater for mined sites (Figure 4).
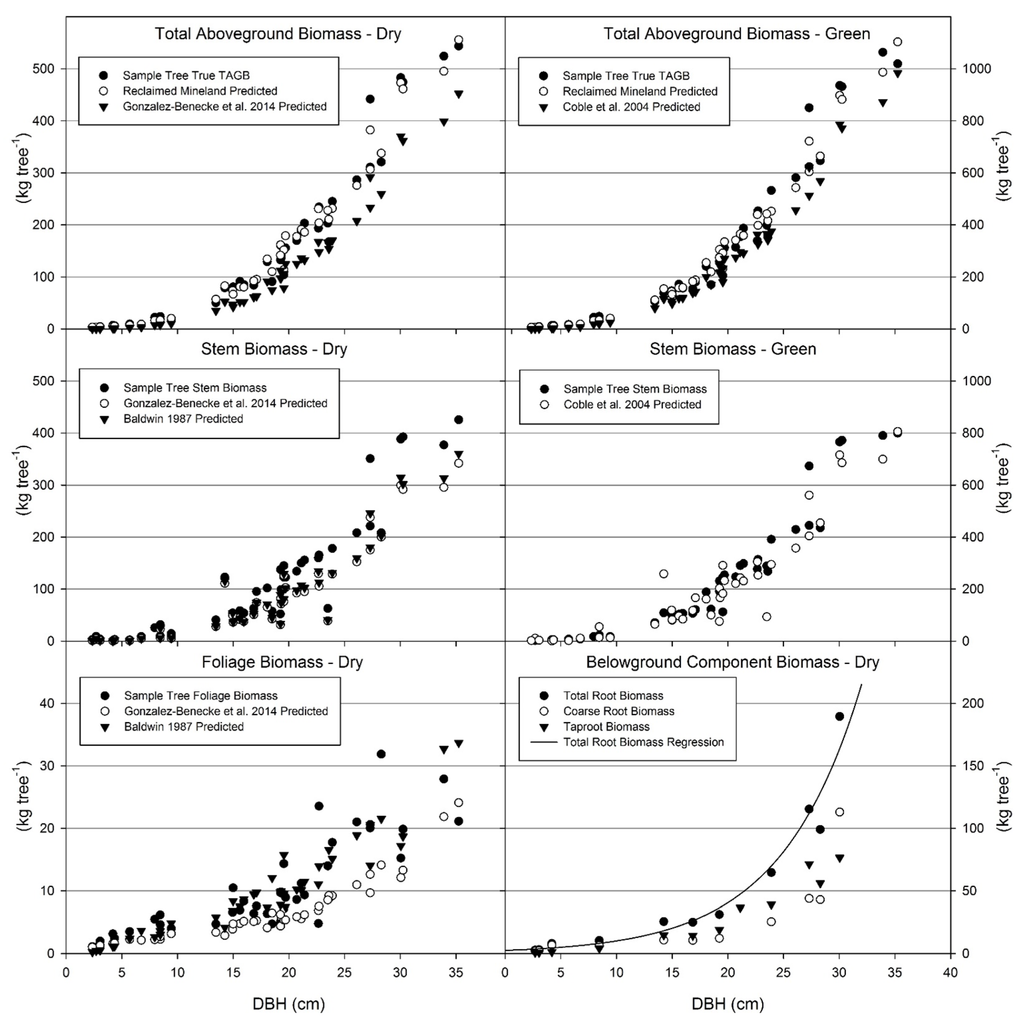
Figure 4.
Total aboveground biomass (green and dry), stem biomass (green and dry), foliage biomass (dry), and belowground biomass (dry) for sample trees on reclaimed mineland. Actual sample tree biomass, predicted biomass from the models in Table 3, and/or predicted biomass from unmined datasets are displayed. Although displayed by diameter at breast height, each predicted value utilizes the same DBH (diameter at breast height), HT (total height), and AGE (tree age) values of the sampled trees. Total aboveground biomass, either green or dry, is therefore greater on mined sites than unmined sites when trees are a similar size. Stem biomass is generally greater for trees on mined sites than unmined sites. Foliage biomass predicted by reclaimed mineland models did not exceed predicted values from the unmined model of Baldwin [33]; however, foliage biomass was greater on mined sites than values of Gonzalez-Benecke, et al. [31]. Component and total biomass of roots are displayed, as well as the total belowground biomass prediction equation. Belowground biomass data could not be compared to unmined datasets.
Stem Biomass
The stem model used by Gonzalez-Benecke, et al. [31] did not include an intercept parameter and all model parameters were statistically different between mined and unmined sites (1 p <0.0001, 2 p = 0.0009, 3 p = 0.0179, 4 p < 0.0001). Overall, predicted stem biomass on reclaimed mineland is greater for a given diameter and height. The slope parameter and age exponent parameter were larger for the mined site model than the unmined model, although the diameter and height exponent parameters were larger for unmined sites.
Stem biomass without bark or weight of wood only was not dependent on thinning, age, or tree size. As wood:bark biomass ratios held no relationship to tree size metrics, it was possible to apply a simple correction for determining weight of stem wood. The average wood and bark content of stem biomass were 84.36% and 15.64%, respectively, for all ages and tree sizes. This correction can be applied to predicted dry stem biomass.
Foliage Biomass
There were statistical differences between the foliage models (Table 2, Equation (3)) for mined and unmined sites of Gonzalez-Benecke, et al. [31] for the parameter estimates 1 (p = 0.0075) and 2 (p = 0.0337). Although the 1 parameter estimate is larger on mined sites and the 2 parameter is larger on unmined sites, overall the reclaimed mineland foliage model predicted greater live needle mass at a given diameter. When estimates produced from mined and unmined models on the sample tree dataset were compared, Baldwin’s models [33] consistently yielded lower estimates for stem and total aboveground dry weight, yet typically larger estimates for foliage except for young trees under 6 m tall (Figure 4). In this case, the proportion of stem biomass in total aboveground biomass was similar between the mined and unmined estimates. While Gonzalez-Benecke, et al. [31] generally predicted lower foliage biomass, this was not the case with Baldwin [33], who predicted similar foliage biomass. This indicates the same size trees have greater biomass on reclaimed mineland and more branch mass, yet are supported by less or similar amounts of foliage biomass.
Total Belowground Biomass
All root biomass models required weighting and seemed to fit the data well using Equations (5) or (6). Twelve sample trees were used for taproot biomass modeling. The model selected for total belowground biomass utilizes a single independent variable (DBH) in an exponential function. Other models attempted included Equation (1), which was previously used for aboveground biomass estimation. The model parameters were not significant after weighting yet resulted in a higher R2 of 0.9771 for total root biomass. Linear regression on logarithmically transformed data was not found to be adequate and had a lower R2 than the selected model form. In Figure 4 the root biomass of each component and the prediction equation for total belowground biomass is displayed for sample trees.
Taproot
Taproot biomass was strongly correlated to diameter at breast height (R2 = 0.9585) in a power function (Table 2, Equation (6)), although an increase in biomass accumulation with DBH was indicated for thinned stands over unthinned stands (data not shown). The allometric relationship between DBH and taproot biomass was significantly different between thinned and unthinned stands. There were no overlapping tree sizes or ages for thinned and unthinned sample trees. As expected, taproot biomass was concentrated in the upper soil layers (0–50 cm). The pattern of taproot biomass distribution was consistent over a range of ages (Figure 5).
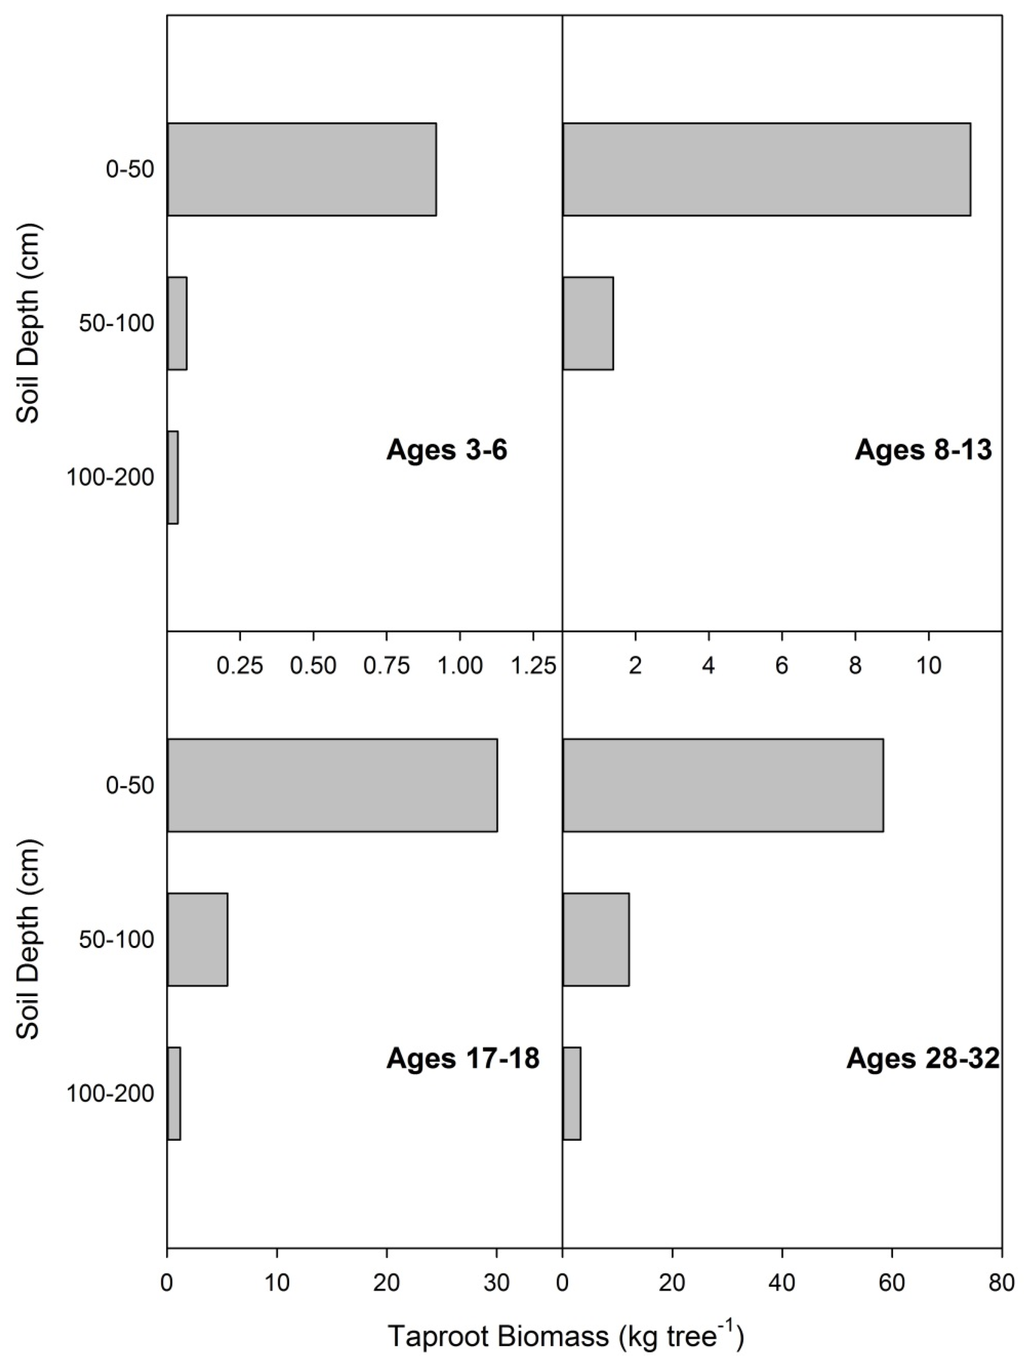
Figure 5.
Taproot biomass distribution at four ages. Data are from 11 destructively sampled loblolly pines on reclaimed mineland in east Texas.
Coarse Roots
Coarse root biomass was primarily located in the upper soil regions with all of the sample trees having the greatest biomass within either the 0–10 cm or 10–20 cm sampling layers (Figure 6). When compared to total coarse root biomass, the coarse root biomass within the first 0–20 cm ranged from 83% of total coarse root biomass for the youngest tree to 25% of total coarse root biomass for the oldest tree. On average 55% of coarse root biomass was located in the first 0–20 cm. Coarse root biomass within the sample pit was initially as much as 30% of the sampled root biomass within both sample pits (taproot and coarse root) and decreased exponentially with age to as little as 2%. Overall, the coarse root biomass sampled was related to tree size in a linear manner and was scaled to tree level based on stand density. When coarse root biomass was scaled properly, the relationship with tree metrics was similar to the relationship between tree metrics and taproot biomass (Figure 4).
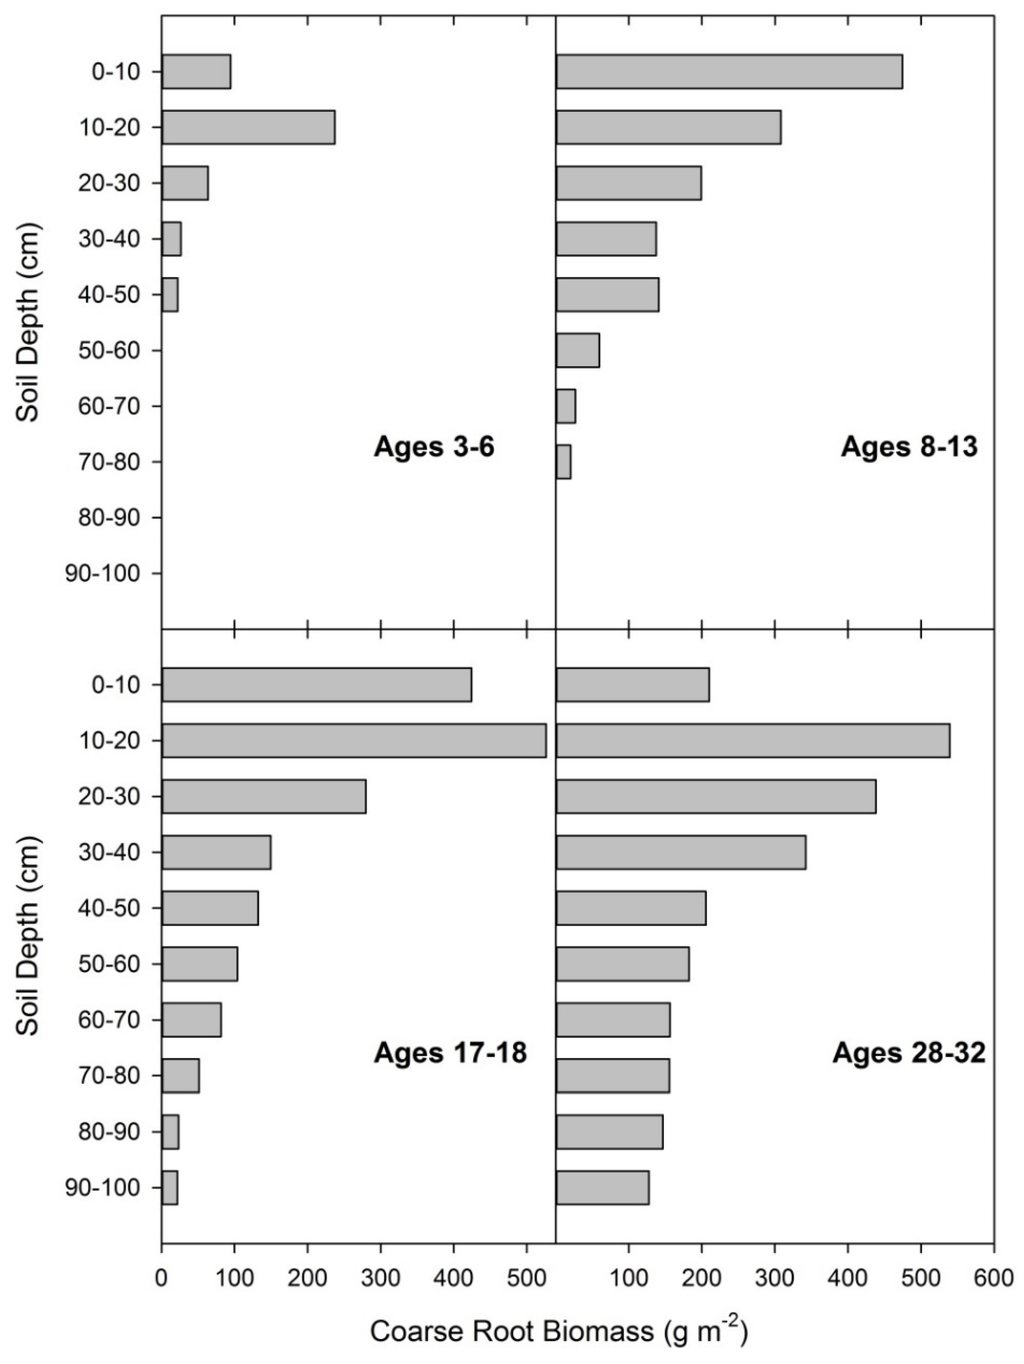
Figure 6.
Coarse root biomass distribution by depth at four age ranges averaging 4, 11, 18, and 30 years. Data are from 11 destructively sampled loblolly pines on reclaimed mineland in east Texas.
Stem Volume
Stem volume was estimated both inside (i.e., wood only) and outside (i.e., wood and bark) the bark using Equation (1). The estimated model parameters are found in Table 4. Stem volume model parameters were compared to the non-intercept models of Coble, et al. [54]. As with stem biomass, stem volumes were considerably greater at a given height and diameter for mined site trees (Figure 7). For volume outside bark, all model parameters significantly differed from Coble, et al. [54] (1 p = 0.0307, 2 p = 0.0027, and 3 p = 0.0240) and were greater for mined site trees than unmined with the exception of the diameter exponent parameter (2) which was greater for unmined trees. For volume inside bark, there were statistical differences only between the 1 (p = 0.0006) and 2 (p = 0.0014) model parameters, with the 1 parameter greatest for mine site trees and the 2 parameter greatest for unmined trees. Although the absolute difference in volume is greatest for large diameter trees, the smallest diameter trees contained greater volume on a relative basis. Also notable was the larger proportion of wood in stem volume outside bark compared to unmined models, which caused greater error in utilizing unmined volume inside bark prediction equations. Our sample trees held an average volume inside bark to volume outside bark ratio of 0.85, with a standard deviation of 0.0768. Regressing sample tree stem VOB and VIB resulted in a slope of 0.90 with very high R2 (0.9986).
Table 4.
Stem volume prediction equations inside and outside bark for loblolly pine on reclaimed mineland in east Texas.
| Component | Parameter | Estimate | SE | ADJ R2 | RMSE (m3) | Weight |
|---|---|---|---|---|---|---|
| VOB * | B0 | 1.33 × 10⁻³ | 2.15 × 10⁻⁴ | 0.99 | 5.6 × 10⁻⁵ | 1.3 |
| B1 | 4.80 × 10⁻⁵ | 6.05 × 10⁻⁶ | ||||
| B2 | 1.7434 | 0.0810 | ||||
| B3 | 1.2230 | 0.0846 | ||||
| VIB * | B0 | 9.70 × 10⁻⁴ | 1.47 × 10⁻⁴ | 0.99 | 2.6 × 10⁻⁵ | 1.5 |
| B1 | 4.10 × 10⁻⁵ | 5.87 × 10⁻⁶ | ||||
| B2 | 1.7011 | 0.1029 | ||||
| B3 | 1.2897 | 0.1033 |
* Model form is Equation 1 (Y = β0 + β1 × (DBH β2) × (HT β3)) for both volume equations. DBH = Diameter at 1.37 m height (cm). HT = Total tree height (m). VOB = Volume outside bark in green condition (m3). VIB = Volume inside bark in green condition (m3). SE = Standard error of the parameter estimate. ADJ R2 = adjusted coefficient of determination. RMSE = Square root of the mean square error (m3). Weight = Exponent of D2H in the weight variable applied to the model. All parameter estimates were significant at the 0.05 confidence level.
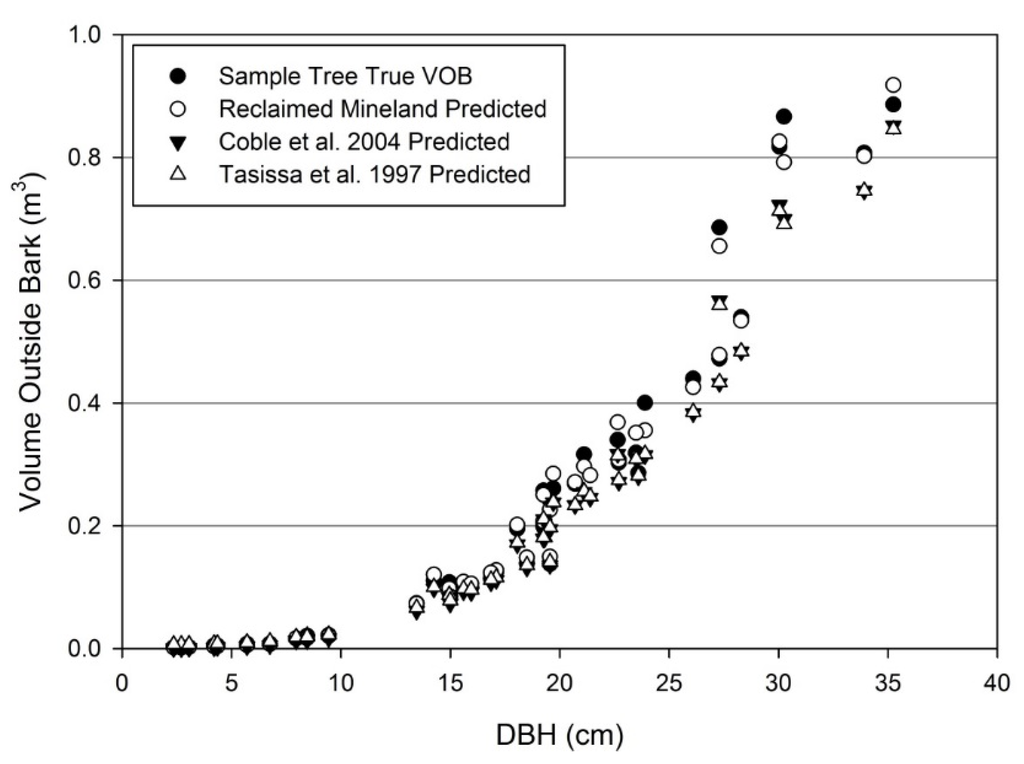
Figure 7.
Individual tree volume outside bark in comparison to predicted values from the reclaimed mineland model and unmined models.
3.2. Stand Level Estimates
3.2.1. Aboveground Biomass
Low stand density was offset by greater individual tree biomass at a given size, resulting in similar stand scale aboveground biomass on mined lands compared to average unmined sites (Figure 8). Aboveground biomass on reclaimed mineland is lowest relative to unmined stands at young ages. The unmined datasets did not indicate stands younger than 30 years had been thinned, and stands on reclaimed mineland exceed aboveground biomass of unmined stands beginning at 21 years. Thinning reduced aboveground biomass in reclaimed mineland stands to less than unmined stands which experienced no thinning.
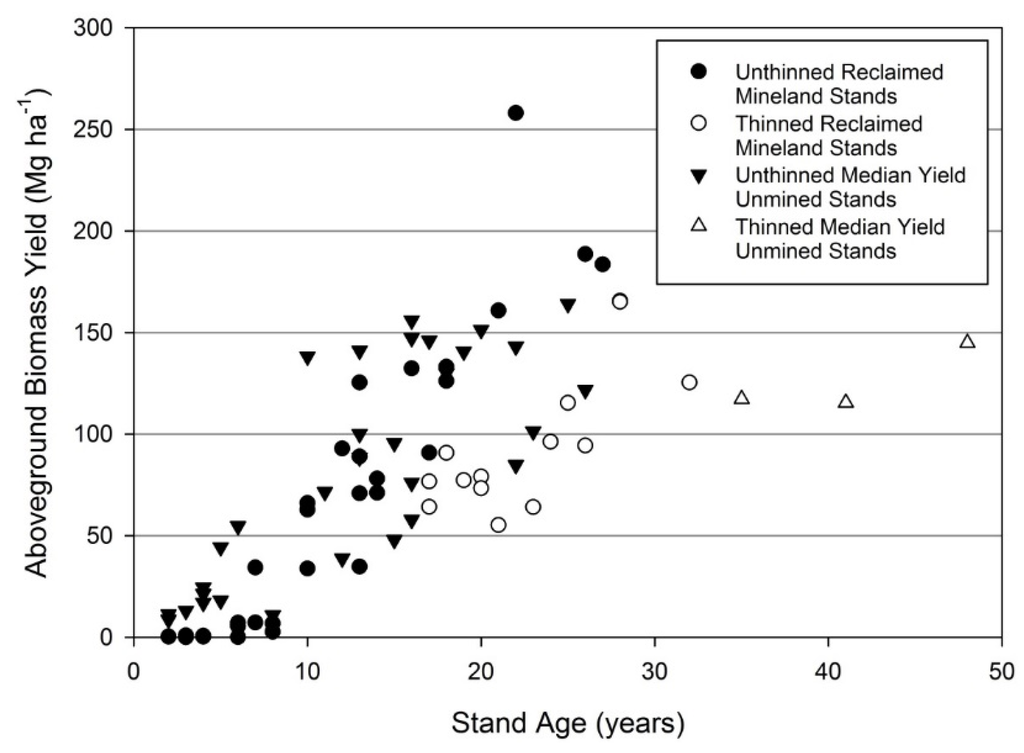
Figure 8.
Total aboveground biomass yield when dry for loblolly pine stands on reclaimed mineland in east Texas. Unmined comparison data from multiple studies compiled in Gonzalez-Benecke, et al. [31] which display the median aboveground biomass yield obtained within each study.
3.2.2. Volume Production
Stand level estimates of volume were compared with estimates developed using a stand level model from Coble [55] to approximate stand productivity compared to a mean east Texas site. The estimates of total tree volume from Coble were linearly correlated with no intercept to the stand level stem volume with an R2 of 0.9935 and a parameter estimate of 1.35. This indicates that stand level volume outside bark of only the stem on reclaimed mineland held 35% greater volume than the entire tree volume outside bark predicted at the stand level by Coble [55]. When summarized stand data (Table 5) were compared the data provided in Coble and Pendergast [56], there were statistical differences, but no clear trends as to whether stand metrics were greater or less on reclaimed mineland. As expected, average height and basal area were generally lower on reclaimed mineland. This was expected as average site index and stand density were lower for the mined dataset. Estimates of volume were statistically similar for age 30 when compared to the lowest density level provided by Coble and Pendergast (Table 5) in spite of the differences between the stands (e.g., density and average height were statistically lower for mined stands). Volume and biomass at the stand level were impacted by thinning operations for most stands over 18 years old. When thinned stands were removed, age was a significant predictor of VOB per hectare which increased over time (Figure 9). Thinned stands are lower in VOB per hectare and cannot be properly modelled as thinning occurred at different stand ages and levels which were not controlled in this study.
Table 5.
Stand level data for loblolly pine plantations on reclaimed mineland in east Texas and unmined sites across east Texas from the East Texas Pine Plantation Research Project.
| Site | Age * | Stem Volume Outside Bark | Approximate Total Tree Volume Outside Bark | Quadratic Mean Diameter | Dominant and Codominant Height | Basal Area | Density |
|---|---|---|---|---|---|---|---|
| (m3/ha) | (m3/ha) | (cm) | (m) | (m2/ha) | (TPH) | ||
| Mined | 10 | 67.41 | 93.23 | 14.25 | 8.73 | 14.91 | 916.7 |
| 20 | 112.69 | 138.64 | 19.12 | 14.16 | 15.49 | 540.0 | |
| 30 | 253.76 | 297.52 | 29.16 | 20.21 | 25.37 | 390.0 | |
| 10 | - | 42.62 | 12.70 | 8.53 | 9.87 | 741.3 | |
| Unmined | 20 | - | 187.86 | 20.32 | 17.07 | 24.79 | 741.3 |
| 30 | - | 307.91 | 22.86 | 22.86 | 32.37 | 741.3 |
* Only data from stands of the exact ages were included in mined site data with the exception of age 30. No 30 year old stands were available and therefore averages were taken from a 32 year old stand and two 28 year old stands. There were three stands at ages 10 and 30 and two stands at age 20. Mined site stands ages 20 and 30 had experienced thinning. The unmined data is from Coble and Pendergast [56] which consists of unmanaged pine plantations.
Except for some young stands, stocking appears adequate for productive loblolly pine plantations. Replanting is successful for returning stands to an appropriate density as the only stands with a stand density index below 20% of the maximum for loblolly pine are 8 years of age or younger (Figure 10). The point of self-thinning is 55% of maximum SDI (stand density index) and minimum stocking is considered to be 30% of maximum SDI, when maximum SDI is 1100 [57].
3.3. Allometry in Comparison to Unmined Stands
Root:shoot allometry on reclaimed mineland differed statistically from allometry of unmined stands (Figure 11 A). The reclaimed mineland allometric regression resulted in an intercept of −0.0684 (SE = 0.1395) and a slope of 0.7707 (SE = 0.0325), with an R2 of 0.9382. The allometric model parameters were statistically different from the unmined allometric model [25] for both the intercept (p < 0.0001) and slope (p < 0.0001). Root biomass was considerably higher on reclaimed mineland when aboveground biomass was low and, as aboveground biomass increased, root biomass became consistent with unmined data (Figure 12). These comparisons are only possible at the stand-level, as no individual-tree models predicting belowground biomass were available for comparable unmined sites.
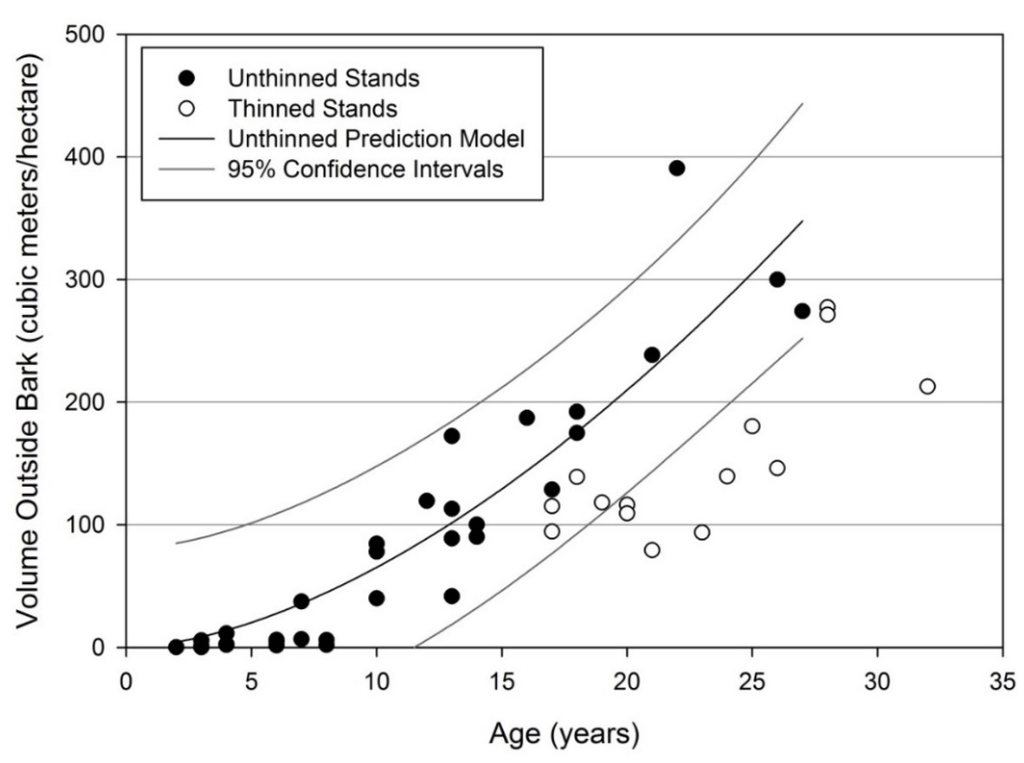
Figure 9.
Stem volume outside bark for loblolly pine stands on reclaimed mineland in east Texas. Stem volume at the stand level is at least temporarily reduced due to thinning; however, yields following thinning cannot be modeled.
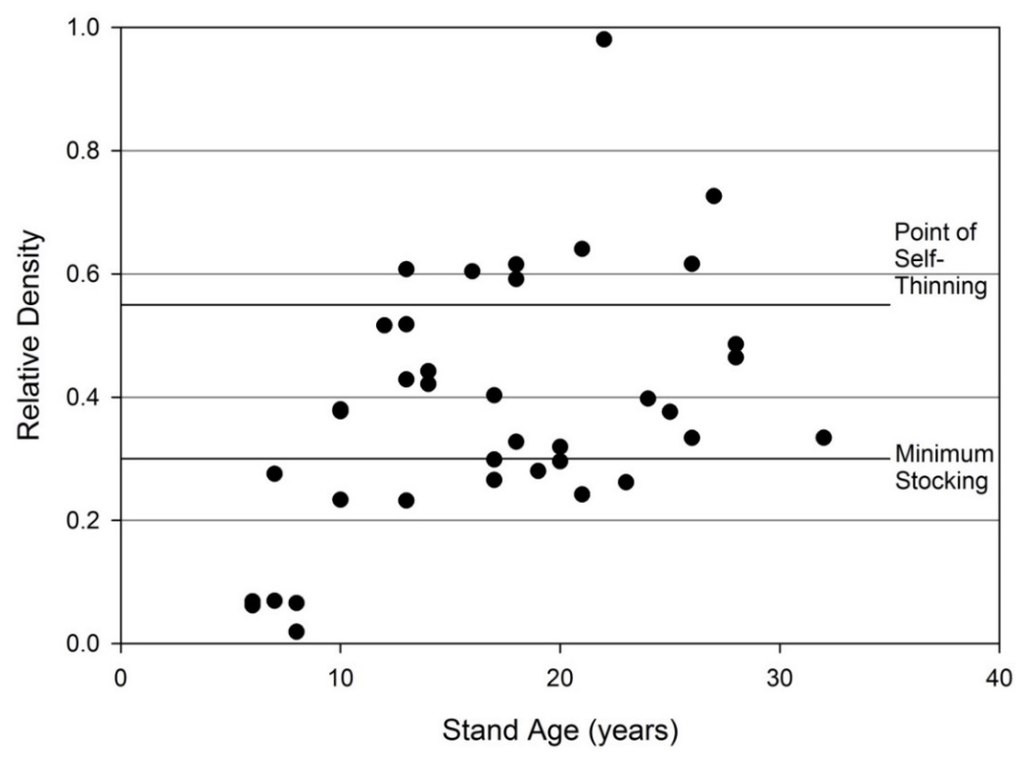
Figure 10.
Stand density index calculated according to Doruska and Nolen [57]. Assumes maximum stand density index of 1100. Most stands on reclaimed mineland achieve minimum stocking, which results in similar productivity to unmined sites. Briefly, maximum SDI (stand density index) is the number of 25 cm DBH trees that could be grown per hectare at the biological carrying capacity of a species. Relative density is the proportion a stand’s observed SDI compared to maximum SDI for the species. Minimum stocking is the relative density at which a stand is fully occupying available growing space.
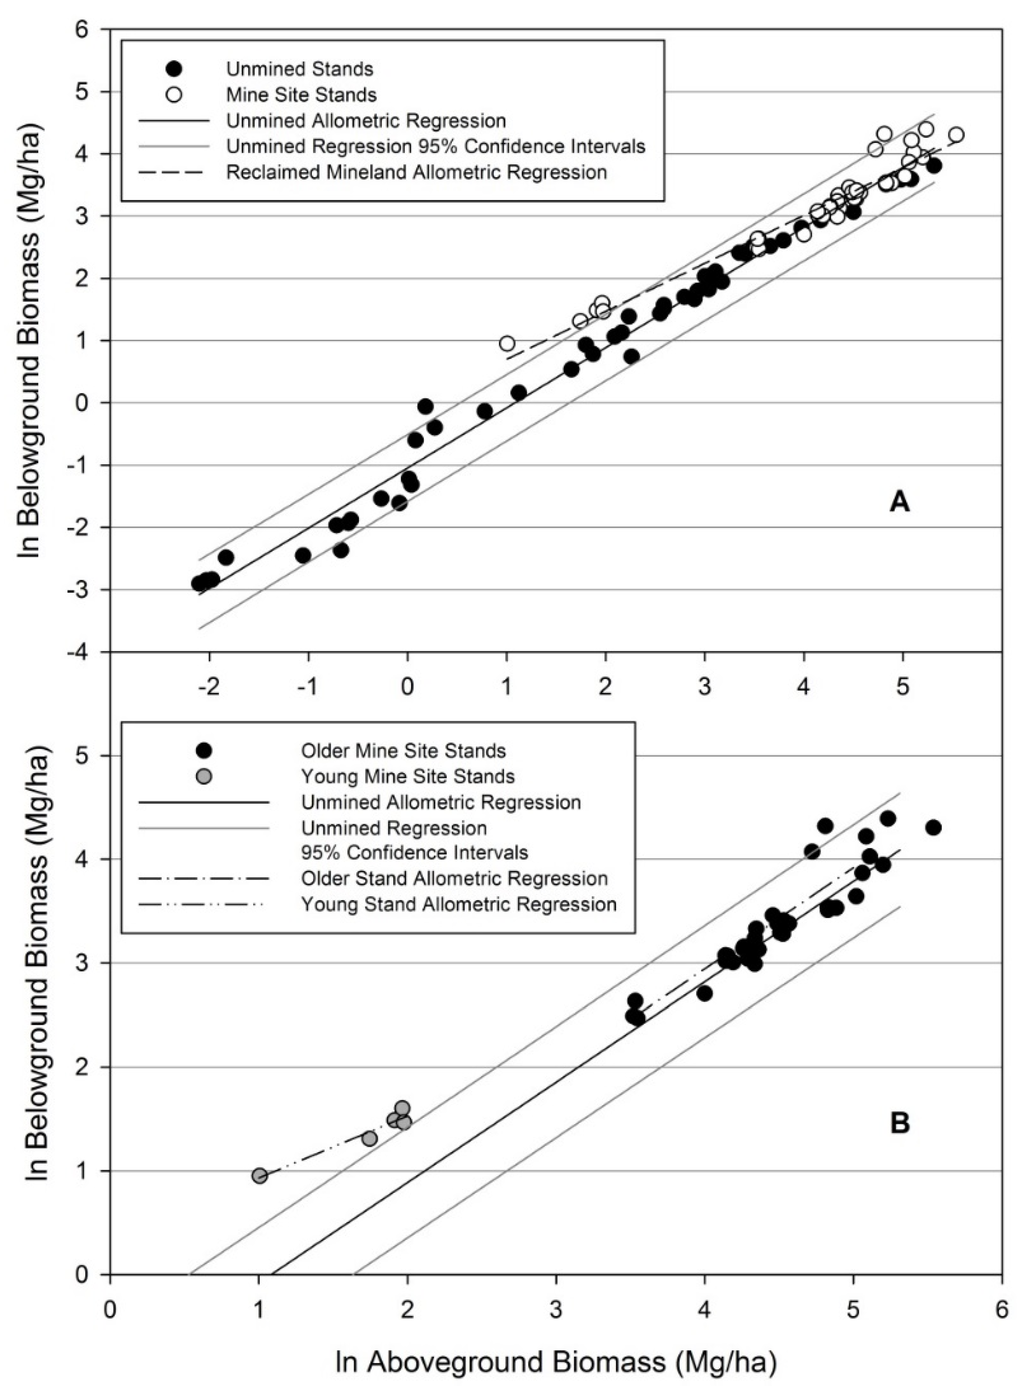
Figure 11.
(A) Allometric regression of 48 reclaimed mineland stands above- and belowground biomass compared to an unmined regression developed by Coyle et al. [25]. The allometric models differed statistically between mine sites and unmined sites (p < 0.0001), which indicates young trees on reclaimed mineland partition a relatively greater amount of biomass to roots; (B) Allometric regressions of mine site stands distinguished by level of aboveground biomass. The allometric models differed statistically between young stands and older stands on reclaimed mineland (p < 0.01) and between young stands on reclaimed mineland and unmined stands (p < 0.001). The allometric model for older stands on reclaimed mineland was not statistically different from the allometric model for unmined stands (p > 0.89).
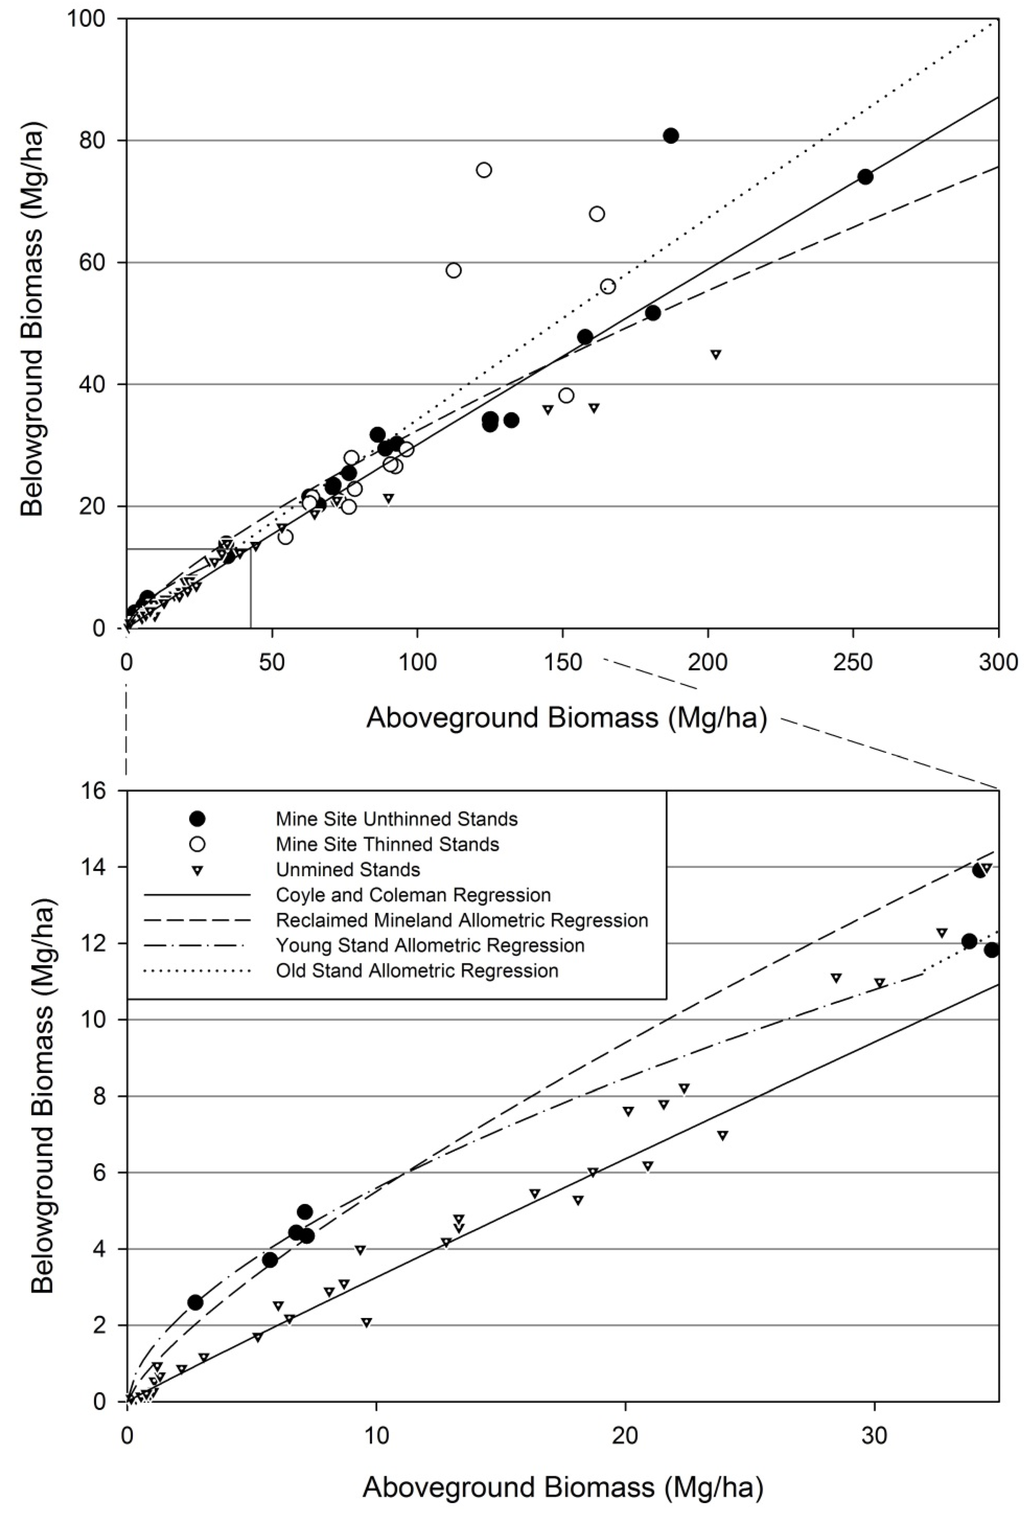
Figure 12.
Untransformed stand level biomass data for loblolly pine on reclaimed mineland and unmined sites [25]. Inset reveals distinct biomass partitioning differences for young stands. Log-linear allometric regressions displayed here on an untransformed scale. Allometric analyses were conducted using all data (Figure 11A) and then on two datasets split based on level of aboveground biomass (Figure 11B).
Although thinning did slightly impact allometric partitioning patterns, a more noticeable effect was found when considering only the five young stands with the least aboveground biomass (Figure 12). We found the five stands had a much different allometric pattern than the unmined stands (p < 0.001). The remaining stands (i.e., five smallest excluded) fit an allometric model with parameter estimates similar to the unmined allometric model (intercept p = 0.8997; slope p = 0.9162), and within the 95% confidence interval (Figure 11B). Stand level root:shoot ratio is displayed by stand age and QMD (quadratic mean diameter) (Figure 13). Age showed weak control on root:shoot ratio while QMD showed expectedly stronger control as root biomass is predicted by diameter. Young stands displayed more variability in QMD than older stands. For example, the coefficient of variation for age 7 stands is 34%, whereas age 10 is 13%, and age 20 is 7%.
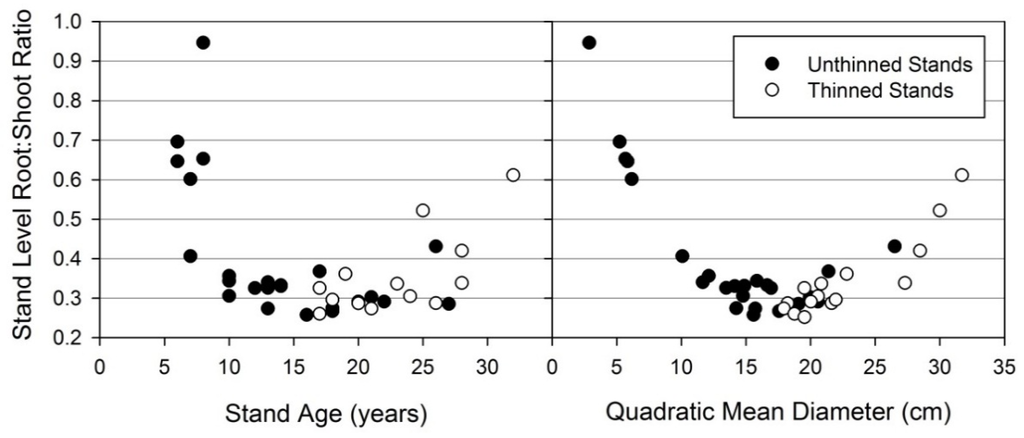
Figure 13.
Root:shoot ratio of loblolly pine on reclaimed mineland at the stand level displayed by age and QMD (quadratic mean diameter). Thinned and unthinned stands are distinguished, but generally appear to have similar root:shoot ratios.
4. Discussion
4.1. Allometric Partitioning and Root:Shoot Ratio
In agreement with our first hypothesis, allometric partitioning differences exist for loblolly pine grown on reclaimed mineland compared to unmined land (Figure 11A). However, the partitioning differences seem to only occur at young ages (i.e., differences in partitioning are not consistent over the course of stand development). The general appearance is that young stands of small QMD experience partitioning differences (Figure 12) relative to the unmined comparison dataset involving a variety of edaphic conditions, geographic locations, and silvicultural treatments [25]. For stands on reclaimed mineland, over the course of stand development partitioning differences decrease and by age 10 are not statistically different from unmined lands (Figure 11B). A possible argument is that both optimal and allometric partitioning theories are supported by our data for reclaimed minelands. Trees initially respond to an abnormal rooting environment by partitioning more belowground, but eventually as the soil environment aggrades, ontogeny once again has the strongest effect on partitioning. Our findings generally correspond to previous research, which indicates loblolly pine grows in similar patterns regardless of silvicultural treatments or geographic location [25,27]. However, short term responses in the form of altered partitioning in smaller trees have also been documented [23,58] and could be the case for young stands on reclaimed minelands. As such, by separately analyzing five young stands with the least amount of aboveground biomass, the differences in allometry appear to only occur at young ages. Although this analysis involved distinguishing stands with no basis other than total aboveground biomass, we feel that this properly represents the allometric pattern on reclaimed mineland in east Texas. The youngest and smallest stands deviate from the allometric partitioning model and then return to a pattern very similar to the conventional allometric model found on unmined sites [25]. The two older and larger stands that are outside the 95% confidence intervals of the unmined allometric model do not appear to have much biological meaning and are also extending the inferences of the regression created by Coyle, et al. [25] as they have very few data points with the high amount of aboveground biomass found in many of our mine site stands. Another caveat to examining allometry on reclaimed mineland is the recent and severe 2011 drought experienced in east Texas. Although we found no examples of drought altering allometry in the literature, this is a possible confounding effect as small trees could be more strongly affected. One implication of altered partitioning patterns is that allometric models from unmined land cannot accurately predict belowground biomass from aboveground biomass on reclaimed mineland. For some younger stands on reclaimed mineland, belowground biomass was twofold the predicted belowground biomass of Coyle, et al. [25] given the amount of aboveground biomass in those stands. It is currently unclear if increasing belowground biomass, and therefore C in the soil, is simply a response to soil conditions or a driver for improving soil quality.
While we did not sample soils in this study, numerous previous studies on reclaimed minelands in east Texas paint a consistent picture on how the soil environment aggrades following reclamation. For example, Ng [12] found that various soil properties and processes including organic C, N, K, Ca, Mg, S, micronutrients, microbial biomass, mineralization rates, and bacterial composition recovered between 5 and 20 years following mining. In some instances minesoils in east Texas actually have greater available nutrients than native soils that have been depleted through row-crop agriculture [15], although this has not resulted in observed growth rate increases for newly planted pine stands [18,59,60]. Angel [15] found that cation exchange capacity, Kjeldahl nitrogen, soil texture, and soil moisture were all similar to an undisturbed control, while essential plant nutrients were available in sufficient supply. Mine soils in the region have been shown to be limited by low pH, high salinity, and extreme soil textures immediately following reclamation [13]. However, the initial low pH following mining tends to moderate over time [61]. This is reflected in increasing diversity of microarthropod communities that gradually develop, despite the fact that these same communities were not affected by vegetation [62]. Similar trends have been observed separately for aggrading soil microbial biomass [63]. Compaction following reclamation has been shown to be a problem in some instances, which was demonstrated to reduce water infiltration and percolation rates, restrict root growth, and lessen vegetative productivity [64]. Thus, while our conclusions above on the impacts of soil on altered root:shoot ratios in young trees are speculative since no soil data were collected in this study, they are well supported by a large body of literature demonstrating improving soil properties over time on east Texas reclaimed mines.
4.2. Tree Biomass and Volume
The developed prediction equations estimated individual tree component biomass and volume, which were necessary for determining stand level biomass and volume. An intercept model form was not found in previous biomass or volume research for loblolly pine. The addition of a parameter estimate to a commonly used equation provided improved residual plots (e.g., Figure 3) over the existing model form [31,36,54]. An intercept parameter initially appears illogical, as a tree with no DBH or height would have no biomass or volume. Yet DBH is equal to 0 while height is less than 1.4 m and results in a predicted value of 0, in spite of the fact that a tree between 0 and 1.4 m in height would have some amount of biomass or volume. Therefore an intercept model provides better estimation of young, pre-merchantable trees. Apparent differences in the prediction equations for trees grown on reclaimed mineland are obvious when biomass or volume is related to DBH or total height. In comparison to a large number of previous models in the literature [31,33,54], trees on mine sites consistently had greater biomass and volume at a given diameter and height (Figure 4). We made comparisons through statistical analysis of parameter estimates as well as comparing model estimates from our data set. Almost all volume prediction equations developed on unmined land resulted in underestimated volume outside bark for our sample trees from the mine site (Figure 7). This indicates loblolly pine grown on reclaimed mineland have less taper, as the models incorporate both diameter and height. Essentially, trees of a given diameter and height on mined sites will have greater stem volume than unmined site trees. One notable exception we found was a prediction equation developed for a 45 year old loblolly pine stand established on abandoned agricultural land and planted at a similar 2.44 m square spacing [65]. The volume estimates from VanderSchaaf [65] were very similar to our predicted values for most of the sample trees, but did strongly underestimate trees less than 8 cm DBH. Although little other information is provided about the site, it may be possible that this stand experienced similar mortality events as the mine site stands. The Girard Form Class (GFC) estimates of sample trees averaged 84 for ages 17–32 years, which further indicates decreased taper in mine site trees compared to conventional estimates [66]. GFC is the ratio of diameter inside the bark at 17 feet to diameter outside the bark at DBH.
4.2.1. Total Aboveground Biomass
The final model selected for prediction of green or dry aboveground biomass in loblolly pine involved an intercept parameter which improved predicted biomass as DBH neared zero. This model form produced an acceptable residual plot after weighting with random appearance, whereas the model with no intercept parameter appeared to have slight U-shape of residuals, most apparent for small trees (Figure 3). This would suggest small tree biomass is underestimated in many commonly used biomass prediction equations, although these trees often are not of interest as they are not yet merchantable. Although trees below breast height were sampled, this model was not fit using trees with height less than 1.37 m. We suggest future studies consider intercept parameters during model fitting procedures, especially when smaller or pre-merchantable trees are of interest.
The clear increase in individual tree biomass, and related increase in volume, could be a result of lower density from thinning or initial mortality [67,68]. Baldwin, et al. [68] found wide spacing yielded lower TAGB biomass at a given diameter and height, but also found thinning increased TAGB biomass for a given tree size. Replanting may have additionally confounded results as restocking tree density some years after original planting is not normally necessary on unmined sites and has not been well-studied.
The sample tree selection process created a bias toward larger trees within a stand which may have impacted some tree characteristics. However, our use of DBH and height in prediction equations should have mitigated this bias to some extent. Biomass partitioning between aboveground components for different crown classes has been documented [37,68] which may reduce the inference-space of individual tree component predictions; however, total biomass can still be properly estimated with models utilizing diameter and height as predictor variables. Naidu [37] found suppressed trees to contain greater percentage of biomass in the stem than dominant trees and greater total biomass when DBH was less than 15 cm. Naidu [37] also found predicted total biomass for a given DBH was less than 10% different between suppressed and dominant trees between 10 and 24 cm, despite not using height as a predictor variable. Therefore, greater total biomass and biomass within the stem is likely consistent across all crown positions when compared to trees on unmined sites.
4.2.2. Stem
Accounting for age in the prediction of dry stem biomass reduced the height exponent parameter estimate (Table 3). Stem biomass increased with age, and when modelled together with diameter and height, the exponent parameter of age indicated older trees have greater biomass at a given diameter and height than younger trees. However, the increase in biomass due to age decreases as trees grow older. A similar relationship detected between GFC and age indicated less taper in older trees, which likely affects biomass given the strong linear relationship between stem biomass and stem volume (p < 0.0001, R2 = 0.9954). The slope and age exponent parameters were larger for mine sites than unmined sites, although the diameter and height exponent parameters were larger for unmined sites. This could indicate an increase in diameter and height results in less exponential increase in stem biomass for mined sites than unmined sites, and that any difference in stem biomass between mined and unmined sites occur to the greatest extent at a young age. Also, height, diameter, and age are more correlated on relatively small reclaimed mine sites compared to the entire range of loblolly pine, as would be expected. The stem model which does not incorporate age seems to account for decreasing taper with increasing age because it models an exponential relationship between height and stem biomass. The relationship between height and stem biomass is typically more linear in these models [31,35]. Although unmined predictions of stem volume were never greater than mined predictions, the relative difference decreased with an increase in diameter. This indicates that stem volume for the smallest trees are the most underestimated by use of unmined volume equations, although these differences were fairly small on an absolute basis as these trees were less than 0.1 m3 in volume and 10 cm in DBH.
Feduccia and Mann [69] found no correlation between loblolly pine bark thickness, site index, and initial planting density, but bark thickness was linearly correlated to DBH. The ratio of volume inside bark to volume outside bark for mine site sample trees averaged 8% greater than the ratio for unmined trees of the same diameter classes reported by Feduccia and Mann [69]. Sherrill [70] found no treatment effect on bark thickness, and only tree size and genetics had any effect. The decrease in bark ratio seems unlikely to be related to the decrease in stem taper also found when comparing mined and unmined stem volume. The related decrease in bark thickness could increase susceptibility to fire damage. Hare [71] found within species tree size was the most important factor affecting fire resistance followed by bark thickness. A positive impact of decreased bark thickness is more useful wood content and less waste.
4.2.3. Roots
As soil compaction between mined and unmined sites does not differ in east Texas [18] and mining may reduce compaction at soil depths of 15 to 30 cm compared to previously farmed unmined land, it is important to consider that mined site rooting depth may be greater than on unmined sites. Our method of root excavation involved reaching the maximum rooting depth for about half of the samples. Other studies can follow a similar approach to ensure root sampling efficiency. Roots in the coarse root pits are sufficiently near to the taproot to illustrate an average rooting depth for a single tree. We measured these depths in fairly accurate 10 cm layers and were able to determine rooting depth is significantly correlated both age and tree height (R2 > 0.70), as well as root biomass (R2 = 0.98). This is not unexpected as soils on reclaimed mineland in east Texas are generally thought to have no depth limiting layers such as plowing hard pans or rocky substrates. Further emphasizing this point is the complete lack of correlation (p = 0.95) between relative height growth and relative rooting depth. The range of conditions found did not limit rooting depth to a point that became height limiting. Soil compaction may be present, but did not increase with depth as no negative effects on rooting depth were detected. Relative height growth and site index were not related to any relative root growth metric (p > 0.1). This does not indicate which resources are limiting growth, only that the resource limitation is not due to impeded root growth.
Applicability of Root Models
The root biomass models presented in this research had a specific location and range of applicability and should be used for other mine sites with caution. The models only incorporate DBH and the sample size was too small to ensure that model predictions would be accurate even on nearby reclaimed mineland. To our knowledge, there are no widely applicable root biomass prediction models for loblolly pine at an individual tree level. Also, there were no studies on root biomass models specifically for east Texas. Therefore no comparisons of model parameters or root biomass at the tree level could be made between mined and unmined land.
Sampled Root Biomass
Although root:shoot allometric relationships are generally consistent for loblolly pine [25,27], other allometric models can differ due to treatment effects. We found the relationship between DBH and taproot biomass was not constant under different thinning conditions. As DBH increased, thinned stands experienced a slightly greater amount of taproot biomass accumulation than unthinned stands. However, thinned and unthinned stands showed no difference in response to an increase in DBH for total root biomass, which indicates thinning only elicits a response to partitioning within the root system and not between above and belowground biomass. This could indicate a response to increased structural pressure (i.e., wind resistance [72]) or simply a result of allometric partitioning which was only detected in taproot biomass as taproot biomass does not depend on scaling. Increasing belowground biomass relative to diameter is reasonable as thinning typically increases aboveground biomass relative to DBH (e.g., decreased taper, greater branch biomass, larger crowns [37,68]). Similar changes in root structure due to thinning has been observed in many other species [73]. Structural purposes are a likely cause given physical changes trees experience following thinning. Also, an increase in resources needed to support expanding crown components transported through taproot biomass could necessitate greater root volume directly below the stump. Albaugh, et al. [74] showed an increase in taproot biomass proportion from age 8 to age 16. The proportion of taproot biomass in our study was correlated to height and age. Given that our sample pits were fixed sizes (i.e., taproot was always 0.785 m2 whereas coarse root area increased as TPH decreased), it is possible that taproot biomass was under sampled and coarse root biomass was over sampled for the largest trees. For example, the proportion of taproot biomass changed with age and seemed to reach a constant of 60% of total root biomass and may have begun to decrease. This decrease in taproot proportion seems to be due to the large amount of root mass directly beneath the tree expanding outside of the 0.5 m radius allowed for the taproot sample pit and perhaps into the coarse root sample pit starting at 0.7 m from the tree. The oldest and largest sample tree contained only 40% of total root biomass in the taproot sample pit, which indicates the need for variable pit sizes and distances from the sample tree. By using variable coarse root pit distances from the tree, as a function of basal diameter or density, a stronger relationship between taproot proportion and age may be found.
4.3. Stand Level Biomass and Volume
The greater individual tree biomass and volume of reclaimed mineland trees led to per hectare productivity similar to unmined sites. Assuming C content is 50% of biomass, our second hypothesis appears unsupported as both individual trees and stands of loblolly pine grown on reclaimed mineland have similar or greater biomass compared to unmined stands. Carbon sequestration in pine biomass is therefore similar between mined and unmined sites. Stand level productivity is affected by density, which is distinctly lower on these reclaimed minelands. The non-linear increase in stem volume from increased height (as indicated by exponent parameters greater than 1, Table 3) additionally supports individual tree productivity dampens effects of lower density from thinning or mortality. Our analysis determined productivity could be similar to unmined sites in east Texas and therefore similar to productivity prior to mining; however, a study on unmined sites subjected to similar density changes throughout the life of the stand would be necessary to truly compare mined and unmined productivity on an area basis. Even if such a study were possible, it would likely be confounded by significant differences in the amount of competing vegetation, which is generally much less of a problem on reclaimed mine sites. Subsequent rotations on reclaimed mineland will more accurately reveal long-term impacts of mining on productivity. Initial mortality in later rotations should not be as severe as initial mortality for planting which occurs immediately after mining and reclamation, since many soil processes and properties are restored in the first rotation [2,12].
5. Conclusions
We determined loblolly pine allometry on reclaimed mineland is altered from an unmined allometric model synthesized from multiple studies by Coyle, et al. [25]. The results indicate biomass partitioning to belowground components is increased on mine sites in east Texas, especially for young trees. This is evidence of loblolly pine responding to environmental stress (which were not determined through the course of this study) with increased root growth. Beyond age 10, partitioning differences between mined and unmined sites diminish. This seems in accordance with a number of studies on reclaimed mineland which indicate many site attributes are changed and soil processes are disrupted, but much of these conditions are corrected within 10–20 years [2,12,19,75]. Our second hypothesis was not supported; C sequestration in woody biomass is similar between mine sites in east Texas and unmined datasets both local and regional. Productivity is similar in terms of volume production and TAGB biomass at the stand level. Individual tree prediction equations reveal trees on reclaimed mineland generally have greater biomass and volume than unmined sites. These models can be utilized by reclamation managers to quantify forest resources on reclaimed mineland.
Acknowledgments
The authors thank the Luminant Environmental Research Program for providing funding and logistical support for this research project. We also thank the Arthur Temple College of Forestry and Agriculture and Jason Grogan for assisting with field data collection. We further thank the many undergraduate student workers who assisted in the field and in the lab, especially Bryent Daugherty.
Author Contributions
Jeremy Priest coordinated and collected data in the field and laboratory, performed statistical analyses, and prepared the bulk of this manuscript. Jeremy Stovall supervised all aspects of the experimental design, data collection, statistical analyses, and manuscript preparation. Dean Coble provided guidance with statistical analyses and helped with writing. Brian Oswald and Hans Williams developed the experimental design, reviewed statistical analyses, and helped with writing.
Conflicts of Interest
This research was funded by the Luminant Environmental Research Program, which is sponsored by Luminant, a subsidiary of Energy Future Holdings Corp. The Research Program and its autonomous steering committee do not control or direct the results of any funded research. Hans Williams is a member of the steering committee.
References
- Kundu, N.; Ghose, M. Soil profile characteristic in rajmahal coalfield area. Indian J. Soil Water Conserv. 1997, 25, 28–32. [Google Scholar]
- Sheoran, V.; Sheoran, A.; Poonia, P. Soil reclamation of abandoned mine land by revegetation: A review. Int. J. Soil Sediment Water 2010, 3, 13. [Google Scholar]
- Jacinthe, P.-A.; Lal, R. Carbon storage and minesoil properties in relation to topsoil application techniques. Soil Sci. Soc. Am. J. 2007, 71, 1788–1795. [Google Scholar] [CrossRef]
- Burger, J.; Rodrigue, J. Carbon inventory of reforested mined lands in the eastern United States: Preliminary results. In Proceedings of the DOE/NETL, 2nd Annual Conference on Carbon Sequestration, Alexandria, VA, USA, 6 May 2003.
- Ussiri, D.A.; Lal, R. Carbon sequestration in reclaimed minesoils. Crit. Rev. Plant Sci. 2005, 24, 151–165. [Google Scholar] [CrossRef]
- Blake, C.A. The Potential for Carbon Sequestration in Soils on Lignite Coal Minelands in East Texas. Master’s Thesis, Stephen F. Austin State University, Nacogdoches, TX, USA, December 2003. [Google Scholar]
- Morton, J.D. The Influence of Stand Density on Rate of Carbon Sequestration in Loblolly Pine Plantations on Mined Lands in East Texas. Master’s Thesis, Stephen F. Austin State University, Nacogdoches, TX, USA, 2002. [Google Scholar]
- Amichev, B.Y.; Burger, J.A.; Rodrigue, J.A. Carbon sequestration by forests and soils on mined land in the midwestern and appalachian coalfields of the US. For. Ecol. Manag. 2008, 256, 1949–1959. [Google Scholar] [CrossRef]
- Burger, J. Sustainable mined land reclamation in the eastern US coalfields: A case for an ecosystem reclamation approach. In Proceedings of the National Meeting of the American Society of Mining and Reclamation, Bismark, ND, USA, 15 June 2011; Barnhisel, R., Ed.; pp. 113–141.
- Herlihy, A.T.; Kaufmann, P.R.; Mitch, M.E.; Brown, D.D. Regional estimates of acid mine drainage impact on streams in the mid-atlantic and southeastern United States. Water Air Soil Pollut. 1990, 50, 91–107. [Google Scholar] [CrossRef]
- Akcil, A.; Koldas, S. Acid mine drainage (AMD): Causes, treatment and case studies. J. Clean. Prod. 2006, 14, 1139–1145. [Google Scholar] [CrossRef]
- Ng, J. Recovery of Carbon and Nitrogen Cycling and Microbial Community Functionality in a Post-Lignite Mining Rehabilitation Chronosequence in East Texas. Ph.D. Thesis, Texas A&M University, TX, USA, 2012. [Google Scholar]
- Barth, A.K. Land Capability Classification of Minesoils in East Texas. Master’s Thesis, Texas A&M University, College Station, TX, USA, 2002. [Google Scholar]
- Bryson, H.L. Early Survival and Total Height, and Foliar Analyses of Eleven Tree Species Grown on Strip-Mine Spoils in Freestone County, Texas. Master’s Thesis, Stephen F. Austin State University, Nacogdoches, TX, USA, 1973. [Google Scholar]
- Angel, P.N. A Soil Analysis of the Strip Mine Spoil Bank at Fairfield, Texas. Master’s Thesis, Stephen F. Austin State University, Nacogdoches, TX, USA, 1973. [Google Scholar]
- Hewitt, C.D. Hydraulic Properties of the Saturated Zone of a Reclaimed Lignite Surface Mine, East Texas. Master’s Thesis, University of Texas at Austin, Austin, TX, USA, 1990. [Google Scholar]
- RCT. Martin Lake Mine Permit 4j Renewal/Revision; Surface Mining and Reclamation Division: Austin, TX, USA, 2009; pp. 1–15. [Google Scholar]
- Toups, B.G. Comparison of Site Quality for Loblolly Pine on Selected Mined and Non-Mined Soils in Panola County, Texas. Master’s Thesis, Stephen F. Austin State University, Nacogdoches, TX, USA, 1986. [Google Scholar]
- Christian, C.L. Vegetative Community Development on Reclaimed Lignite Coal Mine Land in East Texas. Master’s Thesis, Stephen F. Austin State University, Nacogdoches, TX, USA, 2013. [Google Scholar]
- Priest, J.S.; Stovall, J.P.; Coble, D.W. The effects of surface lignite mining on loblolly pine plantation site index. For. Sci. 2015. submitted. [Google Scholar]
- King, J.; Albaugh, T.; Allen, H.; Kress, L. Stand-level allometry in Pinus taeda as affected by irrigation and fertilization. Tree Physiol. 1999, 19, 769–778. [Google Scholar] [CrossRef] [PubMed]
- Ledig, F.T.; Bormann, F.H.; Wenger, K.F. The distribution of dry matter growth between shoot and roots in loblolly pine. Bot. Gazette 1970, 131, 349–359. [Google Scholar] [CrossRef]
- Gedroc, J.; McConnaughay, K.; Coleman, J. Plasticity in root/shoot partitioning: Optimal, ontogenetic, or both? Funct. Ecol. 1996, 10, 44–50. [Google Scholar] [CrossRef]
- Drew, A.; Ledig, F.T. Episodic growth and relative shoot: Root balance in loblolly pine seedlings. Ann. Bot. 1980, 45, 143–148. [Google Scholar]
- Coyle, D.R.; Coleman, M.D.; Aubrey, D.P. Above-and below-ground biomass accumulation, production, and distribution of sweetgum and loblolly pine grown with irrigation and fertilization. Can. J. For. Res. 2008, 38, 1335–1348. [Google Scholar] [CrossRef]
- Retzlaff, W.; Handest, J.; O’Malley, D.; McKeand, S.; Topa, M. Whole-tree biomass and carbon allocation of juvenile trees of loblolly pine (Pinus taeda): Influence of genetics and fertilization. Can. J. For. Res. 2001, 31, 960–970. [Google Scholar] [CrossRef]
- Albaugh, T.J.; Allen, H.L.; Kress, L.W. Root and stem partitioning of Pinus taeda. Trees 2006, 20, 176–185. [Google Scholar] [CrossRef]
- Reich, P.B. Root-shoot relations: Optimality in acclimation and adaptation or the “emperor’s new clothes”? In Plant Roots: The Hidden Half, 3rd ed.; Waisel, Y., Eshel, A., Beeckman, T., Kafkafi, U., Eds.; Taylor & Francis: Boca Raton, FL, USA, 2002; pp. 314–338. [Google Scholar]
- Baldwin, V., Jr. Is sapwood area a better predictor of loblolly pine crown biomass than bole diameter? Biomass 1989, 20, 177–185. [Google Scholar] [CrossRef]
- Parresol, B.R. Assessing tree and stand biomass: A review with examples and critical comparisons. For. Sci. 1999, 45, 573–593. [Google Scholar]
- Gonzalez-Benecke, C.A.; Gezan, S.A.; Albaugh, T.J.; Allen, H.L.; Burkhart, H.E.; Fox, T.R.; Jokela, E.J.; Maier, C.A.; Martin, T.A.; Rubilar, R.A. Local and general above-stump biomass functions for loblolly pine and slash pine trees. For. Ecol. Manag. 2014, 334, 254–276. [Google Scholar] [CrossRef]
- Baldwin, V.; Feduccia, D. Compatible tree-volume and upper-stem diameter equations for plantation loblolly pines in the west gulf region. South. J. Appl. For. 1991, 15, 92–97. [Google Scholar]
- Baldwin, V. Green and dry-weight equations for above-ground components of planted loblolly pine trees in the west gulf region. South. J. Appl. For. 1987, 11, 212–218. [Google Scholar]
- Chojnacky, D.C.; Heath, L.S.; Jenkins, J.C. Updated generalized biomass equations for north american tree species. Forestry 2014, 87, 129–151. [Google Scholar] [CrossRef]
- Coble, D.W.; Hilpp, K. Compatible cubic-foot stem volume and upper-stem diameter equations for semi-intensive plantation grown loblolly pine trees in east Texas. South. J. Appl. For. 2006, 30, 132–141. [Google Scholar]
- Lenhart, J.D.; Hackett, T.L.; Laman, C.J.; Wiswell, T.J.; Blackard, J.A. Tree content and taper functions for loblolly and slash pine trees planted on non-old-fields in east Texas. South. J. Appl. For. 1987, 11, 147–151. [Google Scholar]
- Naidu, S.L.; DeLucia, E.H.; Thomas, R.B. Contrasting patterns of biomass allocation in dominant and suppressed loblolly pine. Can. J. For. Res. 1998, 28, 1116–1124. [Google Scholar] [CrossRef]
- Joosten, R.; Schumacher, J.; Wirth, C.; Schulte, A. Evaluating tree carbon predictions for beech (Fagus sylvatica L.) in western germany. For. Ecol. Manag. 2004, 189, 87–96. [Google Scholar] [CrossRef]
- Ritson, P.; Sochacki, S. Measurement and prediction of biomass and carbon content of Pinus pinaster trees in farm forestry plantations, south-western Australia. For. Ecol. Manag. 2003, 175, 103–117. [Google Scholar] [CrossRef]
- National Oceanic and Atmospheric Administration (NOAA). 1981–2010 normals: Carthage, TX, USA. Available online: http://www.ncdc.noaa.gov/cdo-web/datatools/normals (accessed on 12 November 2014).
- Dolezel, R. Soil Survey of Panola County, Texas; United States Department of Agriculture, Soil Conservation Service: Washington, DC, USA, 1975. [Google Scholar]
- Sencindiver, J.; Ammons, J. Minesoil genesis and classification. In Reclamation of Drastically Disturbed Lands; Soil Science Society of America: Madison, WI, USA, 2000; Chapter 23; pp. 595–613. [Google Scholar]
- Kraft, G. Beiträge zur lehre von den Durchforstungen, Schlagstellungen und Lichtungshieben; Klindeorth: Hannover, Germany, 1884. [Google Scholar]
- Levillain, J.; M’bou, A.T.; Deleporte, P.; Saint-André, L.; Jourdan, C. Is the simple auger coring method reliable for below-ground standing biomass estimation in eucalyptus forest plantations? Ann. Bot. 2011, 108, 221–230. [Google Scholar] [CrossRef] [PubMed]
- Stovall, J.P.; Fox, T.R.; Seiler, J.R. Allometry varies among 6-year-old Pinus taeda (L.) clones in the virginia piedmont. For. Sci. 2013, 59, 50–62. [Google Scholar] [CrossRef]
- Macinnis-Ng, C.; Fuentes, S.; O’Grady, A.; Palmer, A.; Taylor, D.; Whitley, R.; Yunusa, I.; Zeppel, M.; Eamus, D. Root biomass distribution and soil properties of an open woodland on a duplex soil. Plant Soil 2010, 327, 377–388. [Google Scholar] [CrossRef]
- Samuelson, L.J.; Johnsen, K.; Stokes, T. Production, allocation, and stemwood growth efficiency of Pinus taeda L. Stands in response to 6 years of intensive management. For. Ecol. Manag. 2004, 192, 59–70. [Google Scholar] [CrossRef]
- Samuelson, L.J.; Stokes, T.A.; Butnor, J.R.; Johnsen, K.H.; Gonzalez-Benecke, C.A.; Anderson, P.; Jackson, J.; Ferrari, L.; Martin, T.A.; Cropper, W.P. Ecosystem carbon stocks in Pinus palustris forests. Can. J. For. Res. 2014, 44, 476–486. [Google Scholar] [CrossRef]
- Albaugh, T.J.; Allen, H.L.; Dougherty, P.M.; Kress, L.W.; King, J.S. Leaf area and above-and belowground growth responses of loblolly pine to nutrient and water additions. For. Sci. 1998, 44, 317–328. [Google Scholar]
- Miller, A.T.; Allen, H.L.; Maier, C.A. Quantifying the coarse-root biomass of intensively managed loblolly pine plantations. Can. J. For. Res. 2006, 36, 12–22. [Google Scholar] [CrossRef]
- Avery, T.E.; Burkhart, H.E. Forest Measurements; McGraw-Hill Book Company: Boston, MA, USA, 1983. [Google Scholar]
- Schreuder, H.T.; Williams, M.S.; Forest, R.M. Weighted Linear Regression Using D2H and D2 as the Independent Variables; USDA Forest Service: Fort Collins, CO, USA, 1998. [Google Scholar]
- Poorter, H.; Sack, L. Pitfalls and possibilities in the analysis of biomass allocation patterns in plants. Front. Plant Sci. 2012, 3. [Google Scholar] [CrossRef] [PubMed]
- Coble, D.W.; Lee, Y.-J.; Lenhart, J.D. Project Report No. 66, Metric Volume and Biomass Prediction Equations for Loblolly and Slash Pine Trees Planted in Unmanaged Pine Plantations in East Texas; Stephen F. Austin State University: Nacogdoches, TX, USA, 2004; Available online: http://scholarworks.sfasu.edu/etpprp_project_reports/4/ (accessed on 9 September 2015).
- Coble, D.W. A new whole-stand model for unmanaged loblolly and slash pine plantations in east Texas. South. J. Appl. For. 2009, 33, 69–76. [Google Scholar]
- Coble, D.W.; Pendergast, K. Project Report No. 69, Observed Growth and Yield of Loblolly and Slash Pine Plantations in East Texas; Stephen F. Austin State University: Nacogdoches, TX, USA, 2014; Available online: http://scholarworks.sfasu.edu/etpprp_project_reports/10/ (accessed on 9 September 2015).
- Doruska, P.F.; Nolen, W.R. Use of stand density index to schedule thinnings in loblolly pine plantations: A spreadsheet approach. South. J. Appl. For. 1999, 23, 21–29. [Google Scholar]
- Stovall, J.P.; Fox, T.R.; Seiler, J.R. Short-term changes in biomass partitioning of two full-sib clones of Pinus taeda L. Under differing fertilizer regimes over 4 months. Trees-Struct. Funct. 2012, 26, 1–11. [Google Scholar] [CrossRef]
- Bryson, H.L. Pisolithus Tinctorius Mycobiont Inocluations as A Factor in Performance of Containerized and Bare-Root Shortleaf Pine Seedlings on Lignite Minesoils in Panola County, Texas. Master’s Thesis, Stephen F. Austin State University, Nacogdoches, TX, USA, 1980. [Google Scholar]
- McGuire, M.A. Effects of Stock Type, Tall Nursery Fertilization and Ectomycorrhizal Innoculation on Survival of Longleaf Pine (Pinus palustris Mill.) Seedlings Planted on Lignite Minespoil. Master’s Thesis, Stephen F. Austin State University, Nacogdoches, TX, USA, 1998. [Google Scholar]
- McCallister, D.L. Alteration of Exchangeable Cation Distribution and Associated Chemical Changes in Acidifying Surface Mined Soils. Master’s Thesis, Texas A&M University, College Station, TX, USA, 1981. [Google Scholar]
- Nelson, J.P. Dynamics of Litter and Soil Microarthropod Communities during the Reclamation Process. Master’s Thesis, University of Texas at Arlington, Arlington, TX, USA, 1989. [Google Scholar]
- Swanson, E.S. Soil Microbial Biomass: An Estimator of Soil Development in Reclaimed Lignite Mine Soil. Master’s Thesis, Texas A&M University, College Station, TX, USA, 1996. [Google Scholar]
- Yao, L. Effects of Compaction on Reclamation of Surface Mined Lands in East Texas. Master’s Thesis, Texas A&M University, College Station, TX, USA, 1994. [Google Scholar]
- VanderSchaaf, C. Compatible stem taper and total tree volume equations for loblolly pine plantations in southeastern Arkansas. J. Ark. Acad. Sci. 2008, 62, 103. [Google Scholar]
- Clark, A., III; Souter, R.A. Stem Cubic-Foot Volume Tables for Tree Species in the South; United States Department of Agriculture, Forest Service, Southeastern Forest Experiment Station: Asheville, NC, USA, 1994; p. 252. [Google Scholar]
- Baldwin, V.; Feduccia, D. Loblolly Pine Growth and Yield Prediction for Managed West Gulf Plantations; USDA Forest Service research paper SO-Southern Forest Experiment Station (USA): New Orleans, LA, USA, 1987. [Google Scholar]
- Baldwin, V.C., Jr.; Peterson, K.D.; Clark, A.; Ferguson, R.B.; Strub, M.R.; Bower, D.R. The effects of spacing and thinning on stand and tree characteristics of 38-year-old loblolly pine. For. Ecol. Manag. 2000, 137, 91–102. [Google Scholar] [CrossRef]
- Feduccia, D.P.; Mann, W.F. Bark Thickness of 17-Year-Old Loblolly Pine Planted at Different Spacings; United States Department of Agriculture, Forest Service, Southern Forest Experiment Station: New Orleans, LA, USA, 1976; Volume 210. [Google Scholar]
- Sherrill, J. Genetic and Cultural Effects on Stem Taper and Bark Thickness in Loblolly Pine (Pinus taeda L.). Master’s Thesis, North Carolina State University, Raleigh, NC, USA, 2005. [Google Scholar]
- Hare, R.C. Contribution of bark to fire resistance of southern trees. J. For. 1965, 63, 248–251. [Google Scholar]
- Stokes, A.; Nicoll, B.C.; Coutts, M.P.; Fitter, A.H. Responses of young sitka spruce clones to mechanical perturbation and nutrition: Effects on biomass allocation, root development, and resistance to bending. Can. J. For. Res. 1997, 27, 1049–1057. [Google Scholar] [CrossRef]
- Nicoll, B.C.; Ray, D. Adaptive growth of tree root systems in response to wind action and site conditions. Tree Physiol. 1996, 16, 891–898. [Google Scholar] [CrossRef] [PubMed]
- Albaugh, T.J.; Allen, H.L.; Dougherty, P.M.; Johnsen, K.H. Long term growth responses of loblolly pine to optimal nutrient and water resource availability. For. Ecol. Manag. 2004, 192, 3–19. [Google Scholar] [CrossRef]
- Jones, A.T.; Galbraith, J.M.; Burger, J.A. Development of a forest site quality classification model for mine soils in the appalachian coalfield region. In Proceedings of the 22nd Meeting of the American Society of Mining and Reclamation, Breckenridge, CO, USA, 20 June 2005.
© 2015 by the authors; licensee MDPI, Basel, Switzerland. This article is an open access article distributed under the terms and conditions of the Creative Commons Attribution license (http://creativecommons.org/licenses/by/4.0/).