Article

Variation in Wood Quality in White Spruce (Picea Glauca (Moench) Voss). Part I. Defining the Juvenile–Mature Wood Transition Based on Tracheid Length

1
Chaire de Recherche du Canada en Valorisation, Caractérisation et Transformation du Bois, Université du Québec en Abitibi-Témiscamingue, 445 boul. de l'Université, Rouyn-Noranda, Québec, QC J9X-5E4, Canada
2
Natural Resources Canada, Canadian Forest Service, Canadian Wood Fibre Centre, 1055 du PEPS, P.O. Box 10380, Stn Sainte Foy, Québec, QC G1V-4C7, Canada
3
Sciences du Bois et de la Forêt, Faculté de Foresterie, de Géographie et de Géomatique, Pavillon Gene-H. -Kruger, bureau 1376C, Université Laval, 2425 rue de la Terrasse, Québec, QC G1V-0A6, Canada
4
Centre d'étude de la Forêt, Université du Québec en Abitibi-Témiscamingue, 445 boul. de l'Université, Rouyn-Noranda, Québec, QC J9X-5E4, Canada
*
Author to whom correspondence should be addressed.
Forests 2015, 6(1), 183-202; https://doi.org/10.3390/f6010183
Submission received: 8 November 2014 / Accepted: 19 December 2014 / Published: 8 January 2015

Abstract

:
Estimations of transition age (TA) and juvenile wood proportion (JWP) are important for wood industries due to their impact on end-product quality. However, the relationships between analytical determination of TA based on tracheid length (TL) and recognized thresholds for adequate end products have not yet been established. In this study, we used three different statistical models to estimate TA in white spruce (Picea glauca (Moench) Voss) based on TL radial variation. We compared the results with technological maturity. A two-millimeter threshold, previously suggested for good paper tear strength, was used. Tracheid length increased from pith to bark and from breast height to upper height. Juvenile wood (JW) was conical with the three models. At breast height, TA ranged from 11 to 27 years and JWP ranged from 15.3% to 47.5% across the three models. The linear mixed model produced more conservative estimates than the maximum-quadratic-linear (M_Q_L) model. Both the linear mixed model and the M_Q_L model produced more conservative TA estimates than the piecewise model. TA estimates by the MIXED model, and to a lesser extent by the M_Q_L model, were equivalent to those for real mature wood, whereas TA estimates by the piecewise model were considerably lower, falling into the transition wood area.

1. Introduction

White spruce (Picea glauca (Moench) Voss) is widely distributed across North America. Its territory extends from Newfoundland, Labrador, and northern Quebec in the east to west across Canada along the northern tree limit to northwestern Alaska and south to southwestern Alaska, southern British Columbia, southern Alberta, northwestern and southeastern Manitoba, central Minnesota, central Michigan, southern Ontario, northern New York, and Maine [1]. The wood is valuable for both lumber and pulpwood, and is therefore of vital economic importance. In eastern Canada, substantial artificial regeneration programs as well as tree improvement research and breeding programs have targeted this species. Large-scale reforestation with fast-growing genotypes is likely to shorten rotations in the near future, which may produce an increase in the proportion of juvenile wood (JW; all acronyms used in this text are listed in Table 1), characterized by progressive changes in fiber and wood properties [2]. Compared to mature wood (MW), JW is composed of smaller, shorter tracheids with thinner walls, larger microfibril angles, larger spiral grain angles, lower tangential and higher longitudinal shrinkage, lower holocellulose and alpha cellulose content, higher lignin and hemicellulose content, and lower strength properties [3]. All these characteristics cause problems, including drying issues, warping, and low stiffness, which reduce the utility of JW, especially for the solid wood industry [3,4].
Table 1. Acronyms used in the text and their descriptions.
AcronymDescription
BABasal area
CACambial age
JWJuvenile wood
JWPJuvenile wood proportion
JWVJuvenile wood volume
JWR (JWRh)Juvenile wood radius (at a given height h)
M_Q_LMaximum-quadratic-linear
MWMature wood
RMSERoot-mean-squared error
TATransition age
TLAverage ring tracheid length
WQAWood quality attributes
JW is formed under the strong regulatory influence of the active living crown, where growth hormones, particularly indole-3-acetic acid (IAA, auxin), are synthesized [5]. Therefore, trees with a deep crown as well as the top of all trees are generally assumed to be composed entirely of JW [6,7]. The first step in characterizing JW is to determine the transition age (TA) from JW to MW. The radial variation patterns of several wood quality attributes (WQA) have been used to distinguish between JW and MW [3]. However, the estimated TA for a given species depends on the WQA and the analytical method [8,9]. Thus, TA varies with WQA and the estimation method. For conifers, reported TA ranges from cambial age (CA) 10 to 20 years [3]. From an industrial standpoint, TA estimates are useful for determining the appropriate timing for harvesting to ensure optimum processing and end-product quality.
Pith-to-bark variation profiles in WQA such as ring density, fiber length, fibril angle, longitudinal shrinkage, ring width, and latewood proportion are generally described in terms of JW and MW zones, and are used to estimate TA. However, as mentioned above, the estimated TA varies with WQA [10,11,12,13] and the analytical method [8,9]. In addition, for a given species, TA varies with tree height [14,15] and across locations [16].
Several methods to estimate TA have been proposed, including visual examination of pith-to-bark profiles over the tree age [17], mathematical approaches such as the Gompertz function [11], and segmented regression techniques [10,18,19,20,21]. Other methods include curve-fitting routines that produce a unique polynomial model from each pith-to-bark profile (e.g., [13,22]). Iterative and constrained solutions have also been used to determine the JW–MW demarcation in loblolly pine trees [21]. Visual estimation is a simple and commonly used method to estimate TA [23] and to verify [8] the results of other analytical procedures, but it has the drawbacks of arbitrariness and lack of scientific reliability. Segmented models provide more reliable scientific results, but they do not account for the autocorrelation in successive growth rings [17,19]. Polynomial regressions generally provide a good fit to many WQA, and they can address autocorrelation with a mixed model [13]. However, they provide a simplistic approximation that lacks biological significance.
For conifers, the estimated TA is generally similar across methods, usually varying from CA 10 to 20 years, which has been proposed as reasonable for this range [3]. Only a few studies [8,9,24] have compared analytical methods for determining TA, shedding light on analytical estimates of maturity with a given WQA using certain mathematical models. However, as the end user of the timber supply, the wood industry must understand that maturation is not just a given age determined by a given function: in more practical terms, it is the age at which the supply becomes technologically mature, or qualitatively compatible with the envisioned end product.
Problems in interpreting biological patterns as well as the multiplicity of TA models can generate confusion. To respond to these issues, Cown [25] proposed basing TA estimation on technological thresholds for WQA. One such threshold has been used for wood density [25], a property closely related to solid wood physical and mechanical properties and fiber product yield. Tracheid length (TL) is an important WQA for paper products because it has a significant impact on the quality of pulp and paper and fiber-based products such as wood-plastic composites and fiberboards. In addition, the TL radial pattern of variation clearly defines the JW and MW zones. A TL threshold could be useful for both optimizing fiber product properties and for determining the JW–MW demarcation. However, because TL requirements change with the end product, it is difficult to define these thresholds in raw material. A two millimeter threshold has been suggested [26,27,28] for good paper tear strength, but this would require much longer tracheids in the raw material, as the length diminishes drastically during pulping. A reduction rate ranging from 8% to 45%, depending on the pulp refining method, was reported for black spruce (Picea mariana (Mill.) B.S.P) thermomechanical pulp [29]. Although JW can be acceptable or even preferable for writing paper, tissue, and newsprint [30], it is unsuitable for paper that requires high tear strength, and its proportion must be carefully controlled in both Kraft [31] and high-yield [31] pulping.
Previous studies have determined TA with two or more models, using maximum ring density and ring area [24], microfibril angle [8], and modulus of elasticity [9]. However, no study to date has compared the analytical results of TA obtained with TL. Although TA can be reliably estimated using most WQA, the use of TL provides certain advantages. TL radial variation is more consistent and less sensitive to growth rate variation than other WQA, such as specific gravity [32]. On the other hand, measuring TL is time-consuming and expensive [33]. The available data on estimated TA using TL for various species are presented in Table 2.
The objective of this study was to estimate tracheid length (TL) juvenile wood (JW) to mature wood (MW) transition age (TA) and the JW proportion (JWP) in white spruce (Picea glauca (Moench) Voss) using three different approaches.
Table 2. Reported transition age (TA) with tracheid length (TL).
Main Transition MethodTransition Age Value (Years)SpeciesSource
Piecewise18Lodgepole pineMansfield, et al. [34]
Piecewise14Jack pineFujiwaraand Yang [35]
Piecewise20Balsam firFujiwaraand Yang [35]
Piecewise12–19White spruceFujiwaraand Yang [35], Yang [36]
Piecewise11–21Black spruceFujiwaraand Yang [35], Yang [36], Yangand Hazenberg [37]
Piecewise10–18Loblolly pineBendtsenand Senft [4], Loo, Tauerand McNew [10]
Visual16–18Scots pineFries, Ericssonand Morling [33]
Visual18–20Norway spruceKučera [15]
Visual15Douglas-firEricksonand Harrison [38]

2. Material and Methods

2.1. Sample Collection

We used material from 30 trees taken from a plantation established in 1936 in the Petawawa Research Forest, Ontario, Canada (lat. 45.59°N, long. 77.25°W, elev. 168 m). The initial stocking was 3068 trees/ha (1.8 m × 1.8 m spacing). The plantation had undergone three thinning treatments and a control. Heavy, medium, and light thinning intensities had been applied, for a target basal area (BA) of 18, 25, and 32 m2/ha, respectively. For each target BA, three thinning operations had been conducted, in 1962, 1972, and 1982. In 2002, the BA in the control plot was 44 m2/ha. Eight trees (two dominant, four codominant, and two suppressed) were randomly selected in the heavy and light thinning intensities. Seven trees (two dominant, four codominant, and one suppressed) were randomly selected in the medium thinning intensity, and seven trees (two dominant, three codominant, and two suppressed) were randomly selected in the control plot, for a total of 30 trees. Sampled trees were limited to those with undamaged crowns [39]. Trees were felled in July 2008 and pruned once on the ground. Discs were collected at 1.3 m (breast height, BH) from all sampled trees. A subset of five trees (one dominant, three codominant, and one suppressed) felled from the whole plantation was also sampled at 1.3 m, 4.3 m, 7.3 m, 10.3 m, and 13.3 m for longitudinal description of TL and TA estimation. The limited size of this longitudinal sample was due to TL measurement issues. Although this sampling size is not representative of the trend for the entire tree species, we believe that it provides a good idea of the variations that can occur in measured and estimated properties. The mean tree height of the sampled trees was 21.1 m (15.0–32.9 m), and diameter at breast height below the bark, measured with an electronic digital caliper, was 26.8 cm (15.0–39.4 cm). Tree characteristics are presented in Table 3.
Table 3. Tree characteristics.
Tree IDTree Age (Years)Tree Height (m)Clear Bole Length (m)Crown Length (m)Diameter at Breast Height (cm)
Stand averages
All trees (mean)7221.114726.8
Subset of five trees sampled longitudinally
17225.116.28.939.4
2722316.36.728.3
3722012.17.923.4
47219.313.55.821.5
57221.815.8623.2

2.2. Sample Preparation and Wood Quality Attributes

Two 1.86 mm (tangential) adjacent strips centered on the pith were sawn bark to bark from each disc. One radius per strip was carefully selected for analysis. The direction of sampling was random. Compression wood and knots were avoided. The first strip per disc was used to measure growth-related features. Annual ring width (RW), earlywood width, and latewood width were measured at a linear resolution step size of 25 µm using an X-ray densitometer (QTRS-01X, Quintek Measurement Systems, Knoxville, TN, USA). The boundary between earlywood and latewood was delineated using the maximum derivative method [40]. Wood sticks from earlywood and latewood were taken at 3, 6, 9, 12, 15, 20, 25, 30, 35, 40, and 45 CA from the second wood strip. It is important to note that samples were collected at fixed CA and not at determined calendar years. This sampling strategy is a relevant issue when describing anatomical features [41]. Wood sticks were macerated using a Franklin [42] solution consisting of (1:1 v/v) hydrogen peroxide diluted to 30% and concentrated glacial acetic acid. Each stick was placed in a test tube, immersed in the Franklin solution, and kept in hot distilled water (85–90 °C) for 5 to 6 hours until complete lignin dissolution. The delignified wood stick was gently shaken in water with a laboratory blender to obtain a tracheid suspension. Earlywood tracheid length and latewood tracheid length were measured with a Fiber Quality Analyzer (LDA02 FQA, Op Test Equipment Inc., Hawkesbury, Ontario, Canada). In all, 4000 tracheids were measured for each sample. Tracheid length in each zone was measured as weight weighted length. LWW = ΣniLi3niLi2 (where i = 1, 2, 3 …n categories; n = fiber count in the (ith) category; L = contour length). Using this method, the estimated tracheid lengths were similar to true tracheid length measurements, that is, were controlled for the bias caused by the large number of fines generated during preparation [33]. Average ring tracheid length (TL) was computed by weighting the tracheid length for each wood zone with the relative ring width.

2.3. Transition Age Modeling

We estimated TA analytically using three different methods: two two-segment models and one linear model. Model parameterization is described in Table 4.
Table 4. Studied transition age models.
ModelJuvenile WoodMature WoodTransition Age
PiecewiseTL = a1 + b1· x + εiTL = a2 + b2· x + εiTL = a1 + TA·(b1 − b2) + b2· x + εi
M_Q_LTL = a1 + b1· x + c·x2 + εiTL = a2 + b2· x + εiTA = −b/2c + ε i
MIXEDTL = a + b· x + c·x2 + d·x3 + εiTA = (−b ± (b2 − 4a·c)−0.5)/2a + ε i
M_Q_L: maximum-quadratic-linear; TL: tracheid length; TA: transition age, x: cambial ages; a–d are regression parameters.

2.3.1. Segmented Models

The first segmented model tested was a two-segment linear regression model (piecewise), the most common TA estimation approach using TL [35,36,37]. Using piecewise regression, TA was considered as the point where the TL slope changes [36]. The second segmented model was a quadratic-linear model consisting of a first second-order polynomial segment and a second linear segment. This model considered that transition occurred when the quadratic function reached its maximum [8,17,19]. Hence, the second model was called a maximum-quadratic-linear (M_Q_L) model. The rationale for using this model is that the first quadratic segment allows capturing the logarithmic pattern of TL in the most rapidly changing JW zone. The use of a second linear segment in both segmented models is based on the radial pattern of TL in spruce, which is known to increase toward the bark even after maturation [35]. Quadratic-linear segmented models have been used for TA estimation using fiber length [43], wood density [17,19], microfibril angle [8], and modulus of elasticity [9]. Both segmented models were constrained to be continuous, that is, to join at the breakpoint (TA), and were fitted with the NLIN procedure in SAS® (SAS Institute Inc., Cary, NC, USA) [44].

2.3.2. Third-Order Polynomial Model

The third model was a third-order polynomial regression that included the autoregressive first-order (AR (1)) covariance structure age. Similar models were used for TA estimation with several proxies [13], but not TL. Because TL is known to increase with tree age [35] and is undoubtedly linked among years, it was deemed appropriate to include this correlation when modeling TA in white spruce using TL. Because the MIXED procedure in SAS® was used to fit the third model, it was called the MIXED model. We included the repeated structure age in this model to improve the inference. Indeed, not accounting for the correlation between measurements results in an underestimation of the variance [45], resulting, among other, in higher type I error rates (incorrectly rejecting a true null hypothesis) for tests of intergroup differences. For the MIXED model, TA was determined by setting the derivative of the third-degree function equal to zero and solving for age. For third-degree polynomials, two solutions were obtained, but only one was of biological significance and hence retained [13].

2.4. Comparison between Models

Averages and standard deviations for WQA as well as the normality of the residuals were assessed using the UNIVARIATE procedure in SAS®. Model fit was measured using the root-mean-squared error (RMSE). Paired t-tests with Bonferroni adjustment to account for multiple testing [44] were used to compare estimates of TA, JW radius (JWR), JW proportion (JWP), and TL at the time of transition for each tree between paired models.
Although all the trees examined in this study were harvested from a thinning experiment, neither thinning intensity nor social class of trees was considered in the models. Thinning is known to foster increased ring width [46]. Heavy stand thinning tends to negatively influence TL, although without practical implications, and lasting for only a few years [38]. The findings on the influence of sylvicultural management on TA estimates are contradictory. A few studies in slash pine (Pinus elliottii), loblolly pine (Pinus taeda L) [16], and black spruce [24,36,37] found no influence of sylvicultural practices on TA. However, other studies in Norway spruce [15], white spruce [36], and black spruce [13] showed some sylvicultural influence on TA. Considering the complexity of the TL response to thinning and its low magnitude compared to variation due to cambial age, we assumed a negligible thinning effect in the present study, and did not account for it in the TA estimation with the three models. However, the estimated variations induced by both thinning and social class on many WQA are considered in the second part of this study.

2.5. Juvenile Wood Proportion, Volume, and Shape

JWP at breast height (in tree BA) was estimated according to Alteyrac, Cloutier and Zhang [24]. Equation (1) was used to estimate the JW radius (JWR), or the cumulative ring width from pith to ring at the time of transition. The JW area (JWA), or the BA of JW in the tree, was estimated using Equation (2). Tree radius (TR), or the cumulative ring width from pith to the last calendar year of full ring (2007), was obtained with Equation (3), and tree area (TAR), or the whole basal area of the tree, was estimated using Equation (4). The JWP (in tree BA) was computed with Equation (5), using the results from Equations (2) and (4).
JWR = CA  =  pith CA  =  TA   ( RW )
JWA = π × ( JWR ) 2
TR = CA  =  pith CA  =   2007   ( RW )
TAR = π × ( TR ) 2
JWP = 100 × (   JWR TR ) 2
where JWR: juvenile wood radius (mm); CA: cambial age (years), TA: transition age (years), RW: ring width (mm), JWA: juvenile wood area (mm2), TR: whole tree radius in 2007 (mm), TAR: whole tree basal area (mm2), and JWP: juvenile wood proportion in tree basal area (%).
TA, JWR, and whole tree radius in 2007 were estimated longitudinally at 1.3 m, 4.3 m, 7.3 m, 10.3 m, and 13.3 m height of the measured trees (subset of 5 trees). The juvenile wood basal area (JWAh) (Equation (6)) and tree basal area (TARh) (Equation (7)) were computed at the five-abovementioned heights. JW volume (JWV) (Equation (8)) and tree volume (TV) (Equation (9)) were computed from the juvenile wood basal area and tree basal area. Because it obtains less bias in the volume determination and does not depend on the bole shape [47], Newton’s formula was preferred to others for section scaling. The first Section S1 included 1.3 m (base), 4.3 m (half height), and 7.3 m (top) and the second Section S2 included 7.3 m (base), 10.3 m (half height), and 13.3 m (top). The truncated cone formula (Equation (10)) was used for both juvenile wood volume and whole tree volume whenever it was impossible to compute Newton’s formula for section scaling. JWP in volume (JWPV) (Equation (11)) was computed from the results of Equations (8)–(10). JW shape was determined from the JWR and whole tree radius in 2007 for the abovementioned heights using Matlab® (MathWorks Inc., Natick, MA, USA) [48].
JWA h = π × ( JWR h ) 2
TAR h = π × ( TR h ) 2
JWV = s 1 s 2 ( (   JWA base   +   4   × JWA half height   +  JWA top 6 ) × height )  
TV = s 1 s 2 ( (   TAR base   +   4 ×  TAR half height   +  TAR top 6 ) × height )  
V =     ( π × L 3 × (  JWR base 2   + ( JWR base × JWR top ) + JWR top 2 ) )
JWPV = 100 × ( JWV TV )
where JWAh: juvenile wood basal area at height h (mm2); JWRh: juvenile wood radius at height h (mm), TARh: tree basal area at height h (mm2), TRh: whole tree radius in 2007 at height h (mm), JWV: JW volume (m3), TV: tree volume (m3), V: JWV (m3) or TV (m3) according to the tree zone considered and computed with the truncated cone formula, L: length of the sampled tree section (m), and JWPV: JWP in volume (%) computed with Newton’s or the truncated cone formula.

3. Results

3.1. Tracheid Length Radial and Longitudinal Variation

TL at breast height was longer in MW (3.3 mm) compared to JW (2.32 mm). The radial variation showed a rapid increase from CA 3 to 30, with a plateau thereafter (Figure 1a). A similar pattern was observed at upper heights (Figure 1b). The standard errors between the 30 trees for TL at breast height were very small (Figure 1a), indicating homogeneity of this property when samples are taken at the same tree height and CA.
Average TL for (CA 3–30) increased slightly in the longitudinal direction (Figure 1c). The standard errors between the five trees for average TL from 1.3 to 13.3 m were relatively high (Figure 1c), indicating heterogeneity of this property in the longitudinal direction. CA 3 and 30 were selected to represent the longitudinal variation in the JW and in MW zones, respectively. The variation in the longitudinal direction was more pronounced in JW than in MW (Figure 1d).
Figure 1. Radial and longitudinal variations in tracheid length (TL): (a) radial variation in tracheid length at breast height (1.3 m); (b) radial variation in tracheid length from 1.3 to 13.3 m; (c) longitudinal variation in average (cambial age 3–30) tracheid length; and (d) longitudinal variation in juvenile (cambial age 3) and mature (cambial age 30) tracheid length. Bars indicate standard errors.
Forests 06 00183 g001

3.2. Transition Age, Juvenile Wood Width, Juvenile Wood Proportion, and Tracheid Length Estimates at Breast Height

TA was estimated using the three models. However, the model fit diagnostics (RMSE) indicated that the MIXED model provided the best fit (Table 5), followed by the M_Q_L. The piecewise model showed a weak fit to the data. The TA estimates by the MIXED polynomial model were higher than those by the M_Q_L and piecewise models (Table 5, Figure 2a). Similarly, JWR (Table 5, Figure 2b) and JWP (Table 5, Figure 2c) were higher using the MIXED model than the M_Q_L and piecewise models. The same results pattern was observed for TL estimates at the time of transition (Table 5, Figure 2d). TA estimated with the MIXED model coincided with the beginning of the plateau phase of the radial pattern of TL (Figure 3). The M_Q_L also estimated TA at near the plateau phase (Figure 3). In contrast, TA estimated with the piecewise model occurred in the JW–MW transition zone, and farther from the plateau compared to the other models (Figure 3). Significant differences were found between all paired models in estimated TA, JWP, and TL at the time of transition (Table 6).
Figure 2. Mean and standard deviation of the estimates for the piecewise, maximum-quadratic-linear (M_Q_L), and MIXED model at breast height: (a) transition age (TA); (b) juvenile wood radius (JWR); (c) juvenile wood proportion (JWP); and (d) tracheid length (TL) at the time of transition.
Forests 06 00183 g002
Figure 3. Graphical representation of the average transition ages determined with the piecewise, maximum-quadratic-linear (M_Q_L), and MIXED model, and average tracheid length at breast height.
Forests 06 00183 g003
Table 5. Mean, standard deviation (SD), and range for transition age (TA, years), tracheid length at the time of transition (TL, mm), juvenile wood radius (JWR, mm), and juvenile wood proportion (JWP, %) estimated using the three transition age models at breast height (30 trees) with root-mean-squared error (RMSE) as a measure of goodness of fit.
ModelTATLJWRJWP
Mean (± SD)Range (min–max)RMSEMean (± SD)Range (min–max)Mean (± SD)Range (min–max)Mean (± SD)Range (min–max)
Piecewise11 ± 26–170.15482.6 ± 0.22.1–2.944.1 ± 11.824.1–75.315.3 ± 9.33.5–52.5
M_Q_L22 ± 89–400.14333.1 ± 0.32.4–3.670.4 ± 25.632.0–149.237.9 ± 19.96.1–86.3
MIXED27 ± 715–410.11273.3 ± 0.22.8–3.682.4 ± 25.941.8–154.547.5 ± 14.422.0–84.7
M_Q_L: maximum-quadratic-linear; MIXED: mixed model with AR (1) structure; SD: standard deviation; min: minimum; max: maximum.
Table 6. Average and standard error (SE) for differences at breast height (30 trees) in transition age, juvenile wood proportion, and tracheid length at the time of transition between each of the three-paired models. Estimates for each tree were compared across paired models using paired t-tests with Bonferroni adjustment (p < 0.05/30 = 0.0016).
Model PairDFTransition Age (Years)Juvenile Wood Proportion (%)Tracheid Length (mm)
Mean (± SE)t-Value (p-Value)Mean (± SE)t-Value (p-Value)Mean (± SE)t-Value (p-Value)
MIXED vs. Piecewise2816.6 (1.09)15.2 (<0.0001)32.9 (1.98)16.6 (<0.0001)0.69 (0.03)21.8 (<0.0001)
M_Q_L vs. Piecewise2711.1 (1.44)7.8 (<0.0001)22.8 (3.12)7.3 (<0.0001)0.49 (0.05)9.9 (<0.0001)
MIXED vs. M_Q_L285.4 (1.37)3.9 (0.0005)9.7 (2.80)3.5 (0.0018)0.19 (0.05)3.9 (0.0006)
MIXED: mixed model with AR (1) structure; M_Q_L: maximum-quadratic-linear model.

3.3. Juvenile Wood Volume, Proportion, and Shape

Estimated TA from 1.3 to 13.3 m generally tended to decrease slightly with increasing tree height, regardless of the model used (Figure 4). As found for TA estimates at breast height, the MIXED model obtained more conservative JWV estimates than the M_Q_L model, and both these models obtained more conservative JWV estimates than the piecewise model (Figure 4 and Table 7). The piecewise model generally obtained a JWP below 50%, whereas the MIXED model obtained a JWP greater than 50% (Table 7). The JW shape was conical with all three models (Figure 5).
Figure 4. Longitudinal patterns of variation in transition age (years) with tree height (m) using the piecewise, maximum-quadratic-linear (M_Q_L), and MIXED models. Bars indicate standard errors.
Forests 06 00183 g004
Figure 5. Graphical representation of juvenile wood (interior dark cone) and mature wood (exterior grey mesh) with transition age determined using piecewise, maximum-quadratic-linear (M_Q_L), and MIXED models.
Forests 06 00183 g005
Table 7. Tree volume, juvenile wood volume, and juvenile wood proportion from 1.3 to 13.3 m obtained from five trees using the piecewise, maximum-quadratic-linear (M_Q_L), and MIXED models.
Tree IDTree Volume (m3)Juvenile Wood Volume (m3)Juvenile Wood Proportion (%)
PiecewiseM_Q_LMIXEDPiecewiseM_Q_LMIXED
10.860.070.250.447.728.750.8
20.350.040.070.1711.719.847.7
30.320.040.140.1713.243.752.5
40.210.060.140.1226.867.458.9
50.200.110.150.1553.271.472.7

4. Discussion

The entire Canadian wood sector is coping with major issues [49], including timber shortages, rising material costs, and the low competitiveness of traditional products. To meet the growing demand for forest products and alleviate shortages, industries must now rely on improved trees from managed forests [3,7]. Thus, as the juvenile wood proportion (JWP) continues to increase in the timber supply, industries must learn how to deal with juvenile wood (JW). A deeper understanding of the transition age from JW to mature wood (MW) in white spruce, from both an analytical and a technological standpoint, will benefit both wood industries and researchers. As a first step, pinpointing TA, or the age at which the material is suitable for processing a given end product in the radial direction, can help delineate the tree parts and allocate them for the best end uses.
Because TA is based on traits that directly impact the wood as well as end-product properties and processing, several wood quality attributes (WQA) are used to estimate TA. For instance, tracheid length (TL) is a critical WQA for fiber products, including pulp and paper, fiber boards, and fiber-based composites. In addition, the variation in TL with age clearly defines the JW and MW zones. Thus, TL is an appropriate attribute for determining TA.

4.1. Tracheid Length Radial and Longitudinal Variation

The greater variation observed in the TL of JW compared to MW can be explained by the distance of the tracheid from the active living crown during xylogenesis [7,50]. The xylem synthesized by the cambium at a given height is located farther from the living crown as the tree ages. Due to the strong regulatory influence of growth hormones, particularly indole-3-acetic acid (IAA auxin), which is synthesized in the living crown [7,51], the wood formed near the pith is JW, characterized by greater variations and shorter tracheids than wood formed during maturity (MW) [3].
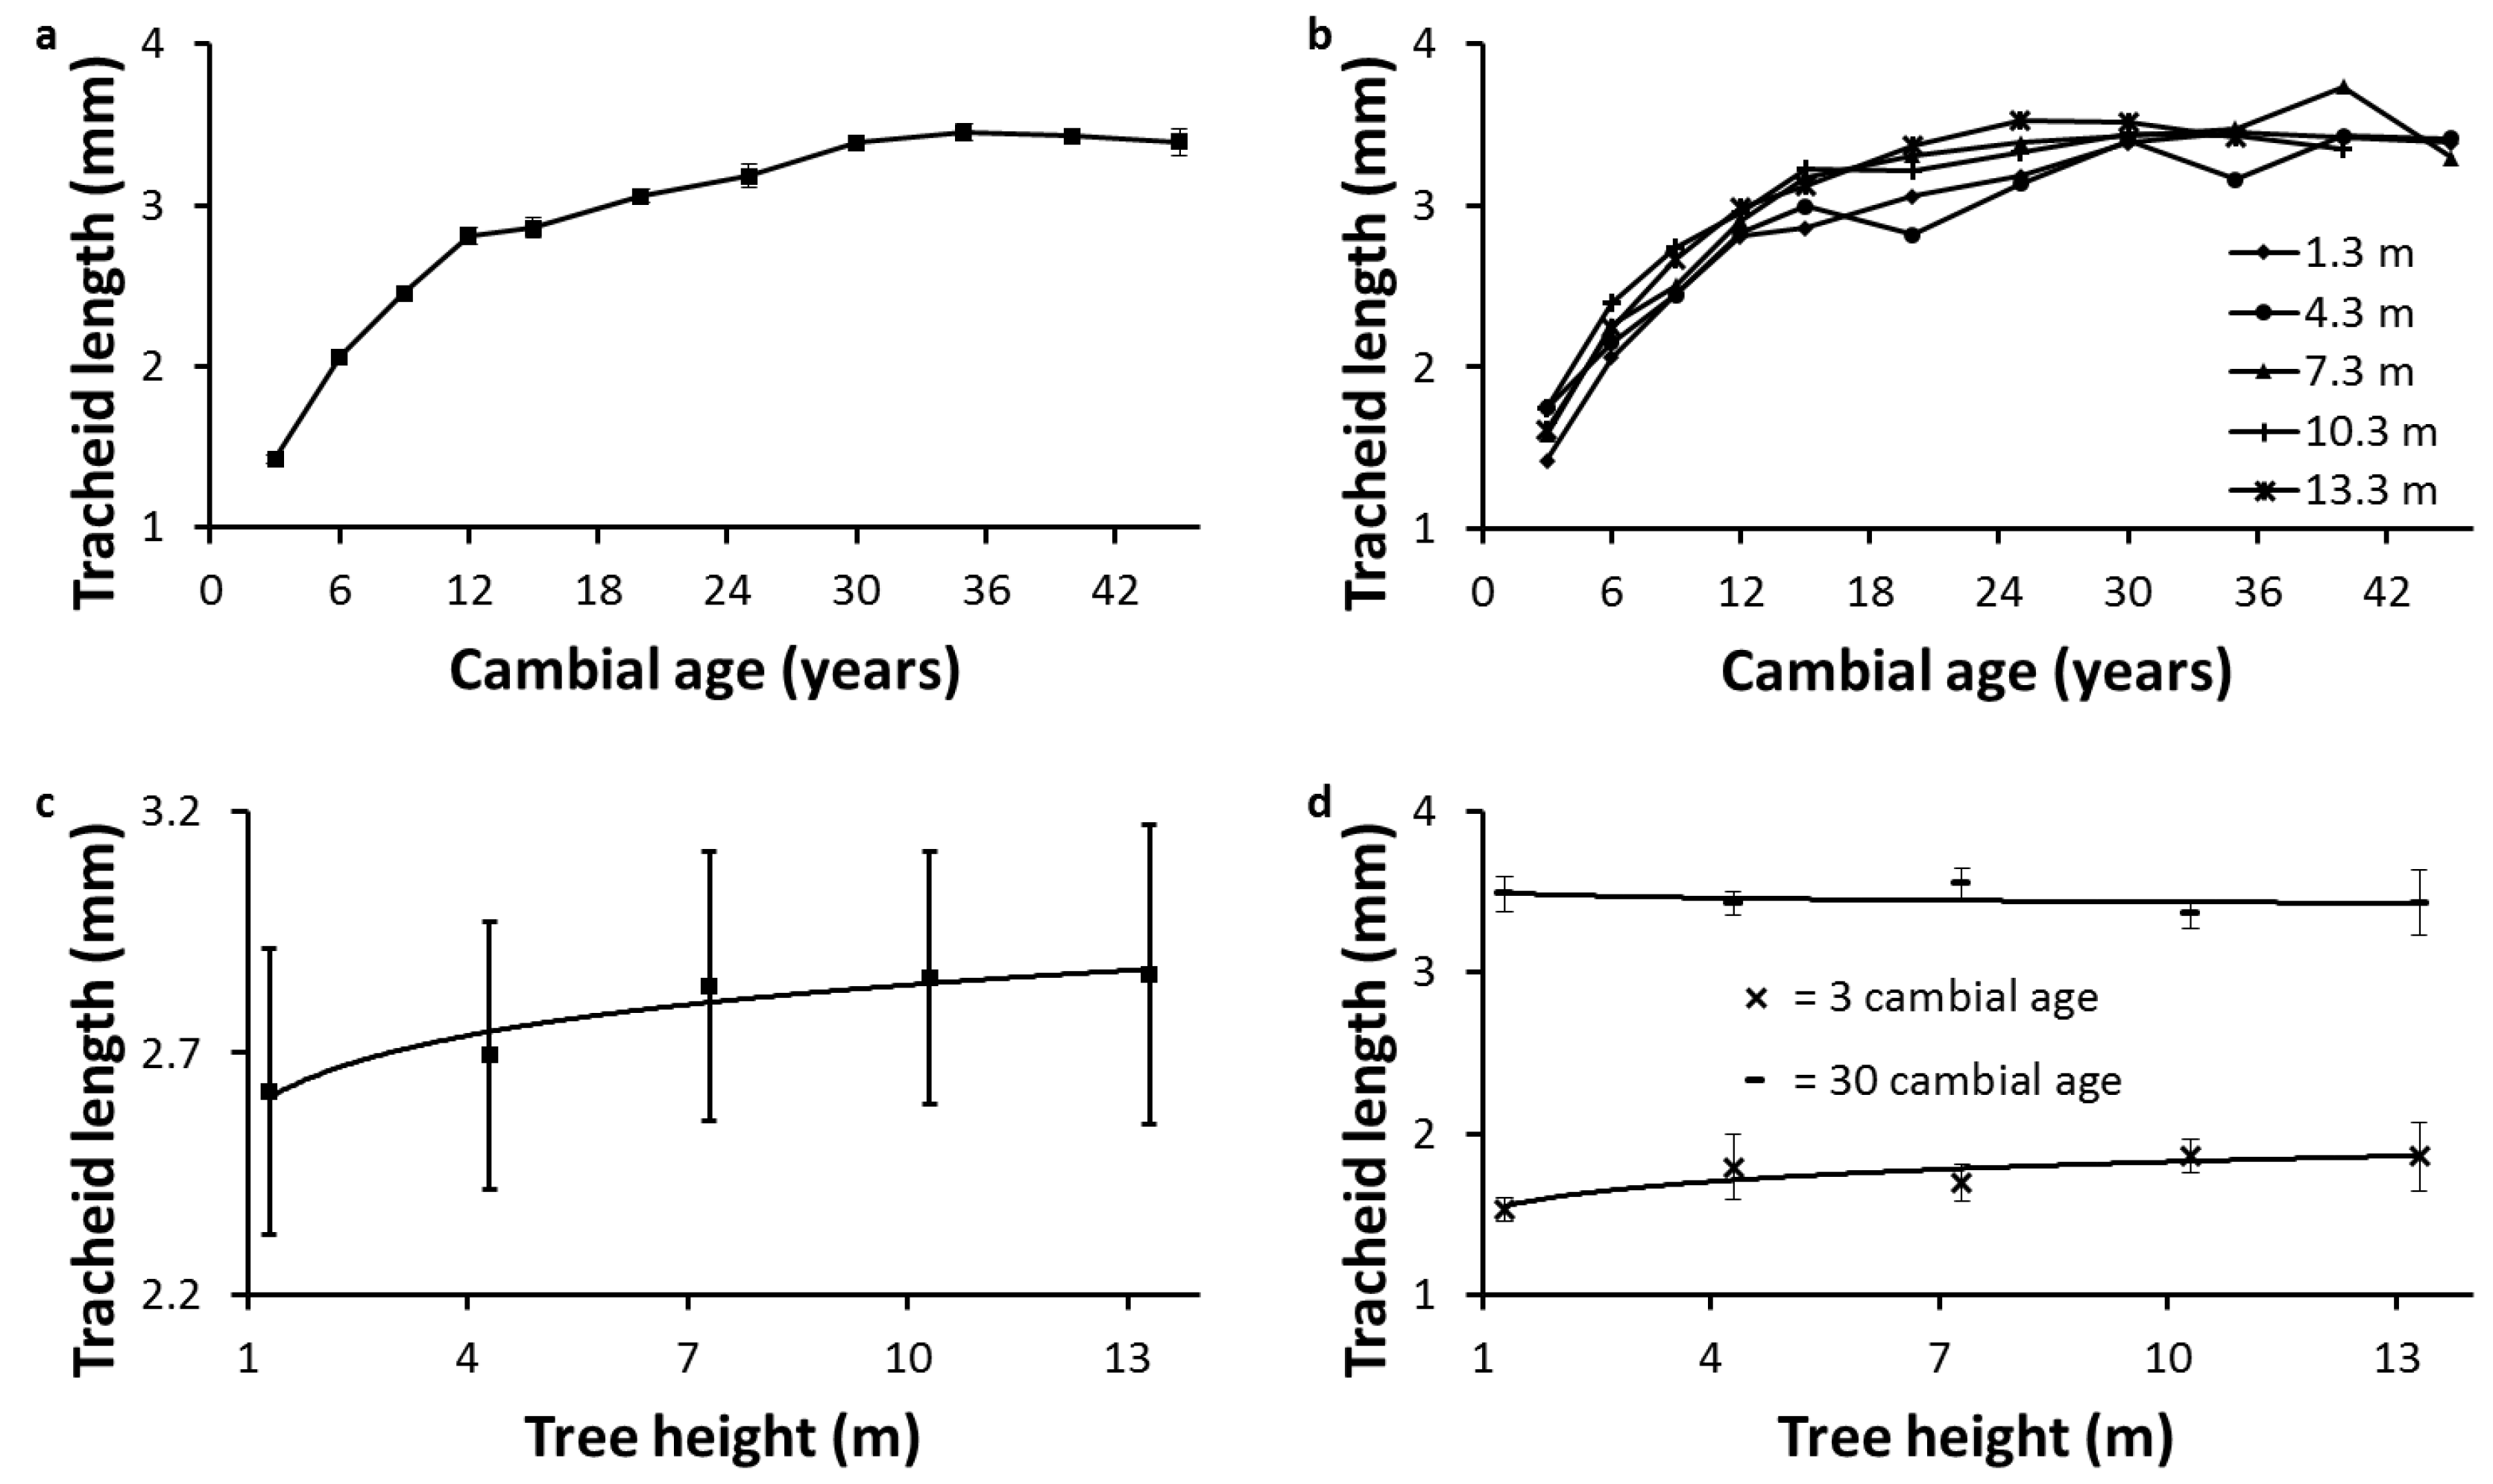
The large standard errors found for average TL (Figure 1c) can be explained by the influence of the living crown on anatomical properties. Table 3 shows that tree height, crown length, and length of the clear bole differed across the sampled trees. Consequently, due to differences in auxin regulation [7], the proportion of earlywood to latewood and JW to MW differ at a given height between the trees. This is supported by the large differences in JWP observed across the trees (Table 7).
The increase in average TL with tree height is due to many interrelated factors. The lower circumferential and radial growth rate, the lower frequency of anticlinal divisions in the cambium, and the greater cambium maturation with tree height favor longer tracheids [51]. Additionally, longer tracheids at upper heights are believed to be an adaptation to sustain higher mechanical stresses [52]. These results concur with previous studies on white spruce [53,54] and eastern white cedar [55].
The radial pattern of TL at breast height was consistent with a previous study in five Canadian conifers, including white spruce [35]. This radial pattern is also due to many interrelated factors, the most influential being the distance of the tracheid from the active living crown [7,50] and the age of the cambium during xylogenesis [3].

4.2. Transition Age, Juvenile Wood Proportion, and Tracheid Length at the Time of Transition at Breast Height

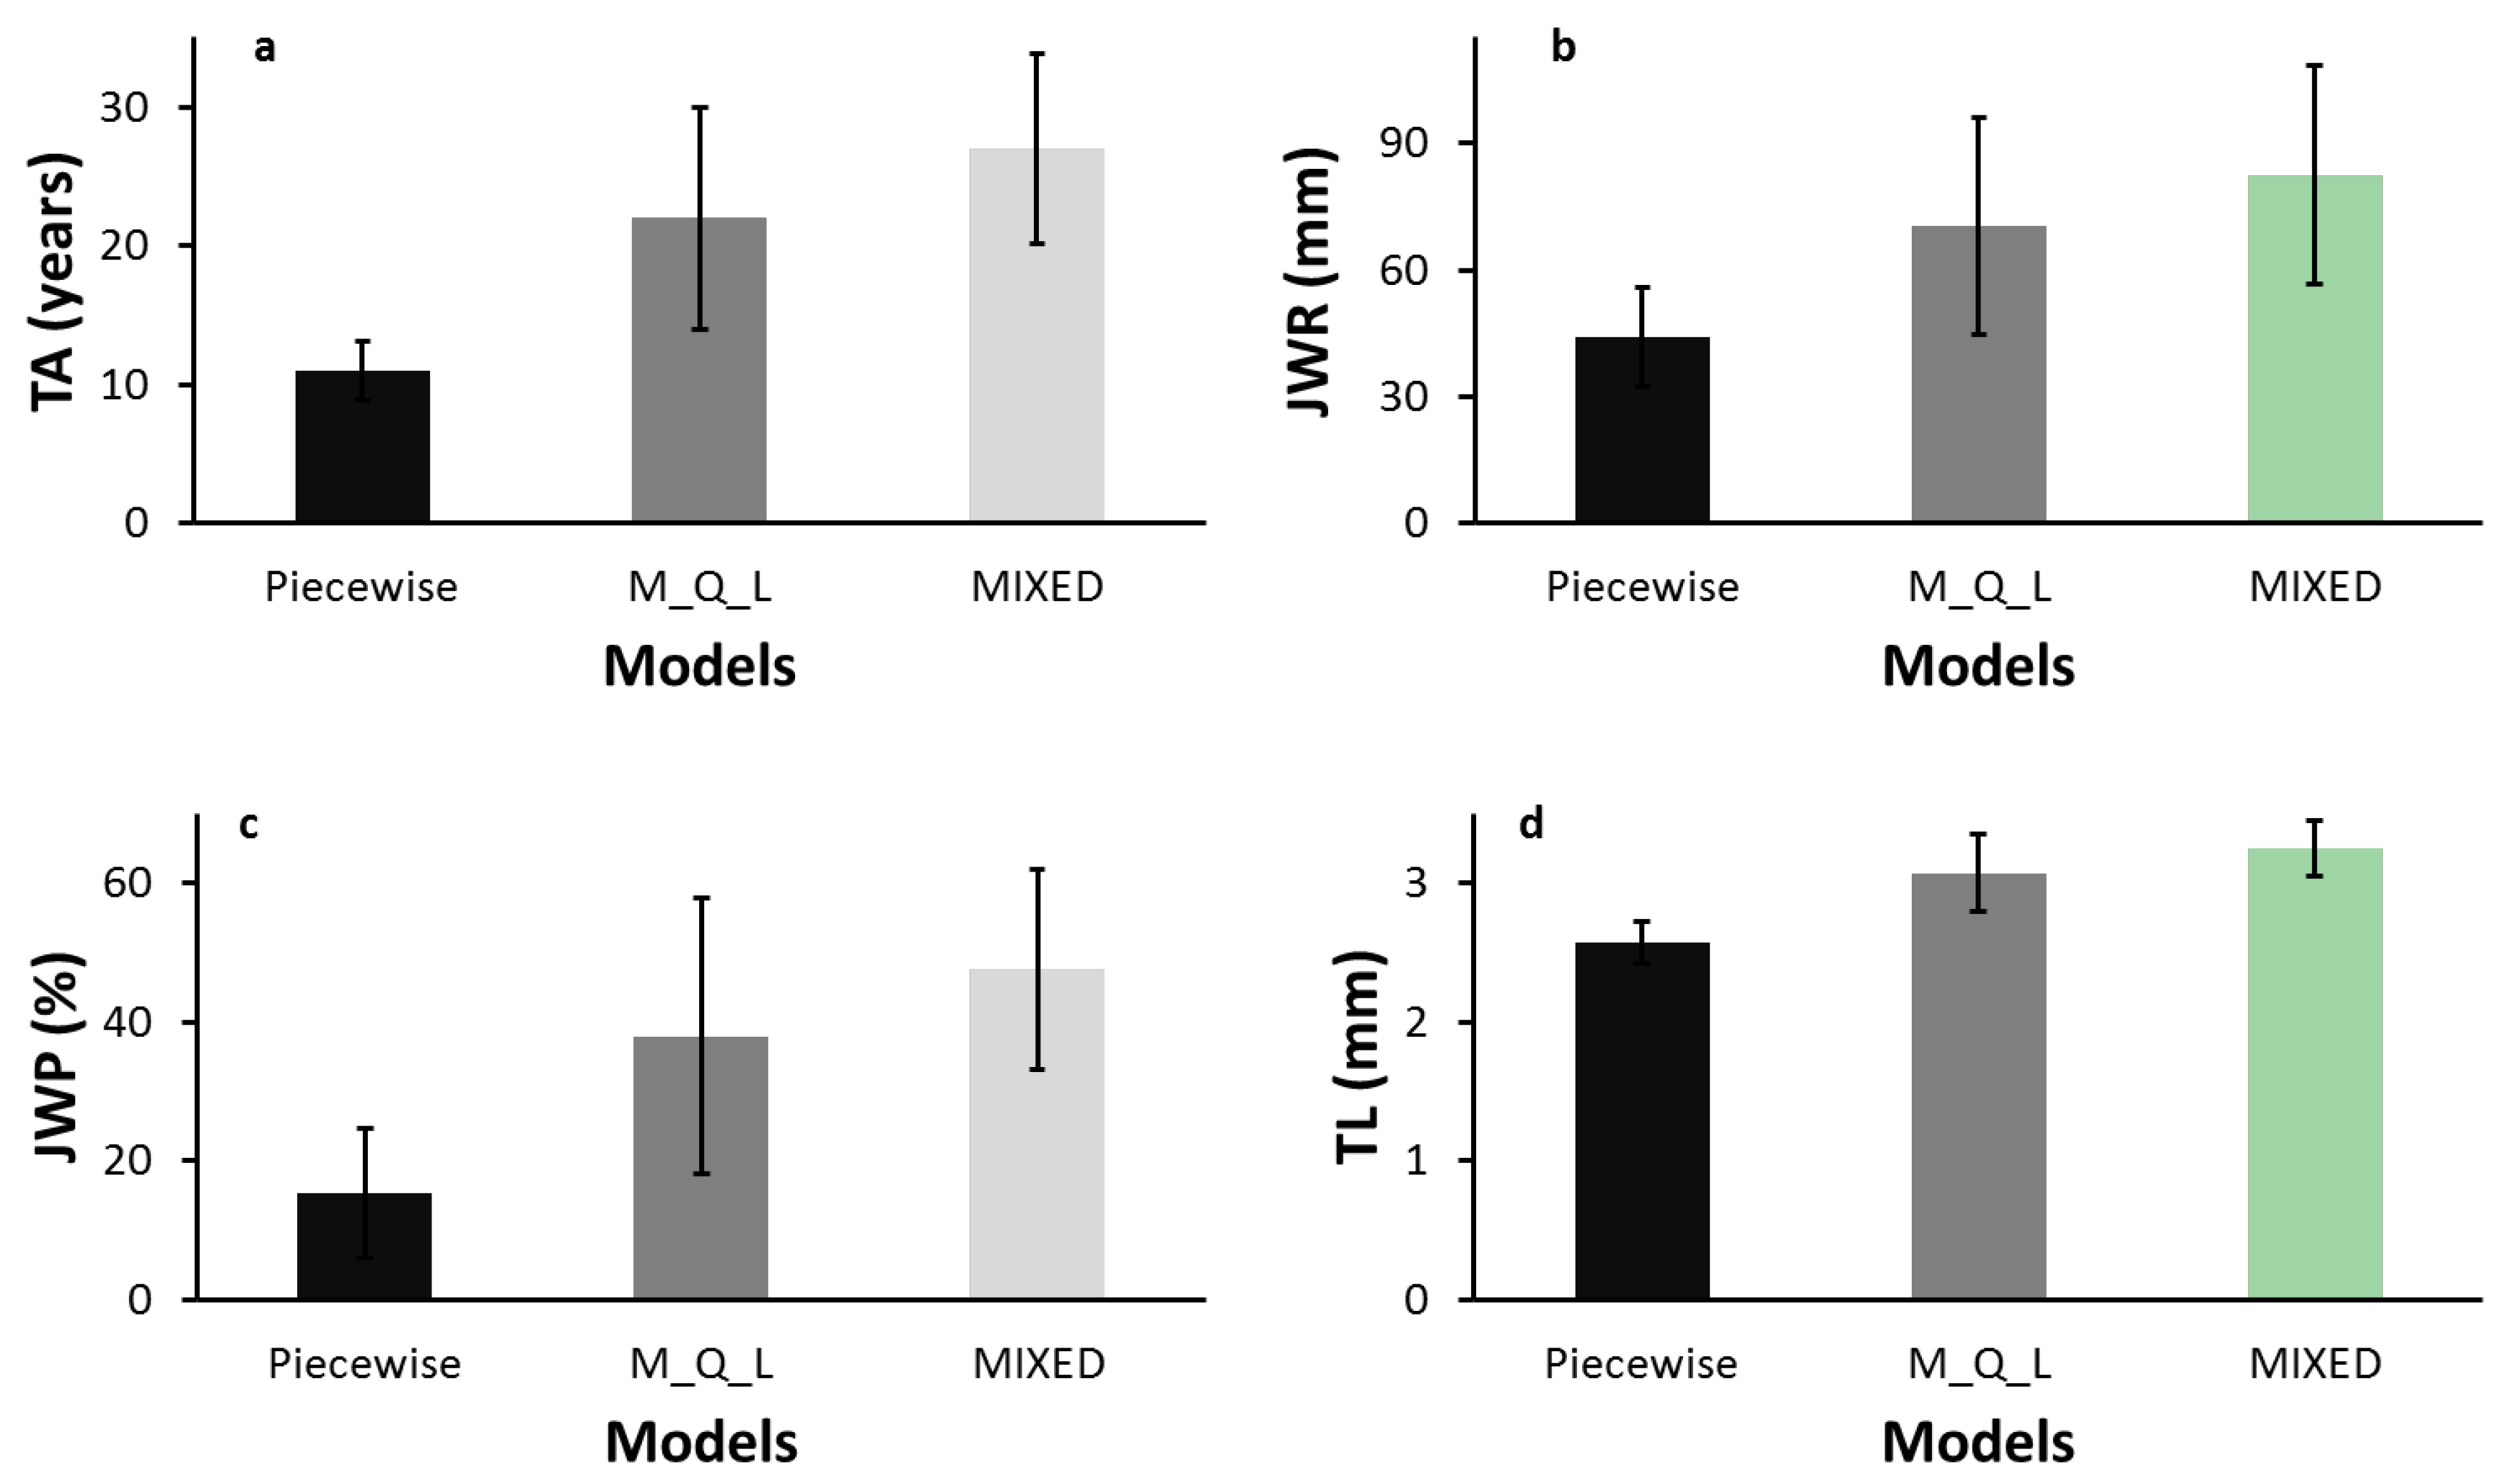
In this study, we found that the piecewise model, the maximum-quadratic-linear (M_Q_L) model, and the third-order polynomial model with the repeated structure age obtained different estimates of TA. The MIXED polynomial model provided a better fit than the segmented models. Segmented models are based on the assumption of a linear pattern in at least one segment, whereas linear polynomials are known to provide a very close fit to TL data [56]. TA assessed from TL data corresponds to the age at which the fitted functions reached a maximum for the linear polynomial model [13] and the M_Q_L model [8]. Because the polynomial is third order for the MIXED model and second order for the M_Q_L model, the MIXED model estimates were higher than those for the M_Q_L model. In contrast, the piecewise model estimated TA as the point of abrupt change in the slope of the property [35,36,37]. This explains why the mean TA, TL, JWR, and JWP obtained with the linear polynomial model and the M_Q_L model, although statistically different, were similar, whereas the means estimated with the piecewise model differed substantially from those of the other two models (Table 5 and Figure 2). The discrepancies in terms of differences were even greater. Table 6 shows that the differences between the paired models MIXED vs. piecewise and M_Q_L vs. piecewise are threefold greater and twofold greater, respectively, than those between the paired models MIXED vs. M_Q_L. Thus, the mathematical interpretation used to delineate TA determines the estimates one can expect. Therefore, even when TA is estimated on the same trees and using the same WQA, large differences may be obtained when different mathematical interpretations of maturation are used, and comparisons must be made accordingly. The TA estimation with the piecewise model using TL was consistent with those of previous studies in black spruce and white spruce [35,36,37] using the same model. Similar rankings between models have been obtained for black spruce TA (MIXED > piecewise) using maximum density and ring area [24] and for lodgepole pine TA (M_Q_L > piecewise) using microfibrils angle [8] and modulus of elasticity [9]. In the present study, estimates of JWR and JWP with the MIXED model were also more conservative than with the M_Q_L model, and both were more conservative than with the piecewise model. These results were expected, because JWR, JWP, and TL at the time of transition normally increase or decrease with the number of rings required to reach maturity.
Zobel and Sprague’s [3] definition of maturity is that, “
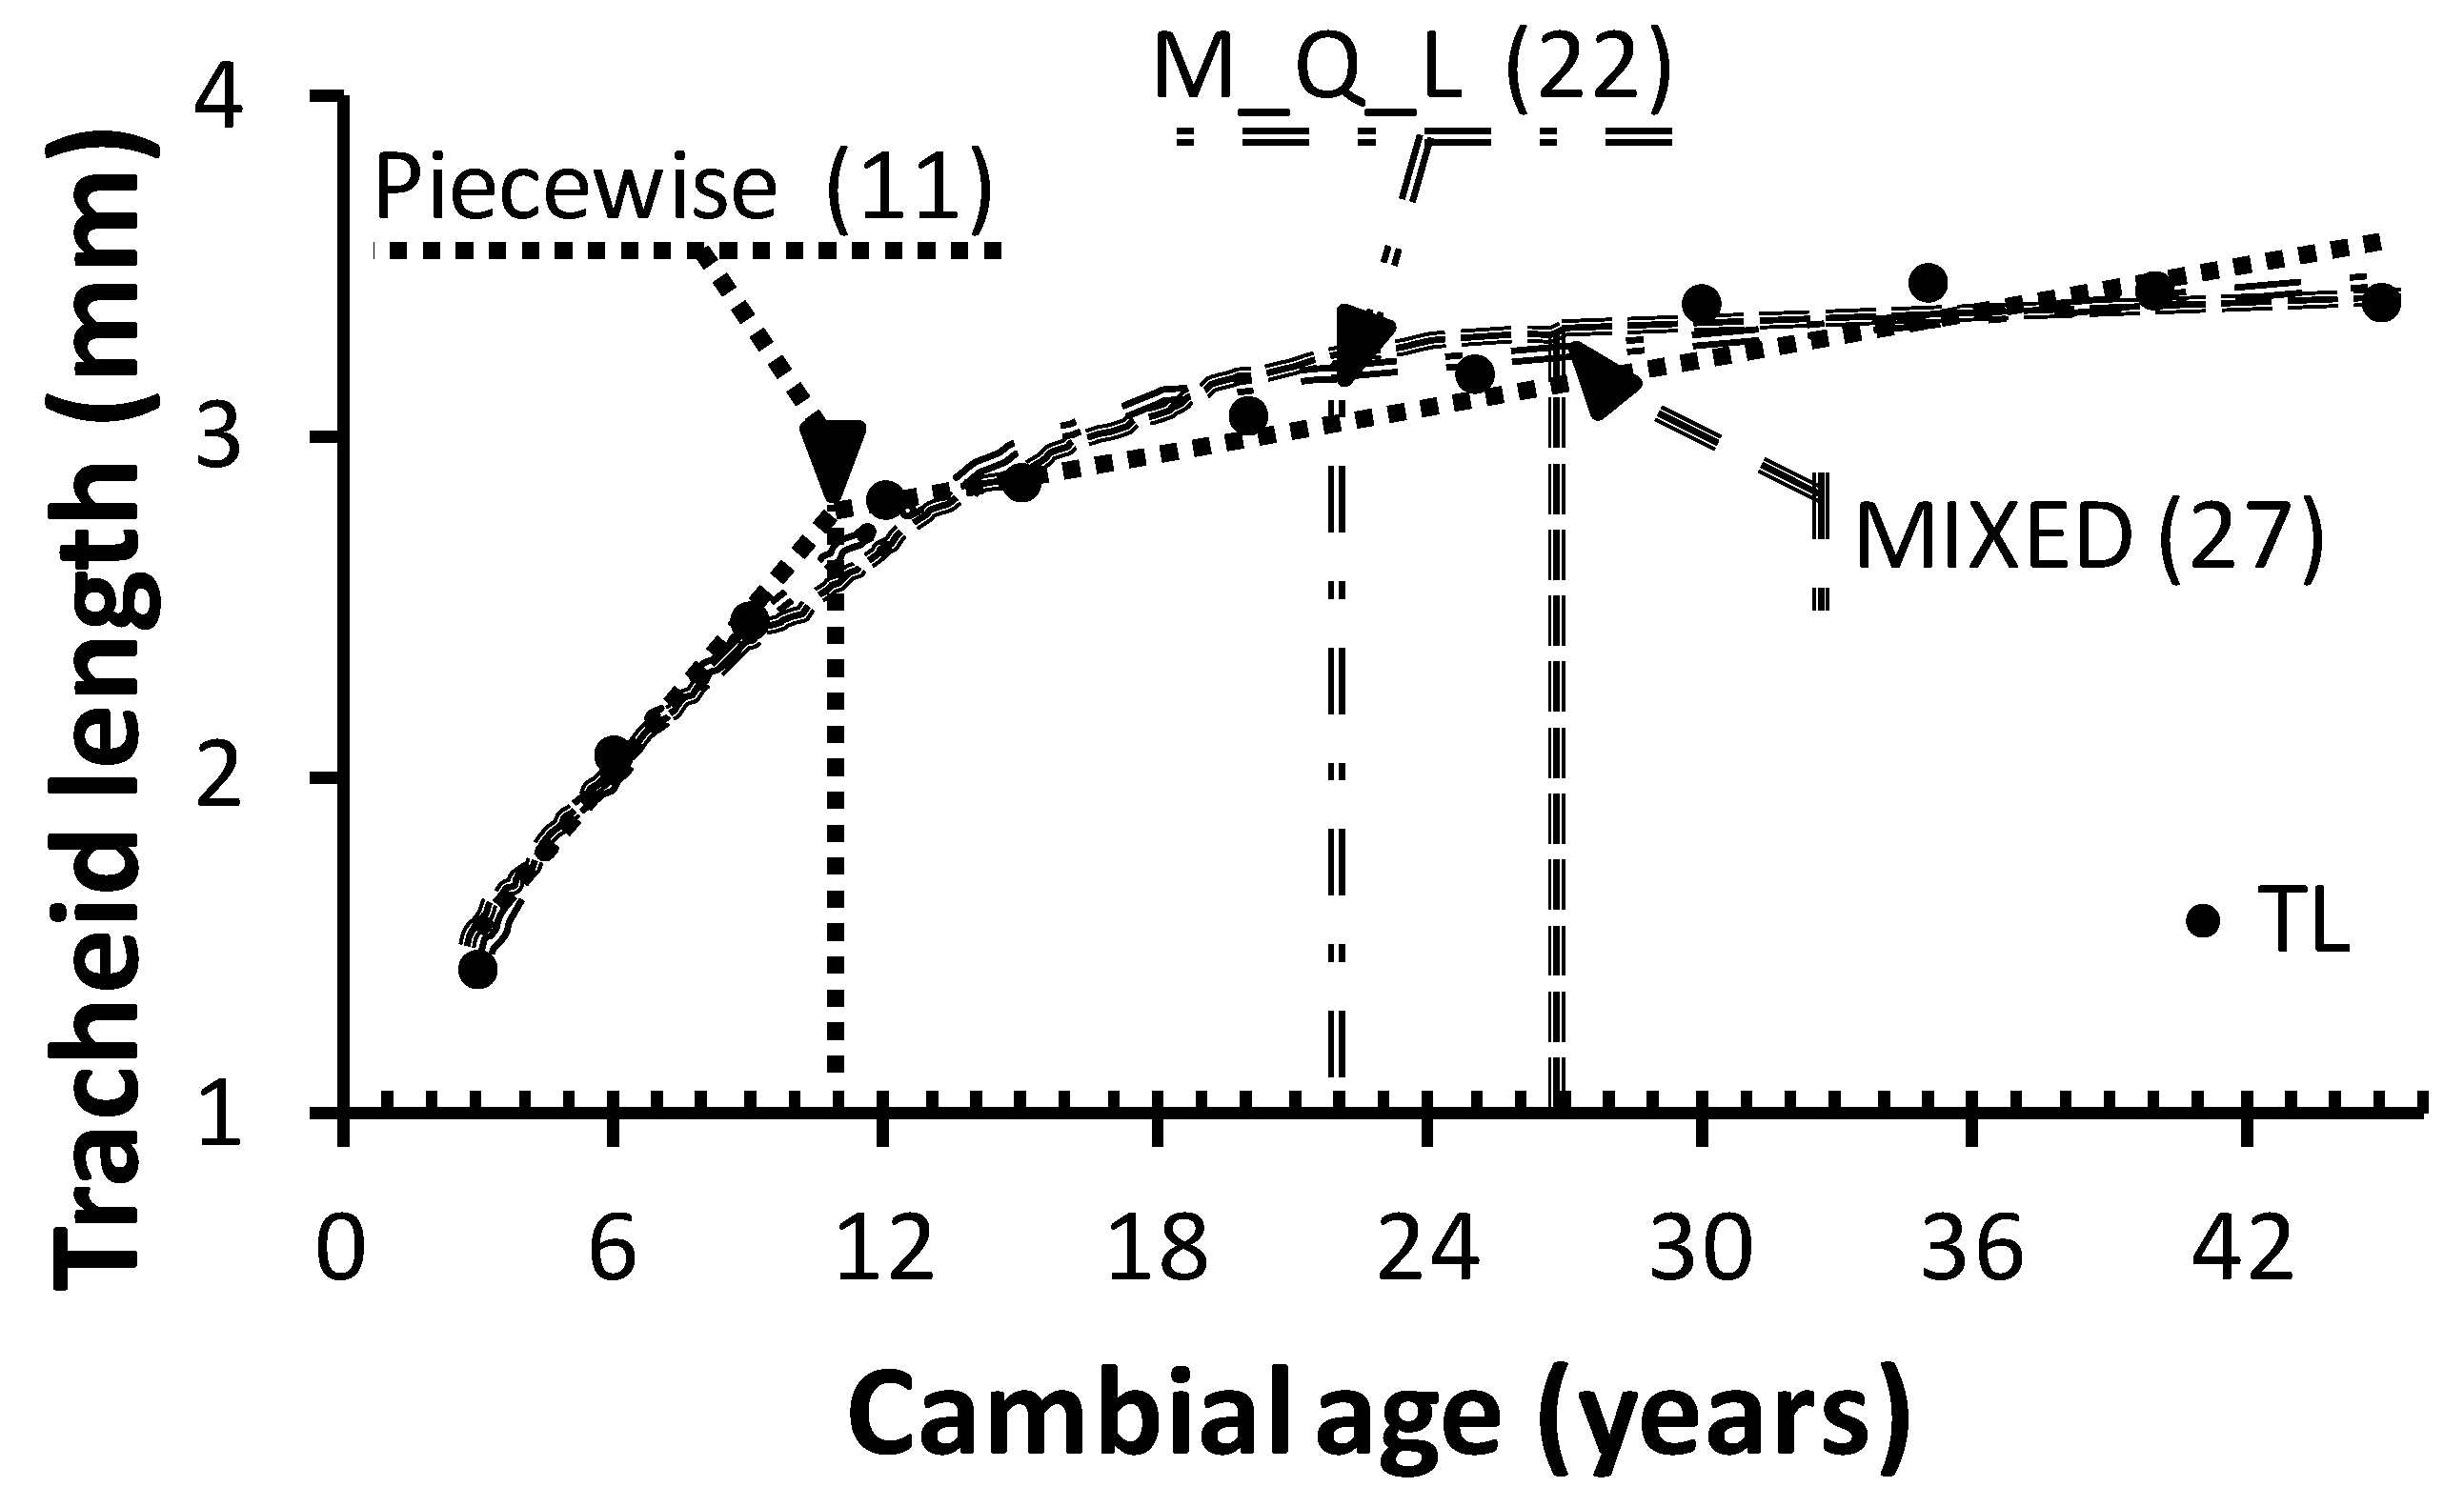
The juvenile wood is the area of rapid change in properties near the pith; mature wood is more uniform towards the bark”. Accordingly, the MIXED estimates, and to a lesser extent the M_Q_L estimates, represented real mature wood. Figure 3 shows that the average TA estimated with the MIXED model coincided with the beginning of the plateau phase. In contrast, TA estimated with the piecewise model falls into the area commonly referred to as “transition wood,” where the WQA exhibit JW and MW characteristics.
In order to prevent the confusion that can arise from analytical methods, it was proposed [25] to base TA estimation on technological thresholds of WQA. Moreover, earlier studies [26,27,28] found that tracheids longer than two millimeters could be safely used to produce paper with good tear strength. However, to obtain refined pulp with this TL, the raw material must contain much longer tracheids, because the pulping process reduces the length [29]. Therefore, even if a technological threshold were defined for the production of paper with good tear strength, it would be safer to estimate TA with the MIXED or M_Q_L model than the piecewise model. TL at the time of transition were 3.3 mm, 3.1 mm, and 2.6 mm with the MIXED, M_Q_L, and piecewise model, respectively (Table 5). However, it must be kept in mind that the technological threshold used in the present study applies specifically to paper tear strength. Other TL safe points will be defined according to various criteria for end-product quality used in the paper industry. Similarly, WQA other than TL may be more appropriate for solid wood products and for other bioprocessing industries.

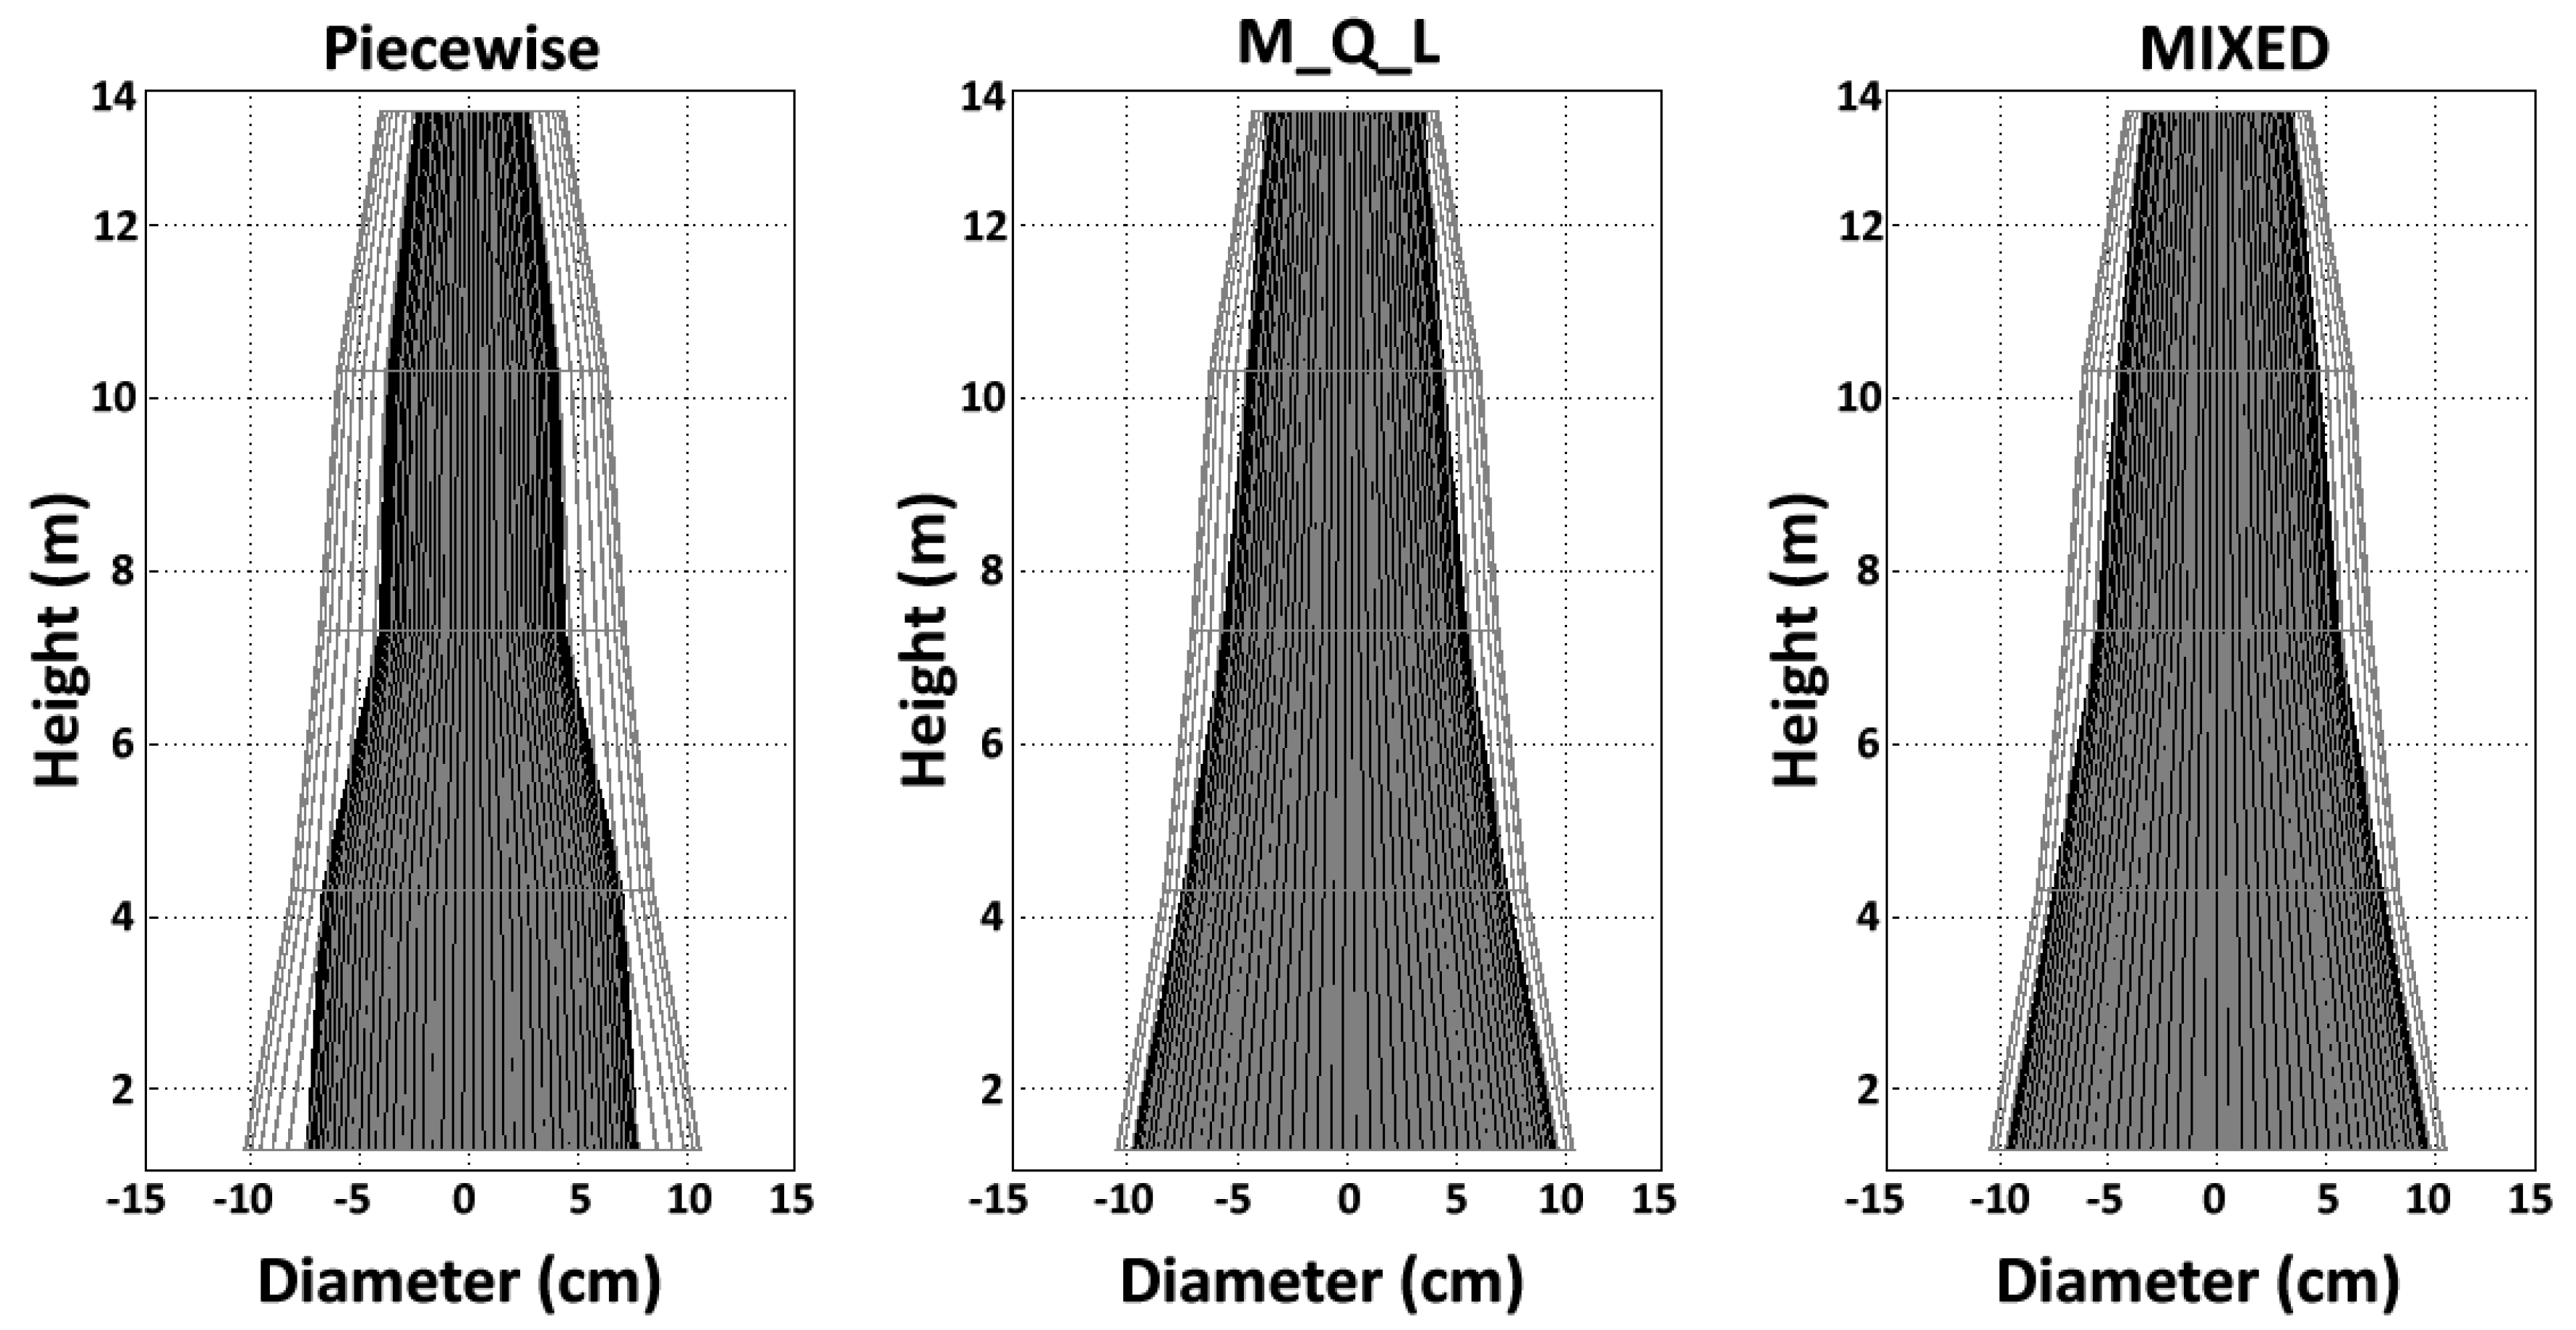
4.3. Juvenile Wood Volume, Proportion, and Shape

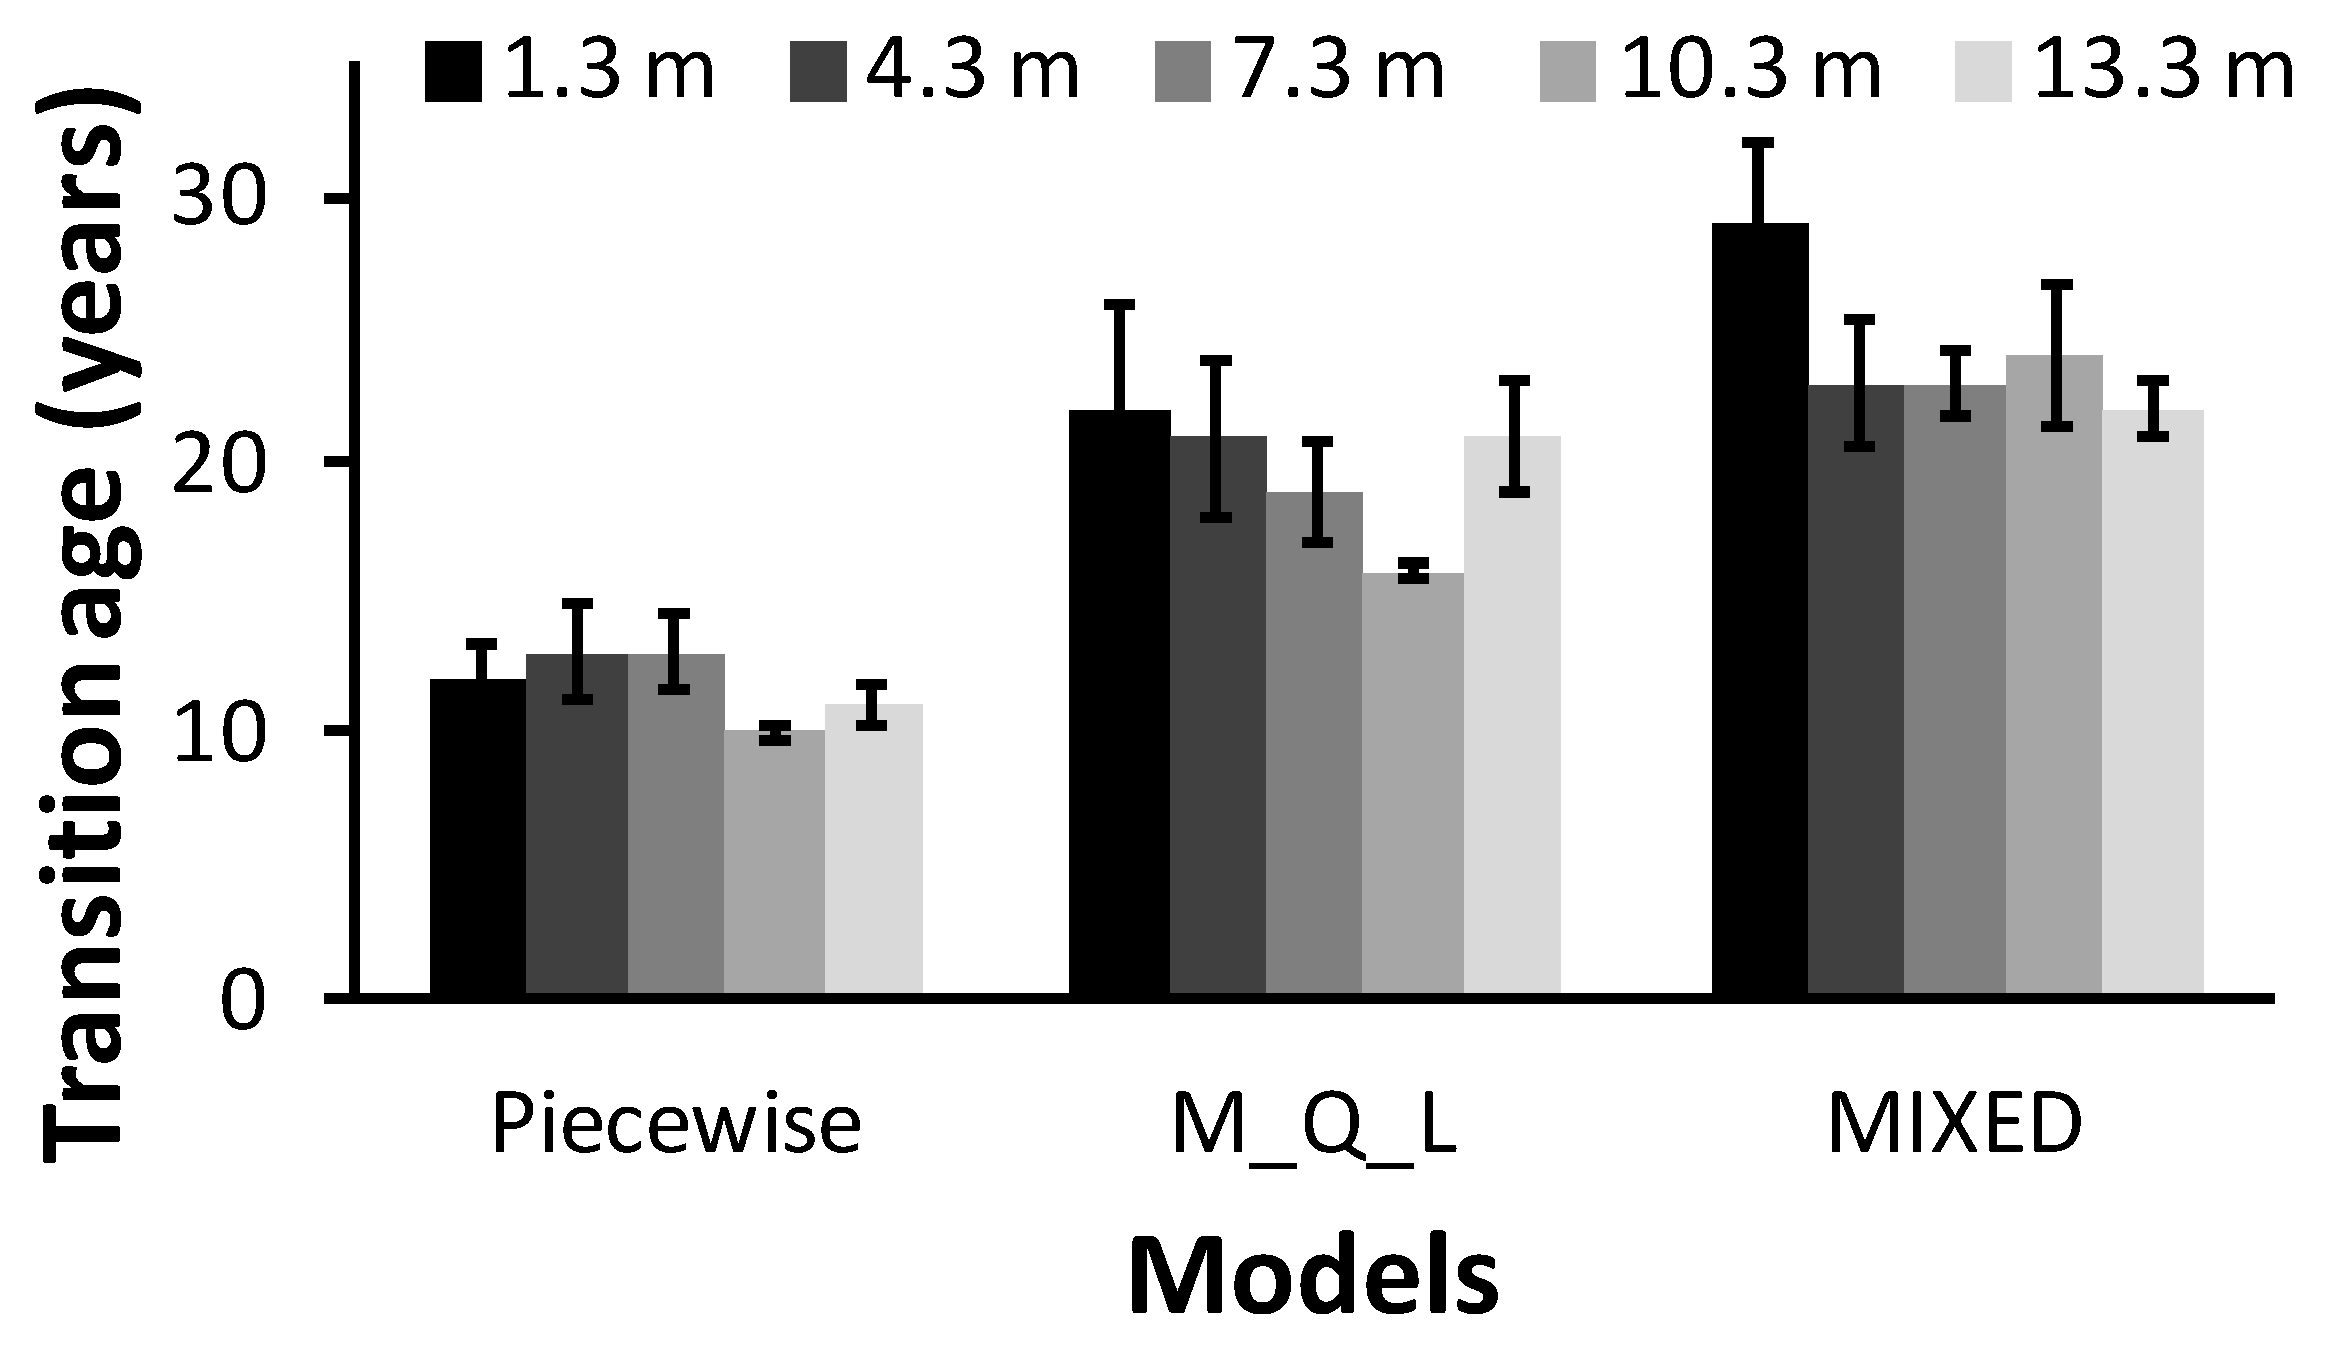
Overall, the JW proportion below the living crown was less than 50% in these 72-year-old trees according to the piecewise model, whereas the opposite was true for the MIXED model. The JWV and JWP estimates for a given tree increased according to the method: the piecewise model yielded the lowest estimates, with intermediate estimates for the M_Q_L model and the highest estimates for the MIXED model. This trend was expected, because the juvenile wood area, JWV, and JWP mirror the variation in TA. We found higher TA for models using the maximum TL (MIXED and M_Q_L) compared to the piecewise model, which considered TA as the change in the TL slope. However, Figure 5 and Table 7 show that the discrepancies between the MIXED and M_Q_L models were far smaller than the differences between each of these models and the piecewise model. The M_Q_L and piecewise results concur with those of recent studies that estimated lodgepole pine TA based on microfibril angle [8] and modulus of elasticity [9]. The decreasing pattern of TA with increasing tree height is due to tracheids having characteristics of MW earlier at the top portions of trees than at lower heights [27,28,57]. Many interrelated factors, particularly the lower circumferential and radial growth rate, the lower frequency of anticlinal division of cambial initials, along with their greater age at upper height, favor longer tracheids [51]. In fact, the cambial initials, when considered as tissue, are as old as the tree [51], and their length was found to increase with age, even for long-living trees [58]. Therefore, even if tracheids in the apex of a 72-year-old tree (with cambial initial tissue that is 72 years old) are located in the JW zone (there is only one ring at the apex, and the tracheids are therefore in the first cambial ring) [3], they will be longer than tracheids in the first cambial ring at ground level (where the cambial initial tissue was one-year-old at the time of tracheid formation) [51]. However, even if tracheids located in the apex of a mature tree are longer than tracheids at lower height, they are in the JW zone due to the influence of the active living crown [7]. These results concur with previous studies [14,59]. The use of Newton’s formula for section scaling accurately captured the intra-tree variation in the JW shape: in the present study, we found a conical shape. Therefore, although the notion of a juvenile cylinder core within the tree trunk offers a plausible explanation for JW formation, it is more appropriately represented as a cone shape, in agreement with previous reports [14,59].

5. Conclusions

Tracheid length (TL) in white spruce followed Sanio’s law, increasing from pith to bark and from breast height to upper heights. TL was also shorter in juvenile wood (JW) compared to mature wood (MW). Transition age (TA) was estimated with three different statistical models: two two-segment regression models (a piecewise model and a maximum-quadratic-linear model–M_Q_L) and one third-order polynomial regression model (MIXED model). Average TA and the associated JW proportion (JWP) at breast height occurred at 11 years (15.3%), 22 years (37.9%), and 27 years (47.5%) for the piecewise, M_Q_L, and MIXED models, respectively. We found a conical shape for JW using Newton’s formula, regardless of the model investigated. The MIXED model was more conservative than the M_Q_L model, and both were more conservative than the piecewise model in estimating TA, JW radius (JWR), and JWP. Estimates of TA, JWP, and TL at the time of transition differed significantly between models. Model fit diagnostics using the root-mean-squared error indicated that the MIXED model provided the best fit to the data, followed by the M_Q_L, with weaker fit provided by the piecewise model. Maturation age appeared to depend on the mathematical interpretation of TA, suggesting that the confusion surrounding TA in the literature could be lessened if results were compared using not only the same species and wood quality attributes (WQA), but in particular the same mathematical interpretation of the JW–MW transition. From a practical standpoint, TA estimated with the MIXED and M_Q_L models appear to be more appropriate for producing paper with good tear strength. Because each end product has specific criteria for the determination of good raw material, the use of technological thresholds combined with analytical determination of TA, which are relevant to both the scientific and industrial communities, should be promoted in futures studies.

Acknowledgments

The first author is grateful to the ForValueNet NSERC Strategic Network for early financing of this project and to NSERC-FQRNT-Tembec for providing an industrial scholarship. We are also grateful to three anonymous reviewers for their comments on an earlier draft of the manuscript. We thank Hugues Power for providing us with the raw material used in this study.

Author Contributions

Cyriac Serge Mvolo is the lead author. He conducted all lab work and statistical analyses and wrote the manuscript. Ahmed Koubaa is the supervisor of Cyriac Serge Mvolo. He supervised all the work, from thesis proposal to implementation. Jean Beaulieu and Alain Cloutier are Cyriac Serge Mvolo’s cosupervisors. They corrected all versions of the manuscript related to the thesis. Marc J. Mazerolle is a biostatistician at Université du Québec en Abitibi-Témiscamingue. He participated in the model parameterization and interpretation. Marc J. Mazerolle, Jean Beaulieu, and Margaret McKyes performed English editing.

Conflicts of Interest

The authors declare no conflict of interest.

References

  1. Little, E.L., Jr. Checklist of United States Trees (Native and Naturalized); United States. Department of Agriculture, Forest Service: Washington, DC, USA, 1979; p. 375. [Google Scholar]
  2. Panshin, A.J.; de Zeuuw, C. Textbook of Wood Technology: Structure, Identification, Properties, and Uses of the Commercial Woods of the United States and Canada, 4th ed.; McGraw-Hill Book Co.: New York, NY, USA, 1980; p. 722. [Google Scholar]
  3. Zobel, B.J.; Sprague, J.R. Juvenile Wood in Forest Trees; Springer Series in Wood Science: Berlin, Germany, 1998; p. 300. [Google Scholar]
  4. Bendtsen, B.A.; Senft, J. Mechanical and anatomical properties in individual growth rings of plantation-grown eastern cottonwood and loblolly pine. Wood Fiber Sci. 1986, 18, 23–38. [Google Scholar]
  5. Savidge, R. Intrinsic regulation of cambial growth. J. Plant Growth Regul. 2001, 20, 52–77. [Google Scholar] [CrossRef]
  6. Larson, P.R. A biological approach to wood quality. Tappi 1962, 45, 443–448. [Google Scholar]
  7. Larson, P.R.; Kretschmann, D.E.; Clark, A., III; Isebrands, J.G. Formation and Properties of Juvenile Wood in Southern Pines: A Synopsis; General Technical Report, FPL-GTR-129; US Forest Service: Madison, WI, USA, September 2001; p. 42. [Google Scholar]
  8. Wang, M.; Stewart, J.D. Determining the transition from juvenile to mature wood microfibril angle in lodgepole pine: A comparison of six different two-segment models. Ann. For. Sci. 2012, 69, 927–937. [Google Scholar] [CrossRef]
  9. Wang, M.; Stewart, J.D. Modeling the transition from juvenile to mature wood using modulus of elasticity in lodgepole pine. West. J. Appl. For. 2013, 28, 135–142. [Google Scholar] [CrossRef]
  10. Loo, J.A.; Tauer, C.G.; McNew, R.W. Genetic variation in the time of transition from juvenile to mature wood in loblolly pine (Pinus taeda l.). Silvae Genet. 1985, 34, 14–19. [Google Scholar]
  11. Hodge, G.R.; Purnell, R.C. Genetic parameter estimates for wood density, transition age, and radial growth in slash pine. Can. J. For. Res. 1993, 23, 1881–1891. [Google Scholar] [CrossRef]
  12. Yang, K.C.; Benson, C.A. Formation, distribution and its criteria for determining the juvenile-mature wood transition zone. In Proceedings of the CTIA/IUFRO International Wood Quality Workshop, Timber Management Toward Wood Quality and End-Product Value, Quebec City, Canada, 18–22 August 1997; pp. 1x–7x.
  13. Koubaa, A.; Isabel, N.; Zhang, S.Y.; Beaulieu, J.; Bousquet, J. Transition from juvenile to mature wood in black spruce (Picea mariana (Mill.) B.S.P.). Wood Fiber Sci. 2005, 37, 445–455. [Google Scholar]
  14. Yang, K.C.; Benson, C.A.; Wong, J.K. Distribution of juvenile wood in two stems of Larix laricina. Can. J. For. Res. 1986, 16, 1041–1049. [Google Scholar] [CrossRef]
  15. Kučera, B. A hypothesis relating current annual height increment to juvenile wood formation in Norway spruce. Wood Fiber Sci. 1994, 26, 152–167. [Google Scholar]
  16. Clark, A., III; Saucier, J.R. Influence of initial planting density, geographic location, and species on juvenile wood formation in southern pine. For. Prod. J. 1989, 39, 42–48. [Google Scholar]
  17. Mutz, R.; Guilley, E.; Sauter, U.H.; Nepveu, G. Modelling juvenile-mature wood transition in scots pine (Pinus sylvestris l.) using nonlinear mixed-effects models. Ann. For. Sci. 2004, 61, 831–841. [Google Scholar] [CrossRef]
  18. Abdel-Gadir, A.Y.; Kramer, R.L. Estimating the age of demarcation of juvenile and mature wood in douglas-fir. Wood Fiber Sci. 1993, 25, 243–249. [Google Scholar]
  19. Sauter, U.H.; Mutz, R.; Munro, B.D. Determining juvenile-mature wood transition in scots pine using latewood density. Wood Fiber Sci. 1999, 31, 416–425. [Google Scholar]
  20. Szymanski, M.B.; Tauer, C.G. Loblolly pine provenance variation in age of transition from juvenile to mature wood specific gravity. For. Sci. 1991, 37, 160–174. [Google Scholar]
  21. Tasissa, G.; Burkhart, H.E. Juvenile-mature wood demarcation in loblolly pine trees. Wood Fiber Sci. 1998, 30, 119–127. [Google Scholar]
  22. Olesen, P.O. The interrelation between basic density and ring width of Norway spruce. Forstl. Forsøgsveas. Dan. 1976, 34, 341–359. [Google Scholar]
  23. Alteyrac, J.; Zhang, S.Y.; Cloutier, A.; Ruel, J.C. Influence of stand density on ring width and wood density at different sampling heights in black spruce (Picea mariana (Mill.) B.S.P.). Wood Fiber Sci. 2005, 37, 83–94. [Google Scholar]
  24. Alteyrac, J.; Cloutier, A.; Zhang, S.Y. Characterization of juvenile wood to mature wood transition age in black spruce (Picea mariana (Mill.) B.S.P.) at different stand densities and sampling heights. Wood Sci. Technol. 2006, 40, 124–138. [Google Scholar] [CrossRef]
  25. Cown, D.J. Corewood (juvenile wood) in Pinus radiata—Should we be concerned? N. Z. J. For. Sci. 1992, 22, 87–95. [Google Scholar]
  26. Zobel, B.J.; van Buijtenen, J.P. Wood Variation: Its Causes and Control; Springer Series in Wood Science: Berlin, Germany, 1989; p. 363. [Google Scholar]
  27. Kibblewhite, R.P. Designer fibres for improved papers through exploiting genetic variation in wood microstructure. Appita J. 1999, 52, 429–436. [Google Scholar]
  28. Kibblewhite, R.P.; Bawden, D. Kraft fibre qualities of pinus radiata toplogs, thinnings, and slabwood, and a “genetic misfit”. N. Z. J. For. Sci. 1992, 22, 96–110. [Google Scholar]
  29. Zha, Q. Raffinage Sélectif Des Fibres Après Fractionnement; Université du Québec à Trois-Rivières: Trois-Rivières, QC, Canada, 2009. [Google Scholar]
  30. Carpenter, C.H. The Mechanical Pulping of Southern Pine Containing Relatively Large Amounts of Spring and Juvenile Fiber. In Proceedings of the Symposium on Utilisation of the Changing Wood Resource in the Southern United States, North Carolina State University, Raleigh, NC, USA, 12–14 June 1984; pp. 124–146.
  31. McKee, J.C. The Impact of High Volumes of Juvenile Wood on Pulp Mill Operations and Operating Costs. In Proceedings of the Symposium on Utilisation of the Changing Wood Resource in the Southern United States, North Carolina State University, Raleigh, NC, USA, 12–14 June 1984; pp. 178–182.
  32. Beaulieu, J. Genetic variation in tracheid length and relationships with growth and wood traits in eastern white spruce (Picea glauca). Wood Fiber Sci. 2003, 35, 609–616. [Google Scholar]
  33. Fries, A.; Ericsson, T.; Morling, T. Measuring relative fibre length in scots pine by non-destructive wood sampling. Holzforschung 2003, 57, 400–406. [Google Scholar] [CrossRef]
  34. Mansfield, S.D.; Parish, R.; di Lucca, C.M.; Goudie, J.; Kang, K.Y.; Ott, P. Revisiting the transition between juvenile and mature wood: A comparison of fibre length, microfibril angle and relative wood density in lodgepole pine. Holzforschung 2009, 63, 449–456. [Google Scholar] [CrossRef]
  35. Fujiwara, S.; Yang, K.C. The relationship between cell length and ring width and circumferential growth rate in five Canadian species. IAWA J. 2000, 21, 335–345. [Google Scholar] [CrossRef]
  36. Yang, K.C. Impact of spacing on width and basal area of juvenile and mature wood in Picea mariana and Picea glauca. Wood Fiber Sci. 1994, 26, 479–488. [Google Scholar]
  37. Yang, K.C.; Hazenberg, G. Impact of spacing on tracheid length, relative density, and growth rate of juvenile wood and mature wood in Picea mariana. Can. J. For. Res. 1994, 24, 996–1007. [Google Scholar] [CrossRef]
  38. Erickson, H.D.; Harrison, A.T. Douglas-fir wood quality studies part I: Effects of age and stimulated growth on wood density and anatomy. Wood Sci. Technol. 1974, 8, 207–226. [Google Scholar] [CrossRef]
  39. Power, H. Relations Allometriques de l’Épinette Noire (Picea Mariana (Mill.) B.S.P.) et de l’Épinette Blanche (Picea Glauca (Moench) Voss); Université du Québec à Montréal: Montréal, QC, Canada, 2013. [Google Scholar]
  40. Koubaa, A.; Zhang, S.Y.; Makni, S. Defining the transition from earlywood to latewood in black spruce based on intra-ring wood density profiles from X-ray densitometry. Ann. For. Sci. 2002, 59, 511–518. [Google Scholar] [CrossRef]
  41. Mvolo, C.S.; Koubaa, A.; Defo, M.; Beaulieu, J.; Yemele, M.-C.; Cloutier, A. Prediction of tracheid length and diameter in white spruce (Picea glauca (Moench) Voss). IAWA J. 2014, in press. [Google Scholar]
  42. Franklin, G.L. Preparation of thin sections of synthetic resins and wood-resin composites, and a new macerating method for wood. Nature 1945, 155, 51. [Google Scholar] [CrossRef]
  43. Bhat, K.M.; Priya, P.B.; Rugmini, P. Characterisation of juvenile wood in teak. Wood Sci. Technol. 2001, 34, 517–532. [Google Scholar] [CrossRef]
  44. SAS Institute Inc. Sas/Stat® 9.2 User Guide; SAS Institute Inc.: Cary, NC, USA, 2008. [Google Scholar]
  45. Littell, R.C.; Milliken, G.A.; Stroup, W.W.; Wolfinger, R.D.; Schabenberger, O. SAS for Mixed Models, 2nd ed.; SAS Institute Inc.: Cary, NC, USA, 2006; p. 814. [Google Scholar]
  46. Herman, M.; Dutilleul, P.; Avella-Shaw, T. Intra-ring and inter-ring variations of tracheid length in fast-grown vs. slow-grown norway spruces (Picea abies). IAWA J. 1998, 19, 3–23. [Google Scholar] [CrossRef]
  47. La Marca, O. Elementi di Dendrometria,, 2nd ed.; Patròn Editore: Bologna, Italy, 2004; p. 520. [Google Scholar]
  48. Matlab; Version 7.11.0 (R2010a); MathWorks Inc.: Natick, MA, USA, 2010.
  49. MRNF. La Forêt, Pour Construire le Québec de Demain; MRNF: Québec, QC, Canada, 2008; p. 73. [Google Scholar]
  50. Anfodillo, T.; Deslauriers, A.; Menardi, R.; Tedoldi, L.; Petit, G.; Rossi, S. Widening of xylem conduits in a conifer tree depends on the longer time of cell expansion downwards along the stem. J. Exp. Bot. 2012, 63, 837–845. [Google Scholar] [CrossRef] [PubMed]
  51. Larson, P.R. The Vascular Cambium: Development and Structure; Springer Series in Wood Science: Berlin, Germany, 1994; p. 725. [Google Scholar]
  52. Carlquist, S. Ecological Strategies of Xylem Evolution; University of California Press: Berkeley, CA, USA, 1975; p. 259. [Google Scholar]
  53. Taylor, F.W.; Wang, E.I.C.; Yanchuk, A.; Micko, M.M. Specific gravity and tracheid length variation of white spruce in Alberta. Can. J. For. Res. 1982, 12, 561–566. [Google Scholar] [CrossRef]
  54. Wang, E.I.C.; Micko, M.M. Wood quality of white spruce from north central Alberta. Can. J. For. Res. 1984, 14, 181–185. [Google Scholar] [CrossRef]
  55. Bouslimi, B.; Koubaa, A.; Bergeron, P.Y. Anatomical properties in Thuja occidentalis: Variation and relationship to biological processes. IAWA J. 2014, 35, 363–384. [Google Scholar] [CrossRef]
  56. Liu, S.; Bao, F. Modeling wood properties in relation to cambium age and growth rate in plantation poplar in China. J. Inst. Wood Sci. 2001, 15, 247–252. [Google Scholar]
  57. Burdon, R.D.; Kibblewhite, R.P.; Walker, J.C.F.; Megraw, R.A.; Evans, R.; Cown, D.J. Juvenile vs. mature wood: A new concept, orthogonal to corewood vs. outerwood, with special reference to Pinus radiata and P. taeda. For. Sci. 2004, 50, 399–415. [Google Scholar]
  58. Baas, P.; Schmid, R.; van Heuven, B.J. Wood anatomy of Pinus longaeva (bristlecone pine) and the sustained length-on-age increase of its tracheids. IAWA J. 1986, 7, 221–228. [Google Scholar] [CrossRef]
  59. Yang, K.C.; Chen, Y.S.; Chiu, C. Formation and vertical distribution of juvenile and mature wood in a single stem of Cryptomeria japonica. Can. J. For. Res. 1994, 24, 969–975. [Google Scholar] [CrossRef]

