1. Introduction
The need for standardized and improved
in-situ measurements of forest structural and compositional parameters is increasing. Surrogate indices and measures of structure and foliage density of a particular forested ecosystem are essential for monitoring an ecosystem’s productivity, carbon storage capacity and ability to sustain its maximum levels of biodiversity. The use of Leaf Area Index (LAI) as a measurement of forest structure and productivity has been shown to produce satisfactory results for this matter [
1,
2,
3]. Leaf area index (LAI) is a dimensionless variable and was first defined as the total one-sided area of photosynthetic tissue per unit ground surface area [
4]. It is a measure of the amount of foliage and can be estimated relatively rapidly with optical instruments. The formal definition for LAI is the amount of foliage per unit surface area (projected one-sided LAI) [
5]. Leaf Area Index is influenced by a range of factors such as seasonal climate, species composition and management practices [
1] as well as biotic agents such as disease and insect herbivores [
6].
LAI is a dynamic parameter and is driven by natural and anthropogenic processes at multiple spatial and temporal scales. Knowledge about the seasonal dynamics of foliage density through LAI measurements is important for modeling biosphere processes (e.g., water and carbon cycles) and understanding biological and physical processes in forests [
7]. Moreover, shifts in temporal and spatial dynamics of forest phenology in temperate and tropical ecosystems have been suggested as being one of the impacts of climate change on global ecosystem functioning [
8,
9,
10]. Monitoring LAI through time is therefore becoming of high interest for macroecological studies in the context of global change.
LAI measured through indirect methods (e.g., remote sensed vegetation indices, ceptometers, digital hemispherical photography) where leaf area is estimated from proximal measures, are usually faster to sample in the field and easier to process than direct methods (e.g., litterfall collection and processing). Such methods are practical for larger spatial scale assessments [
1].
Current air- and space-borne methods are based on algorithms applied to spectral information collected in the visible and infrared portions of the spectrum at moderate to high spatial resolutions. Ground measurements through direct methods and indirect optical methods (e.g., ceptometers and digital hemispherical photography) are common for LAI estimation in the field. However, they are still considered labor intensive and highly subject to biases and errors for long term monitoring programs. LAI estimation based on traditional indirect methods also relies on assumptions regarding canopy heterogeneity (vertically and horizontally), clumping, canopy closure or gaps [
11].
Over the past decade there has been a rapid development in portable Terrestrial Laser Scanners (TLS). The technology has proven highly useful for estimating total aboveground biomass and providing detailed vertical profiles of forest environments [
3,
12,
13]. Terrestrial Laser Scanner measurements are generally mounted on a survey tripod about 1.5 m above the ground. The majority of TLS instruments sample the forest with a high spatial resolution (typically about half a centimeter between consecutive laser pulses) and a relatively small laser footprint size with respect to the typical dimensions of leaves and other tree organs [
12]. When laser pulses emitted in the visible or near-infrared comes into contact with an object, part of that energy is reflected back toward the instrument and triggers the recording of its distance and intensity [
12]. TLS systems typically employ vertical and horizontal scanning about a fixed point of observation, providing a hemispherical representation of biomass distribution in the forest leaves, branches and trunks, which allows exploring foliage angle distributions and clumping [
3,
13,
14,
15].
In recent years, research on LAI estimation has largely focused on the improvement of algorithms for its retrieval based on indirect methods and the addition of correction factors for the proper validation and derivation of global LAI models based on satellite imagery. However, one of the main challenges in LAI estimation is the identification of the causes of its variation, as well as the structural and physiological processes that influence its dynamics in different ecosystems. The need for hypertemporal information on indirect ground LAI estimates is especially important for understanding the physiological basis of LAI dynamics and improving validation techniques for remote sensing products.
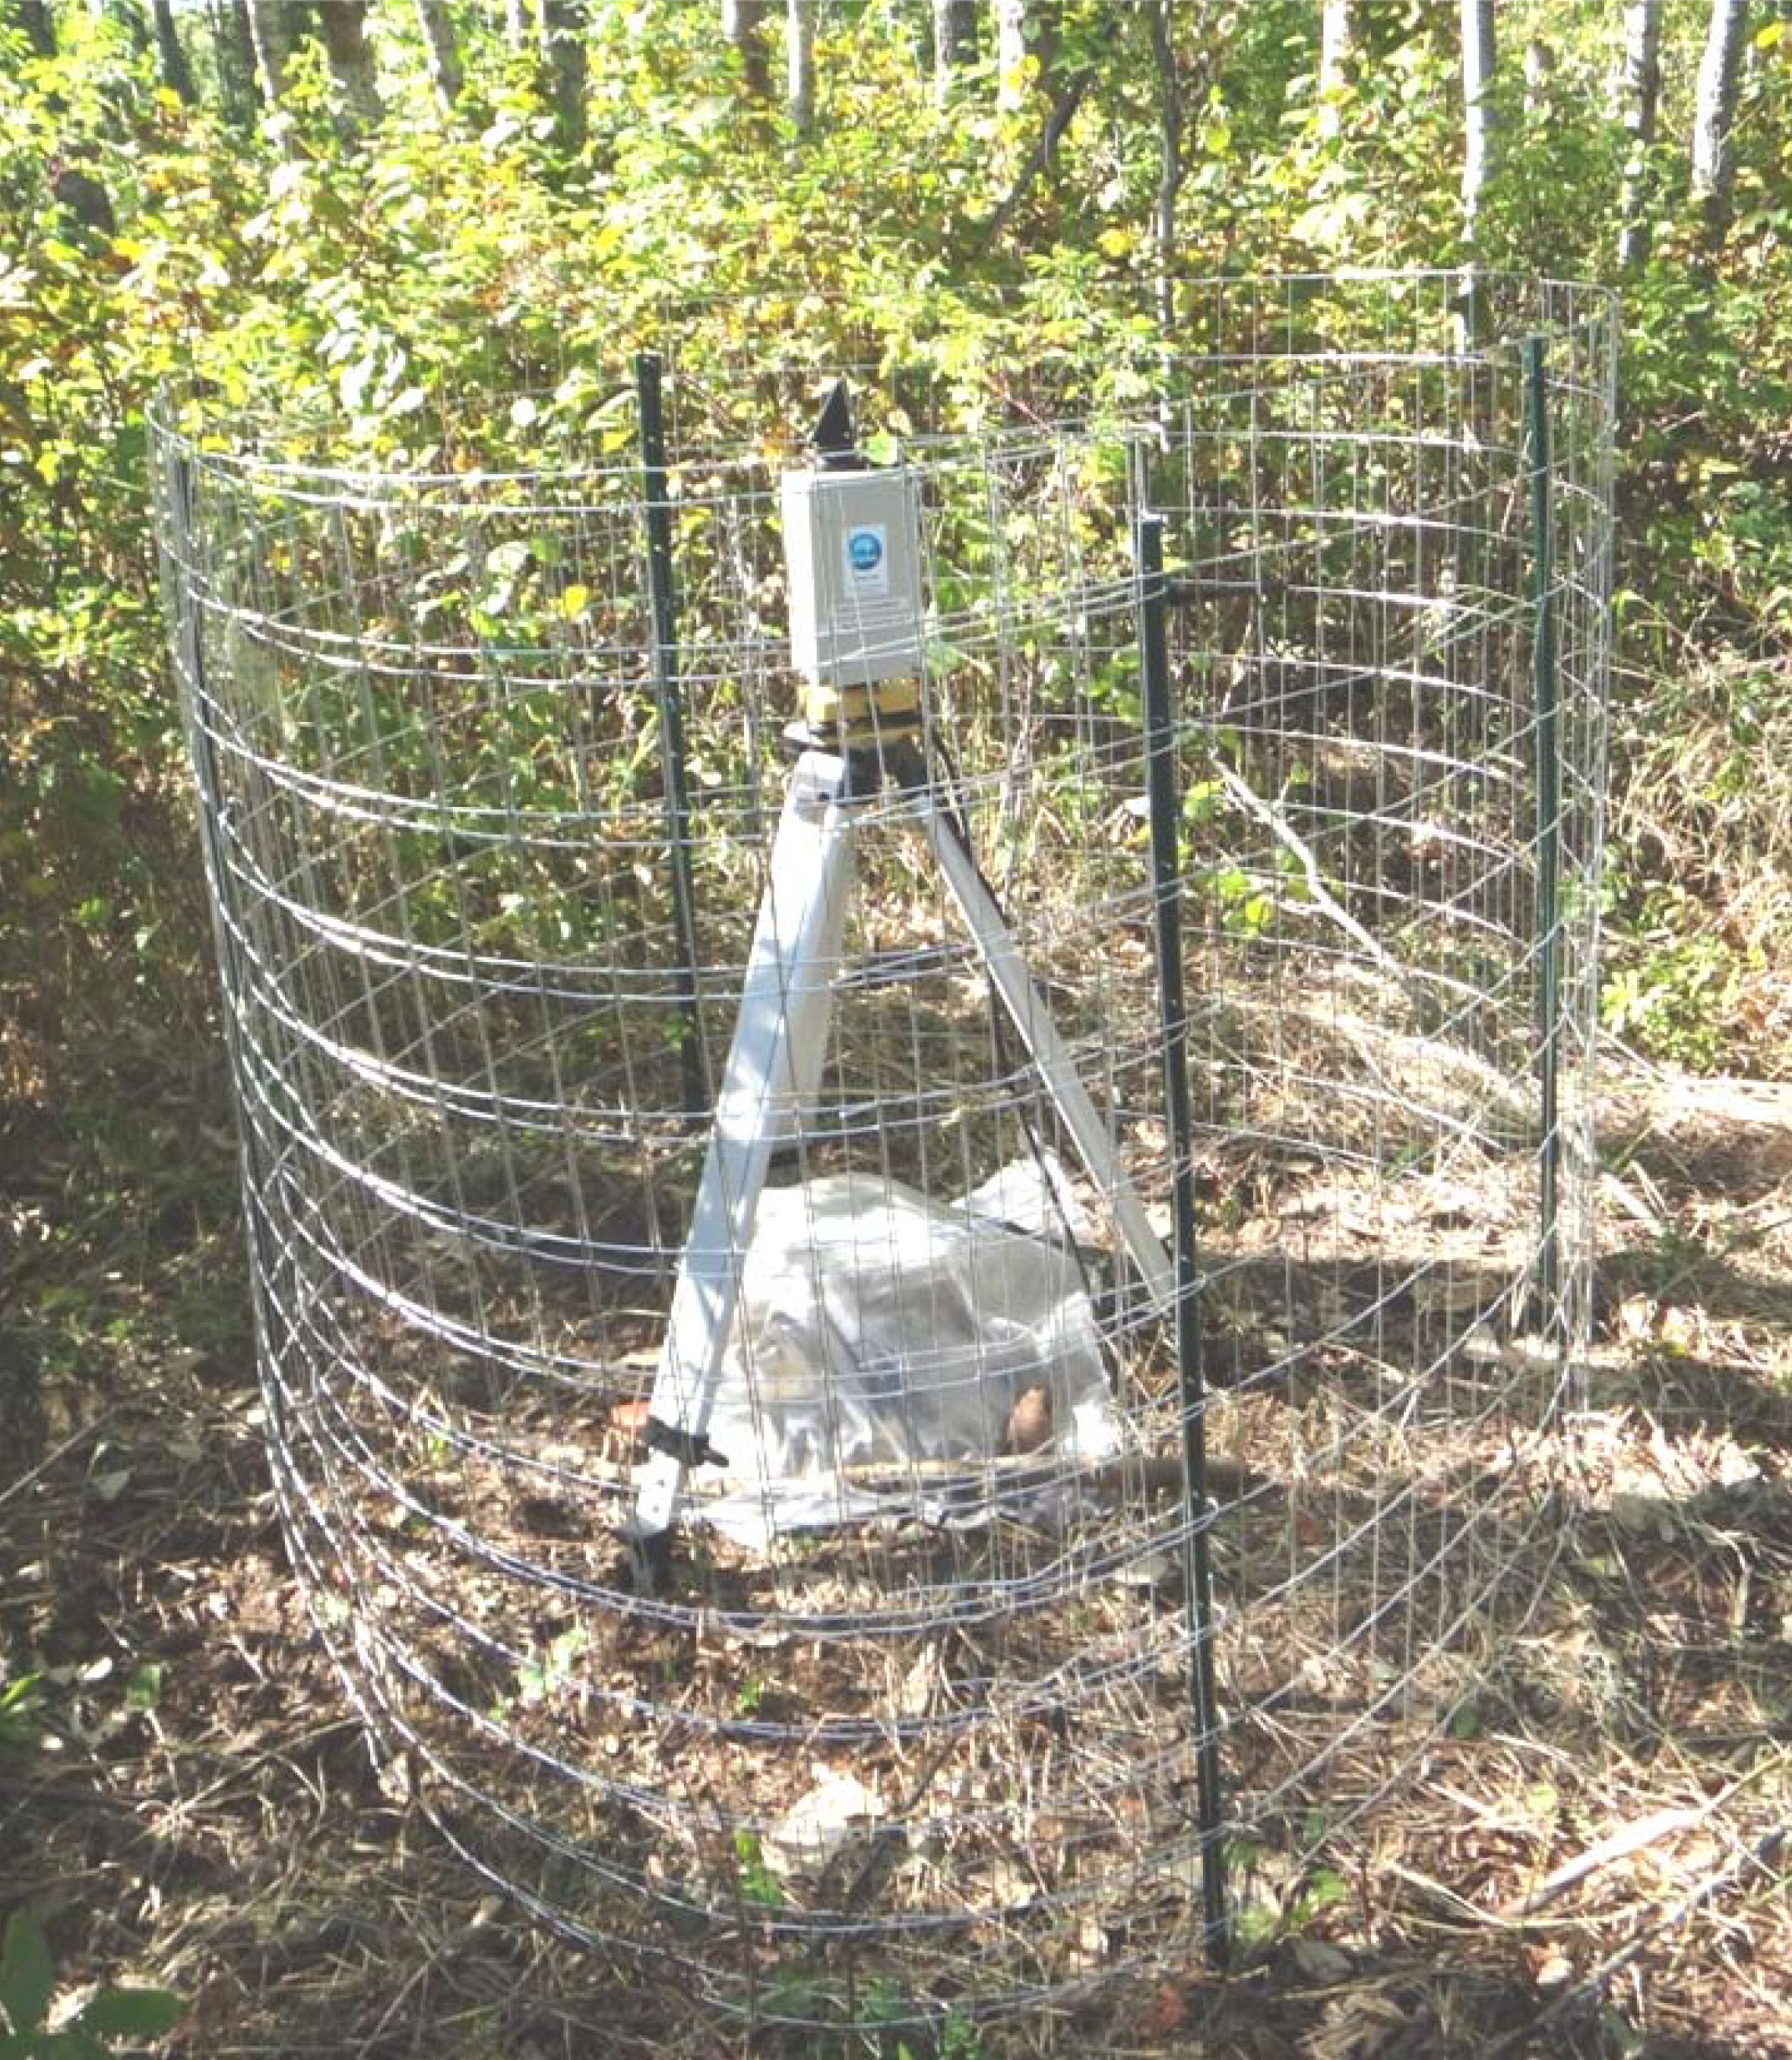
As part of its program on vegetation monitoring, Australia’s Commonwealth Scientific and Industrial Research Organisation (CSIRO) has developed a new experimental TLS named VEGNET. The VEGNET system is a solar-powered device for semi-permanent installation in the field and automated operation. The VEGNET system provides indirect measures of LAI at a fixed angle based on optimized principles and algorithms for LAI retrieval. This new type of TLS was designed as an alternative to the use of 3-D TLS devices which can be costly and require complex post-processing for LAI retrieval. The VEGNET instrument automatically scans the forest on a daily basis, producing a vertical foliage density profile at a temporal frequency compatible with earth observation satellites. Given its automated mode of operation and semi-permanent installation, the VEGNET instrument is described hereafter as an In-situ Monitoring Lidar (IML), being a sub-category of TLS instruments specifically designed for automated, long term monitoring. In this paper, we report results from a study to test the performance of this device to capture changes in LAI during the fall season in an Aspen Parkland forest in Alberta, Canada and provide insights on its performance and capabilities.
4. Discussion
During the implementation of this study, the VEGNET instrument proved to be an autonomous IML system that was easy to set up in the field, physically stable and adapted to endure field conditions. The programming of the device through the microcontroller was simple and straightforward, and its performance during 22 consecutive nights showed satisfactory results. A total of 85 scans were performed, and less than 8% of the data were excluded because of poor number of records and hits registered as a result of precipitation events that caused condensation on exposed optical surfaces. Based on this, we would expect that the number of discarded scans will increase during seasons with frequent rain and frost in temperate climates. However, the ability to run the instrument during unlimited consecutive nights allows the user to exclude weather-affected scans and still retain sufficient data for detection of forest structural change.
Unfortunately, there are no previous studies on LAI or PAI for the Aspen Parkland forests located at our study site that could be directly compared with the results of this work. However, for Aspen forests in the middle of summer, studies have shown that Plant Area Index values, derived from indirect optical measurements, range from 1.5 to 3 with an average of 2.5 [
21]. In the middle of fall (September), PAI values average 1.5 and decrease towards near-zero values in November and December [
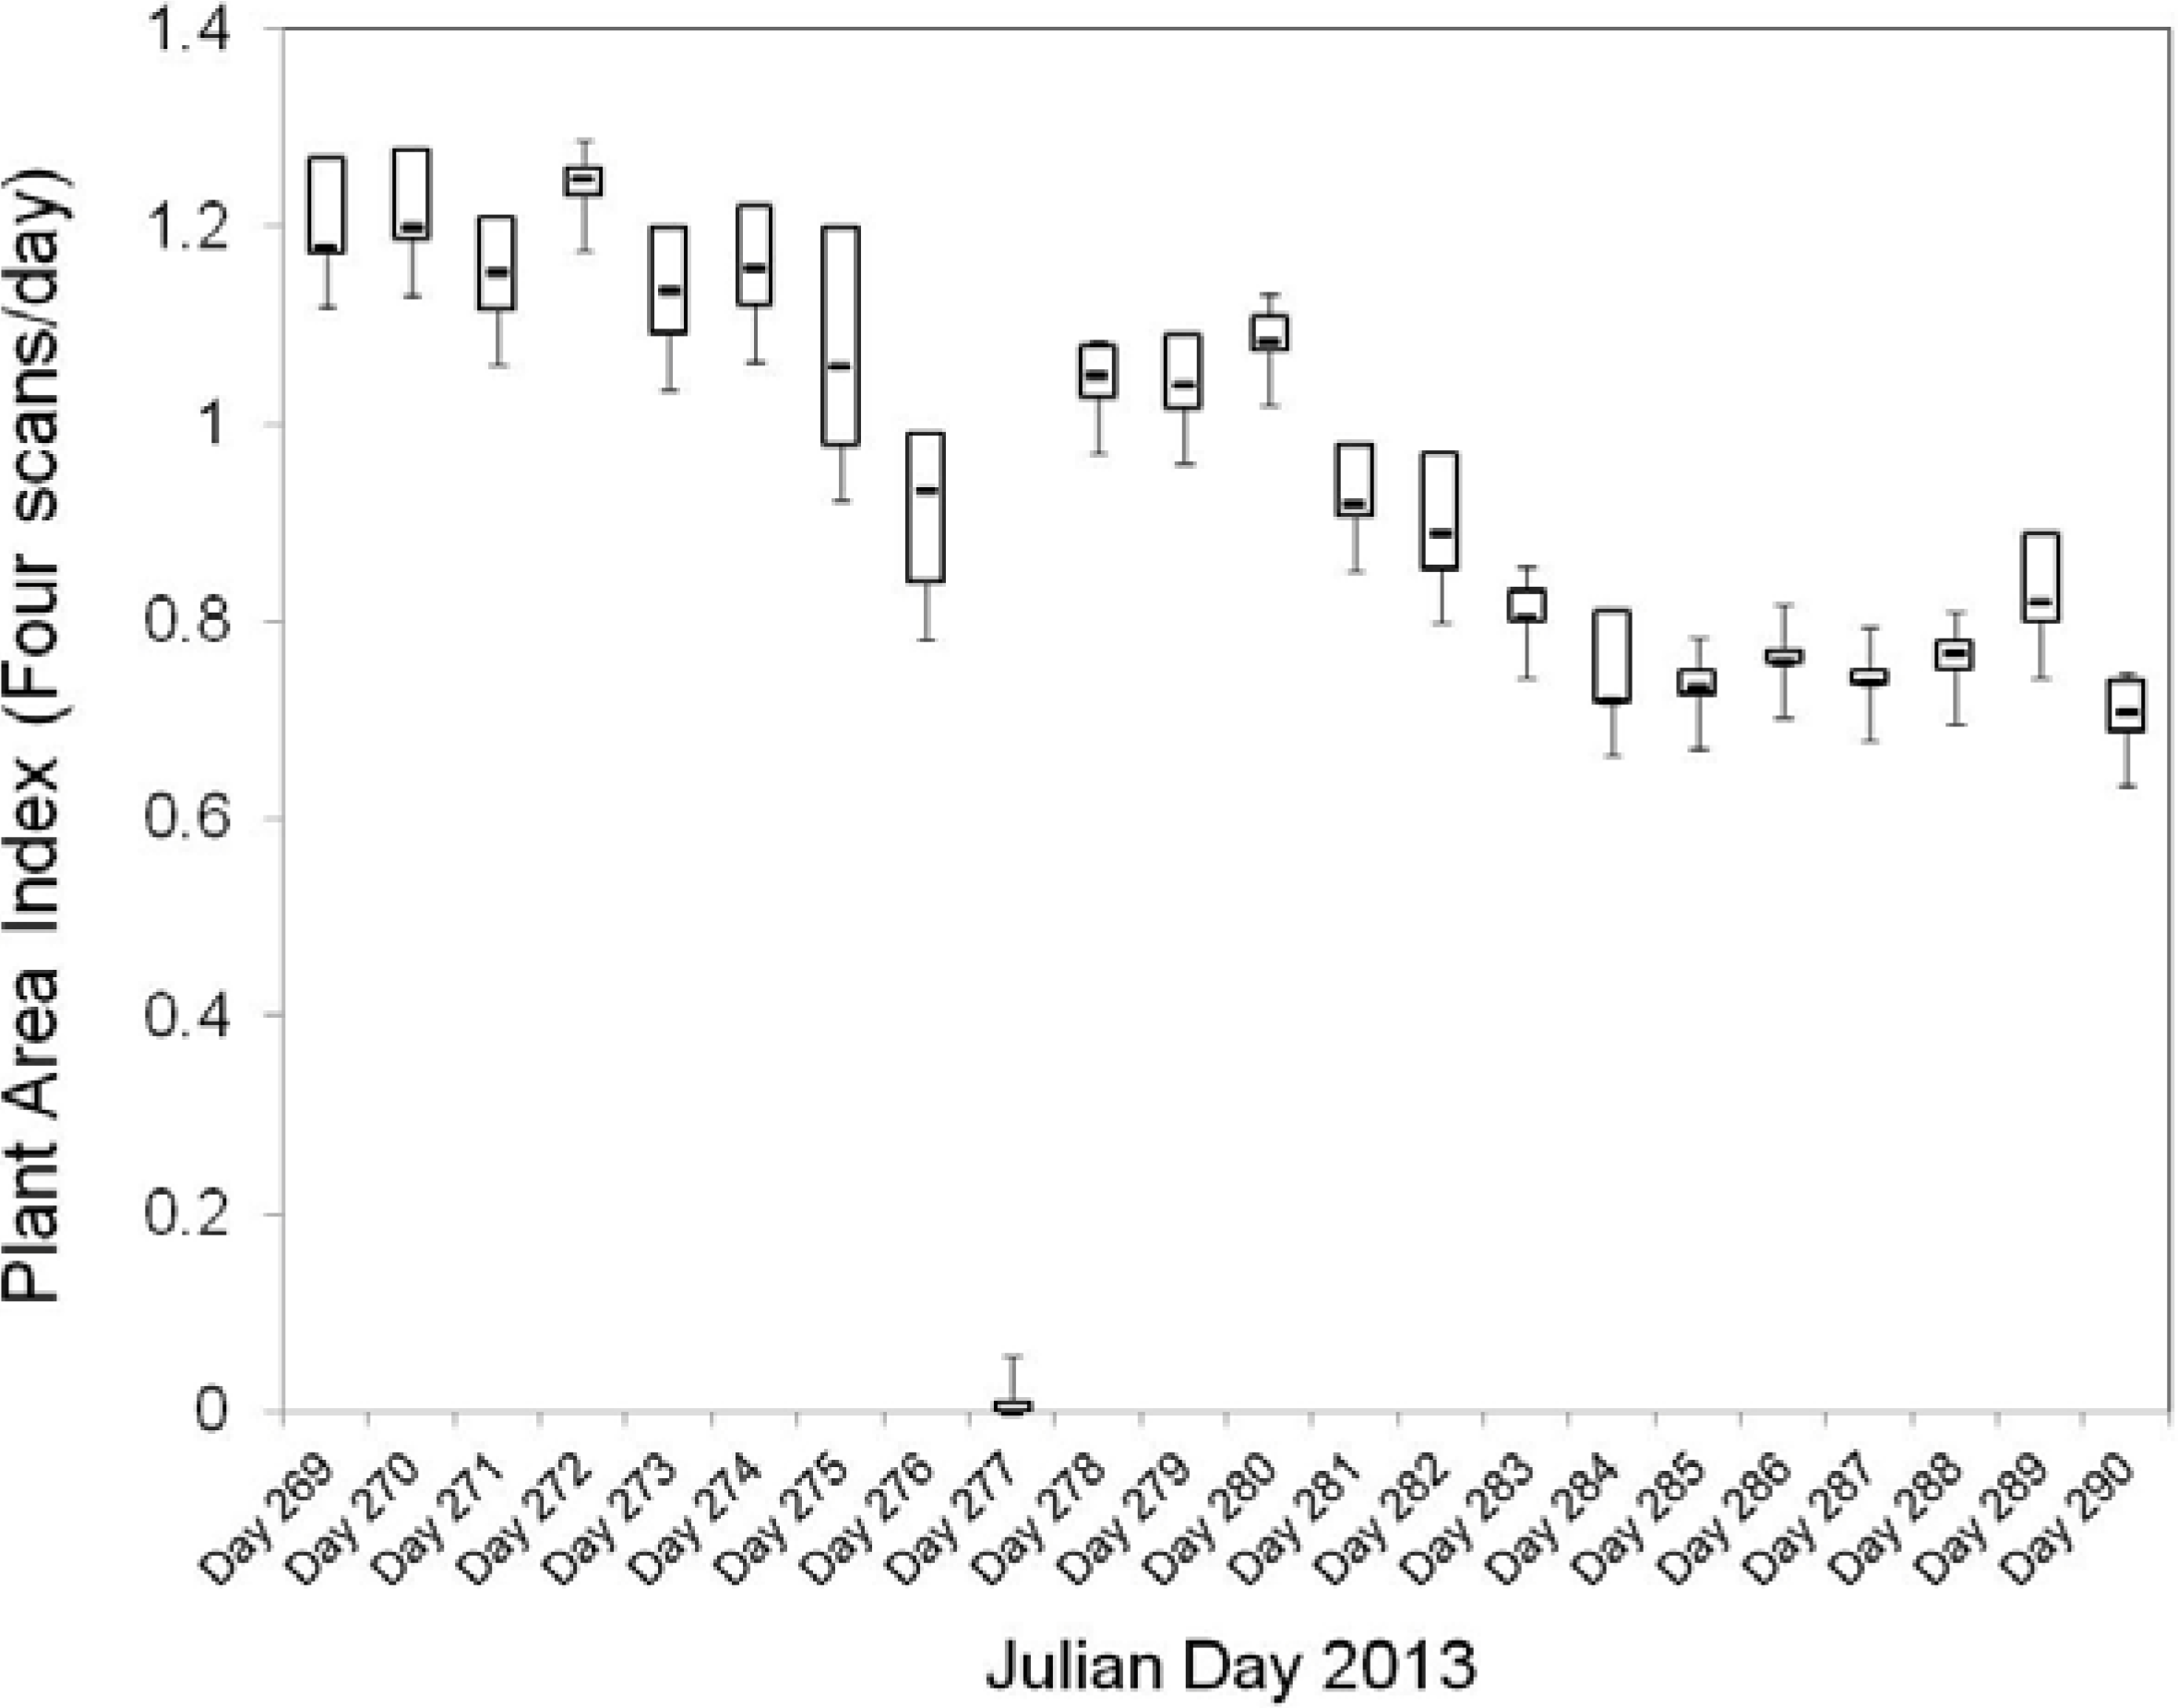
22]. MODIS 8-day LAI values ranged from 3.5 to 6.5 for the study site during mid-summer 2013 (July) decreasing to 1.6 at the starting week of September 2013. In this study, the highest value of maximum cumulative PAI measured was 1.27 on the Day 269 (September 26), and the lowest maximum cumulative PAI measured was 0.67 on Day 290 (October 17), which are consistent with expected values found in the literature.
The decrease in PAI values registered by the IML instrument during the time of the study was related to the process of leaf-fall in Aspen canopy, understory trees and shrubs during the fall season, as expected. As seen in
Figure 2, variability in PAI values was observed between measurements performed in the same night. This variation corresponds to differences in the number of laser measurements and differences in the targets intercepted by the laser which can correspond to a different part of the same branch, trunk or leaf. The random displacement of branches and leaves by the wind causes these differences in the targets hit by every scan during the same night of data collection [
12].
Studies on the structure and composition of the Aspen Parkland forests in western Canada have described average canopy tree heights of 15–16.4 m [
23,
24] and the existence of a canopy, tall shrub and low shrub vegetation strata for this forest type [
25]. In the field site, we observed a similar forest structure with a high density of low shrubs and medium density of tall shrubs. The instrument was positioned approximately 20–25 m from a large canopy gap, which increased the amount of understory vegetation towards that part of its field of view.
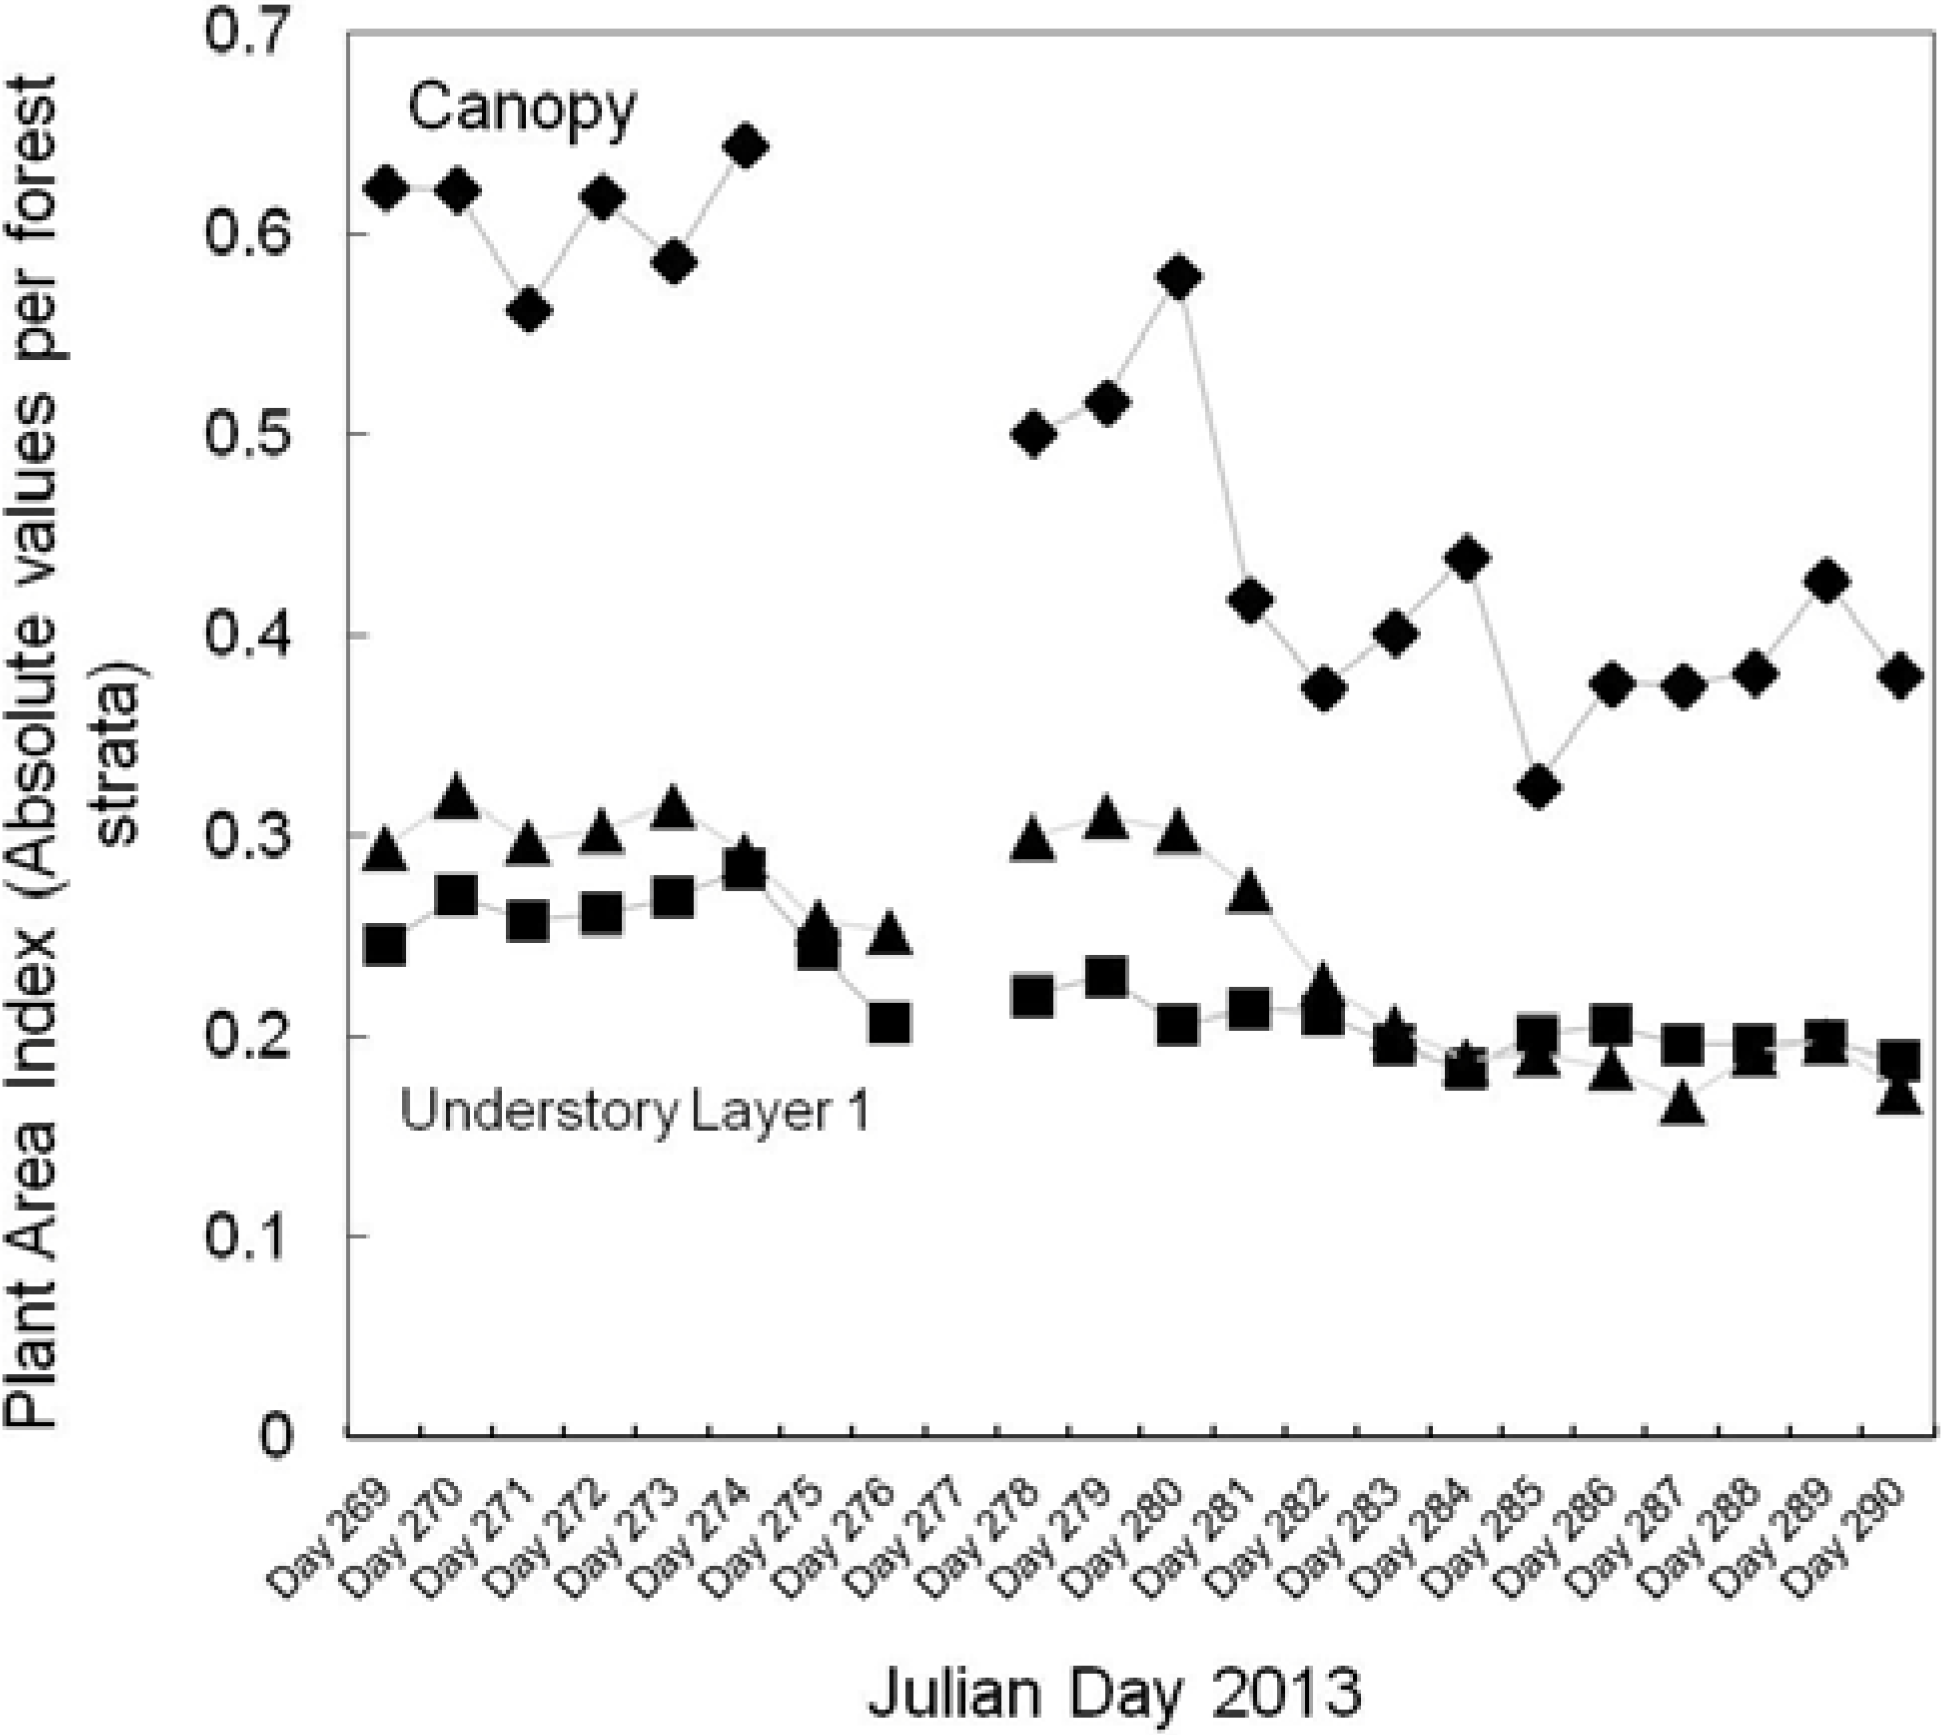
The IML recorded an average peak in overstorey canopy density at 16.3 m, which fitted within the range of the average tree height reported in previous studies of Aspen parkland forests and our estimates by visual inspection in the field. Average maximum height of a plant element registered by the instrument was 19.1 ± 0.2, which represents leaves and/or branches at the top of the canopy. PAVD also peaks at heights of 4 and 6 m, corresponding to Low shrubs (understory layer I) and Tall shrubs (understory layer II), respectively. We estimate that hits were registered from understory vegetation concentrated about 2–6 m around the instrument’s position. Understory vegetation at these heights corresponded to the sum of low and tall shrub biomass (leaves and branches) and trunks of canopy trees. PAVD values registered around heights of 8–12 m corresponded mostly to trunk biomass of canopy trees, and less to photosynthetic biomass. This is particularly evidenced by low and stable PAVD values through the time-series at these heights.
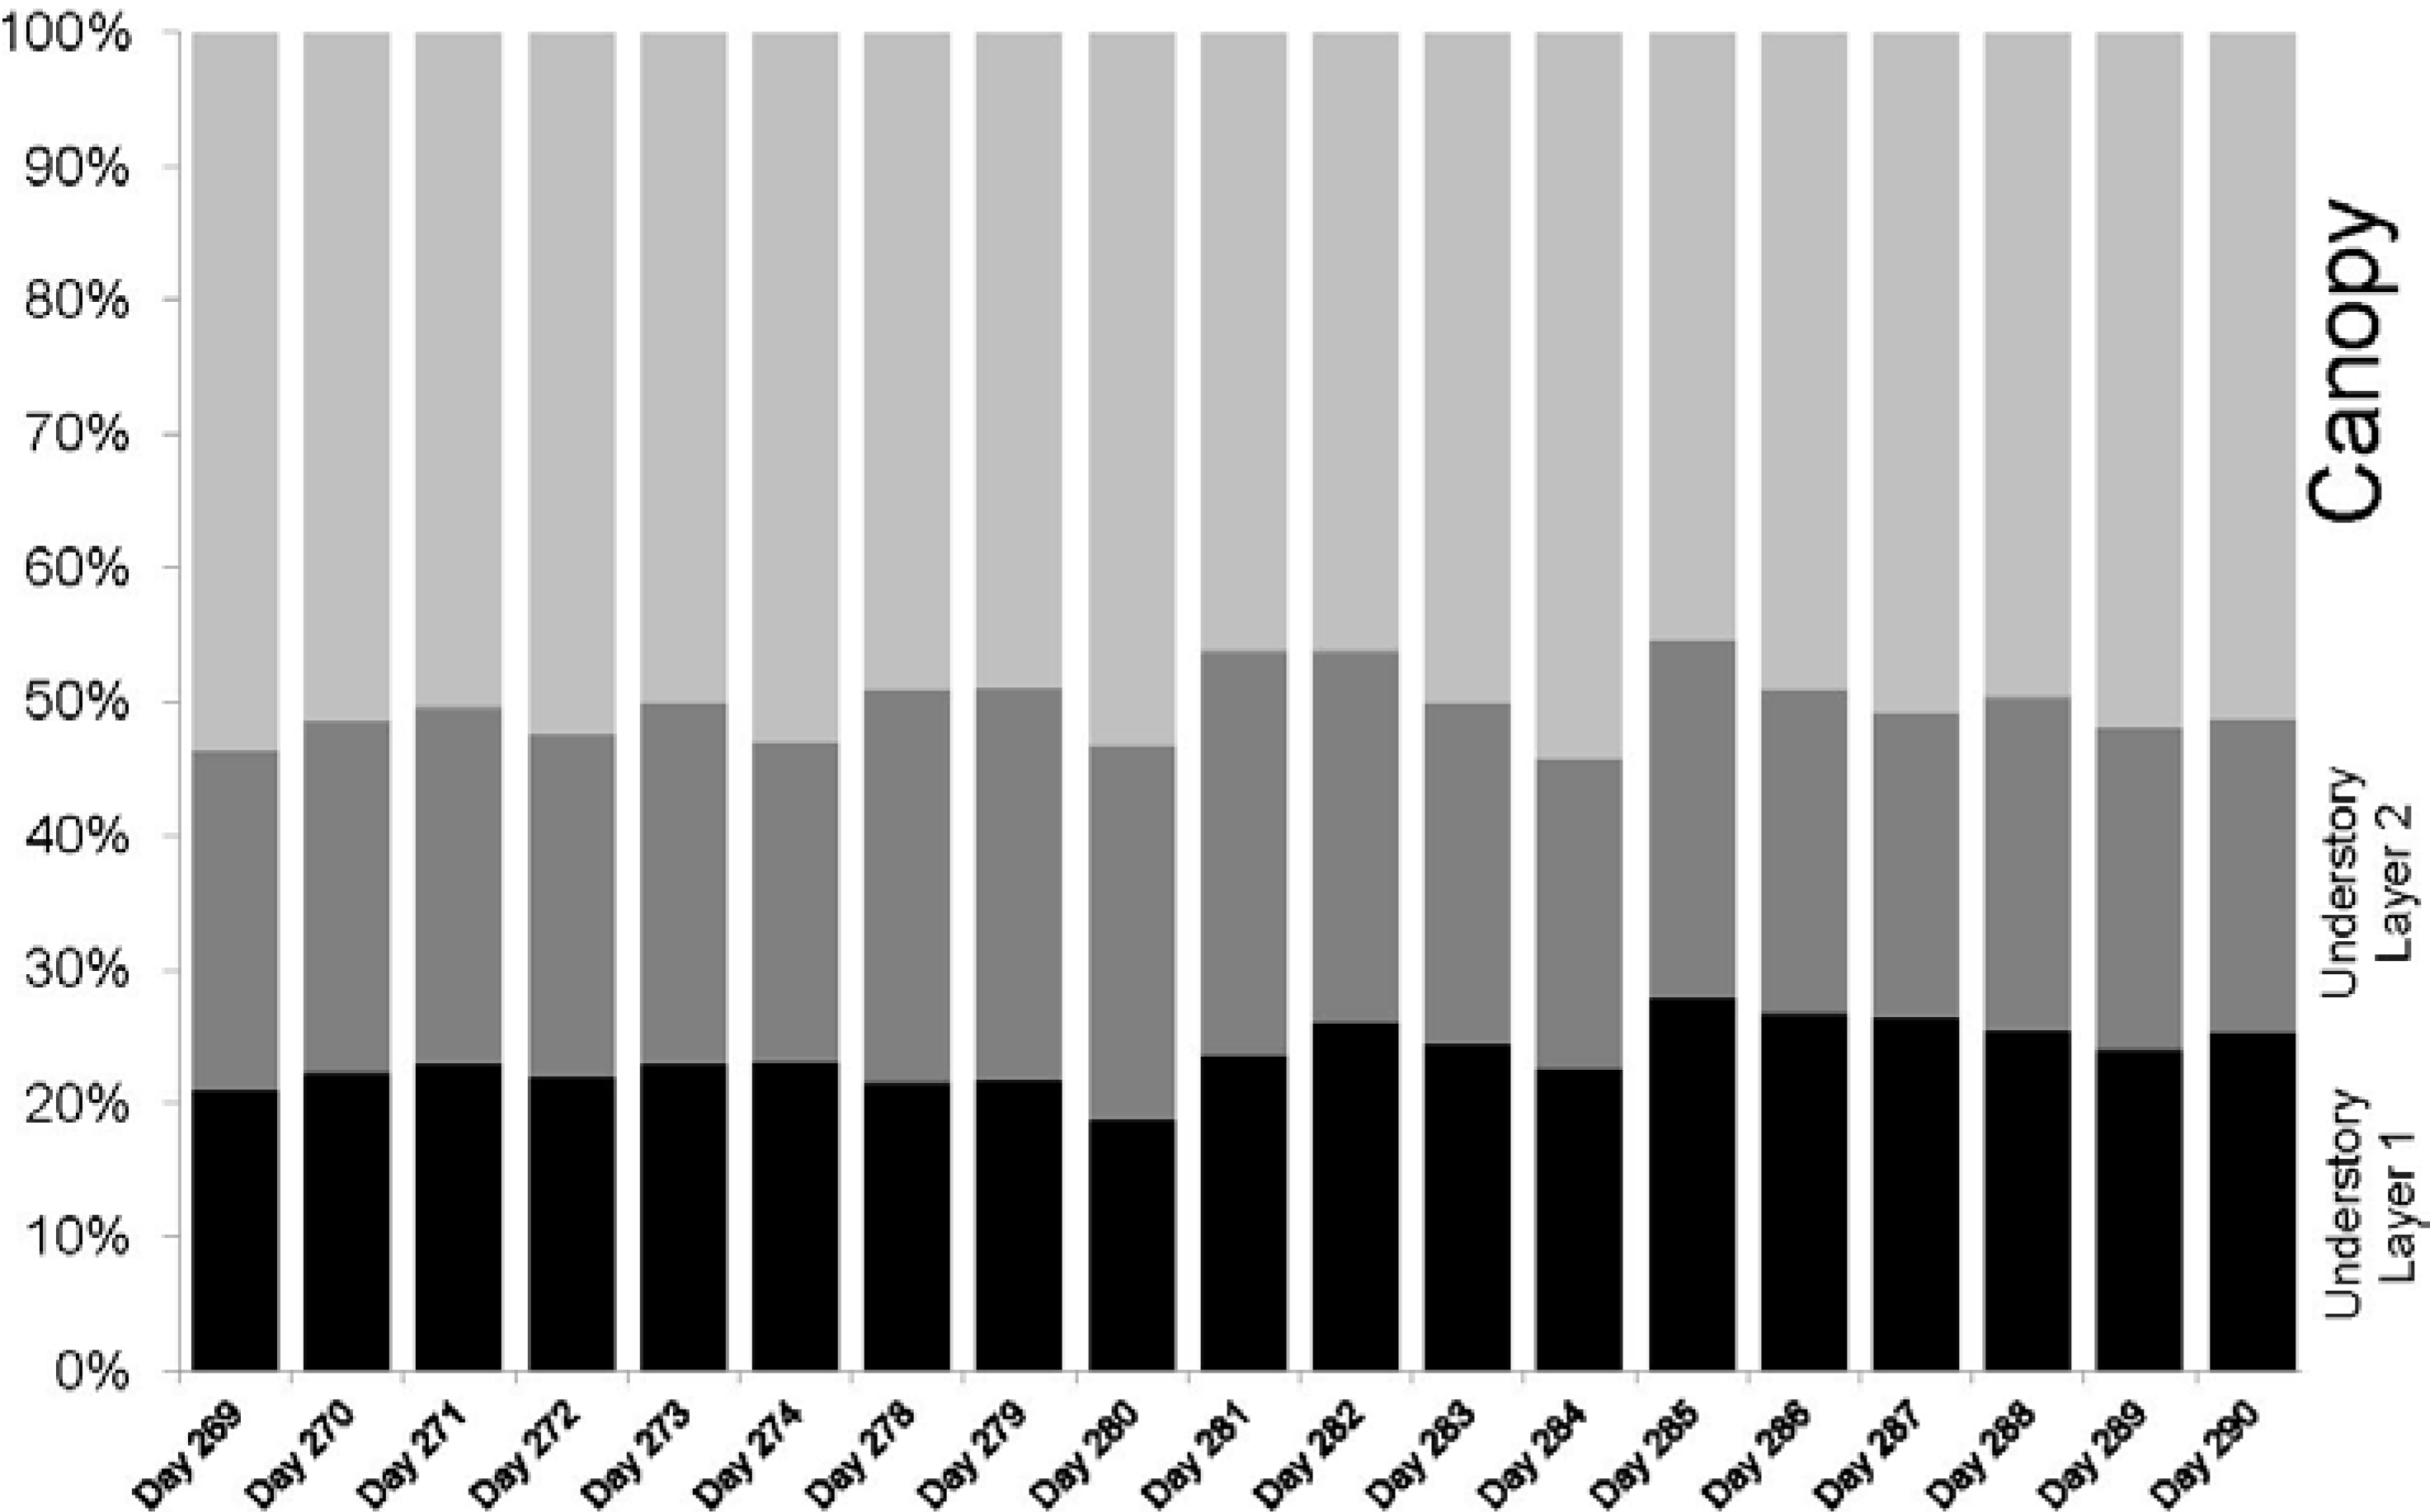
Phenological changes during the time of data collection were captured in four ways: number of hits, maximum cumulative and absolute PAI values, time series of PAVD profiles and PAI values per forest strata. The ability to extract PAI values per height or height range using the IML data allows for a better understanding of the contribution of each forest stratum to the maximum cumulative PAI. Differences in trends in PAI and PAVD values observed for the canopy, understory layer I and understory layer II were registered by the instrument. While both canopy and understory layer II show a continuous decrease of PAI and PAVD values, the understory layer I does not show strong changes with time. This is expected since there is a higher component of woody biomass from understory vegetation and trunks of canopy trees in the lower forest stratum.
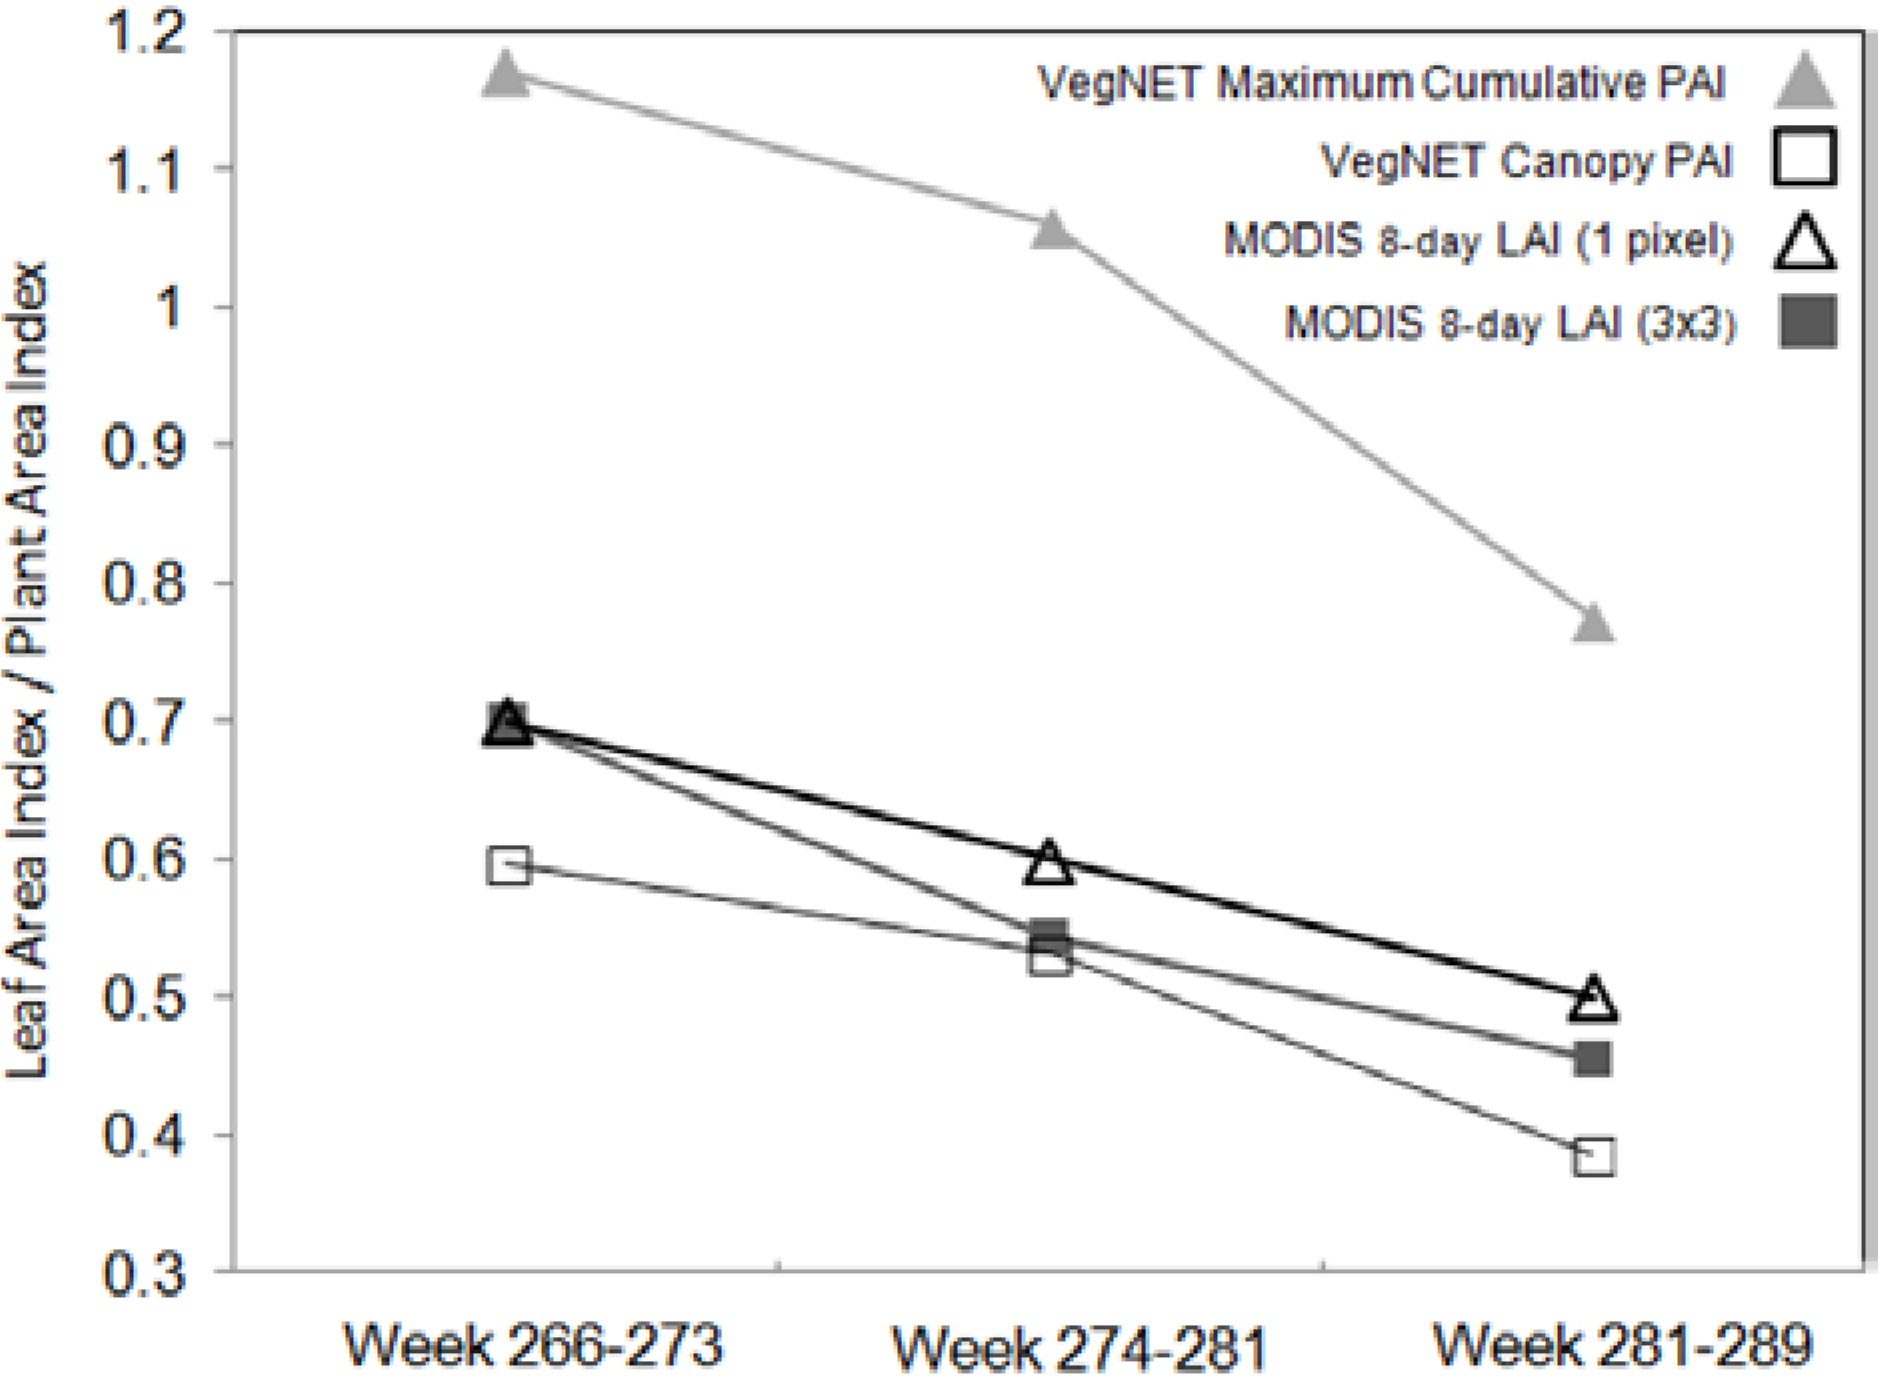
The comparison to MODIS 8-day LAI at 1 km spatial resolution showed interesting results. In order to subtract the effect of adding understory and subcanopy non-photosynthetic biomass, we compared MODIS LAI values (single pixel and 3 × 3 window mean) to the IML PAI values only for the Canopy height zone (14–18 m). In this case, both values not only show a similar decreasing trend but only differed by 2%–15%, in contrast to the 48% difference to IML maximum cumulative values.
We can infer that patchy distribution of understory biomass in the area, as well as the presence of linear openings and small ponds at the landscape level yielded lower LAI values at 1-km resolution, however, MODIS LAI retrieval algorithms have included corrections to subtract woody area index from total LAI estimation for each forest type, including broadleaf deciduous forests. The exclusion of understory vegetation from ground PAI estimation might have leveled out the comparison, therefore, allowing IML Canopy PAI to resemble expected LAI values for this forest type. Given the potential of using an IML system to validate spaceborne LAI products, future research should be made to investigate how IML PAI values compare to indirect optical and satellite-based measurements during a longer period of time, and whether the calculation of IML Canopy PAI resembles actual LAI estimates for Aspen Parkland forests or other vegetation types.
5. Conclusions
The use of ceptometers and digital hemispherical photographs to estimate Plant Area Index often include biases and errors from instrument positioning and orientation in the field or from differences in thresholding to the optimal brightness level during the generation of the binary image (1). However, LAI retrieval from these techniques remain a common practice in forestry and ecology; especially, since recent research has attempted to improve its PAI estimates through a better description and sampling of canopy heterogeneity (vertical and horizontal heterogeneity, clumping, canopy closure or gaps) [
11]. These methods are also part of the standard validation methods of remotely-sensed LAI products [
19,
26]. However, there has been an increase in research applied to the use of TLS systems as alternative methods to measure PAI and LAI. Multi-angular techniques such as terrestrial laser scanners (TLS) allow a more detailed and accurate exploration of foliage angle distributions and clumping that can help to resolve aspects of the foliage profile that are not fully addressed by other indirect methods.
As Breda
et al. [
11] suggests, the main challenging point to improve LAI measurement is to identify clearly the causes of its variation. The ability to track changes of PAI or LAI on a daily basis during extended periods of time can allow the identification of physiological triggers and/or structural effects on LAI estimates. The VEGNET system used in this study, proved to be an autonomous IML system that was easy to set up in the field, physically stable and adapted to endure field conditions. The instrument captured maximum cumulative and vertical distribution of PAI consistent with estimates found in the literature for the region and other MODIS LAI estimates. It was able to collect daily data without the need for frequent visits to the field. As an alternative to other TLS instruments, the IML system has the potential of providing useful and consistent data for structural and phenological studies at lower cost because it does not include vertical scanning functionality. The system is suitable for medium to long term forest monitoring studies at a “plot” scale, where the plot radius is approximately twice the canopy height. Although the system captures relatively little spatial detail, the small data volume is suitable for wireless transmission to a data aggregator, which can send data to the user’s computer via cell-modem communications. Such characteristics are advantageous especially since there is a need to explore hypertemporal information in real time to improve the effectiveness of decisions for researchers (during data collection seasons) and environmental managers.
More studies are needed in order to validate the IML maximum cumulative PAI, and total PAI values at different heights. This must be done by comparing its measurements to actual values of LAI (direct methods) and indirect estimates (digital hemispherical photographs, ceptometers and TLS systems). Studies should include tests of its performance in different forest types, successional stages and disturbance scenarios.


