Tree Root System Characterization and Volume Estimation by Terrestrial Laser Scanning and Quantitative Structure Modeling

 ,
, 
Abstract
:1. Introduction
2. Materials and Methods
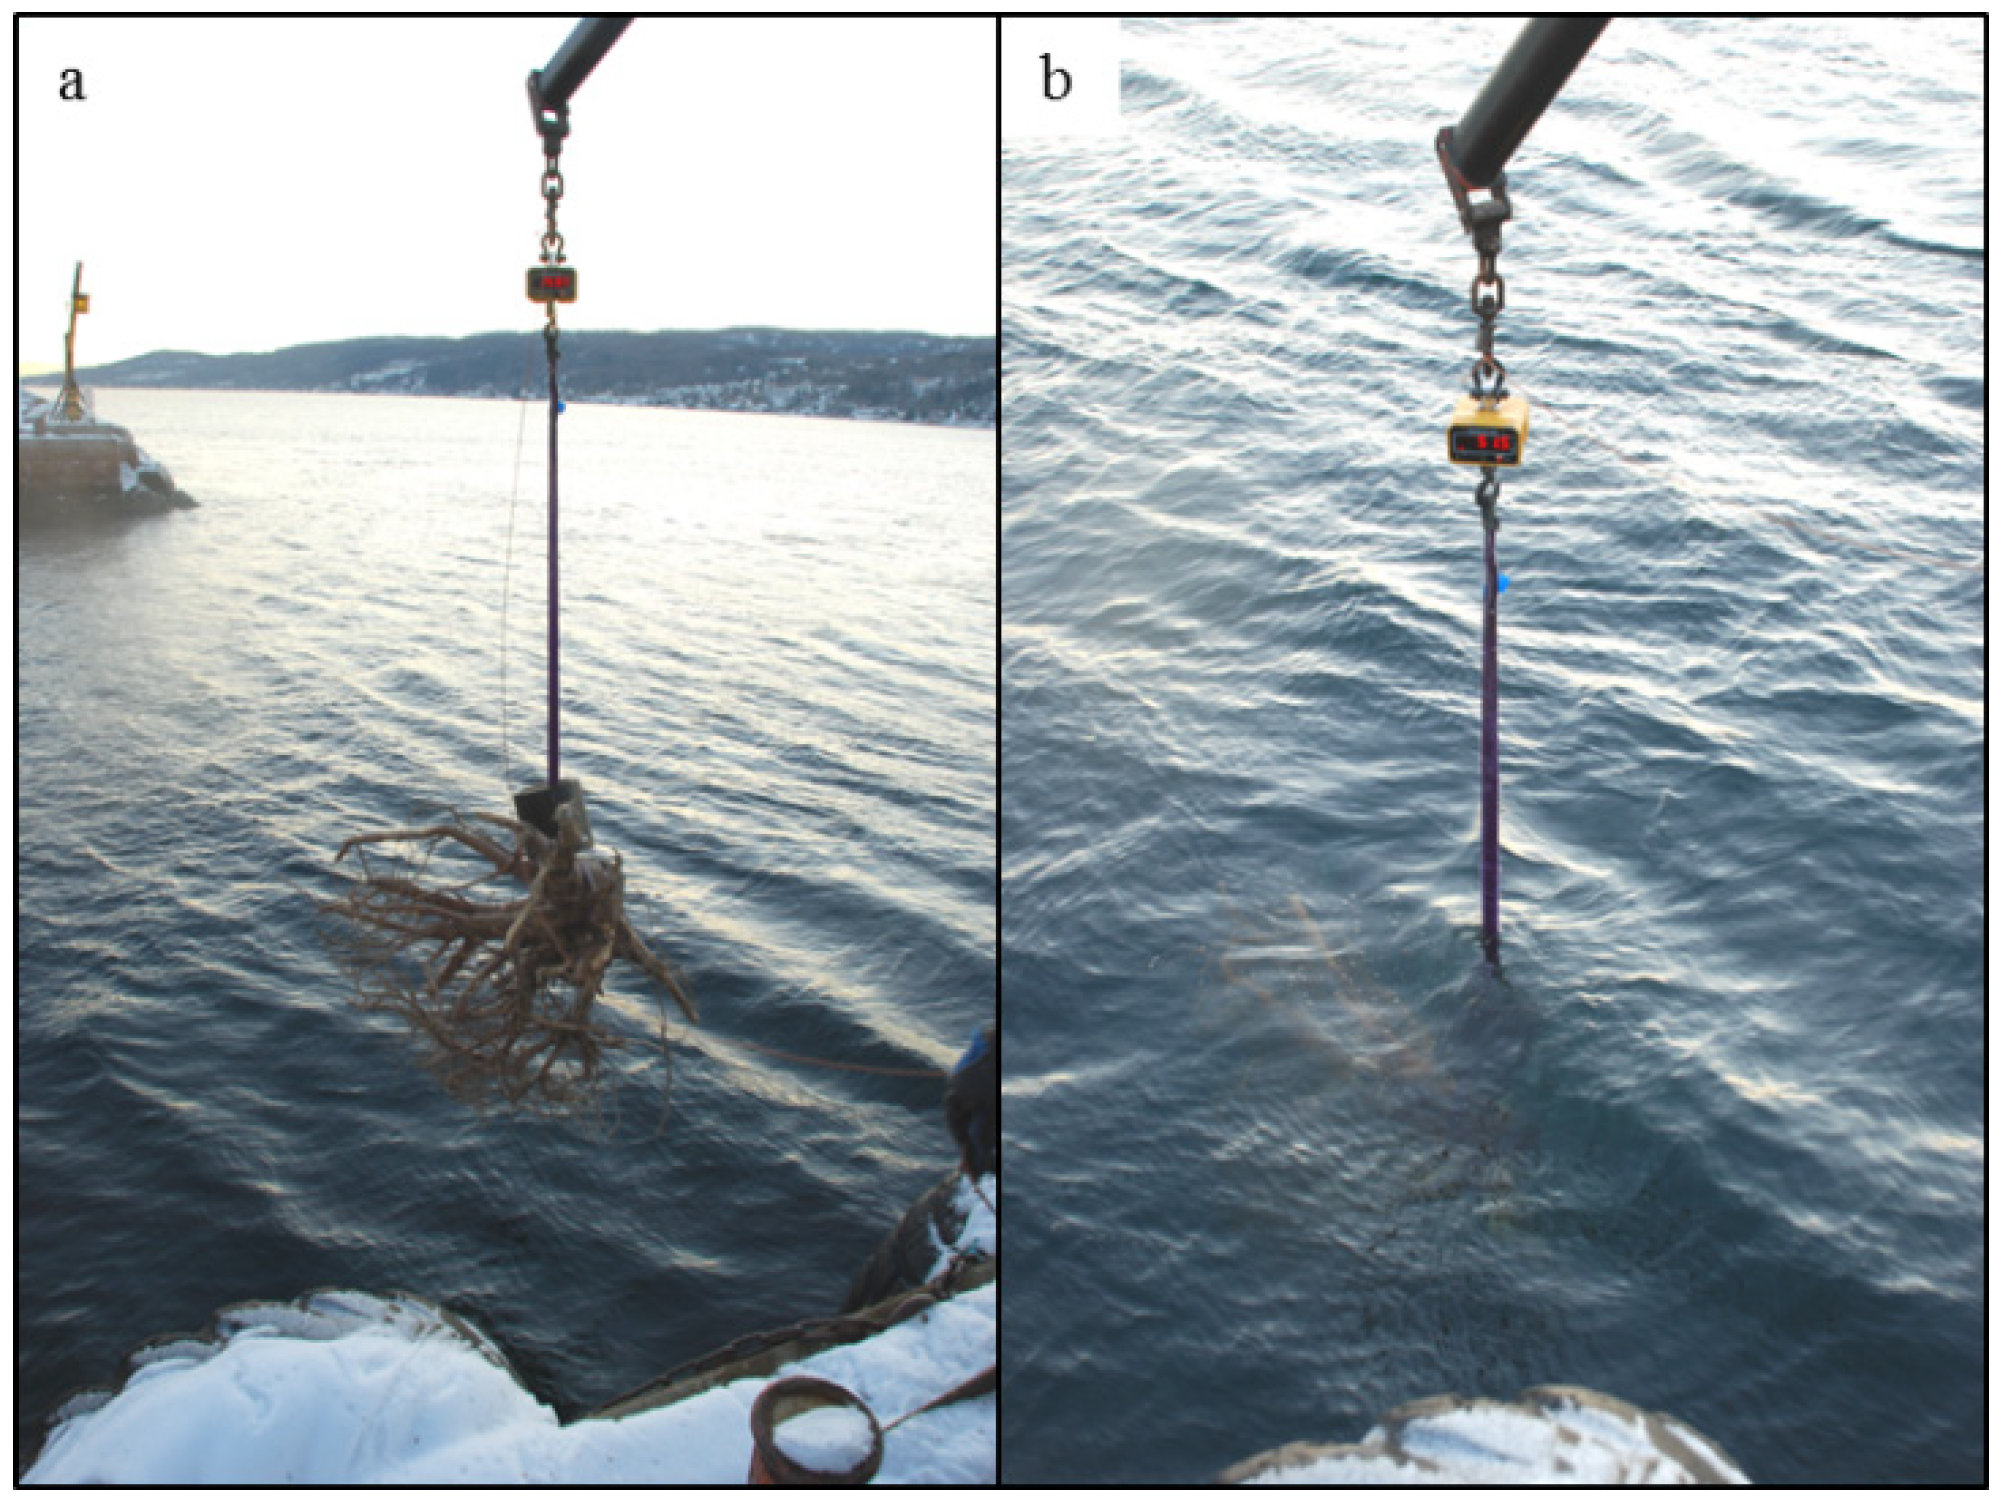
2.1. Root System Acquisition and Preparation
2.2. Root System Volume Measurement

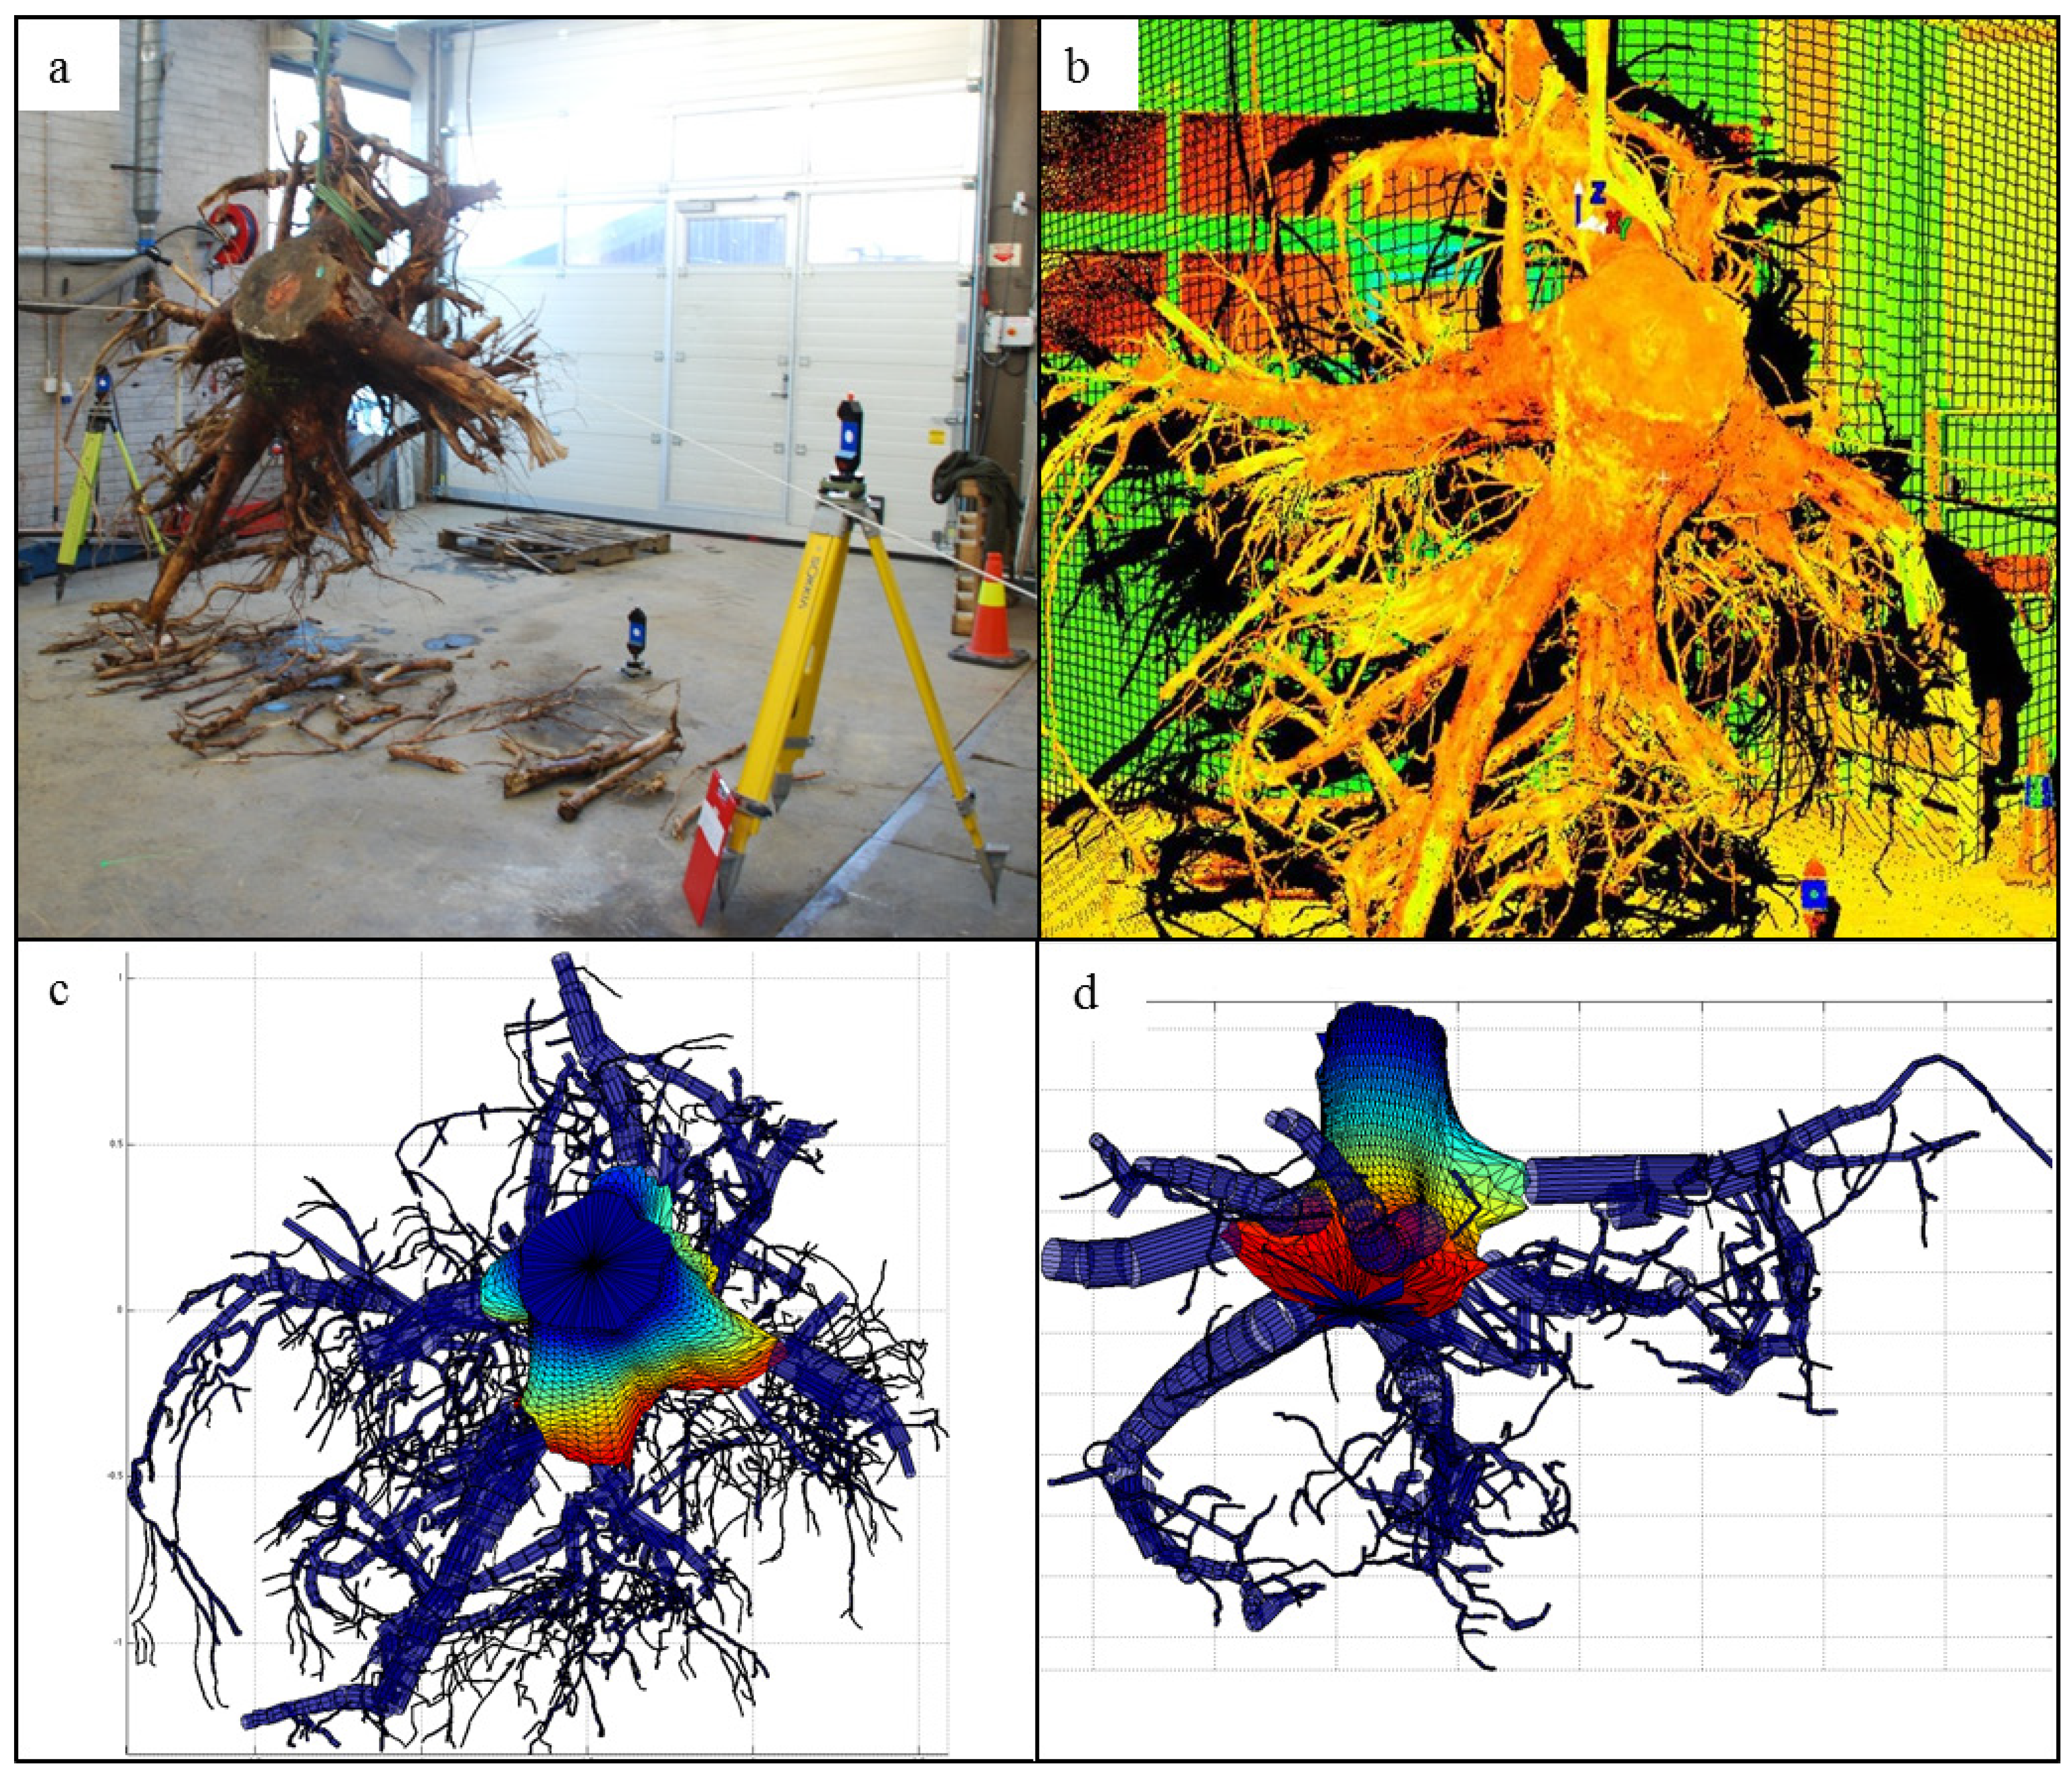
2.3. TLS
2.4. 3D Quantitative Structure Model (QSM)
2.4.1. Outline of the Method
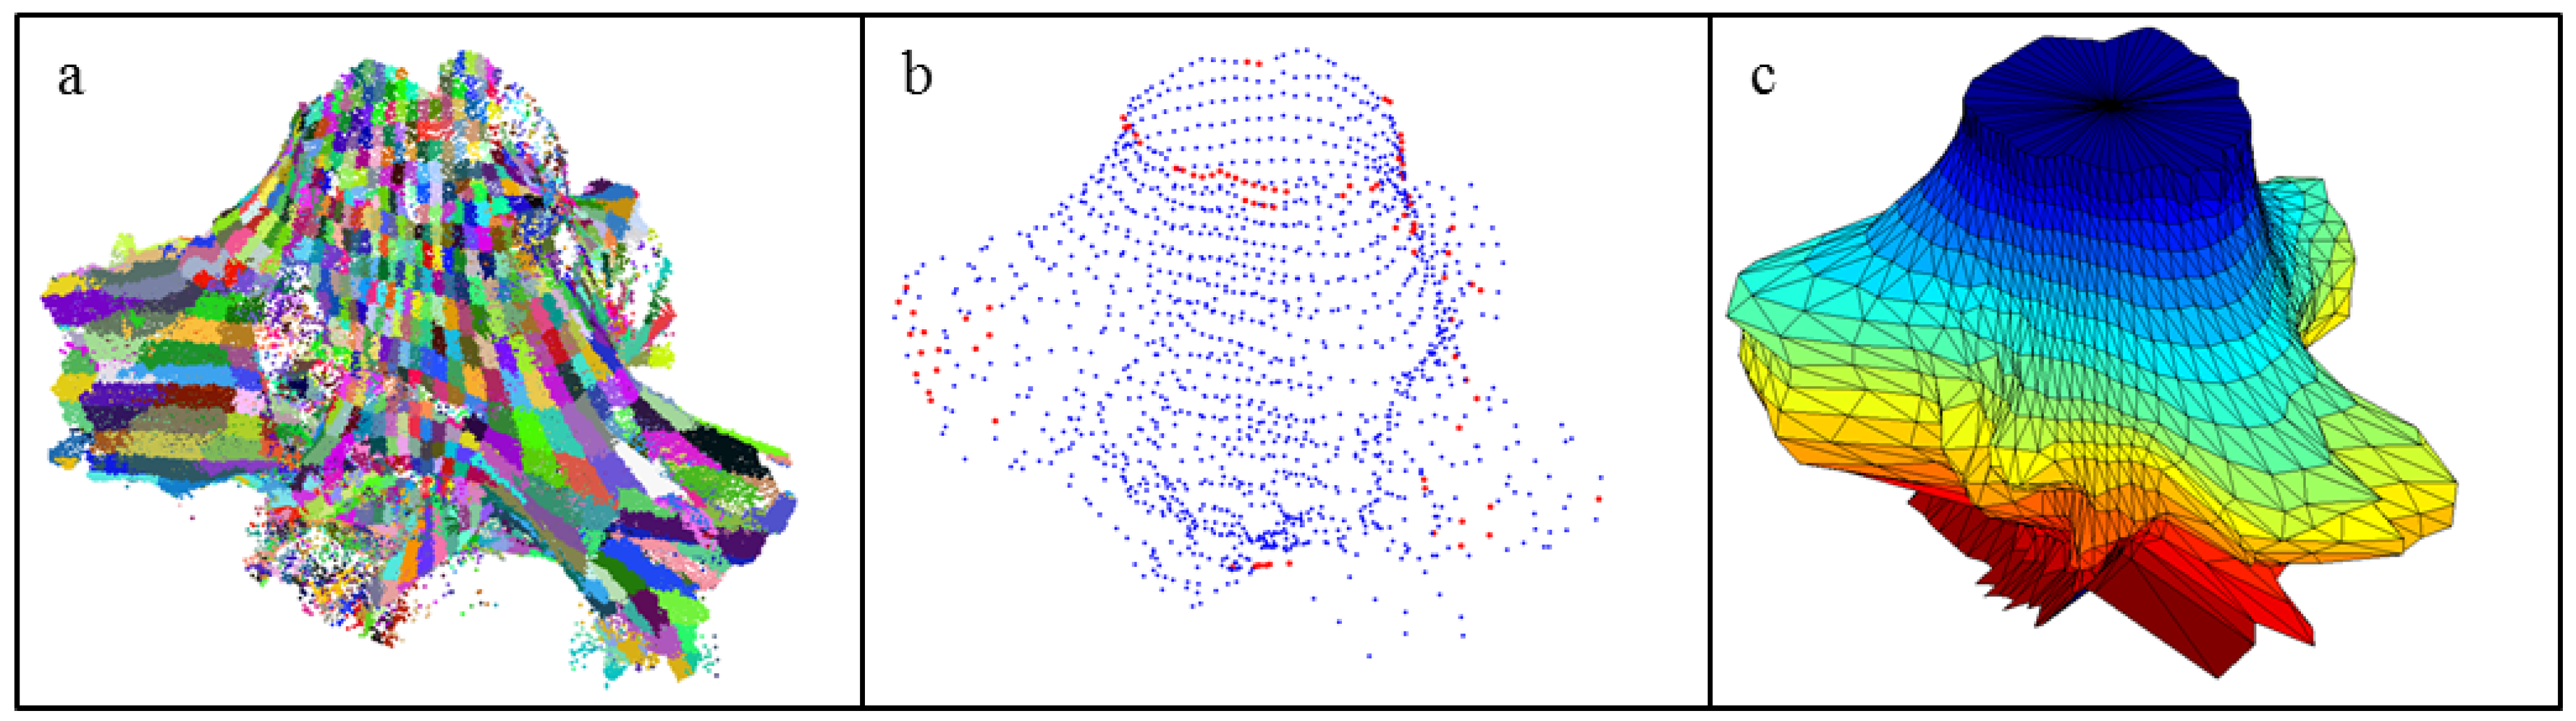
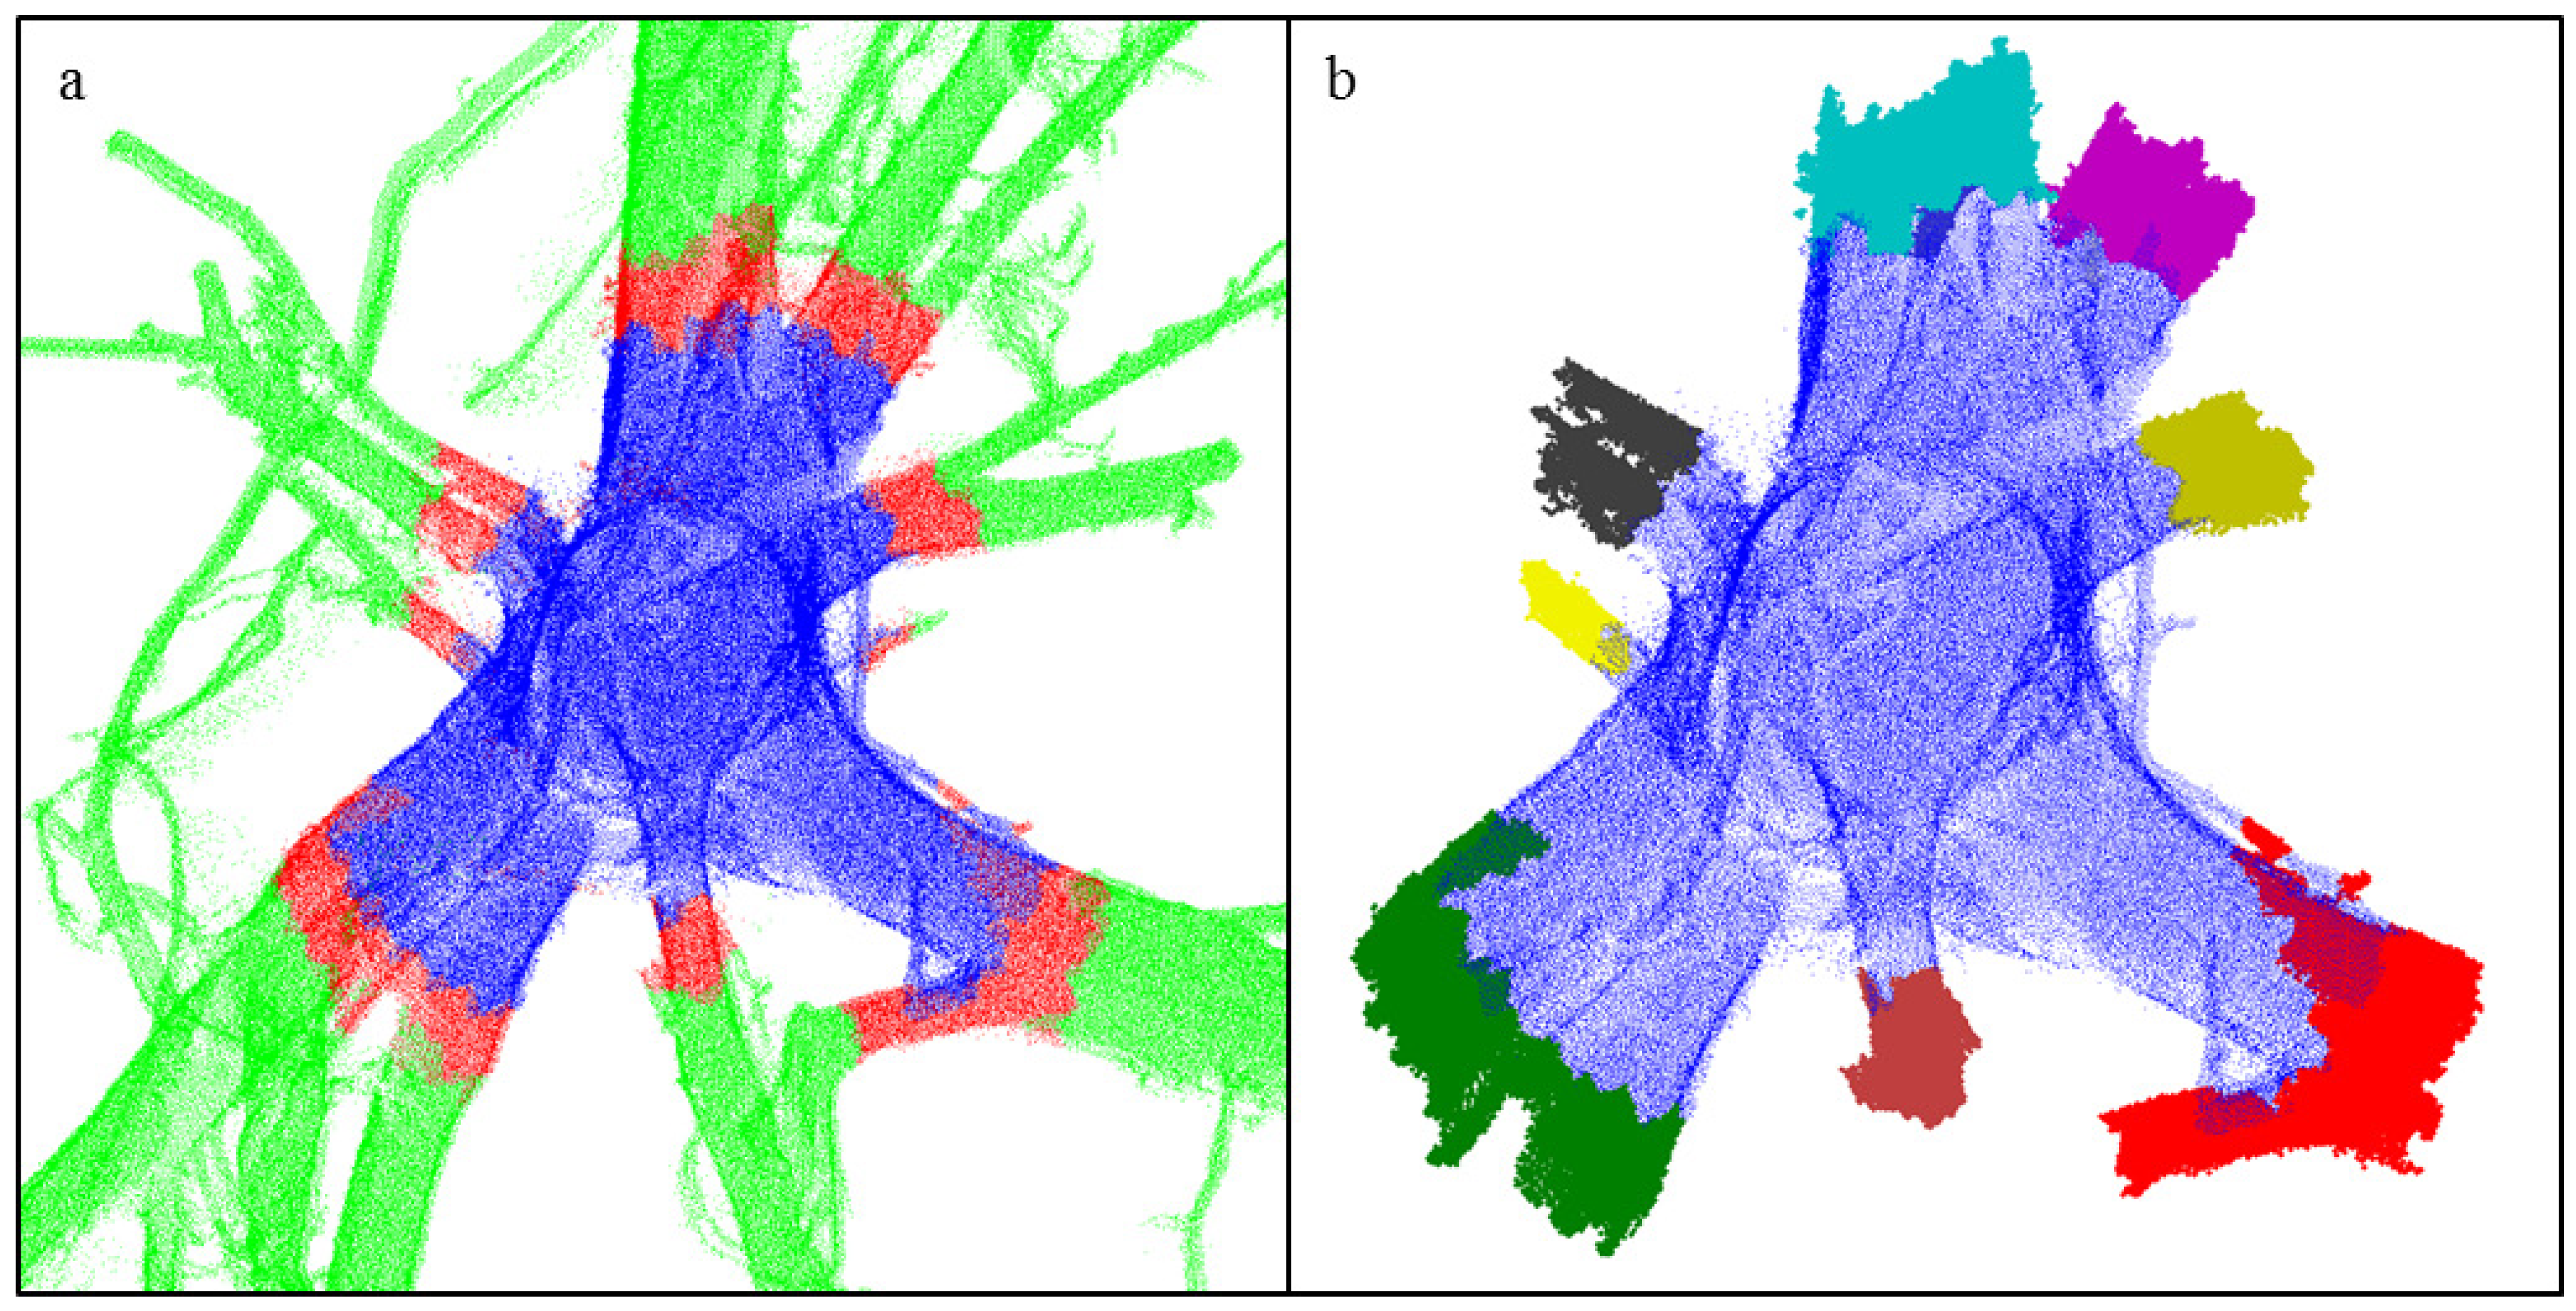
2.4.2. Filtering
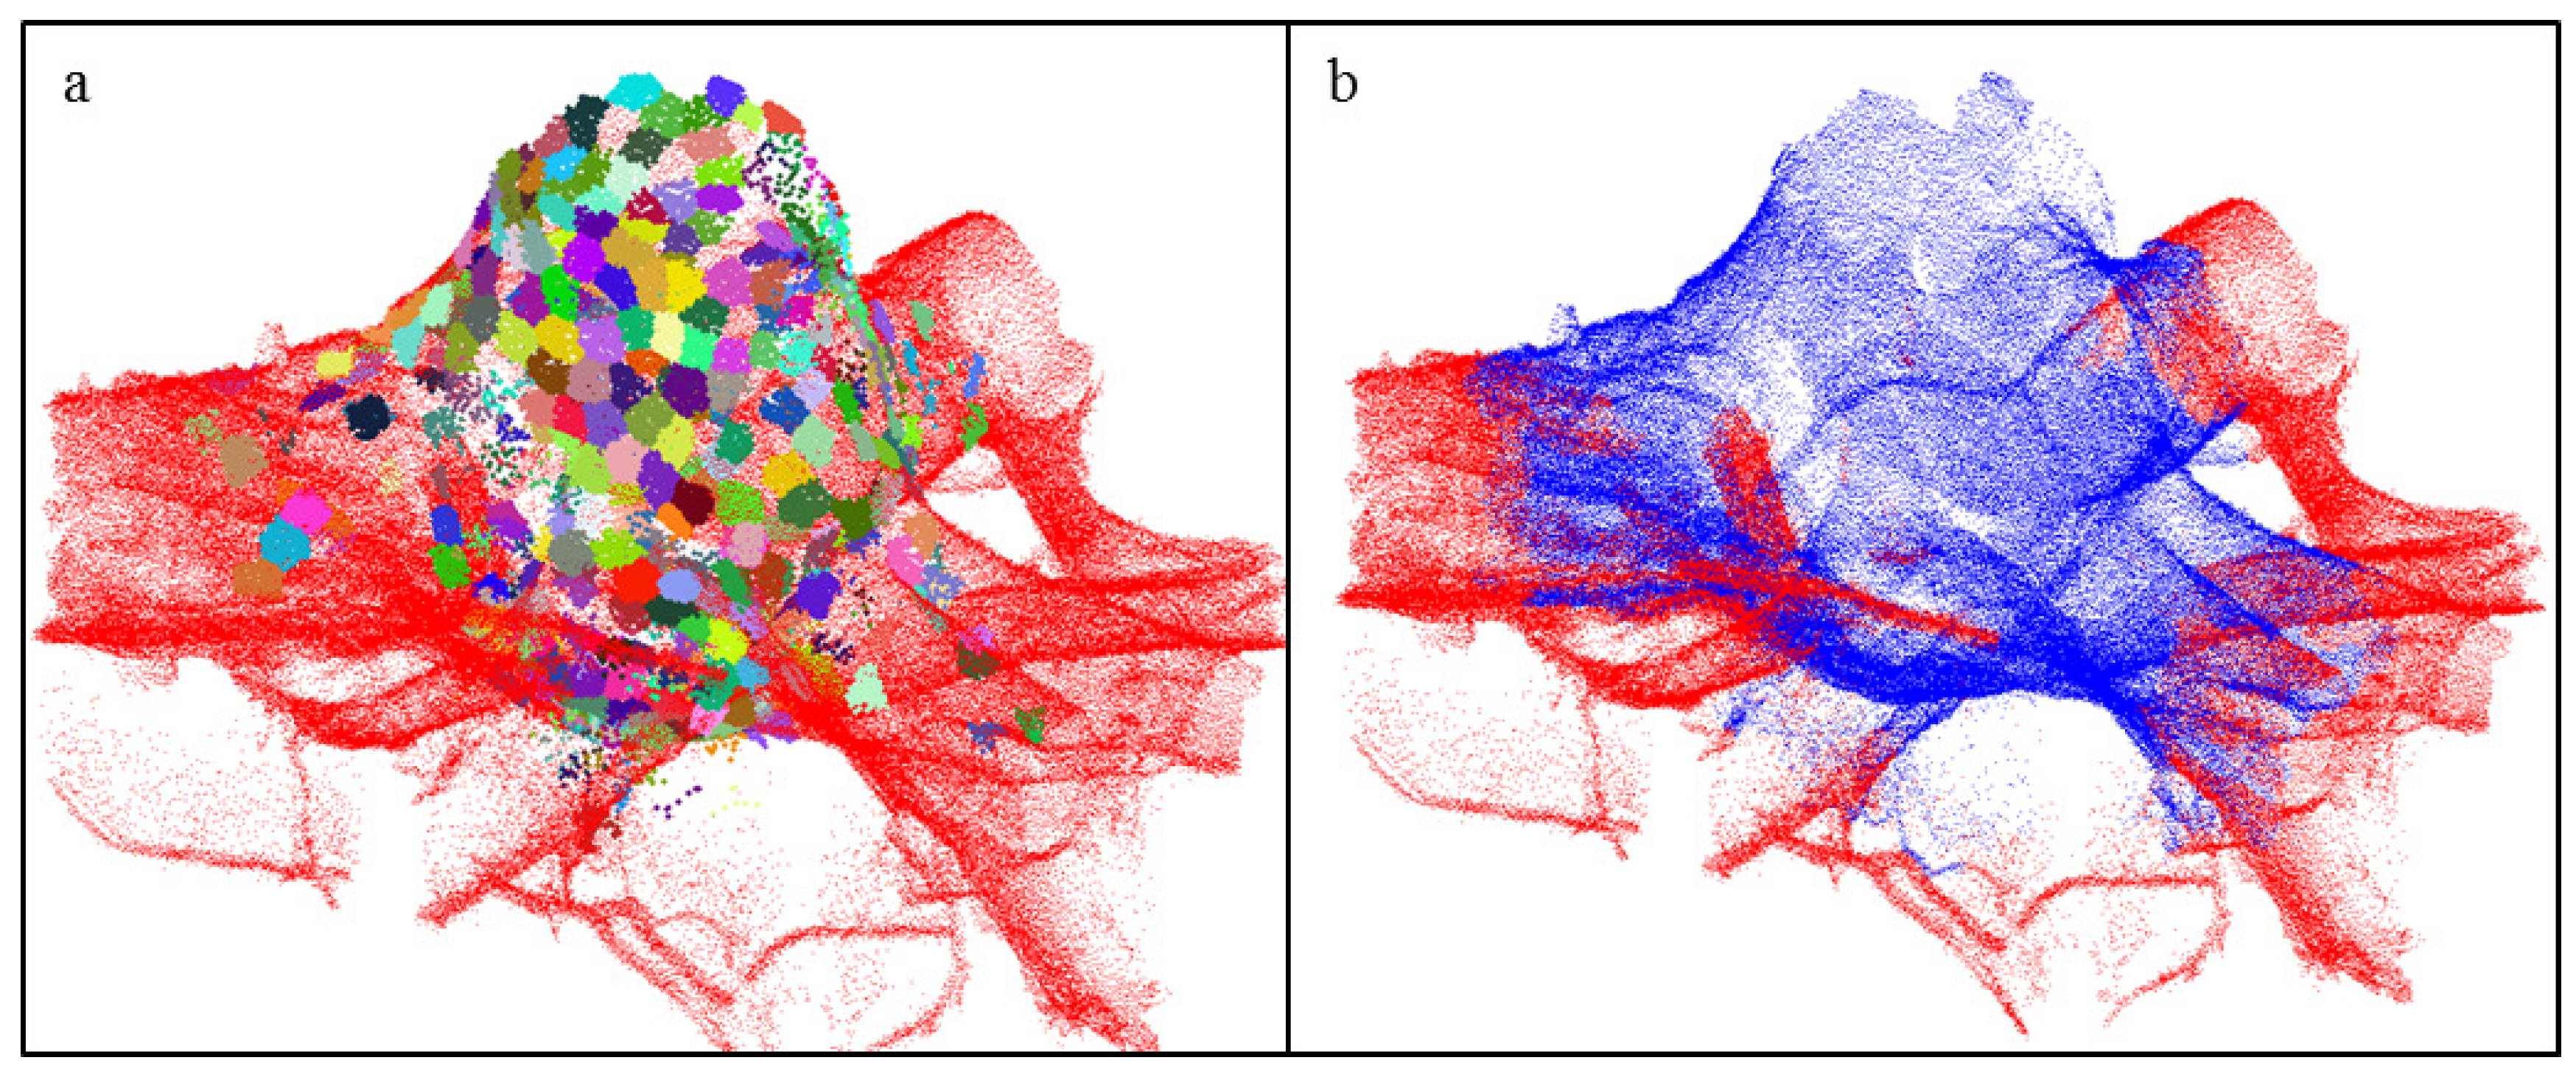
2.4.3. Separation of the Stump and Roots
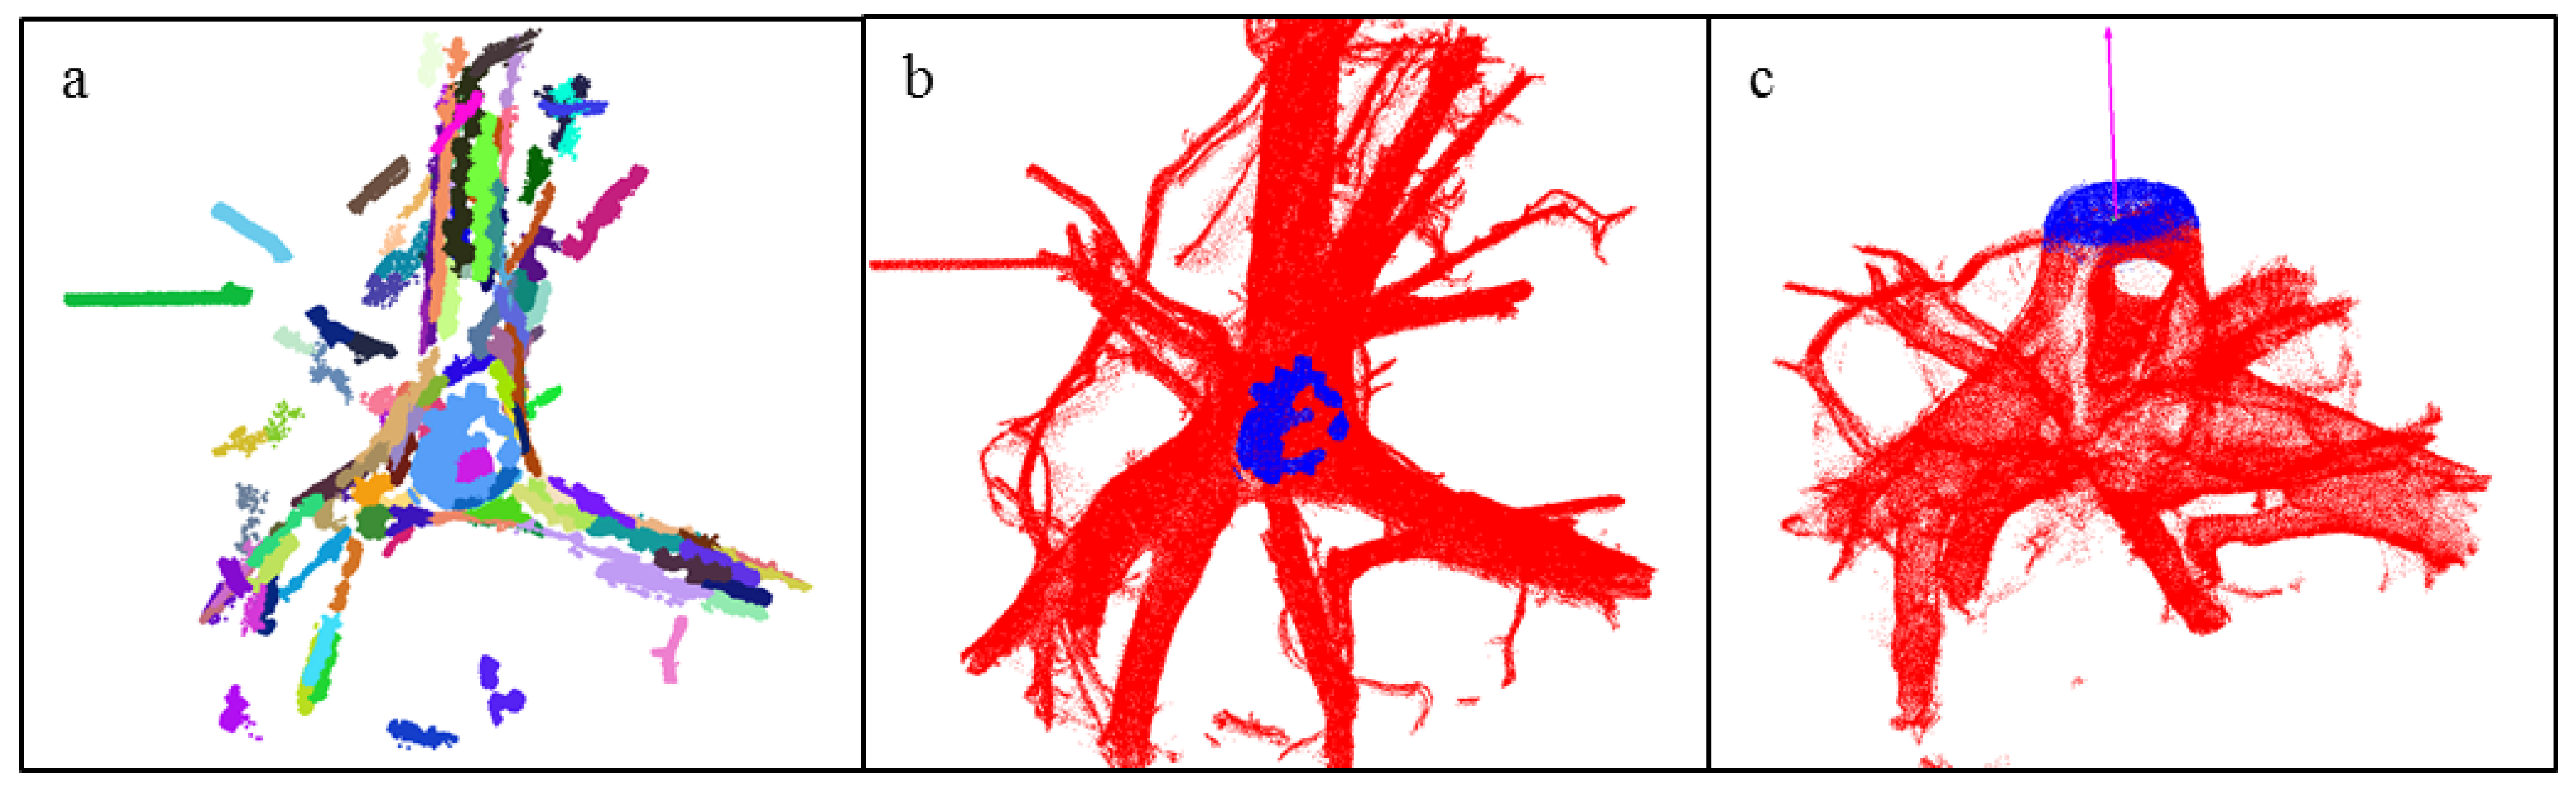
2.4.4. Modeling the Stump Portion with Cylindrical Triangulation

2.4.5. Segmentation of the Roots

2.4.6. Modeling the Root Portion with Cylinders
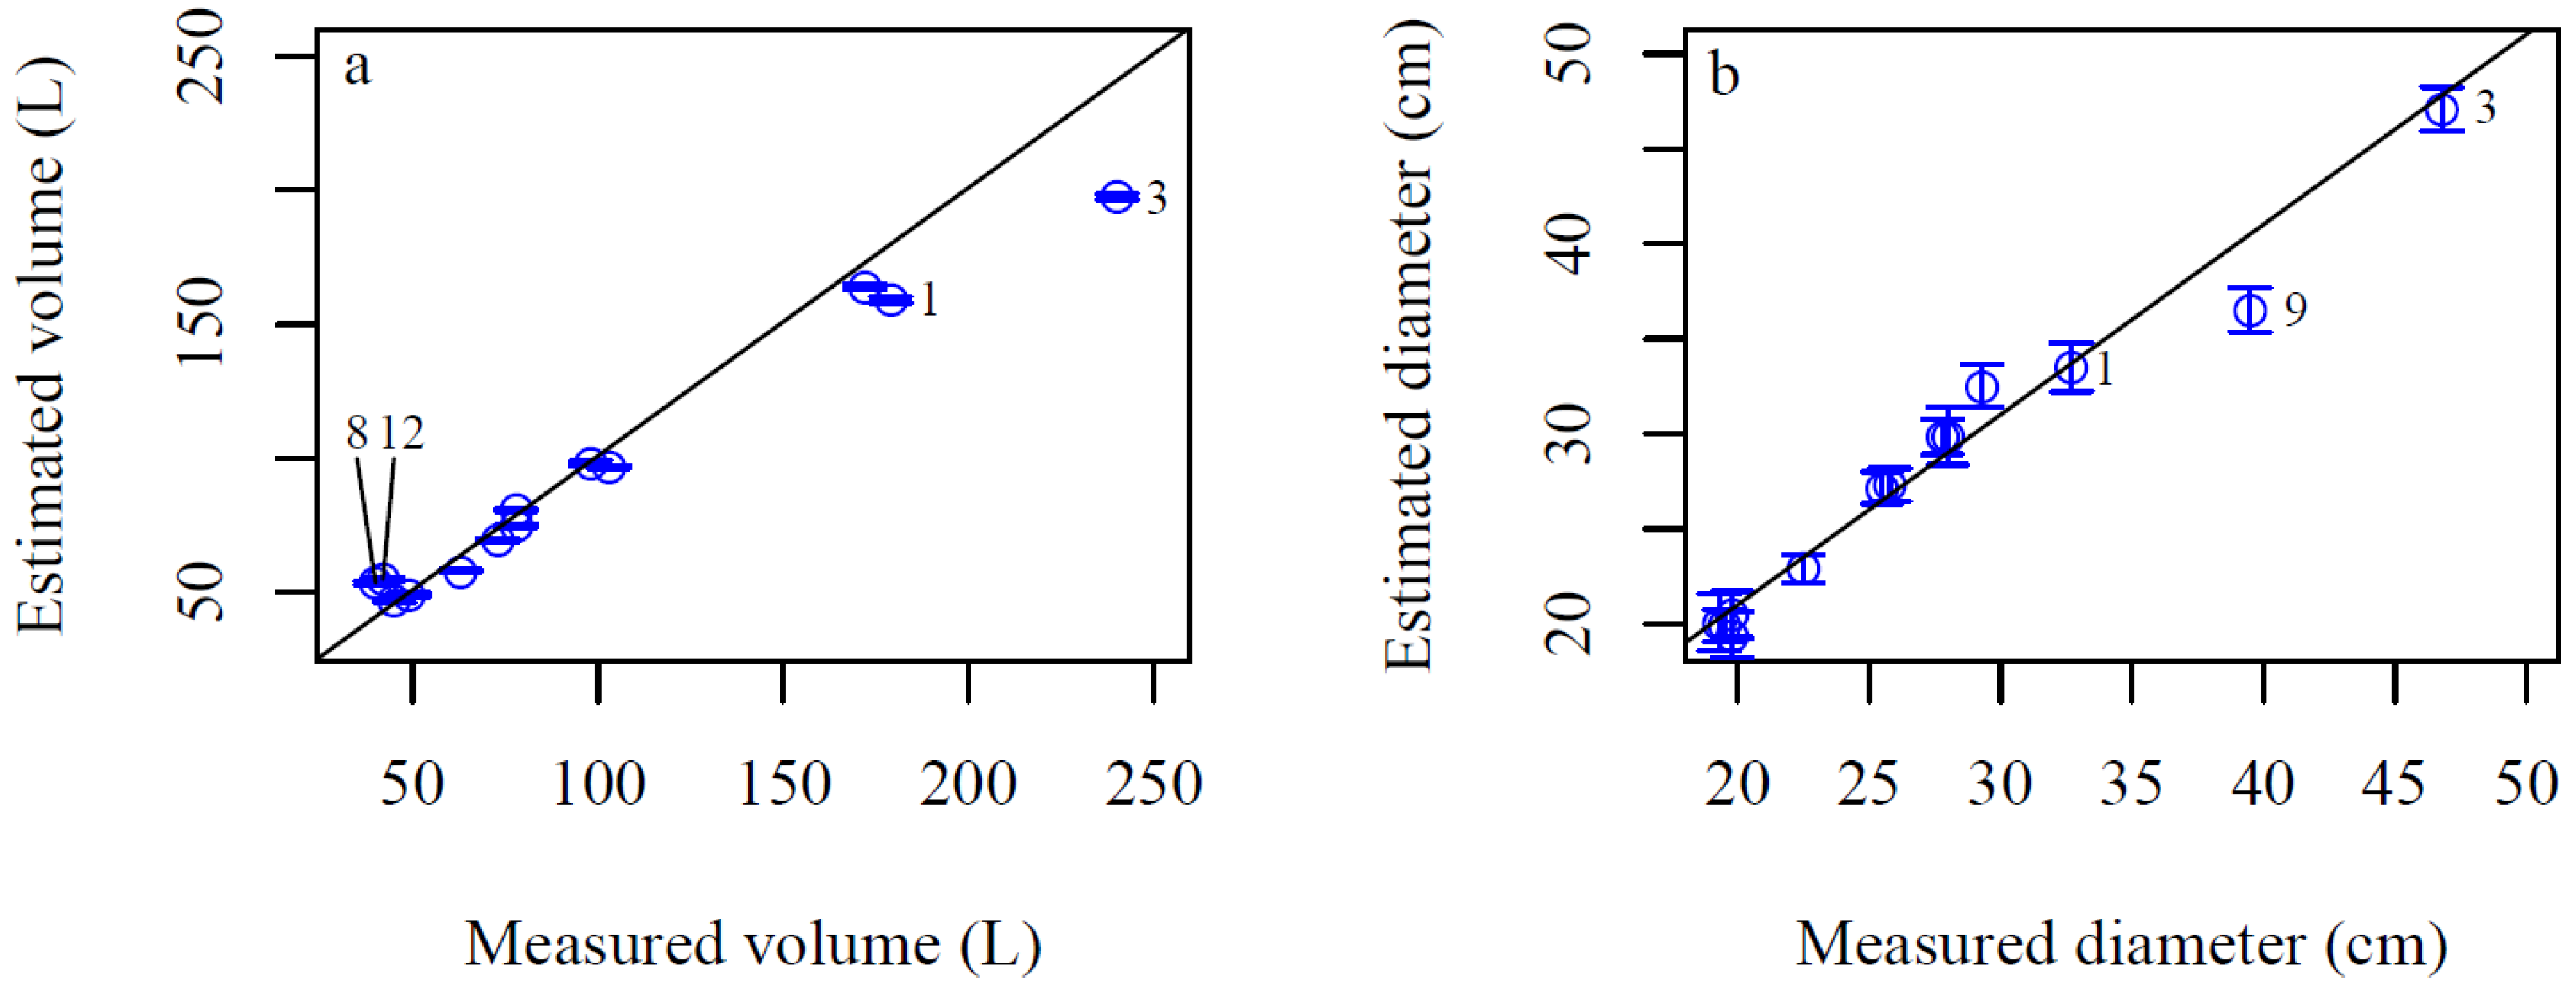
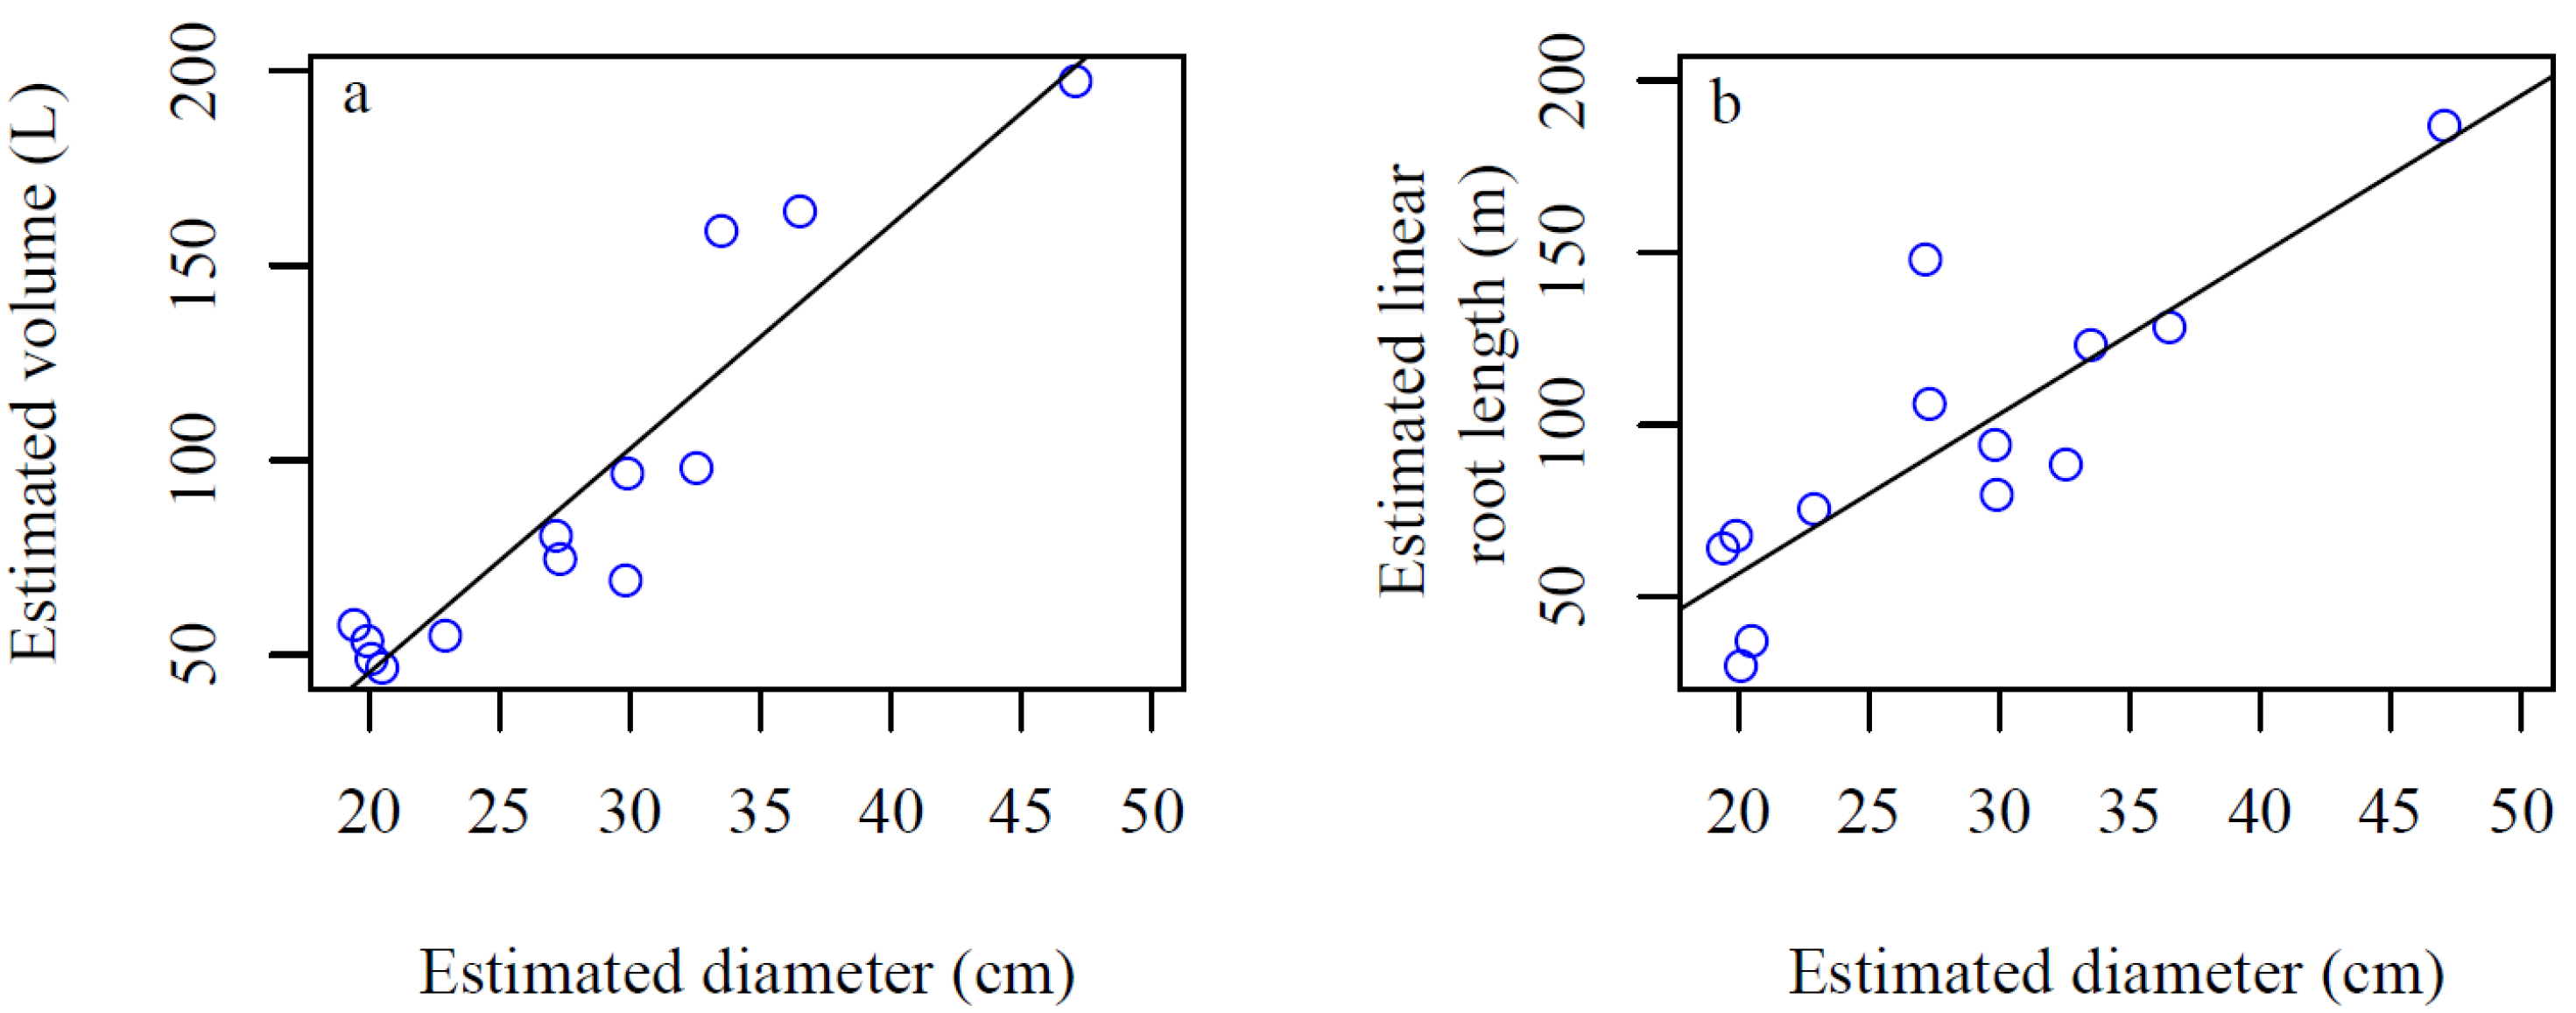
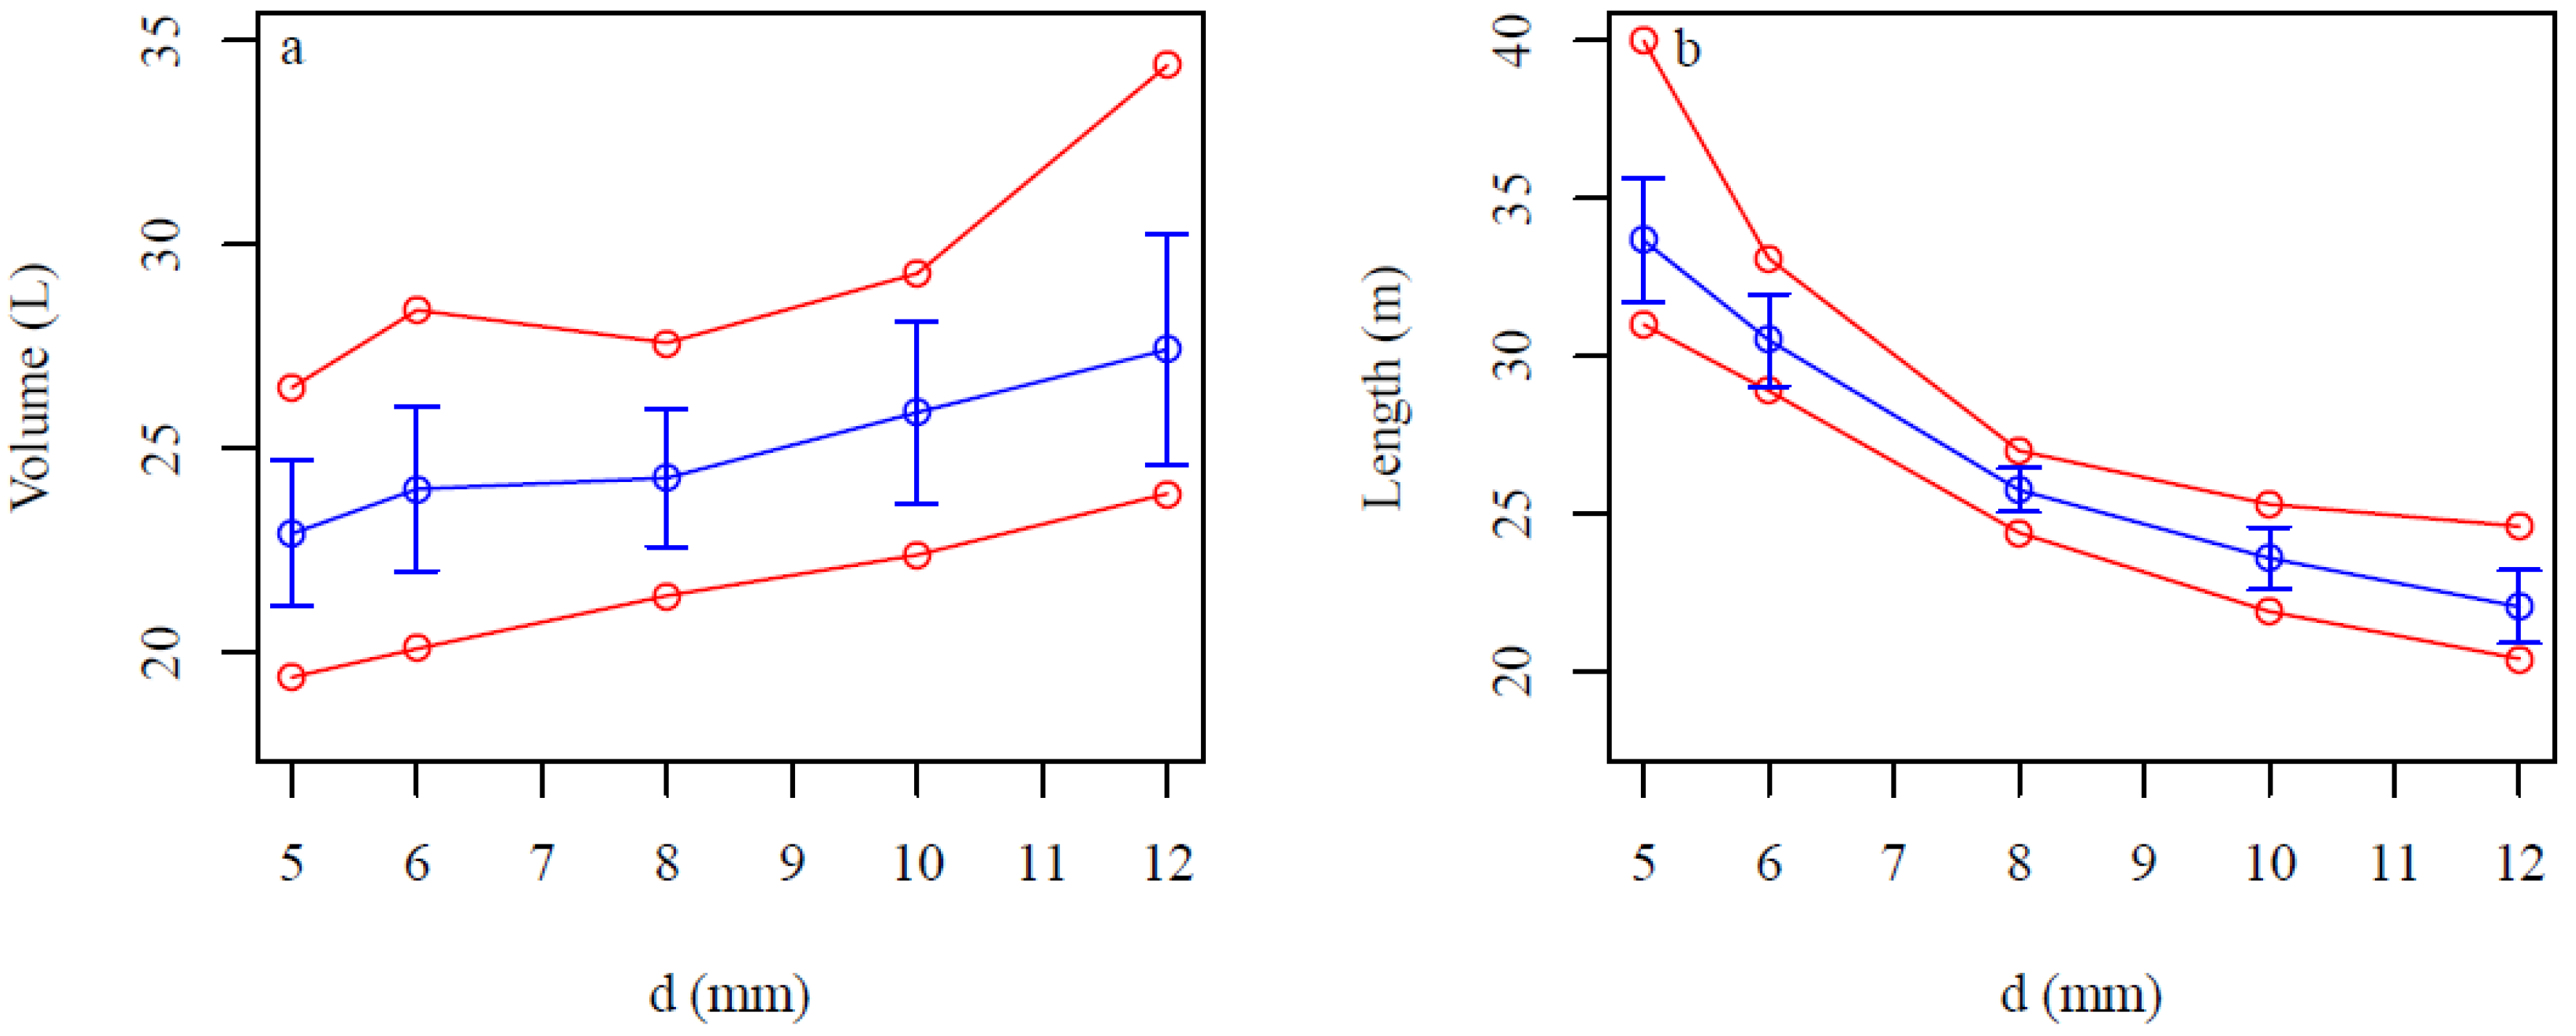
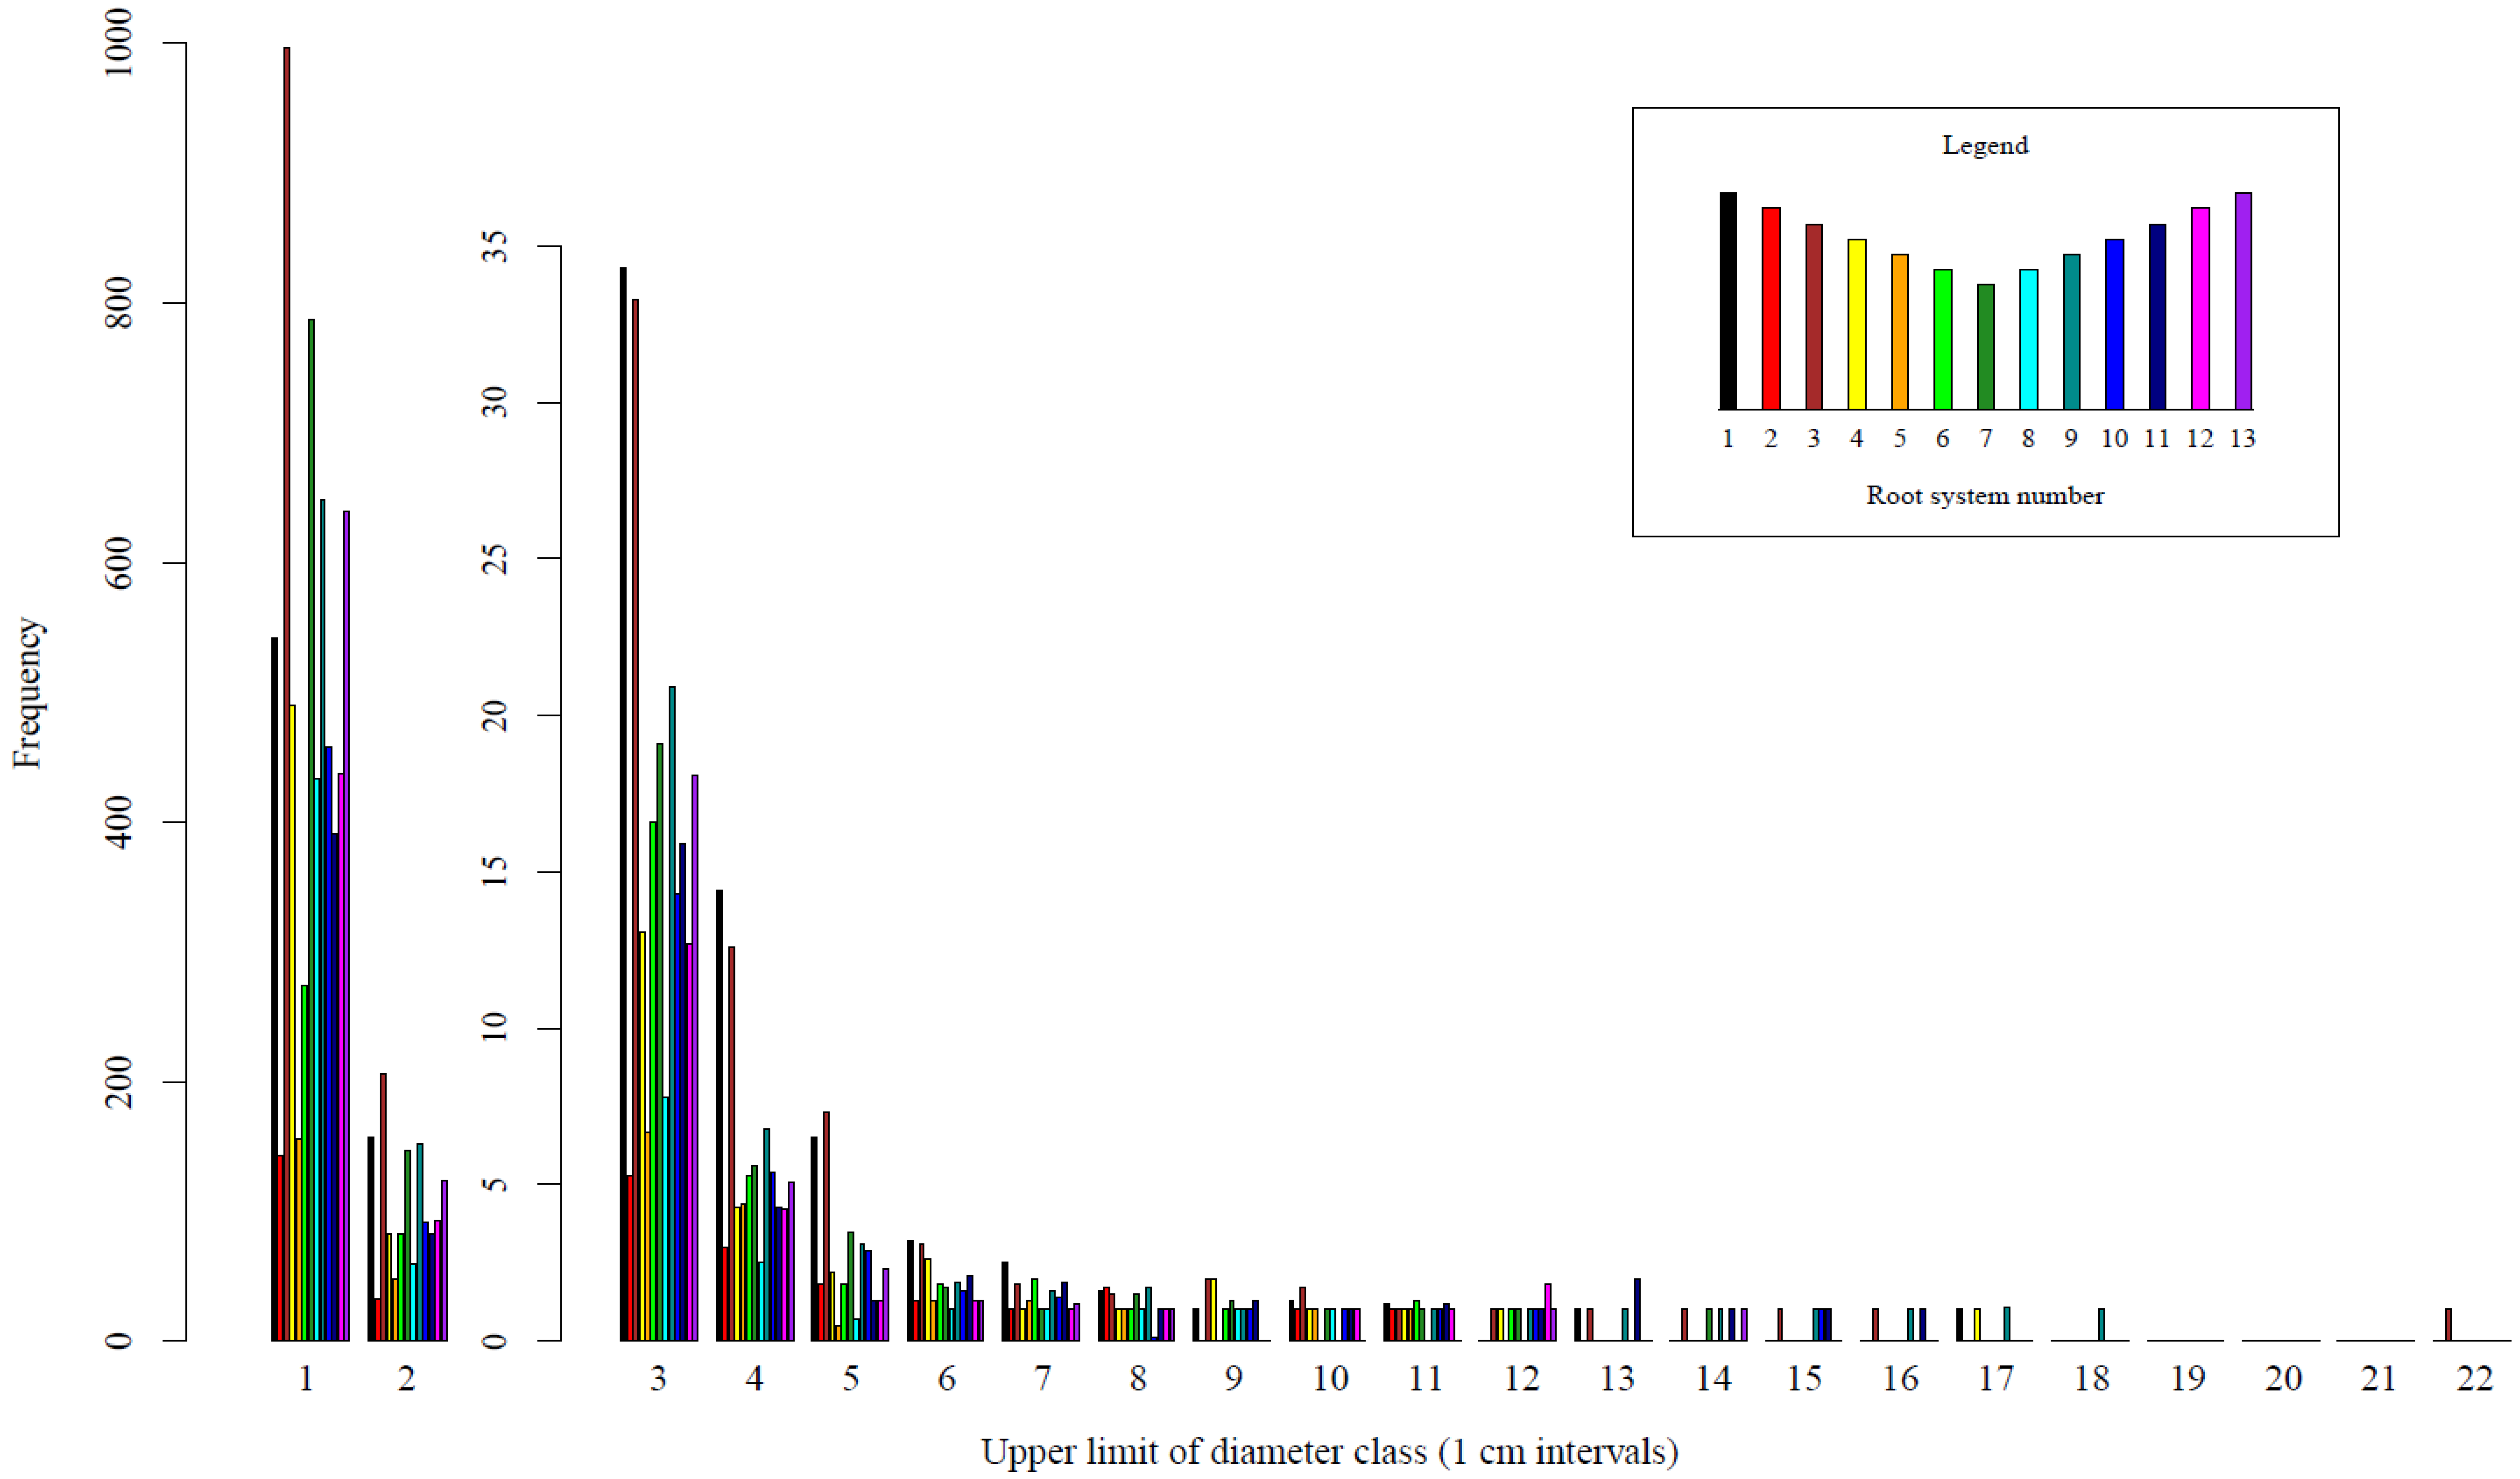
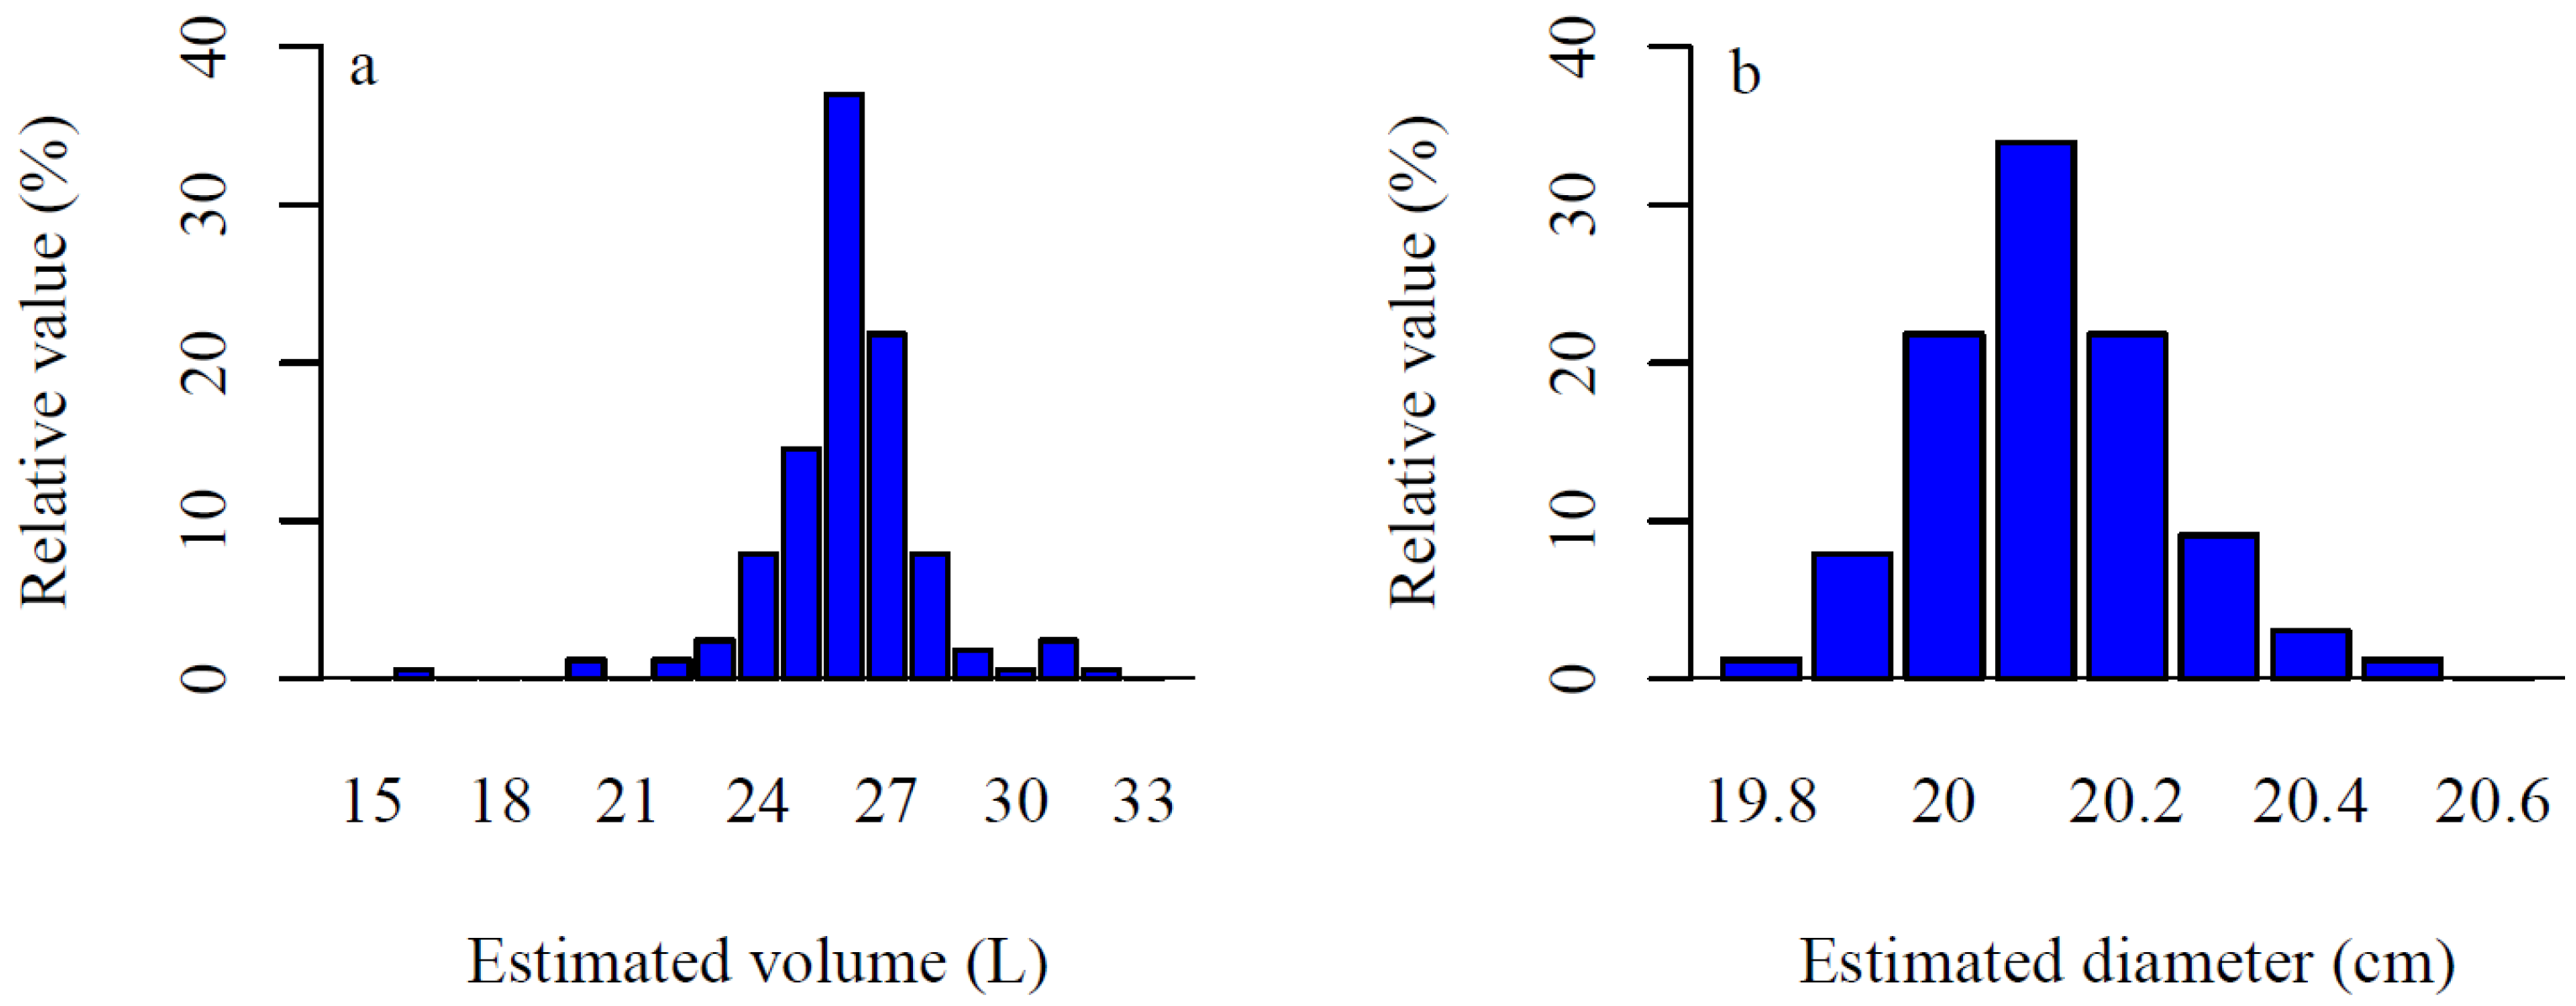
3. Results


4. Discussion
5. Conclusions
Acknowledgments
Author Contributions
Conflicts of Interest
References
- Cairns, M.A.; Brown, S.; Helmer, E.H.; Baumgardner, G.A. Root biomass allocation in the world’s upland forests. Oecologia 1997, 111, 1–11. [Google Scholar] [CrossRef]
- Kurz, W.A.; Beukema, S.J.; Apps, M.J. Estimation of root biomass and dynamics for the carbon budget model of the Canadian forest sector. Can. J. For. Res. 1996, 26, 1973–1979. [Google Scholar] [CrossRef]
- Ritson, P.; Sochacki, S. Measurement and prediction of biomass and carbon content of Pinus pinaster trees in farm forestry plantations, south-western Australia. For. Ecol. Manag. 2003, 175, 103–117. [Google Scholar]
- Bert, D.; Danjon, F. Carbon concentration variations in the roots, stem and crown of mature Pinus pinaster (Ait.). For. Ecol. Manag. 2006, 222, 279–295. [Google Scholar] [CrossRef]
- Litton, C.M.; Raich, J.W.; Ryan, M.G. Carbon allocation in forest ecosystems. Glob. Chang. Biol. 2007, 13, 2089–2109. [Google Scholar] [CrossRef]
- Barton, C.V.M.; Montagu, K.D. Effect of spacing and water availability on root: Shoot ratio in Eucalyptus camaldulensis. For. Ecol. Manag. 2006, 221, 52–62. [Google Scholar] [CrossRef]
- Tobin, B.; Čermák, J.; Chiatante, D.; Danjon, F.; di Iorio, A.; Dupuy, L.; Eshel, A.; Jourdan, C.; Kalliokoski, T.; Laiho, R.; et al. Towards developmental modelling of tree root systems. Plant Biosyst. 2007, 141, 481–501. [Google Scholar] [CrossRef]
- Danjon, F.; Reubens, B. Assessing and analyzing 3D architecture of woody root systems, a review of methods and applications in tree and soil stability, resource acquisition and allocation. Plat Soil 2008, 303, 1–34. [Google Scholar] [CrossRef]
- Danjon, F.; Stokes, A.; Bakker, M.R. Root systems of woody plants. In Plant Roots: The Hidden Half, 4th ed.; Eshel, A., Beeckman, T., Eds.; CRC Press: Boca Raton, FL, USA, 2013; pp. 1–26. [Google Scholar]
- Coates, K.D.; Lilles, E.B.; Astrup, R. Competitive interactions across a soil fertility gradient in a multispecies forest. J. Ecol. 2013, 101, 806–818. [Google Scholar] [CrossRef]
- Kalliokoski, T.; Nygren, P.; Sievänen, R. Coarse root architecture of three boreal tree species growing in mixed stands. Silva Fenn. 2008, 42, 189–210. [Google Scholar] [CrossRef]
- Pagès, L.; Vercambre, G.; Drouet, J.L.; Lecompte, F.; Collet, C.; le Bot, J. Root Typ: A generic model to depict and analyse the root system architecture. Plant Soil 2004, 258, 103–119. [Google Scholar] [CrossRef]
- Godin, C.; Costes, E.; Sinoquet, H. A method for describing plant architecture which integrates topology and geometry. Ann. Bot. 1999, 84, 343–357. [Google Scholar] [CrossRef]
- Godin, C. Representing and encoding plant architecture: A review. Ann. For. Sci. 2000, 57, 413–438. [Google Scholar] [CrossRef]
- Nielsen, C.C.N.; Hansen, J.K. Root CSA-root biomass prediction models in six tree species and improvement of models by inclusion of root architectural parameters. Plant Soil 2006, 280, 339–356. [Google Scholar] [CrossRef]
- Mulatya, J.M.; Wilson, J.; Ong, C.K.; Deans, J.D.; Sprent, J.I. Root architecture of provenances, seedlings and cuttings of Melia volkensii: Implications for crop yield in dryland agroforestry. Agrofor. Syst. 2002, 56, 65–72. [Google Scholar] [CrossRef]
- Dupuy, L.; Fourcaud, T.; Lac, P.; Stokes, A. A generic 3D finite element model of tree anchorage integrating soil mechanics and real root system architecture. Am. J. Bot. 2007, 94, 1506–1514. [Google Scholar] [CrossRef] [PubMed]
- Dupuy, L.; Fourcaud, T.; Stokes, A. A numerical investigation into the influence of soil type and root architecture on tree anchorage. Plant Soil 2005, 278, 119–134. [Google Scholar] [CrossRef]
- Oppelt, A.L.; Kurth, W.; Godbold, D.L. Topology, scaling relations and Leonardo’s rule in root systems from African tree species. Tree Physiol. 2001, 21, 117–128. [Google Scholar] [CrossRef] [PubMed]
- Danjon, F.; Sinoquet, H.; Godin, C.; Colin, F.; Drexhage, M. Characterisation of structural tree root architecture using 3D digitising and AMAPmod software. Plant Soil 1999, 211, 241–258. [Google Scholar] [CrossRef]
- Danjon, F.; Fourcaud, T.; Bert, D. Root architecture and wind-firmness of mature Pinus pinaster. New Phytol. 2005, 168, 387–400. [Google Scholar] [CrossRef] [PubMed]
- Danjon, F.; Bert, D.; Godin, C.; Trichet, P. Structural root architecture of 5-year-old Pinus pinaster measured by 3D digitising and analysed with AMAPmod. Plant Soil 1999, 217, 49–63. [Google Scholar] [CrossRef]
- Dupuy, L.; Fourcaud, T.; Stokes, A.; Danjon, F. A density-based approach for the modelling of root architecture: Application to Maritime pine (Pinus pinaster Ait.) root systems. J. Theor. Biol. 2005, 236, 323–334. [Google Scholar] [CrossRef] [PubMed]
- Kaestner, A.; Schneebeli, M.; Graf, F. Visualizing three-dimensional root networks using computed tomography. Geoderma 2006, 136, 459–469. [Google Scholar] [CrossRef]
- Guo, L.; Chen, J.; Cui, X.; Fan, B.; Lin, H. Application of ground penetrating radar for coarse root detection and quantification: A review. Plant Soil 2013, 362, 1–23. [Google Scholar] [CrossRef]
- Astrup, R.; Ducey, M.J.; Granhus, A.; Ritter, T.; von Lüpke, N. Approaches for estimating stand-level volume using terrestrial laser scanning in a single-scan mode. Can. J. For. Res. 2014, 44, 666–676. [Google Scholar] [CrossRef]
- Aschoff, T.; Thies, M.; Spiecker, H. Describing forest stands using terrestrial laser-scanning. Int. Arch. Photogramm. Remote Sens. Spat. Inf. Sci. 2004, 35, 237–241. [Google Scholar]
- Henning, J.; Radtke, P. Ground-based laser imaging for assessing three-dimensional forest canopy structure. Photogramm. Eng. Remote Sens. 2006, 72, 1349–1358. [Google Scholar] [CrossRef]
- Hauglin, M.; Astrup, R.; Gobakken, T.; Næsset, E. Estimating single-tree branch biomass of Norway spruce with terrestrial laser scanning using voxel-based and crown dimension features. Scand. J. For. Res. 2013, 28, 456–469. [Google Scholar] [CrossRef]
- Raumonen, P.; Kaasalainen, M.; Åkerblom, M.; Kaasalainen, S.; Kaartinen, H.; Vastaranta, M.; Holopainen, M.; Disney, M.; Lewis, P. Fast automatic precision tree models from terrestrial laser scanner data. Remote Sens. 2013, 5, 491–520. [Google Scholar] [CrossRef]
- Bucksch, A.; Fleck, S. Automated detection of branches dimensions in woody skeletons of fruit tree canopies. Photogramm. Eng. Remote Sens. 2011, 77, 229–240. [Google Scholar] [CrossRef]
- Vonderach, C.; Voegtle, T.; Adler, P. Voxel-based approach for estimating urban tree volume from terrestrial laser scanning data. Int. Arch. Photogramm. Remote Sens. Spat. Inf. Sci. 2012, 39, 451–456. [Google Scholar] [CrossRef]
- Gärtner, H.; Denier, C. Application of A 3D Laser Scanning Device to Acquire the Structure of Whole Root Systems—A Pilot Study. In Proceedings of the DENDROSYMPOSIUM 2005, Fribourg, Switzerland, 21–23 April 2005; Heinrich, I., Gartner, H., Monbaron, M., Shleser, G., Eds.; TRACE-Tree Rings Archeol, Climatol, and Ecol: Fribourg, Switzerland, 2006; pp. 288–294. [Google Scholar]
- Teobaldelli, M.; Zenone, T.; Puig, D.; Matteucci, M.; Seufert, G.; Sequeira, V. Structural Tree Modelling of Aboveground and Belowground Poplar Tree Using Direct and Indirect Measurements: Terrestrial Laser Scanning, WGROGRA, AMAPmod and JRC-3D Reconstructor®. In Proceedings of the 5th International Workshop on Functional-Structural Plant Models, Napier, New Zealand, 4–9 November 2007; 2007; pp. 20-1–20-4. [Google Scholar]
- Gärtner, H.; Wagner, B.; Heinrich, I.; Denier, C. 3D-laser scanning: A new method to analyze coarse tree root systems. For. Snow Landsc. Res. 2009, 82, 95–106. [Google Scholar]
- Wagner, B.; Gärtner, H.; Ingensand, H.; Santini, S. Incorporating 2D tree-ring data in 3D laser scans of coarse-root systems. Plant Soil 2010, 334, 175–187. [Google Scholar] [CrossRef]
- Wagner, B.; Santini, S.; Ingensand, H.; Gärtner, H. A tool to model 3D coarse-root development with annual resolution. Plant Soil 2011, 346, 79–96. [Google Scholar] [CrossRef]
- Wagner, B.; Gärtner, H. 3-D Modeling of Tree Root Systems—A fusion of 3-D laser scans and 2-D tree-ring data. In Proceedings of the RootRAP, International Symposium “Root Research and Applicaitons”, Vienna, Austria, 2–4 September 2009.
- Wagner, B.; Gärtner, H. Modeling of Tree Roots-Combining 3D Laser Scans and 2D Tree Ring Data. In Proceedings of the DENDROSYMPOSIUM 2008, Zakopane, Poland, 27–30 April 2008; Kaczka, R., Malik, I., Owczarek, P., Gärtner, H., Helle, G., Heinrich, I., Eds.; TRACE-Tree Rings Archeol, Climatol, and Ecol: Zakopane, Poland, 2009; pp. 196–204. [Google Scholar]
- Liski, J.; Kaasalainen, S.; Raumonen, P.; Akujärvi, A.; Krooks, A.; Repo, A.; Kaasalainen, M. Indirect emissions of forest bioenergy: Detailed modeling of stump-root systems. GCB Bioenerg. 2013. [Google Scholar] [CrossRef]
- Åkerblom, M.; Raumonen, P.; Kaasalainen, M.; Casella, E. Analysis of geometric primatives in quantitative structure models of tree stems. Remote Sens. 2014, in press. [Google Scholar]
- Reubens, B.; Poesen, J.; Danjon, F.; Geudens, G.; Muys, B. The role of fine and coarse roots in shallow slope stability and soil erosion control with a focus on root system architecture: A review. Trees 2007, 21, 385–402. [Google Scholar] [CrossRef]
© 2014 by the authors; licensee MDPI, Basel, Switzerland. This article is an open access article distributed under the terms and conditions of the Creative Commons Attribution license (http://creativecommons.org/licenses/by/4.0/).
Share and Cite
Smith, A.; Astrup, R.; Raumonen, P.; Liski, J.; Krooks, A.; Kaasalainen, S.; Åkerblom, M.; Kaasalainen, M. Tree Root System Characterization and Volume Estimation by Terrestrial Laser Scanning and Quantitative Structure Modeling. Forests 2014, 5, 3274-3294. https://doi.org/10.3390/f5123274
Smith A, Astrup R, Raumonen P, Liski J, Krooks A, Kaasalainen S, Åkerblom M, Kaasalainen M. Tree Root System Characterization and Volume Estimation by Terrestrial Laser Scanning and Quantitative Structure Modeling. Forests. 2014; 5(12):3274-3294. https://doi.org/10.3390/f5123274
Chicago/Turabian StyleSmith, Aaron, Rasmus Astrup, Pasi Raumonen, Jari Liski, Anssi Krooks, Sanna Kaasalainen, Markku Åkerblom, and Mikko Kaasalainen. 2014. "Tree Root System Characterization and Volume Estimation by Terrestrial Laser Scanning and Quantitative Structure Modeling" Forests 5, no. 12: 3274-3294. https://doi.org/10.3390/f5123274
APA StyleSmith, A., Astrup, R., Raumonen, P., Liski, J., Krooks, A., Kaasalainen, S., Åkerblom, M., & Kaasalainen, M. (2014). Tree Root System Characterization and Volume Estimation by Terrestrial Laser Scanning and Quantitative Structure Modeling. Forests, 5(12), 3274-3294. https://doi.org/10.3390/f5123274