Article

A Stand-Class Growth and Yield Model for Mexico’s Northern Temperate, Mixed and Multiaged Forests

Forest Hydrology and Watershed Management, Water Center for Latin American and Caribbean Countries, ITESM, Eugenio Garza Sada 2501, Colonia Tecnológico, Monterrey, NL 64849, Mexico
Forests 2014, 5(12), 3048-3069; https://doi.org/10.3390/f5123048
Submission received: 24 September 2014 / Revised: 19 November 2014 / Accepted: 1 December 2014 / Published: 9 December 2014

Abstract

:
The aim of this research was to develop a stand-class growth and yield model based on the diameter growth dynamics of Pinus spp. and Quercus spp. of Mexico’s mixed temperate forests. Using a total of 2663 temporary, circular-sampling plots of 1000 m2 each, nine Weibull distribution techniques of parameter estimation were fitted to the diameter structures of pines and oaks. Statistical equations using stand attributes and the first three moments of the diameter distribution predicted and recovered the Weibull parameters. Using nearly 1200 and 100 harvested trees for pines and oaks, respectively, I developed the total height versus diameter at breast height relationship by fitting three non-linear functions. The Newnham model predicted stem taper and numerical integration was done to estimate merchantable timber volume for all trees in the stand for each diameter class. The independence of the diameter structures of pines and oaks was tested by regressing the Weibull parameters and projecting diameter structures. The model predicts diameter distributions transition from exponential (J inverse), logarithmic to well-balanced distributions with increasing mean stand diameter at breast height. Pine diameter distributions transition faster and the model predicts independent growth rates between pines and oaks. The stand-class growth and yield model must be completed with the diameter-age relationship for oaks in order to carry a full optimization procedure to find stand density and genera composition to maximize forest growth.

1. Introduction

Native forests supply more than 90% of the timber harvested worldwide [1]. They are characterized by high tree species and structural diversity [2]. Thus, growth models targeting timber tree species continue to be a scientific challenge that has not been properly addressed in the past. Vanclay [3,4] pointed out the need to consider the implications of tree diversity in forest management practices, since biodiversity can change as a result of natural processes as well as to human interventions, specifically selective logging, grazing, plantations with exotic species, and burning, among others.
Conventional management of Mexico’s northwestern natural mixed temperate forests has been onwards for the past 100 years with some impact on the structural complexity and tree diversity of these tree communities [5]. In the past, selective harvesting consistently logged the largest pine trees, and later on intensive silvicultural management programs in several forests ignored oak trees because of a lack of markets for oak products. These practices have led to the modification of the natural diversity patterns in secondary stages of succession [6]. Pinus durangensis Martinez, Pinus cooperi C.E. Blanco, Pinus engelmannii Schede ex Schlechtendal et Chamisso, and Pinus arizonica Engelmann have been preferred harvested tree species. Although these pine species are pioneer in succession and regenerate well in openings, continuous cover opening restrict the establishment of secondary species of succession, such as Pinus ayacahuite Ehrenberg ex Schlechtendal 1838 and Pinus teocote Schiede ex Schlechtendal et Chamisso, among others. Contemporary forest management practices also involve the harvesting of oaks and secondary pine species because of the increasing market for forest products. Intensive silvicultural programs aiming at transforming native forests into even aged forests continues to be a practice in several upland forests with gentle slopes, while conventional selection silvicultural treatments intended to conserve forest structure and diversity aim only at harvesting the largest trees. In spite of this information, current growth and yield technologies focus on even-aged mono-specific pine forests [7,8]. Constructed growth and yield models assume all pine and oak species grow at a similar rate and they compete vigorously for space, light, water and nutrients, as these technologies employed in forest management in Mexico do not tell apart the pine and oak species of the trees [7,8].
In addition, recent research has shown Mexico’s northern temperate forests are mixed in 56% of the forest inventory plots, according to abundance standards [9]. Thus, past and contemporary harvesting programs may have modified the tree diversity of remnant forests due in part to the assumption that forests are mono-specific and evenaged in nature. There is, then, an urgent need to shift from the classical whole-stand models employed when developing forest management plans to stand-class models, so as to understand the importance of tree diversity in forest management practices [4]. Stand-class growth and yield models must be the next generation of equations accounting for the management of mixed temperate native forests, as individual tree models are more difficult at this time to develop in mixed, multi-specific forests.
Previous research on competition, and oak-pine diversity patterns of these and other natural forests has shown stand productivity is closely related to tree diversity and stand structure (imbalanced diameter structures) [5,10,11]. Supporting evidence of a lack of competition between oak and pine trees was also reported for mixed, multiaged forests of the Eastern Sierra Madre Mountain Range [12]. The phenological complementarities and the asynchrony in the use of resources (light, soil nutrients, soil water, among others) appear to explain how tree diversity and the complex structure control stand productivity stressing the potential lack of inter-specific competition in tree species that use different strategies to cope with limiting factors [13,14]. However, additional information is required on the ecological relations between oaks and pines and between pine species in order to set better forest management practices. This report develops an empirical diameter growth and yield model for pines and oaks with the aim to improve our understanding of: (i) the differential growth patterns between groups of species; (ii) forest products derived from forest growth; and (iii) the ecological interactions that shape this forest community.
Peng [15] classified growth and yield techniques into empirical and mechanistic models. Examples of empirical models are whole stand, stand class, and single tree models [3,4,15,16]. Size class and individual tree models can forecast the future composition of tree communities, if not of the whole forest [4,17,18,19], and they can assess the impact of harvesting on tree diversity. Models based on fitting and predicting diameter distributions [4,16] can be expanded to all tree species to quantify the diameter growth dynamics of mixed and multiaged forests. These models may address ecological processes, such as competition, facilitation, symbiosis, and growth rates of mixed coniferous forests. However, these applications have not yet been further explored with respect to the preliminary management of mixed and multiaged forests.
In light of this brief literature review, the aim of this research was to construct a stand-class growth and yield model by setting the following objectives: (i) to fit a diameter distribution model for 2663 forest stands; (ii) to evaluate alternative methods for fitting diameter distribution models; and (iii) to estimate the percentage of forest products derived from forest growth of pine and oaks growing in mixed temperate stands of Mexico’s northwestern forests of the Sierra Madre Occidental mountain range.

2. Experimental Section

This research was conducted in the ejidos (community-based land ownership) of “San Pablo”, “La Campana”, “La Victoria” and “Pueblo Nuevo”, located in the municipality of Pueblo Nuevo, Durango, Mexico. The study area spans between 2000 and 2700 meters above sea level, masl. Average annual long-term precipitation and temperature are 900 mm and 15 °C, respectively.
The Sierra Madre Occidental mountain range is covered by a wide range of temperate forests. The tree community is quite diverse, with approximately 41 tree species recorded in the last forest inventory. The eastern ridges of the Sierra are covered by a quite homogeneous tree cover with sparse cover in the low ridges (<2000 m a.s.l.) and increasing tree cover in the upper ridges. A positive gradient of pine density is observed from the low ridges to the upper ones, while the oak density gradient moves in the opposite direction. Then, Pinus dominates the landscape in the upper ridges, accounting for 75%, in number of individuals, of the total tree diversity. Common pine species and their individual contribution to total tree diversity are: P. durangensis (37%), P.cooperi (16%), P. teocote (9%), P. leiophylla (4%), P. ayacahuite (3%), and P. engelmannii (2%). Other less abundant pine species are P. herrerai, P. lumholtzii, P. oocarpa, P. duglasiana, P. michoacana, P. chihuahuana and P. maximinoi. Other conifer trees found in these forests are: Juniperus spp., Cupressus spp., Pseudotsuga menziesii, Picea chihuahuana, and Abies durangensis, accounting for only 1.3% of the total tree diversity. Oak species are not recorded in the forest inventory because of the difficulty to identify the close to 130 species distributed in the Sierra Madre Occidental mountain range and account for a little over 20% of the total tree diversity, although below 2400 m a.s.l. they dominate the landscapes [9]. Other important tree species are Arbutus spp., Alnus firnifolia, Fraxinus spp., and Populus wislizenii. Tropical dry forests, characterized by low trees and shrub species, are distributed in the lowlands; however, they account for less than 0.1% of the total tree abundance. Due to the small variability, the characteristics of trees at the stand scale are quite homogeneous, with a mean DBH and a standard deviation for all tree species of 25 and 6 cm, respectively.

2.1. Methodology

2.1.1. Fitting, Predicting and Recovering the Weibull Distribution Parameters

A total of 2663 temporary, circular-sampling plots of 1000 m2 each were distributed throughout the forest. At least three sampling sites were randomly placed in each of the 837 forest stands. In each sample plot, the following characteristics of all trees that meet the inventory (DBH ≥ 7.5 cm) scheme were measured: diameter at breast height (DBH), top height (H), canopy cover (Cc), species (S), and sociological position (SP). Age was measured in 3–5 trees of each sample plot. At the stand scale, the ecological interactions between selected hardwood and pine species were observed by fitting the Weibull density function to the diameter distributions, predicting parameters from stand attributes, relating statistically parameters between oaks and pines, projecting the diameter structures with stand attributes, and developing the diameter-age of pines and oaks. These features form the core of the stand-class growth and yield model.

2.1.2. The Weibull Density Function

The stand-class growth and yield model probabilistically evaluates the diameter distributions of trees. Several density functions have been fitted to tree diameter data, such as the Weibull, Gamma, Beta, Charlier, Normal, Lognormal and Johnson SB [17,18,19,20,21,22,23]. The Weibull density function has gained extensive popularity because of its flexibility and closed form [16,24]. The Weibull density function (pdf) is given by Equation (1) and, as a cumulative density function (cdf), by Equation (2) [24];
P x ( X ) = ( α β ) ( DBH ε β ) α 1 e ( ( DBH ε β ) α )
P x ( x X ) = 1 e ( ( DBH ε β ) α )
where Px(X) = probability of the random variable, DBH = diameter at breast height; α, β and ε are shape, scale and location parameters, respectively.
Several methods of parameter α, β and ε estimation have been proposed and tested. Some of the techniques used are maximum likelihood of two and three parameters [20,22,25,26,27,28]; moments [29,30,31], and point estimation [32]. The first two procedures are mathematically complex, and the last one is the most popular because of the ease with which it estimates parameters. Hyink and Moser [33] introduced techniques of parameter prediction using stand attributes. Hynk [34] noted that recovering parameters, instead of predicting them, improved the evaluation of diameter structures. Several methods for recovering parameters [32,35] and moments [29] have been discussed in the literature; they require the prediction of moments or percentiles of the density function.
In this research, nine different techniques were used to estimate parameters α, β and ε: conventional moments (MNP), weighted probabilistic moments (MPP), least-square techniques (MCM), the two-parameter maximum likelihood technique (MV2), the Zanakis method (MRZ), the Da Silva technique (MDS), moments of Burk and Newberry (MRM), the modified method of Zanakis (MZM), and maximum likelihood of three parameters (MV3). Since the two-parameter maximum likelihood technique projected compatible diameter distributions, in contrast to the three-parameter maximum likelihood technique, the former was used in further analysis for predicting and recovering parameters. In order to cause no further confusion, only the solution of the two-parameter maximum likelihood technique is mathematically described next.
The two-parameter maximum likelihood method has been widely reported and Haan [24] and Devore [36] described the mathematical solutions to calculate the location and shape parameters by solving for α and β in Equations (3)–(5) below. This procedure assumes the Weibull distribution starts at the origin, ε = 0.
λ = n i = 1 n DBH i α
α = n λ i = 1 n DBH i α ln DBH i i = 1 n ln DBH i
β = λ 1 / α
where DBHi = random variable (diameter at breast height), n = number of observations; α and β = shape and scale parameters.
Návar-Cháidez [37] reported empirical equations to solve for the shape and scale parameters of Mexico’s temperate forests and these equations can be further employed in the prediction of diameter structures of any forest in the world.

2.1.3. Hypothesis Testing and Goodness-of-Fit

The χ2 and Kolmogorov-Smirnoff (K-S) statistics—Equations (6) and (7), respectively, were used to test the null hypothesis of equal diameter distributions between observed and estimated frequencies:
χ 2 = i = 1 n [ o i e i e i ] 2
D = Max | P x ( X ) S n ( X ) |
where oi = absolute observed diameter frequency; ei = absolute expected diameter frequency; Px(X) = cumulative observed density function, and Sn(X) = cumulative expected density function of X.

2.1.4. Predicting and Recovering Distribution Parameters

The sample data was split into 70% of the studied stands (587) to fit and develop predictive equations, and the remaining 30% of the stands (250) were used to validate prediction equations (Table 1).
Table 1. Tree dimensional features for 587 stands for constructing and 250 stands for validating the diameter-class model.
ModelStandsGroup of SpeciesDensity (No ha−1)DBH (cm)S.D (cm)H (m)S.D (m)
Construction587Pinus spp.63123.48.712.64.5
587Quercus spp.21212.812.89.33.2
Validation250Pinus spp.60223.98.011.44.1
250Quercus spp.23112.311.39.53.8
Where: DBH = diameter at breast height (cm); S.D = Standard deviation; H = top height (m).
The stand attributes of average diameter (Dm), average quadratic diameter (Dq), basal area (BA), total height (H), density (N), Canopy cover (Cc) and a density parameter, such as the Reineke density index (IDR), were the independent variables used for regressing the Weibull parameters and central moments. In addition, a sensitivity analysis was conducted to test the effect of the standard error on the number of accepted null hypotheses. This methodology has been successfully examined by Návar et al. [38]. Computer programs were developed using the SAS v 9.3 software (SAS Institute, Cary, NC, USA) for most procedures of parameter estimation that required iterative techniques [26]. Proc IML in SAS was employed to evaluate maximum likelihood parameters of the three-parameter Weibull density function.
The regression equation related the Weibull density function parameters with stand attributes; the following definitions apply: Xp = mean; Std = standard deviation; EES = Standard error of estimate, Sk = skew coefficient, and n = number of observations. The parameter prediction approach yielded equations of the form α, β = f (Dm, Dq, N, BA, Cc, IDR). The recovery of parameters was accomplished by developing regression equations for the first three central moments of the diameter, Xp, Std, and Sk = f (Dm, Dq, N, BA, Cc, IDR), and later on recovering the parameters α and β.

2.2. Testing the Independence of the Diameter Distributions of Pines and Oaks

The statistical significance of the regression equation was the indicator of the association between the distributional parameters of oaks and pines. This procedure used 170 forest stands where there was sufficient density in both tree genus to track the potential ecological interaction between pines and oaks. Forest stands with less than 50 trees ha−1 were discarded from further data analysis. The average tree density for selected forest stands was 310 and 125 trees ha−1 for pines and oaks, respectively.

2.3. The Stand-Class Growth and Yield Model

The conventional prediction and recovery of the Weibull parameters is not the most efficient as Cao [22] and Palahi et al. [39] proposed an optimization approach that minimizes an objective function improved parameter predictions. This new procedure could be used in further research on the Weibull density function in forests of Mexico. The diameter—age relationship derived by Corral-Rivas and Návar-Cháidez [40] was employed to complete the growth and yield model for pines. Merlín-Bermúdez and Návar-Cháidez [41] reported a diameter—age relationship for oaks that require further revision before it is employed in completing the growth and yield modeling for oaks. The diameter—age relationship is a function of several factors including stand productivity and tree diversity. However in the absence of these factors, the single equation for pines and oaks was employed to finalize the growth model. The differential shift of diameter distributions is a starting point for understanding differential growth rates and the ecological interactions likely taking place in these forests. This procedure was independently carried out for oaks and pines. Návar et al. [42] fitted the taper equation of Newnham [43] for pines (Equation 8) and oaks (Equation 9) and numerical integration was done on the taper function for each individual trees in a stand to quantify end forest products (m3·ha−1) classified as: (i) sawnwood (DBH ≥ 20 cm); (ii) plywood (DBH ≥ 40 cm); and (iii) secondary forest products (DBH ≤ 20 cm).
di = DBH 1.04 [ H h H 1.30 ] 0.5815
di = DBH 1.04 [ H h H 1.30 ] 0.9163
The relationship H—DBH was derived from 1200 and 100 harvested pine and oak trees, respectively, in Mexico’s northern temperate forests. The Equations of Chapman-Richards (10), Weibull (11) and the allometric power Equation (12) fitted this data source.
H = 1.3 + a ( 1 exp ( b DBH ) ) c
H = 1.3 + a ( 1 exp ( b DBH c ) )
H = a ( DBH ) b
where: H = total height (m); DBH = diameter at breast height (cm); a, b, c = statistical coefficients.

3. Results and Discussion

3.1. Parameter Estimators

Each procedure of parameter assessment evaluated different α, β and ε estimators for both pines and oaks (Table 2).
Table 2. Statistics of parameters calculated by nine techniques for 587 mixed forest stands of Durango, Mexico.
MethodParameters of the Weibull distribution
α *β ε
PineOakPineOakPineOak
A §SE ||ASEASEASEASEASE
MNP1.60.02061.40.016526.30.1403270.144512.10.111411.10.1156
MPP1.10.00830.80.012410.80.15279.40.169214.40.049514.50.0454
MCM1.70.04131.50.0454260.144525.30.152711.70.272411.80.2559
MV22.00.01652.00.0248280.123828.80.144513.50.123813.80.1032
MRZ1.40.01651.10.016526.60.1568270.239413.80.107314.30.0949
MDS1.80.02481.50.028915.70.231116.90.309610.90.123810.40.1445
MRM1.60.02061.50.016513.70.227150.22712.30.115611.40.1156
MZM1.00.00830.80.012426.30.144526.10.16114.60.03314.60.0413
MV31.20.02890.80.0289120.2610.40.2613.30.136214.30.1568
* Shape parameter, Scale parameter, Location parameter, § average, || Standard error.
An example of the two-parameter Weibull distribution function fitted to diameter structures of pines and oaks is depicted in Figure 1.
Figure 1. An example of the maximum likelihood two-parameter Weibull density function fitted to diameter structures of pines and oaks.
Forests 05 03048 g001

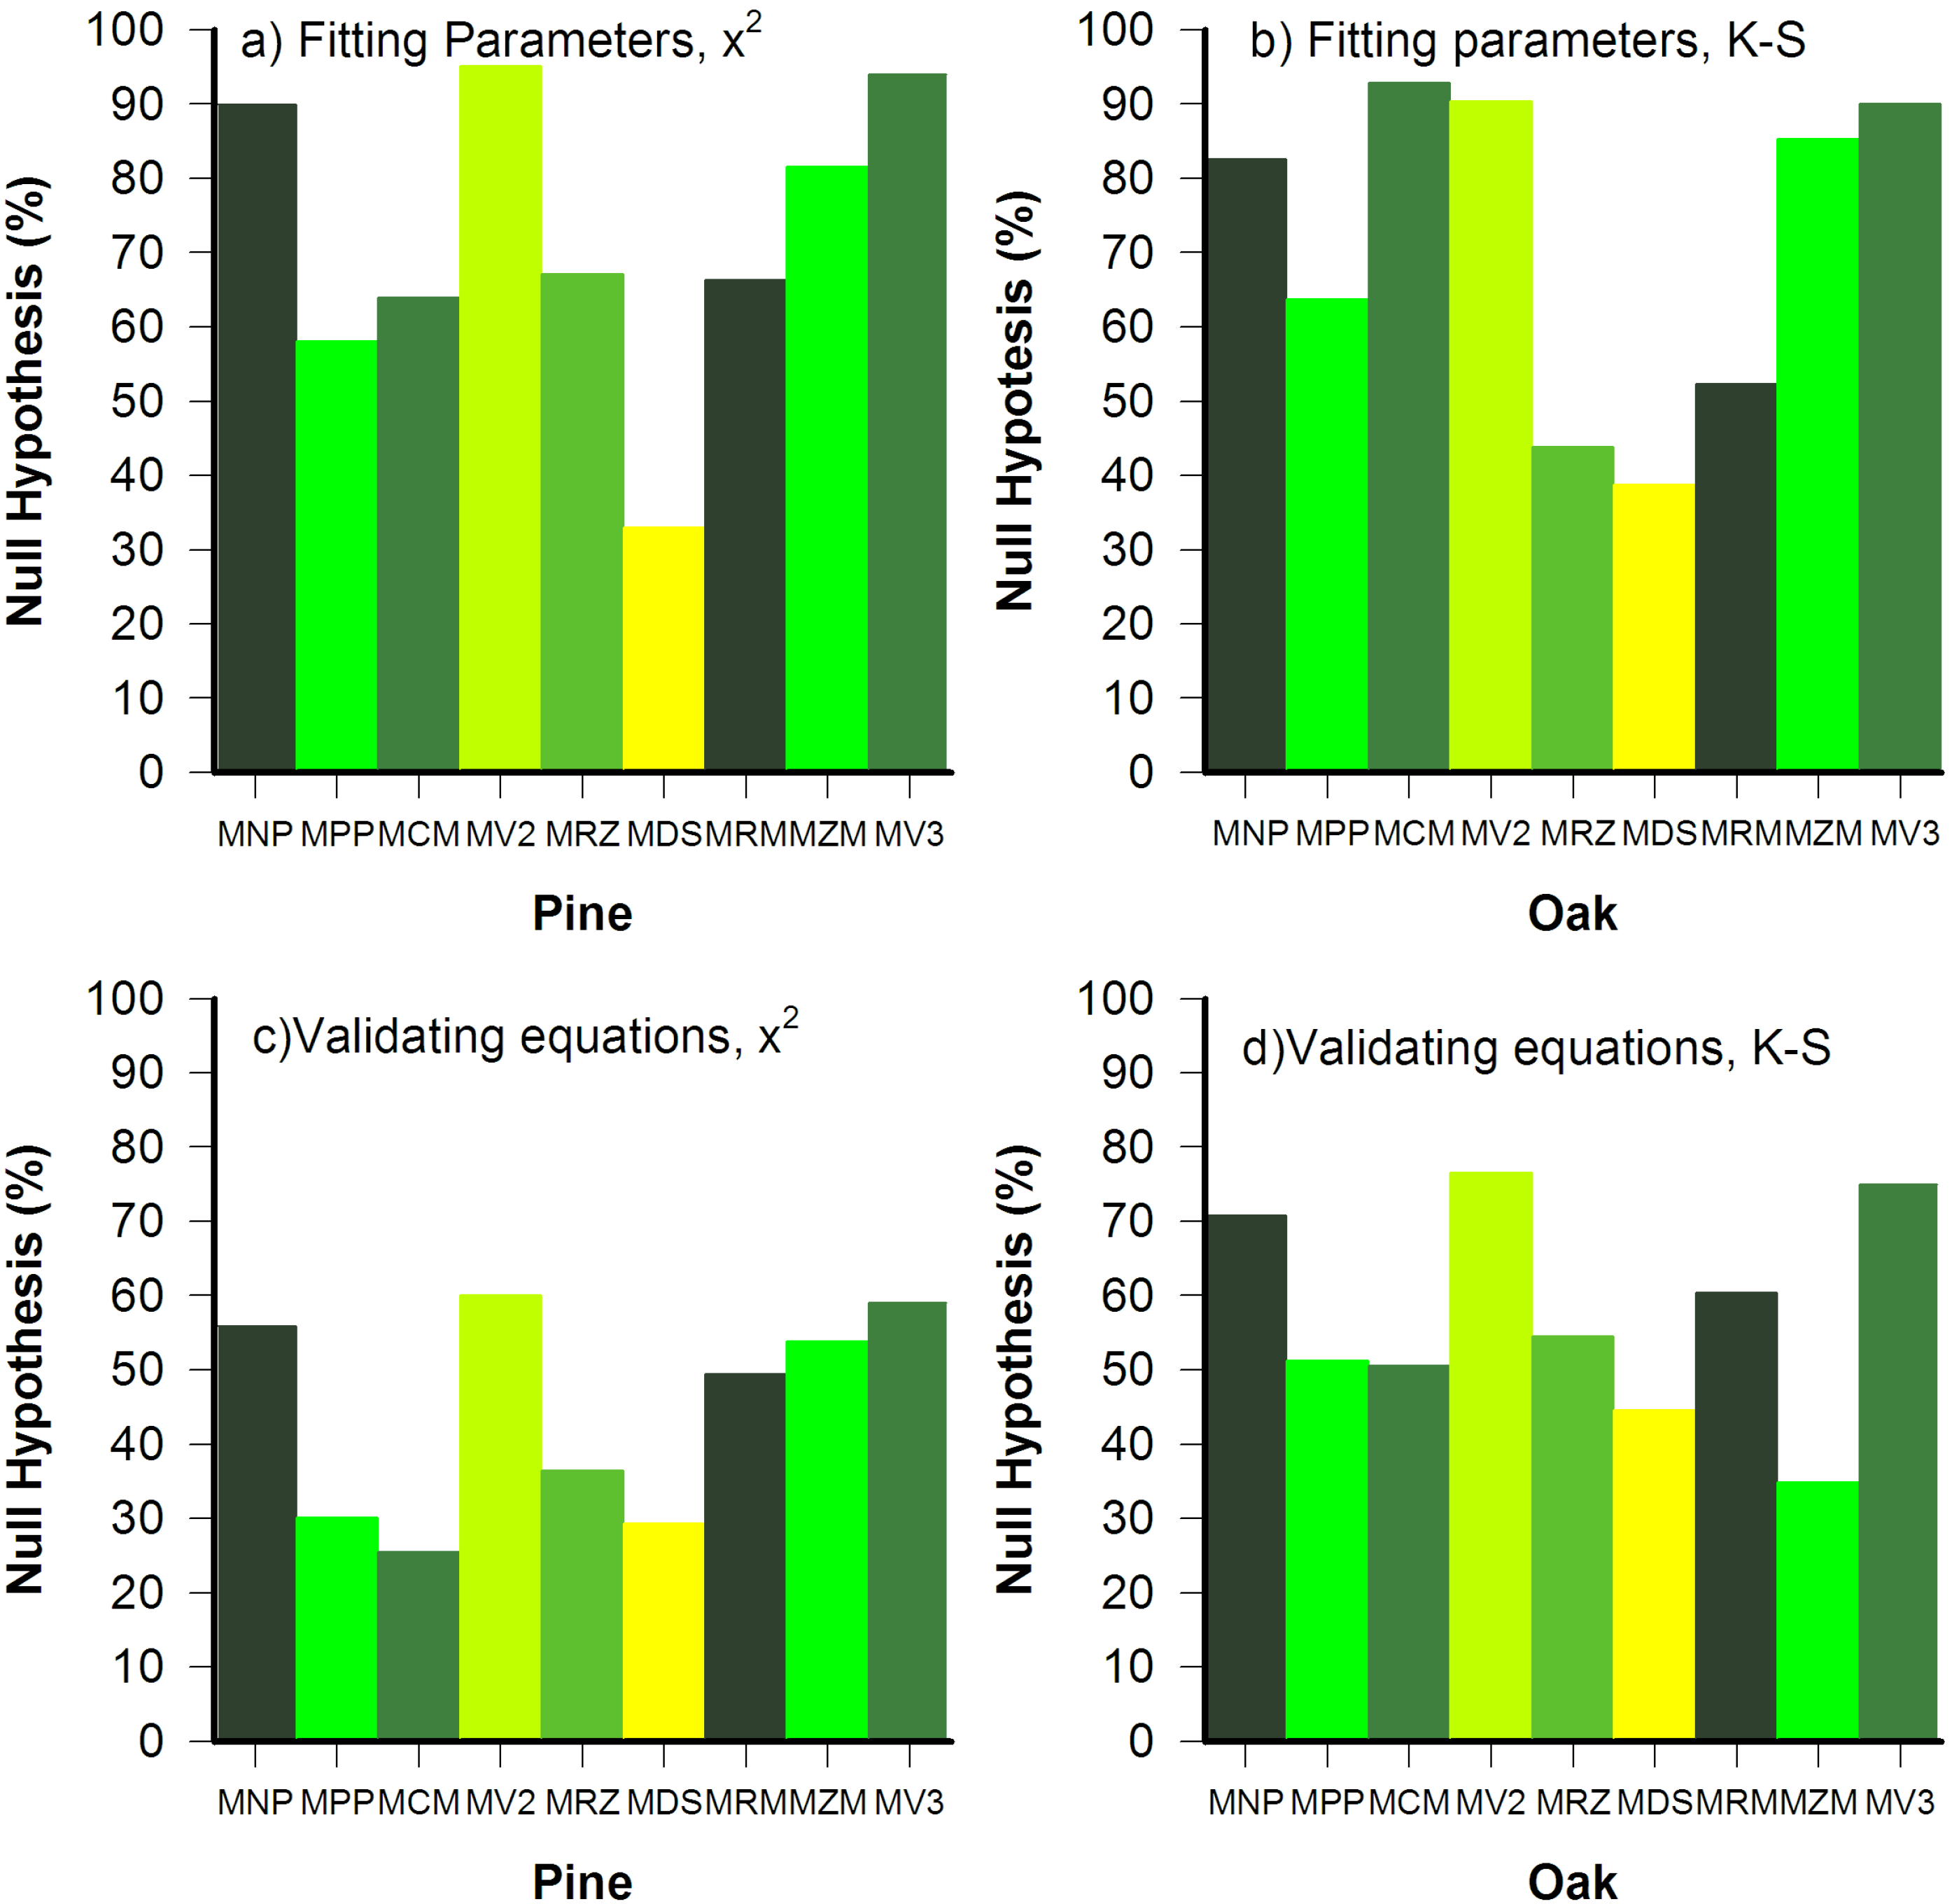
3.2. Goodness of Fit Tests

The Weibull density function projected diameter distributions compatible with the observed pine diameter distributions, according to the χ2 and K-S tests. MV2 and MV3 consistently accepted the highest percentage of null hypotheses (76.5%), in contrast to MZM and MDS (34.9% and 44.6%, respectively). MV2 and MV3 procedures also accepted the largest percentage of null hypotheses, according to the K-S goodness of fit test (95.1%). The MDM and MPP techniques, however, recorded the least goodness of fit with 33.0% and 58.1% of null hypotheses accepted, respectively (Figure 2).
Using the χ2 model, the approaches MV2 and MV3 had the largest percentage of accepted null hypotheses (60.1) for oak trees. The MCM and MDS techniques recorded the worst goodness of fit with only 25.5% and 29.4% of accepted null hypotheses. Using K-S, the MCM and MV2 methods recorded the largest percentages of accepted null hypotheses (92.9% and 90.4%, respectively). On the other hand, MDS and MRZ had the worst goodness of fit with only 38.8% and 43.8% of null hypotheses accepted, respectively (Figure 2).
Figure 2. Goodness of fit tests χ2 and K-S conducted on nine different techniques of parameter estimation of the Weibull density function for 587 forest stands of fitting (a, b) and 250 forest stands of validation (c, d) parameters.
Forests 05 03048 g002
In general, pines have smoother diameter distributions than oaks. As the Weibull density function failed to fit well the remaining forest stands (23.5% and 39.9%), it is recommended to apply other probabilistic distribution functions, such as the Johnson SB density function. Borders and Patterson [44], Cao and Baldwin [45], Kangas et al. [46], Návar-Cháidez [37], Parresol et al. [23] and Návar-Cháidez and Dominguez-Calleros [47] described other non-distributional approaches to predict the diameter distributions of forest stands. For quite a few, managed multi-cohort forests the diameter distributions were better described by a bimodal distribution function compared to the unimodal one; as it was the case for cedar forests in Morocco [48]. However, they were so few that I decided to go on with the unimodal Weibull distribution model.

3.3. Parameter Variance and Bias

For pine trees, methods MV2, MV3, MNP and MPP had the smallest parameter variances for α, β and ε (0.001, 0.001 on average, 0.067, and 0.013, respectively), unlike the approach MCM, which recorded the largest variance for all three parameters. For oaks, parameter estimators α and β, when calculated by techniques MV2, MV3 and MNP, had the smallest variances (0.007 and 0.328 on average, respectively). The MPP method showed the smallest variance for ε (0.071). All three parameters exhibited the largest variance when estimated by the MCM method (Table 3).
Table 3. Efficiency and consistency of parameter estimators for α, β and ε calculated by nine methods for pines and oaks in mixed forest stands of Durango, Mexico.
MethodWeibull Distribution Parameters
α *β ε
BP §A ||BPABPA
Pines
MNP0.0271.240.0090.08525.520.067−0.02313.890.048
MPP−0.0851.230.004−0.02211.480.0860.01514.010.013
MCM0.2341.760.696−1.64125.7714.97−4.21611.1740.220
MV20.0352.860.001−0.05328.230.084**12.50**
MRZ0.2271.910.0100.30025.800.233−0.16010.590.127
MDS0.0502.340.0090.35822.900.378−0.4004.160.476
MRM0.0241.270.0080.06511.620.237−0.01713.930.059
MZM−0.0590.980.018−0.08525.800.0980.02514.530.016
MV3−0.0571.180.058−0.88212.0413.190.32213.331.559
Oaks
MNP0.0130.970.0080.16825.840.3280.07513.820.221
MPP0.0270.920.0070.40111.370.665−0.12814.240.071
MCM1.5252.395.966−1.47926.6418.71−9.4535.2527.969
MV2−0.0062.170.0070.08829.503.497**13.00**
MRZ0.2171.550.0300.25026.250.736−0.1739.770.650
MDS0.0911.860.0071.06025.390.909−0.7703.570.610
MRM0.0160.970.0080.10712.010.9750.03713.810.241
MZM0.0410.750.0100.43226.380.475−0.00914.560.285
MV3−0.0910.860.50−0.23110.4731.940.32114.3110.74
* Shape parameter, Scale parameter, Location parameter, § Average bias, || Mean, variance.
For pines, the location parameter α was least biased when parameters were estimated by MRM, MNP, MV2, and MV3 (0.024, 0.027, 0.035, and 0.035, respectively). The parameter β was also least biased when estimated by MPP, MV2, MV3, and MRM (−0.022, −0.053, 0.021, and 0.065, respectively). Finally, the smallest bias for ε was recorded when MPP and MRM were used to estimate parameters (Table 3). For oak diameter distributions, α and β were least biased when MV2 was used to estimate parameters (−0.006 and 0.088, respectively), and ε was least biased when MZM (−0.009) estimated parameters. MCM and MDS recorded the largest parameter bias for all three estimators (Table 3).
The procedure of maximum likelihood of two and three parameters consistently yielded compatible diameter distributions similar to those measured for pines and oaks. The assumption that ε = 0 seems to work well because these forests are under management, and contiguous forest openings allow the establishment of regeneration, which in turn allows the contiguous presence of the smallest inventoried diameter classes. Hence, I stress the appropriateness of either the two or three- parameter maximum likelihood techniques of parameter estimation to simulate the diameter distribution of these forests. The former technique of parameter estimation has also been recommended to probabilistically model the diameter classes of Q. robur [49] and P. elliottii [30], as well as the diameter classes of pine, oak and juniper trees of native mixed and multiaged forests [26]. This method is validated by the fact that it produces estimators, which meet the statistical requirements of efficiency, consistency, unbiasedeness, and small variance. Haan [24] pointed out that this procedure uses all the information available when calculating parameter estimators, and that it converges well into the constant value with a small number of observations. Nanag [50] noted that the maximum likelihood, percentile, and moment procedures of parameter estimation produce compatible results. Other investigators recommended the percentile technique because of the ease with which it can be used to estimate parameters [51,52].

3.4. Parameter Prediction and Recovery

Using the MV2 procedure of parameter estimation, α and β as well as Xp, Std, and Sk were evaluated by the following equations (Table 4).
Table 4. Weibull parameter prediction and recovery equations for pine and oaks growing in Mexico’s northern mixed multiaged temperate forests.
Group of SpeciesParameterEmpirical Equationnr2Sx
Pinus spp.α0.91Dm13.86Dq−12.31N−0.49BA0.415870.520.20
β2.9 + 2.2Dm − 0.01N − 1.2Dq + 0.13BA + 0.005Cc + 0.033H5870.930.89
Xp98.5N−0.46BA0.465870.960.55
Std1.36 + 0.29Xp − 0.008N + 0.13BA5870.681.10
Sk0.00000021Std2.62N3.14BA−2.935870.420.51
Quercus spp.α0.30β0.99Dm4.18Dq−4.48IDR−0.0685870.510.21
β12.76 + 1.77Dm − 0.035N − 1.13Dq + 0.56BA5870.841.39
Xp92.8N−0.43BA0.43Cc−0.0315870.940.76
Std799902177Xp−3.5N−2.5BA2.5Cc0.0615870.881.61
Sk0.00004Std1.9N1.9BA−1.8Cc0.155870.500.57
Where: α and β = shape and scale parameters of the Weibull distribution function; Xp = diameter average; Std = standard deviation of the diameter data; Sk = Skew coefficient of the diameter data; N = stand density; Dq = mean quadratic diameter; BA = Basal area; Dm = mean stand diameter; Cc = canopy cover; IDR = Reineke Density Index.
When predicting parameters from stand attributes, the validation procedure for the independent data set of 250 stands indicated that 51.3% and 74.7% of the population accepted the null hypothesis when using the χ2 and K-S tests, respectively. When using the moment recovery approach, 49.8% and 78.4% of the population fit the two-parameter Weibull distribution when using the χ2 and K-S tests, respectively. For oaks, the moment prediction approach and the recovering of parameters by MNP accepted 37.5% and 73.7% of the population, as tested by the χ2 and K-S statistics, respectively. The parameter prediction approach was accepted by only 43.7% and 66.7% of the population, as tested by the χ2 and K-S goodness-of-fit tests, respectively. When averaging the results of χ2 and K-S tests, the parameter recovery approach fitted diameter distributions better than the parameter prediction approach, which is consistent with the findings of Hyink [34] and Gove and Patil [53].

3.5. Sensitivity Analysis

The prediction equation of the diameter distribution of pines was most sensitive to the standard error in α because the percentage of accepted null hypotheses was reduced on average to 85% for the χ2 and K-S goodness-of-fit tests. Changes in the acceptance of null hypotheses were hardly noticed when the standard error was added to the equation to predict β. The percentage of accepted null hypotheses notoriously shifted to 76.6% when the standard errors of each parameter were added (Table 5). The sensitivity analysis reflects the need to predict and recover α with the greatest precision. Návar et al. [38] demonstrated that growth models based on predicting the Weibull distribution parameters were most sensitive to changes in α values as well. Návar-Cháidez [37] developed a simple regression equation to predict α with the skew coefficient, Sk, consistent with the mathematical theory.
For the parameter recovery approach, the equations used to predict the moments indicated that Sk must be estimated with the greatest precision because the percentage of accepted null hypotheses was highly sensitive to this statistic. The percentage of accepted null hypotheses was reduced on average by 20%. The contribution of the error to the standard deviation and the mean was small (less than 5% of change). However, when all standard errors were incorporated into the equation, the percentage of accepted null hypotheses was reduced by 28% (Table 5).
Table 5. Sensitivity analysis of equations for predicting and recovering the Weibull distribution parameters, and the goodness-of-fit test for pine and oak stands of Durango, Mexico.
ParameterHo Accepted (χ2)Ho Accepted (K-S)
Prediction ApproachPineOakPineOak
No change MV251.343.774.766.7
α ± EES32.536.771.965.2
β ± EES49.841.773.265.6
α ± EES y β ± EES36.229.160.259.2
Predicting Moments Approach
No change MNP49.837.578.473.7
Sk ± EES34.828.173.161.3
Std ± EES47.438.078.671.3
Xp ± EES48.438.881.970.5
Sk, Std, Xp ± EES30.325.959.261.6
The sensitivity analysis also showed the prediction approach is less sensitive (because it uses the skew coefficient) to changes in the shape parameter than the recovery approach, as average deviations reached values of 14% and 19%, respectively. However, when estimating an average deviation in the number of null hypotheses across all estimated parameters and groups of species, both procedures of parameter estimation recorded similar figures (8%).

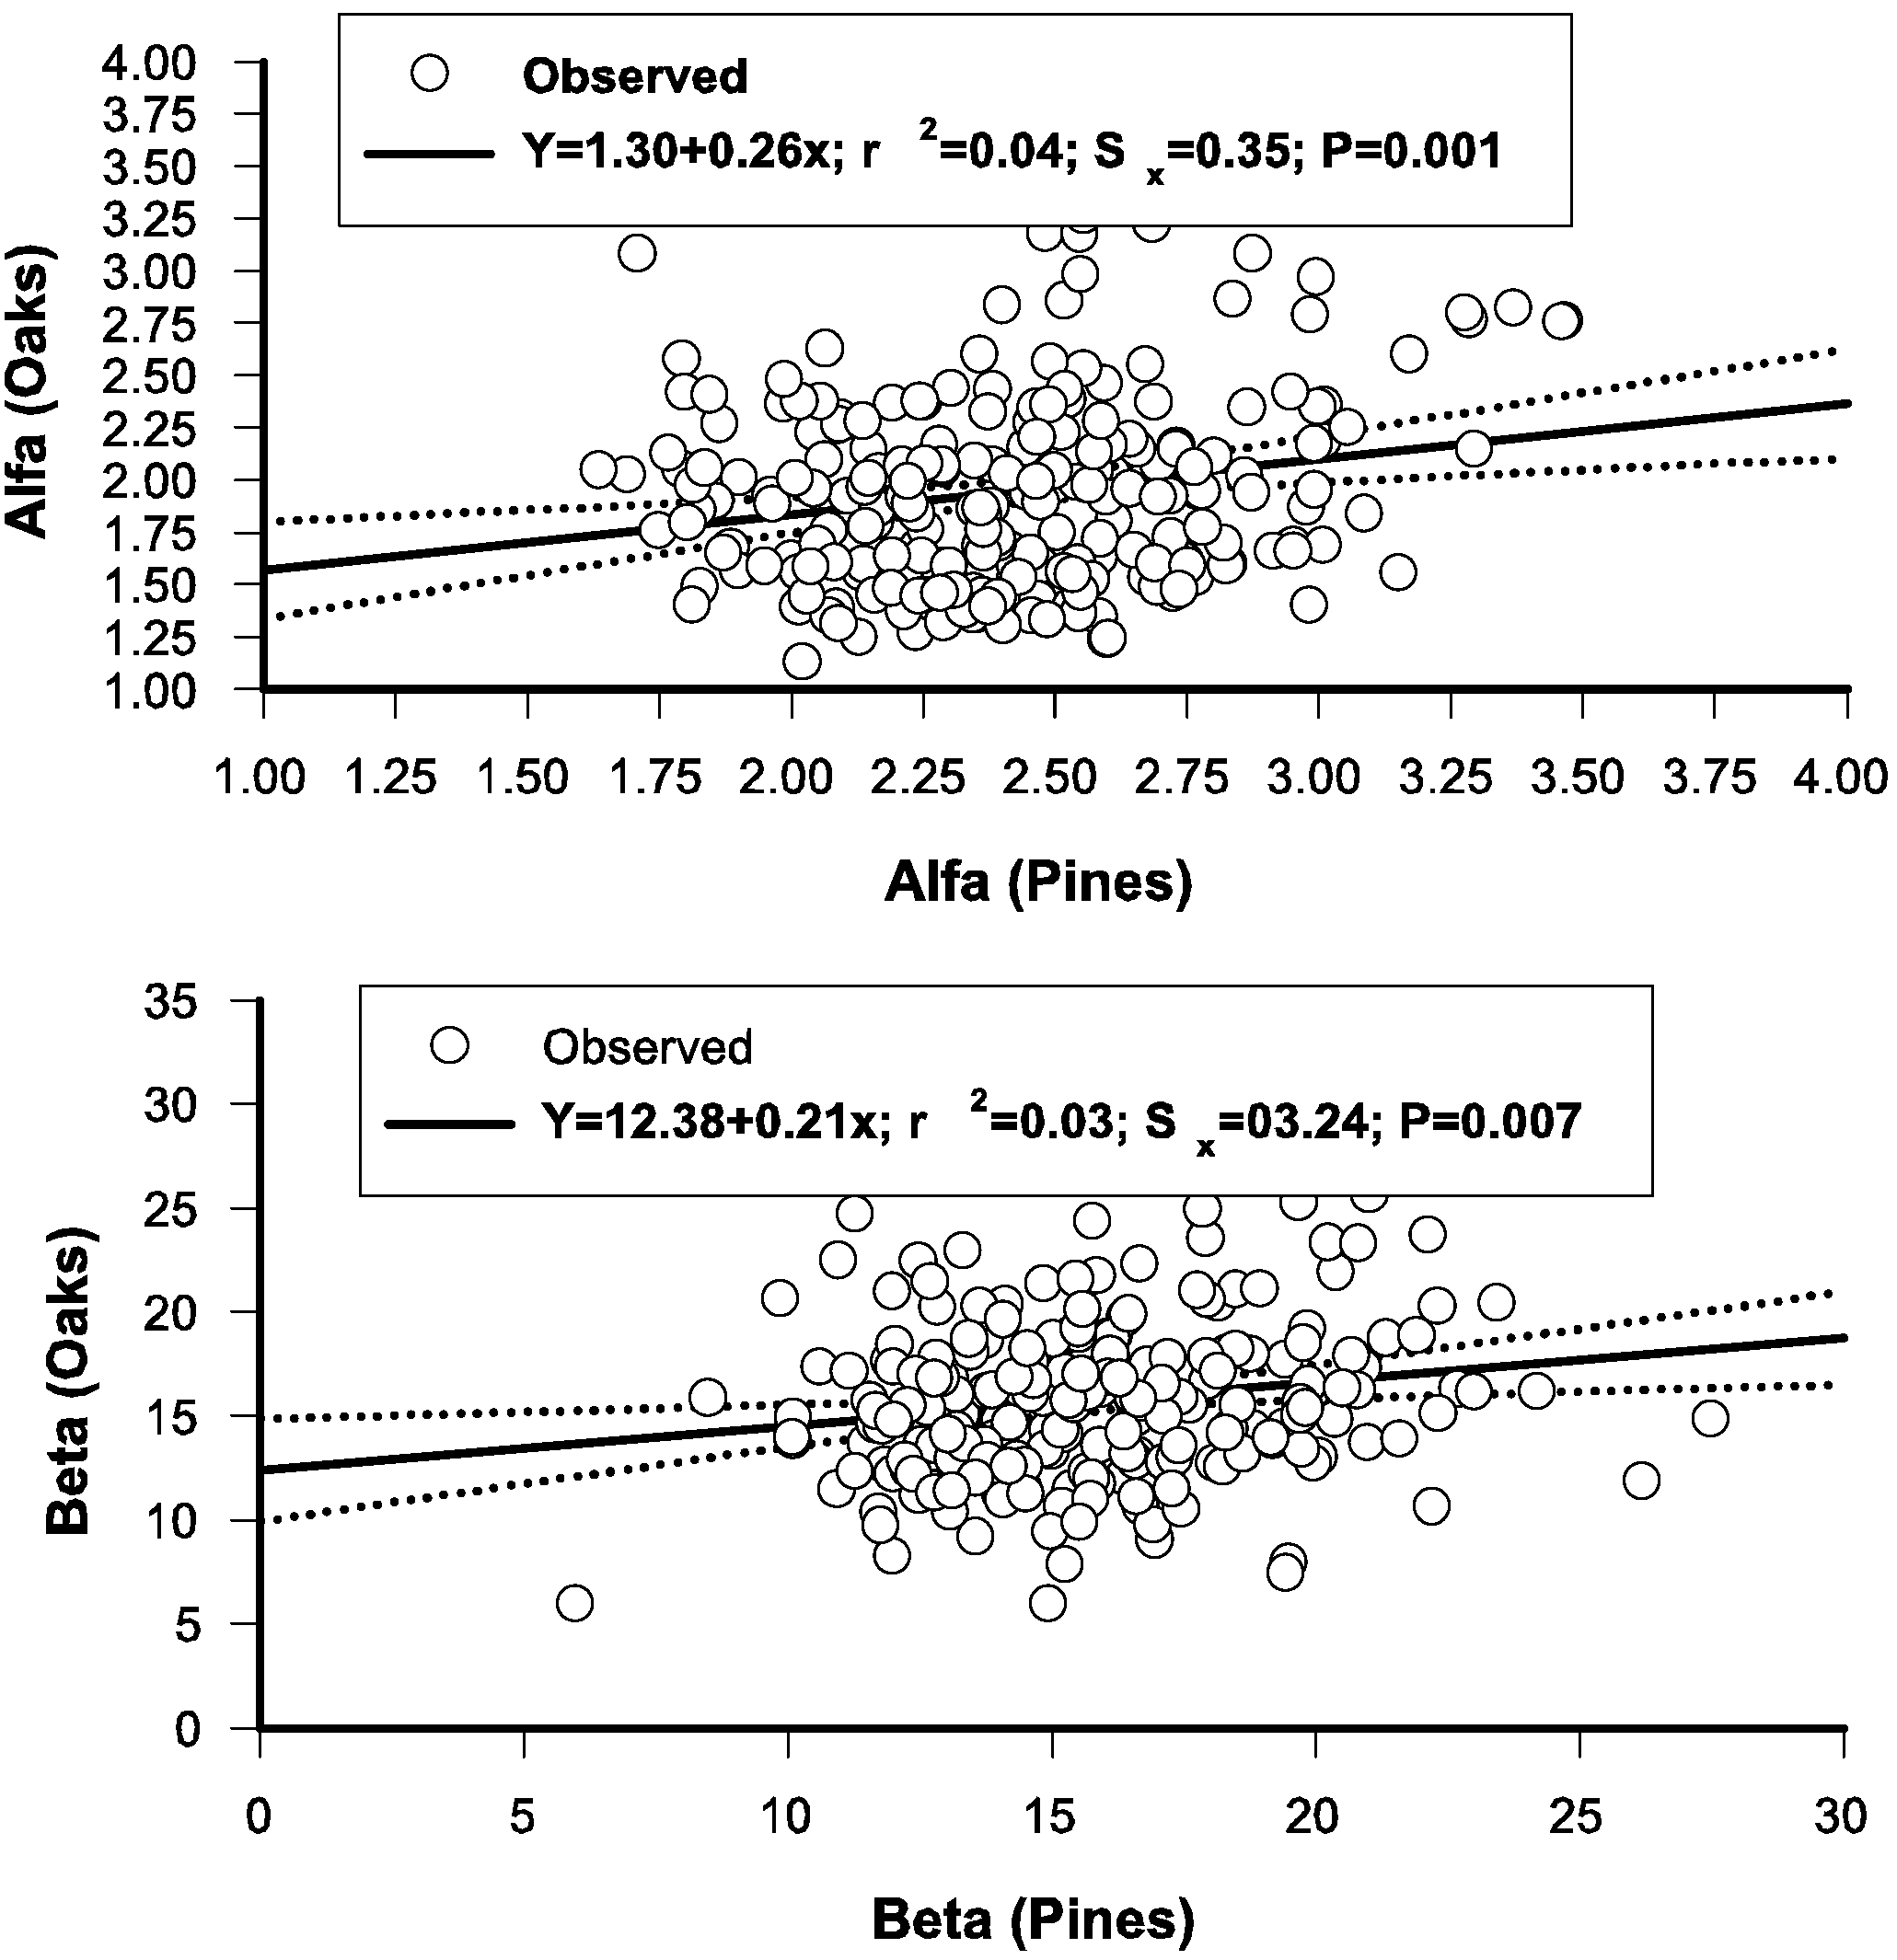
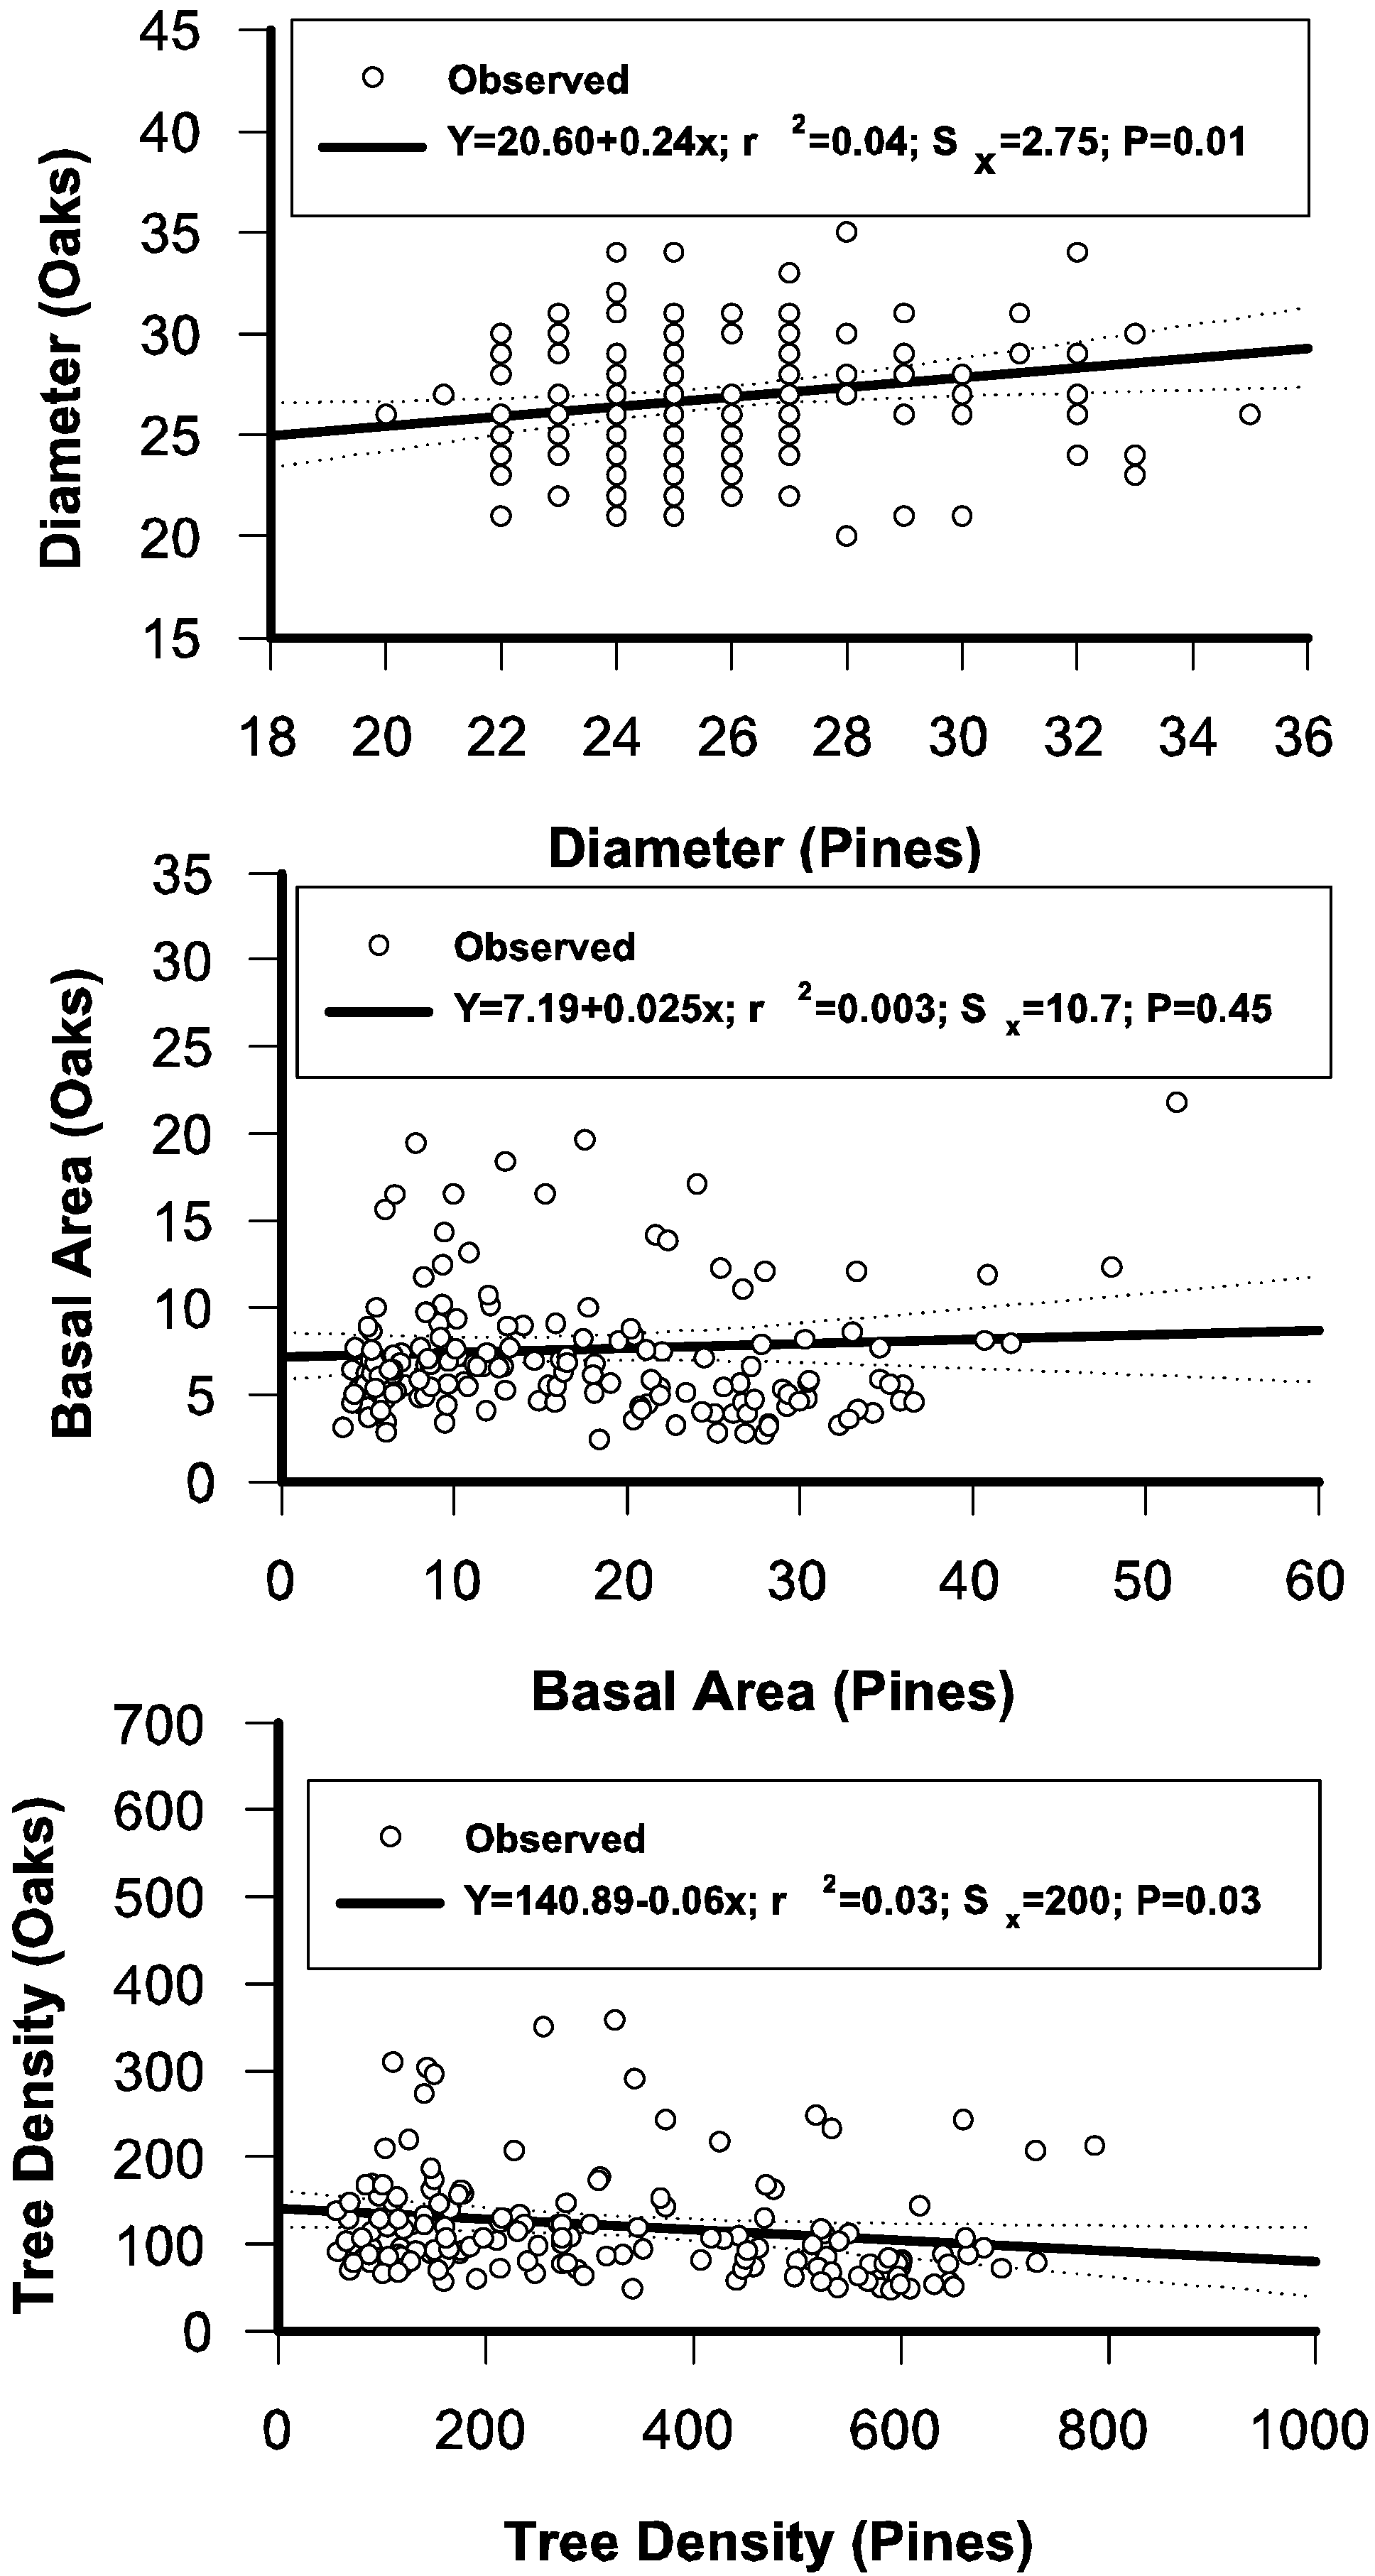
3.6. Regressing Distributional Parameters of Oaks and Pines

The average diameter and stand density of oak and pine trees, unlike the basal area, were found to be statistically related (Figure 3). Positive statistical relationships were found between parameters of the Weibull distribution, as well (Figure 4). The positive slope indicates an average oak diameter increment of 0.24 cm for a unit of pine diameter shift of 1.00 cm. Oak stand density was negatively related to pine stand density (Figure 3). Oak density is 140 trees ha−1 when there are no pines in the stand, but when pine density increases to 500 trees ha−1, oak density diminishes to 110 trees ha−1. When pine density increases to 1000 trees ha−1, oak density diminishes only to 81 trees ha−1. Oak density diminishes, on average, only by 6% when pine density increases 100%. That is, even though there is a statistical relationship, the slope is so small that it can be attributed to other causes of oak and pine distribution, such as subtle changes in altitude above sea level, which may modify the ratio of pine/oak diversity [9].
Figure 3. The statistical relationships between stand parameters of oaks and pines (r2 = coefficient of determination, Sx = Standard error, P = probability).
Forests 05 03048 g003
Figure 4. The statistical relationships between the Weibull distribution parameters of oaks and pines (r2 = coefficient of determination, Sx = Standard error, P = probability).
Forests 05 03048 g004

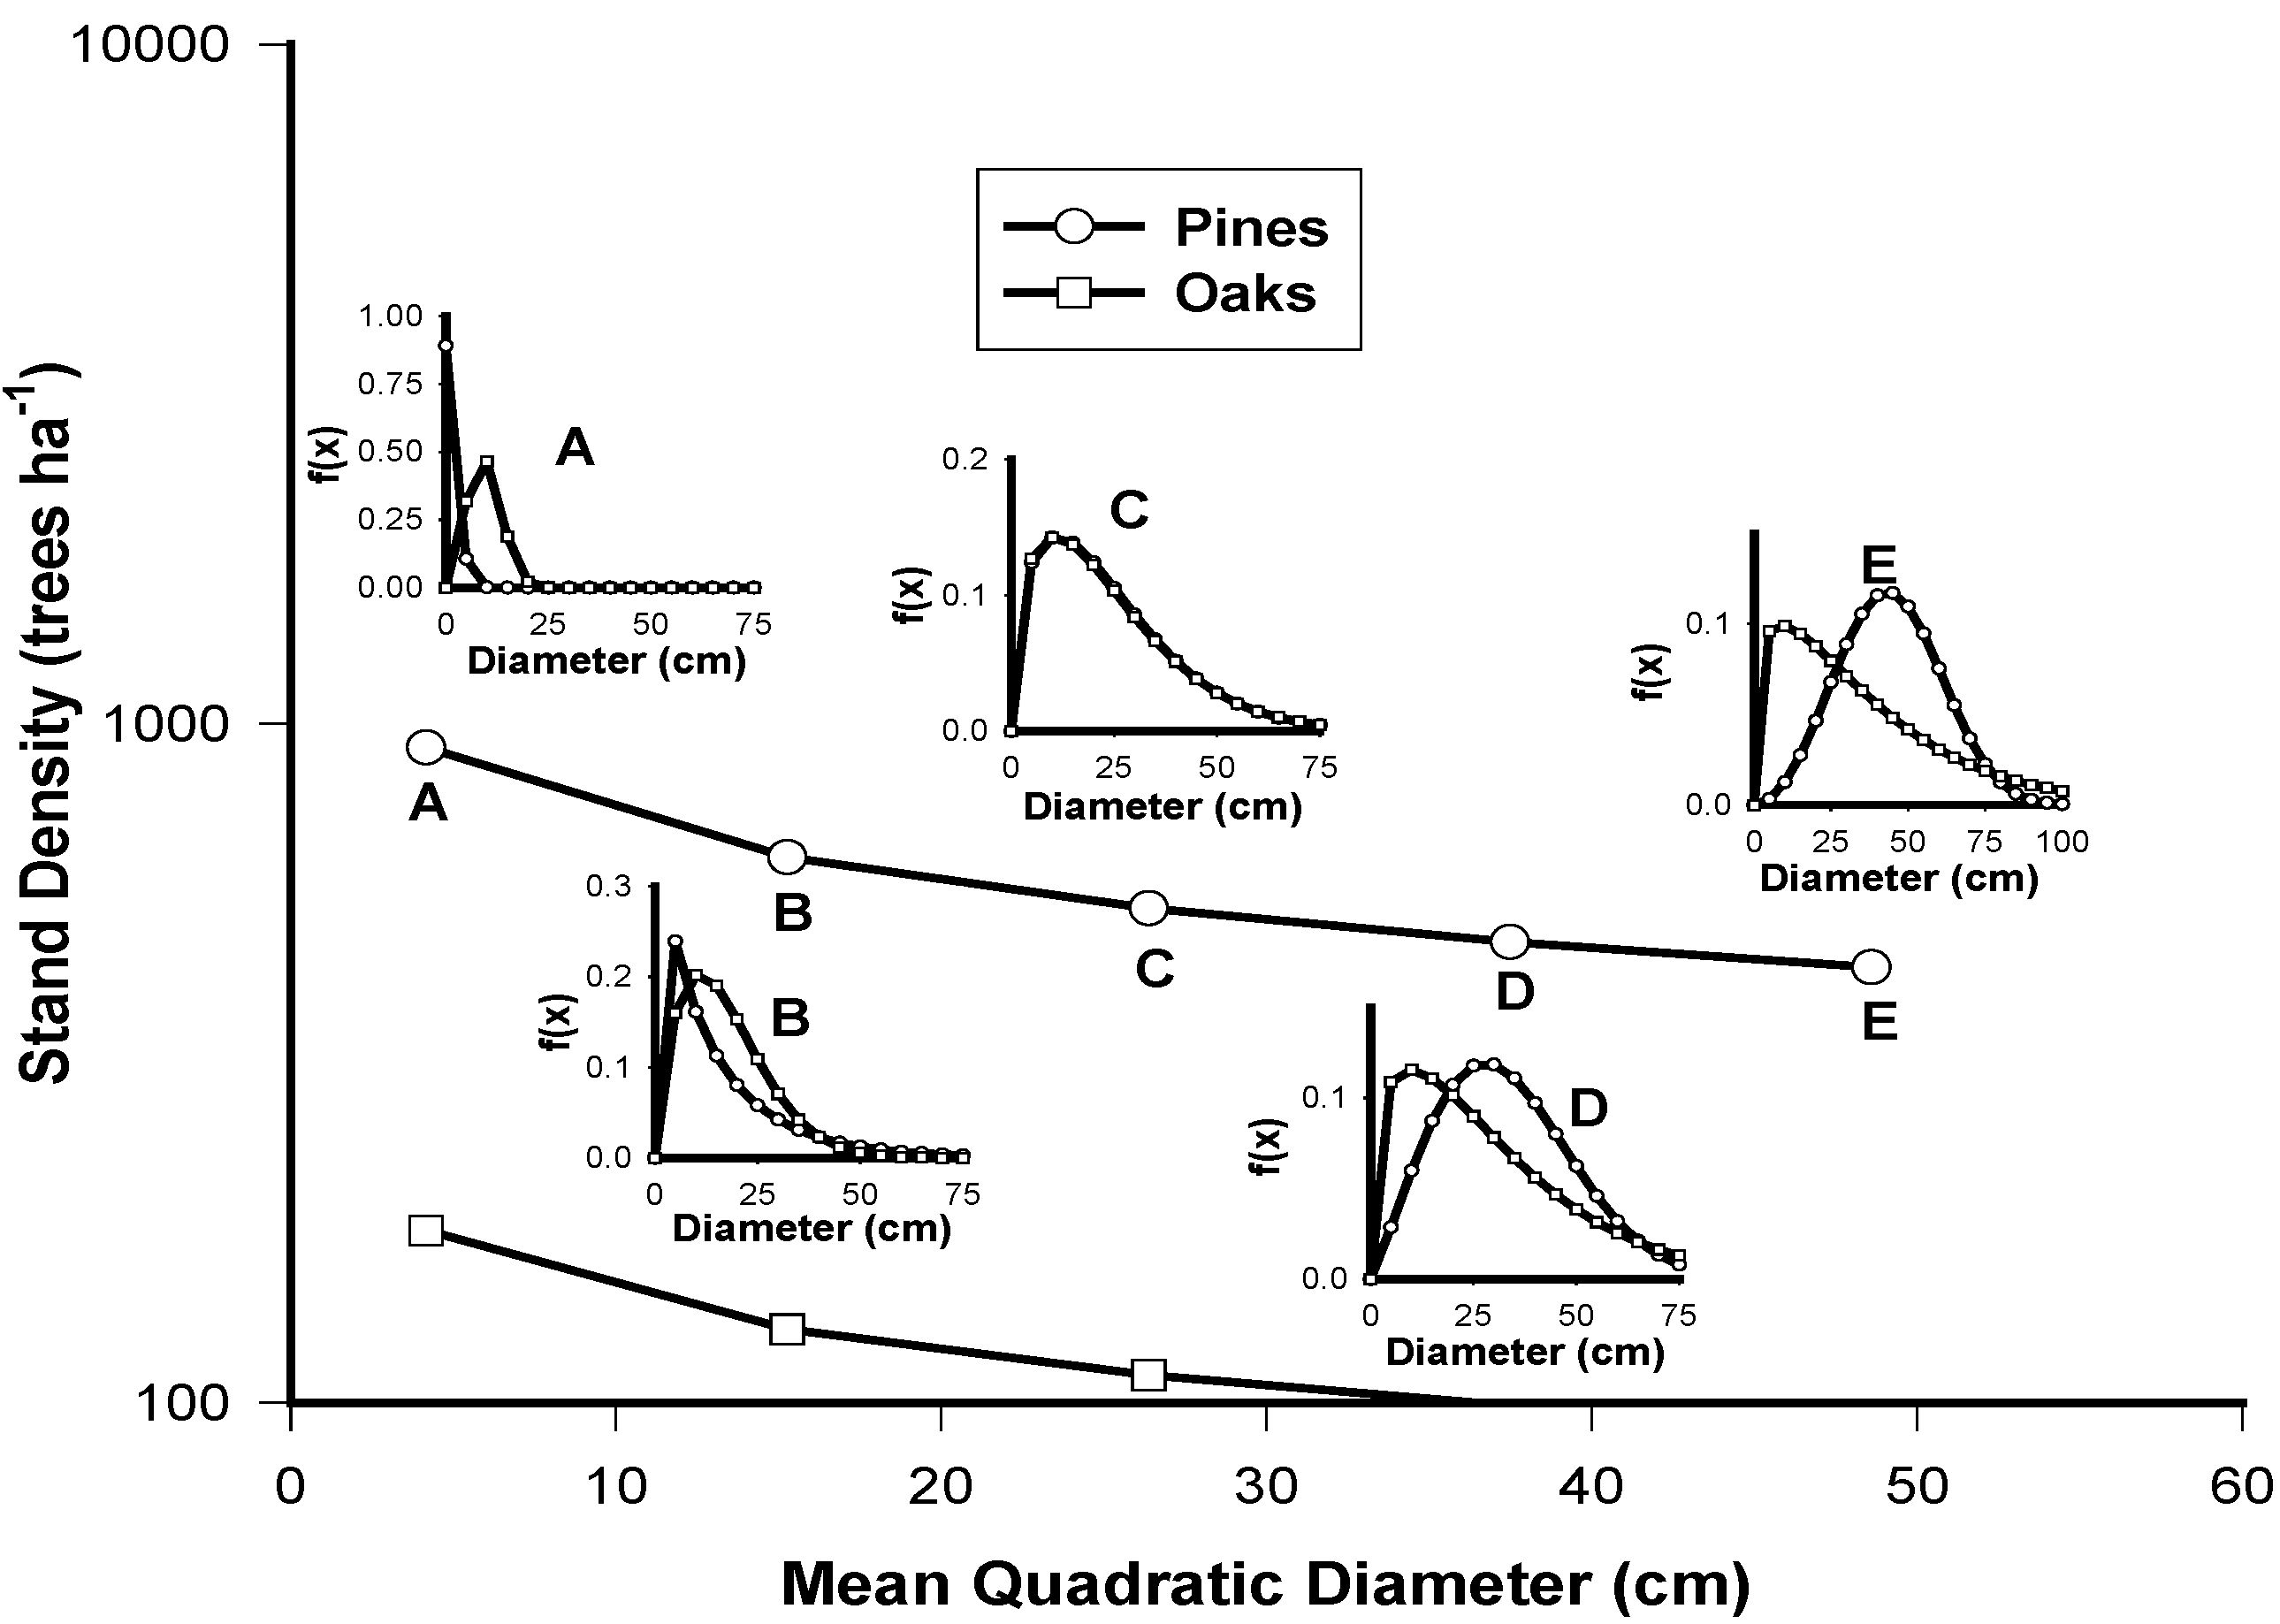
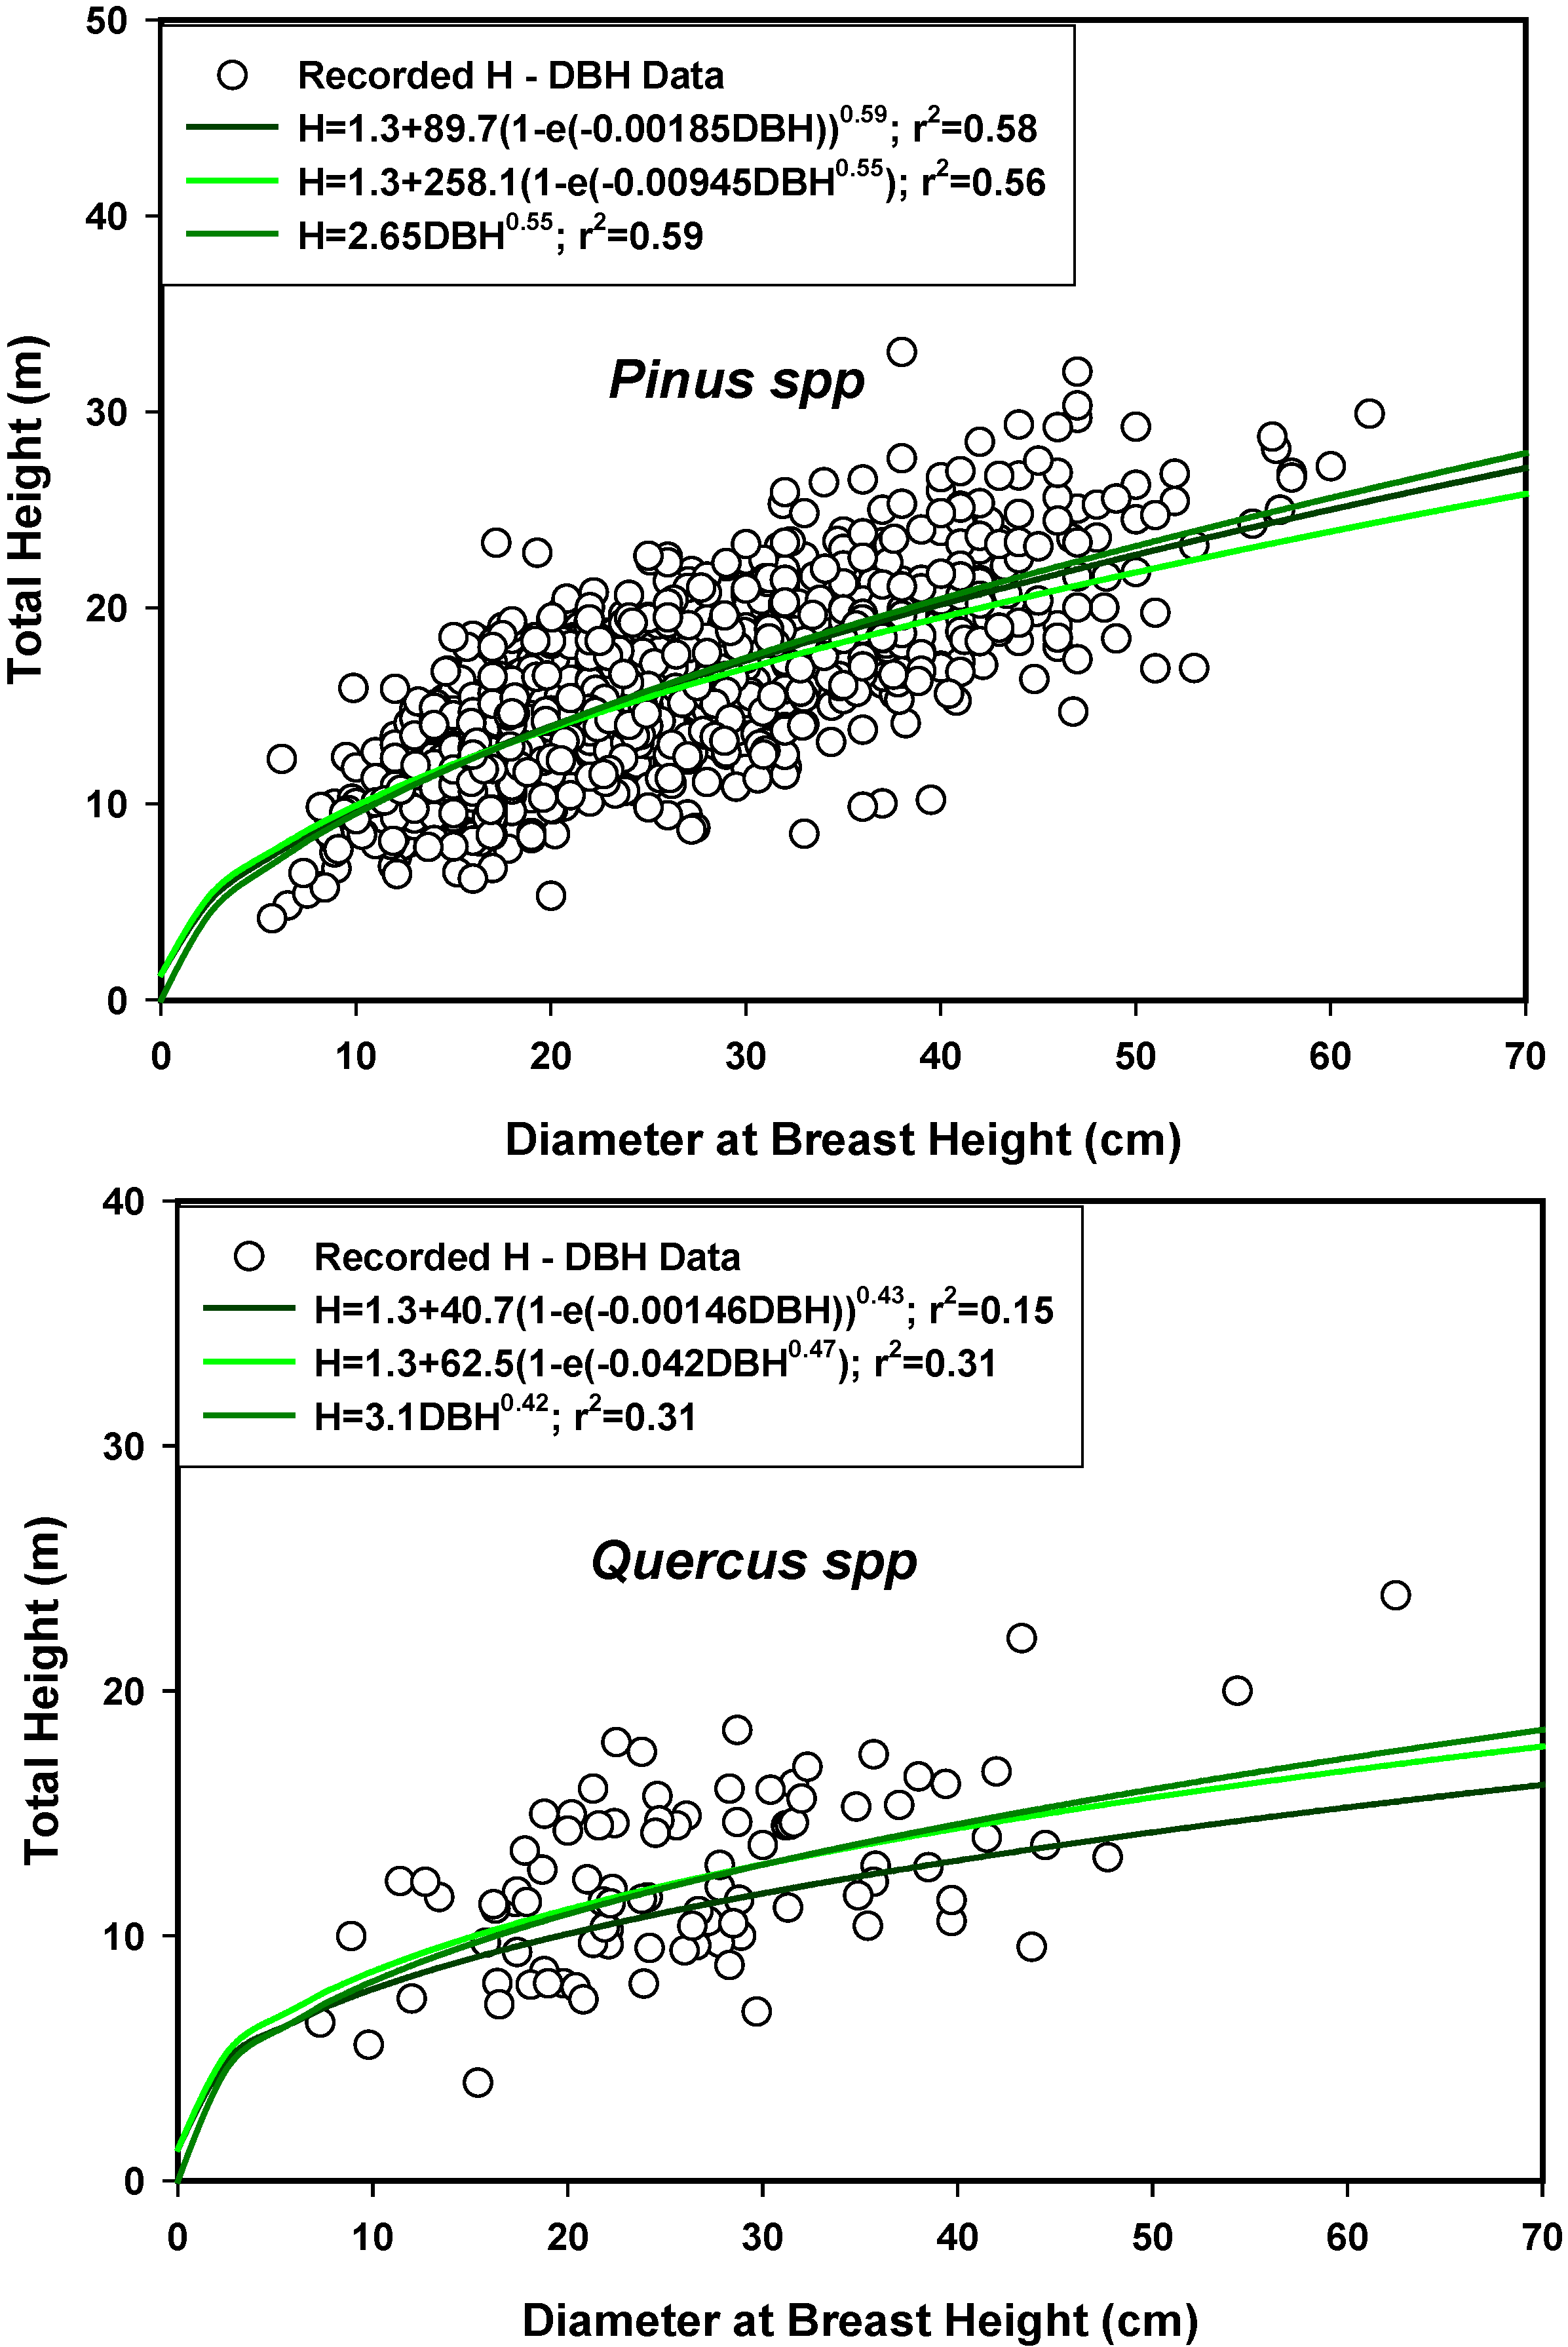
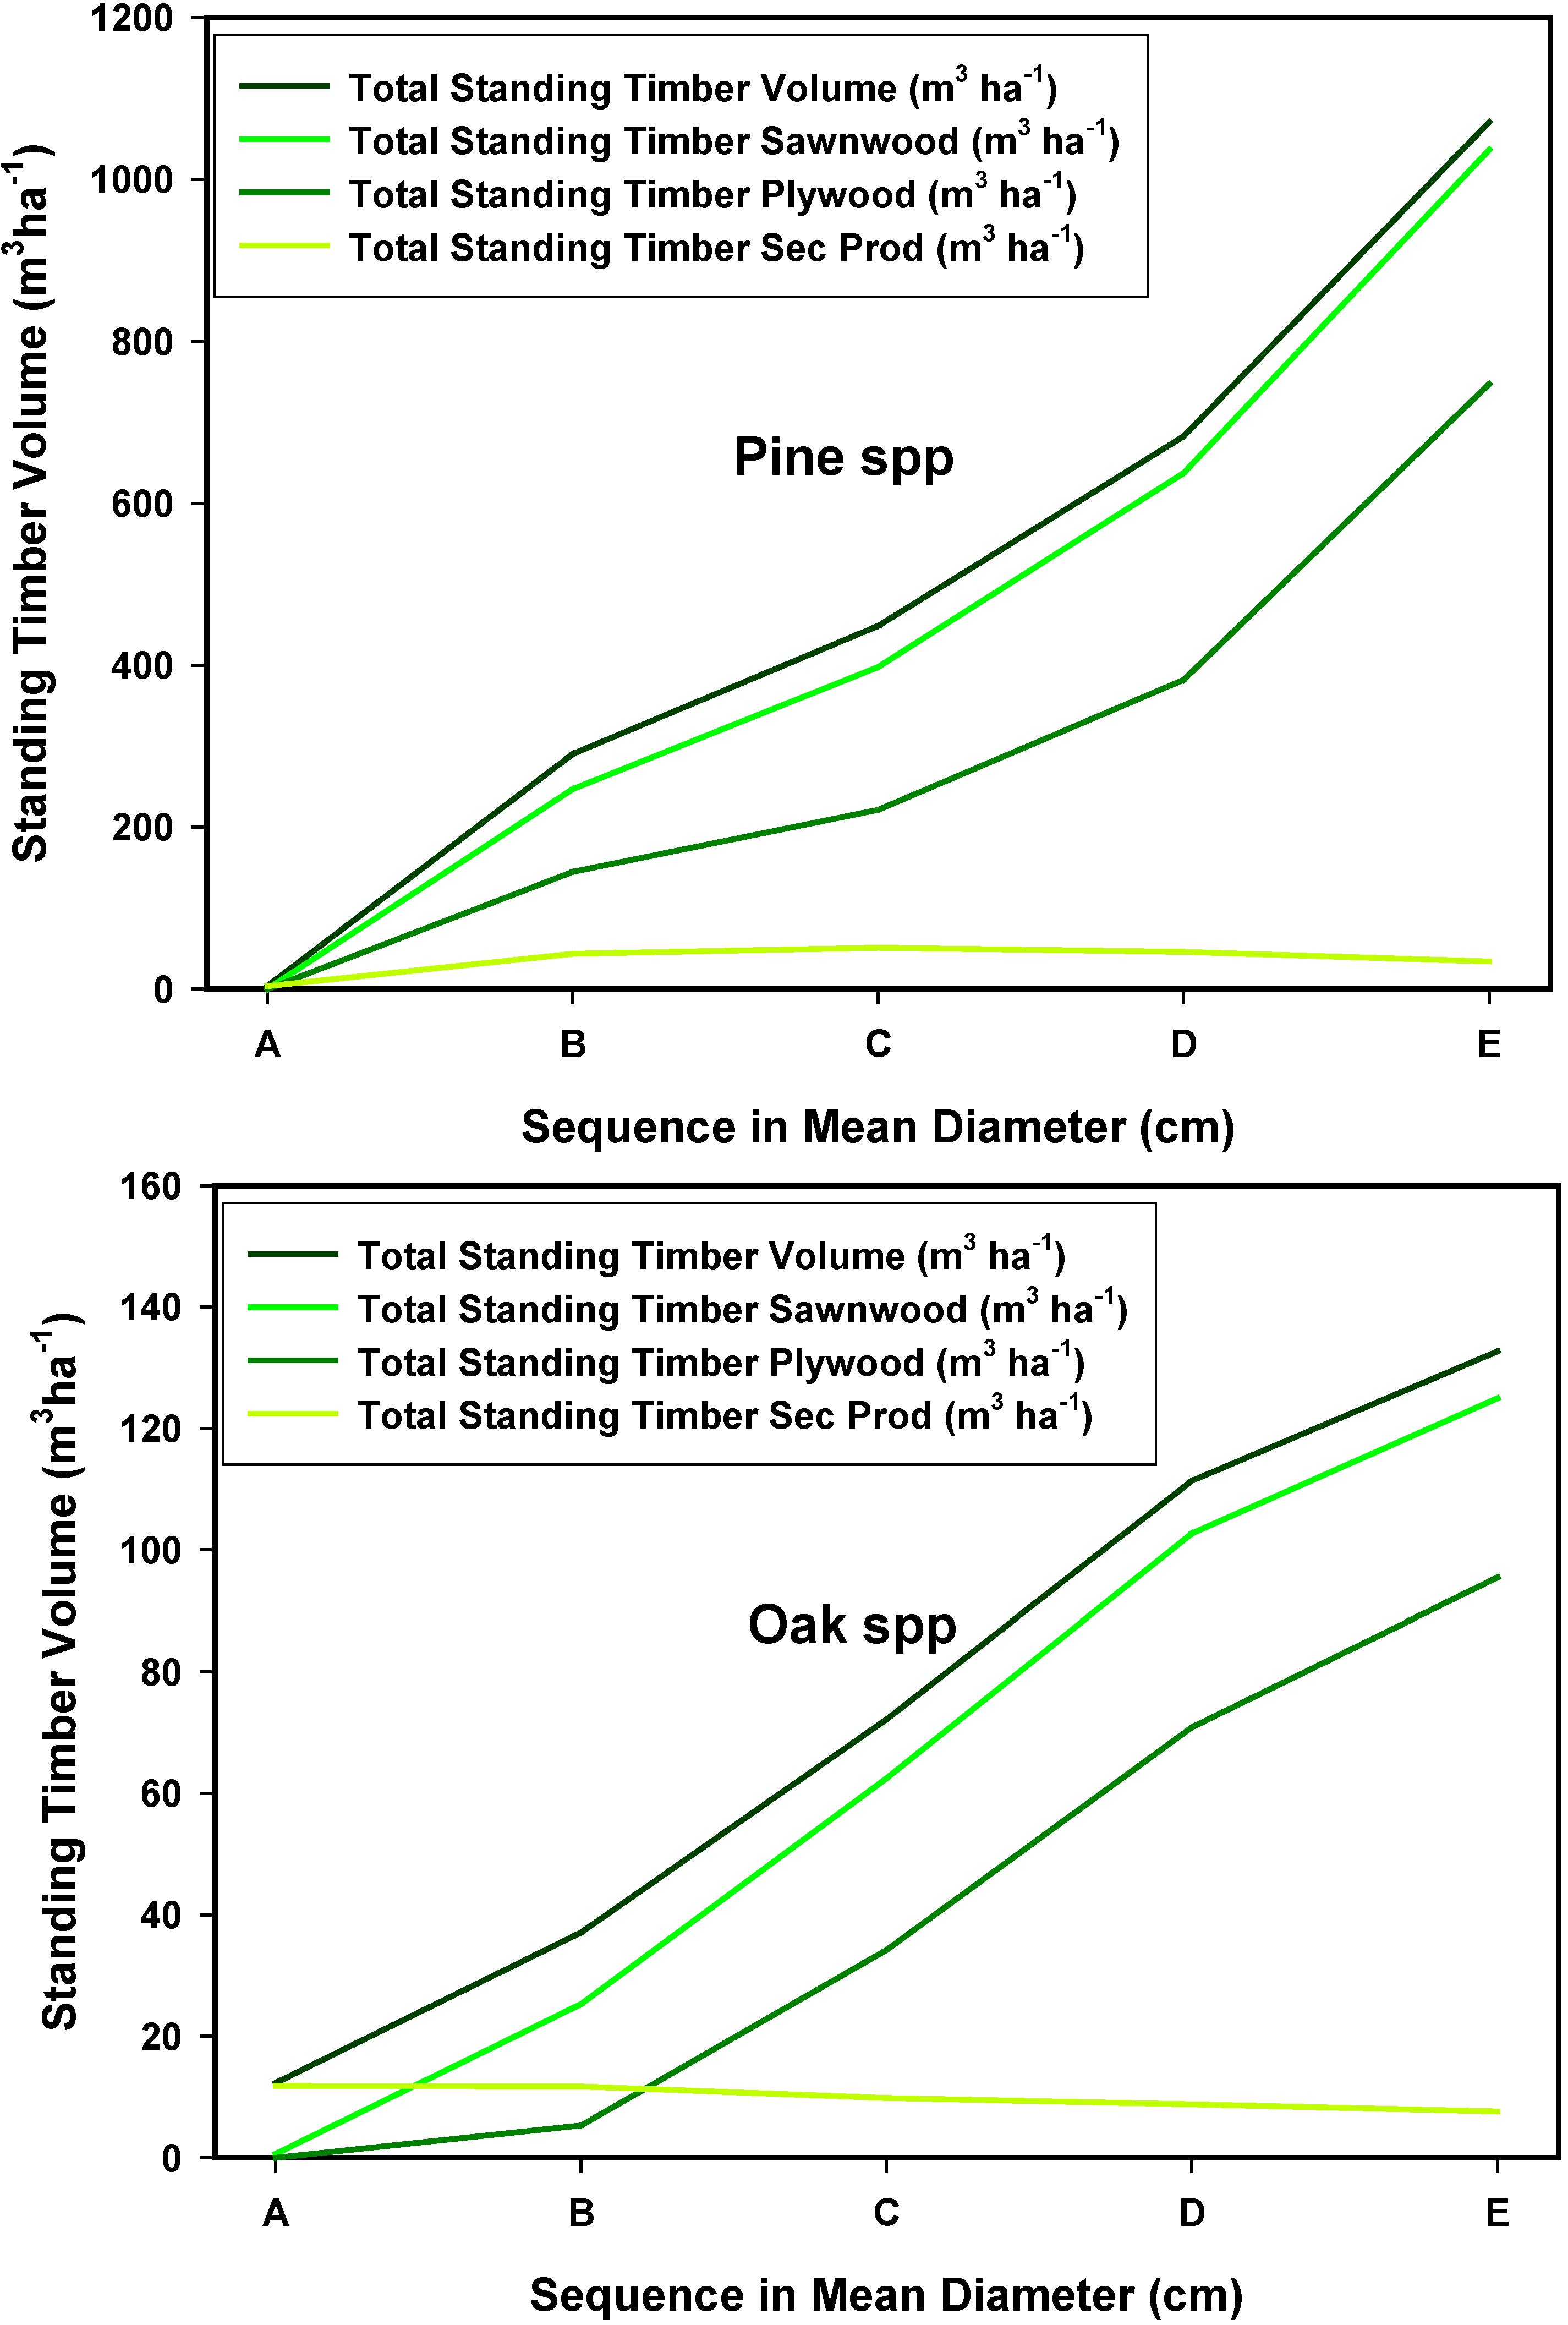
3.7. The Stand-Class Growth and Yield Model

The diameter distributions projected by the growth and yield model is depicted in Figure 5. The statistical regression equations used to predict the diameter distributions are presented below in Table 6.
Figure 5. Graphical representation of the stand class growth and yield model for pines and oaks of Mexico’s northern mixed temperate forests. Capital letters indicate the sequence in mean quadratic diameter.
Forests 05 03048 g005
Table 6. Empirical prediction equations that form the core of the stand-class growth and yield model for pines and oaks.
Attributes/SpeciesPinus spp.Quercus spp.
Stand Density1591.5dmp−0.3392 (r2 = 0.28)293.15Dmq−0.3051 (r2 = 0.36)
IDR30.61Np0.4307 (r2 = 0.65)296.9exp0.0007Nq (r2 = 0.43)
Dq1.1108Dmp−1.3924 (r2 = 0.98)0.69Dmq1.1397 (r2 = 0.99)
H1.5158Dmp0.7217 (r2 = 0.47)0.9054Dmq0.8499 (r2 = 0.55)
Cc69.403Dmp−0.1429 (r2 = 0.87)2.29Dmq0.8626 (r2 = 0.56)
Where: IDR = Reineke Density Index; Dq = mean quadratic diameter; H = mean top height; Cc = mean canopy cover; N = stand density; Dm = mean diameter; p = pines; q = oaks.
The simple allometric power-law equation fitted slightly better the H–DBH relationship than the three-parameter sigmoidal equations of Chapman-Richards or Weibull for harvested pines and oaks (Figure 6).
Figure 6. Three equations fitted to the total height—diameter at breast height relationship for pines and oaks of northern temperate forests of Mexico.
Forests 05 03048 g006
Forest productivity in standing trees classified in forest products (sawnwood, plywood and secondary forest products) and total stand timber volume is depicted in Figure 7.
Figure 7. Graphical representation of the standing timber volume classified in merchantable forest products (sawnwood, plywood and secondary forest products) for pine and oak species of northern temperate forests of Mexico. Note capital letters indicate the sequence in mean quadratic diameter.
Forests 05 03048 g007
Nearly 90% of the total standing volume is classified as sawnwood, about 60% is classified as plywood and less than 10% as secondary forest products (timber tips with DBH ≤ 20 cm) for both pines and oaks.
The transformation of diameter by time is derived using the equation of Figure 8 by assuming the quadratic diameter is equal to the mean arithmetic diameter. Mean diameter is now translated into the age of trees with mean diameter and the diameter distributions transition as a function of time rather than as a function of tree dimensions. Note the diameter-age relationship for oaks is missing because a reported local one by Merlin-Bermúdez and Návar-Cháidez (41) requires further revision before it is applied in conventional forest management.
Figure 8. Diameter growth curve for pines (source: 41) (Note: r2 = coefficient of determination, Sx = Standard error, P = probability).
Forests 05 03048 g008
The growth and yield model has several weaknesses that cannot be overseen. It feeds with several empirical equations that need further revision and data to improve the variance explained, e.g., the r2 ≤ 0.50. The empirical equation that predicts the shape parameter of the two-parameter maximum likelihood Weibull density function presents the smallest coefficient of determination. A different approach would be to use the empirical equation developed by Návar-Cháidez [37] that uses only the skewness coefficient to predict α. The empirical equation to predict Sk has also one of the smallest coefficients of determination for both pines and oaks and the improvement of this equation is a matter of further research. Other stand variables must better predict either α or Sk, such as the quartiles of the diameter distribution function, basal area, site index, and altitude [22,39]. A parameter that explains the deviance from the normal distribution could also improve future α assessments. Regardless of these shortcomings the model predicts robust tendencies and therefore it deserves further interpretation.
The average stand density of pines and oaks diminishes as a function of mean quadratic diameter according to a power-law function. As the mean quadratic diameter increases, stand density decreases and the pine and oak diameter classes transit to the right. The stand-class growth and yield model predicts oaks appear first in these forests, while pines establish later. Most natural large disturbances, such as forest wildfires, strong cold winds, and pests and diseases open large tracts of forests. In these places and may be in other stands that are under long-term natural disturbances, oaks appear first in the stand. Oaks regenerate from sprouts in the open or in the shade and have a reproductive advantage over pines as well. Oaks left in stands after harvesting may be a second explanation for the model prediction these species remain in the forest. Pines regenerate the forest not as secondary species of succession because they are shade intolerant. They regenerate well in forest openings and at the periphery of most oak crowns. These forests are in general somehow open and sun light can reach the forest floor regardless of previously established oaks and newly regenerated pines may have access to sunlight to search for a dominant position in time. Stand density hardly surpasses 1000 trees per hectare with 10 cm in diameter at breast height (800 pines and 200 oaks). These forest dimensions point at under-stocked, open stands [7,54], where sun light may be available for pines to successfully regenerate in forest openings left in the forest by the small oak density. Other factors, such as soil fertility and soil water content, could be more important in promoting the regeneration of pine trees of this community.
Due to the faster diameter growth in this proposed short-term scenario, pine diameter structures transit from a J-inverted to a Gaussian shape faster than oak diameter structures. In fact, oak diameter distributions did not attain a bell-shaped distribution during this experimental scenario. However, the graphical model suggests a lack of competition processes between pines and oaks. The model predicts that a facilitation-like process takes place across the life stages of these forest stands, where partitioning of resources between pines and oaks may explain their coexistence [55,56]. A few oaks (n < 200 ha−1) are left in the forest after long-term harvesting operations or natural forest disturbances or establish first because of their reproductive advantages leaving large forest openings. Pines, with a few exceptions, are shade intolerant and regenerate sexually via seed dispersal and establish well in these openings. Oaks may improve microhabitat conditions, making it possible for pines to establish successfully in open spaces in between oaks, although I had seen pines growing well beneath the canopy of large isolated oaks probably because the canopy does not interfere with sunlight entering the forest floor or perhaps because pine seedlings grow at the periphery of the canopy. Lafon et al. [57] recorded changes in the fertilization status of soils, given by the C:N ratio, which facilitated the establishment of pines under the canopy of oaks in east Tennessee. In some stands, pioneer pine species do not appear to establish well under the shade of oaks [58]. Oaks, on the other side establish well under the canopy of pines as secondary species of succession or in openings as pioneer species of succession [5].
Pioneer pine species quickly outgrow oaks in height because: (i) they are, in general, shade intolerant and grow in open spaces as well as in between the canopy of the few oaks (n < 200 trees ha−1) present in the stand; and (ii) pines grow quickly in height searching for full sunlight to reach a dominant position in the forest. Over time, pines outgrow oaks in DBH as well, and several oak trees of most species remain dominated during the life cycle across the altitude gradient in the eastern ridges of the Sierra Madre Occidental mountain range. However, in late successional stages, several oak species attain a dominant sociological position and share this place with dominant pine trees. Therefore, the differential displacement rate of pine and oak diameter distributions may be explained by their differential growth rates and symbiotic mechanisms rather than by inter-specific competition. Domínguez and Návar [59] supported this observation by demonstrated that by reducing 50% of stand basal area by harvesting oak trees did not improve the diameter growth of the remaining pine trees, even though pine trees were approximately 50 years-old. Therefore, resource partitioning may be playing an important role in these forests. For example, oaks and pines do not appear to compete for sunlight and it is likely they do not compete for nutrients and soil water either. That is, inter-specific competition is not as strong as it is intra-specific competition in these mixed and multiaged forests [60]. Differential timing in the usage of resources and, most likely, the exploitation of different soil compartments, could explain the potential lack of inter-specific competition. However, further research is required on the physiological or metabolic processes of both oaks and pines to better understand as well as to put into prospective the findings of this research on the mechanisms of tree coexistence in Mexico’s northern natural forests.

4. Conclusions

This research aimed at constructing a stand-class growth and yield model based on predicting and recovering the diameter distributions of pine and oaks growing in temperate forests of Durango, Mexico. Statistical relationships, together with the stand class growth and yield model, suggested pines and oaks appear to grow in a symbiotic-like ecological interaction. Although oaks appear first in the stand, they pose a slower diameter growth rate, which makes the diameter distributions lag behind the pine diameter structure. Thus, forest management plans must progress towards the development of this new stand-class growth modeling, as it incorporates the differential growth rhythms and establishment patterns of oaks and pines and allows to better managing these mixed multiaged coniferous forests. The long term scenario of these forests under conventional forest management practices using the proposed stand-class growth and yield modeling of pines and oaks would be to conserve tree diversity and structural complexity as they are in the present as well as to promote the dynamic natural balance of tree species diversity.

Conflicts of Interest

The author declares no conflict of interest.

References

  1. Food and Agriculture Organization (FAO), UN. State of the World Forests; Forestry Department: Rome, Italy, 2012. Available online: www.fao.org (accessed on 14 August 2014).
  2. Food and Agriculture Organization (FAO), UN. Global Forest Resource Assessments 2010; Forestry Department: Rome, Italy, 2010. Available online: www.fao.org (accessed on 15 August 2014).
  3. Vanclay, K.V. Modeling Forest Growth and Yield: Applications to Mixed Tropical Forests; CAB International: Wallingford, Oxon, UK, 1994; p. 312. [Google Scholar]
  4. Vanclay, J.K. Growth models for tropical forest: A synthesis of models and methods. For. Sci. 1995, 41, 7–42. [Google Scholar]
  5. Návar-Cháidez, J.; González-Elizondo, M.S. Diversidad, estructura y productividad de los bosques templados de Durango, México. Polibotanica 2009, 27, 71–87. [Google Scholar]
  6. Capri, C.A. Silvicultura Intensiva en Bosques Templados de México; División de Ciencias Forestales, Universidad Autónoma Chapingo: Texcoco, México, 1990. [Google Scholar]
  7. Aguirre-Bravo, C. Stand average and Diameter Distribution Growth and Yield Models for Natural Even-Aged Stands of Pinus cooperii. Ph.D. Thesis, Colorado State University, Fort Collins, CO, USA, 4 September 1987; p. 147. [Google Scholar]
  8. Zepeda, B.M.; Acosta, E.M. Incremento y rendimiento maderable de Pinus montezumae Lamb., en San Juan Tetla, Puebla. Madera Bosques 2000, 6, 15–27. [Google Scholar]
  9. Luna, G.; de Jesús, J. Técnicas de evaluación dasométrica y ecológica de los bosques de coníferas bajo manejo de la Sierra Madre Occidental del centro sur de Durango, México. Master Thesis, Universidad Autónoma de Nuevo León, Linares, NL, México, 2001. [Google Scholar]
  10. Ishi, H.T.; Tanabe, S.; Hiura, T. Exploring the relationship among canopy structure, stand productivity, and biodiversity of temperate forest ecosystems. For. Sci. 2004, 50, 342–355. [Google Scholar]
  11. Vilá, M.; Vayreda, J.; Comas, L.; Ibañez, J.J.; Mata, T.; Obón, B. Species richness and Wood production: A positive association in Mediterranean forests. Ecol. Lett. 2007, 10, 241–250. [Google Scholar] [CrossRef] [PubMed]
  12. Juárez, M.; Domínguez-Calleros, P.A.; Návar-Cháidez, J.J. Análisis de la estructura silvícola en bosques de la Sierra de San Carlos, Tamaulipas, Mexico. For. Veracruz. 2014, 16, 25–34. [Google Scholar]
  13. Stevens, M.H.H.; Carson, W.P. Plant density determines species richness along an experimental fertility gradient. Ecology 1999, 80, 455–465. [Google Scholar] [CrossRef]
  14. Hooper, D.U.; Vitousek, P.M. The effect of plant composition and diversity on ecosystem processes. Science 1997, 277, 1302–1305. [Google Scholar] [CrossRef]
  15. Peng, C.H. Growth and yield models for uneven-aged stands: Past present and future. For. Ecol. Manag. 2000, 132, 259–279. [Google Scholar] [CrossRef]
  16. Clutter, J.L.; Fortson, J.C.; Pienaar, L.V.; Brister, G.H.; Bailey, R.L. Timber Management: A Quantitative Approach; John Wiley and Sons: New York, NY, USA, 1983; pp. 3–29. [Google Scholar]
  17. Botkin, D.B.; Janak, J.F.; Wallis, J.R. Some ecological consequences of a computer model of forest growth. J. Ecol. 1972, 60, 849–872. [Google Scholar] [CrossRef]
  18. Moser, J.W. Specification of density for inverse j-shaped diameter distribution. For. Sci. 1976, 22, 177–180. [Google Scholar]
  19. Shugart, H.H. A Theory of Forest Dynamics; Springer Verlag: New York, NY, USA, 1984. [Google Scholar]
  20. Bailey, R.L.; Dell, T.R. Quantifying diameter distributions with the Weibull function. For. Sci. 1973, 19, 97–104. [Google Scholar]
  21. Zhou, B.; McTague, P.G. Comparison and evaluation of five methods of estimation of the Johnson systems parameters. Can. J. For. Res. 1996, 26, 928–935. [Google Scholar] [CrossRef]
  22. Cao, Q.V. Predicting parameters of a Weibull function for modeling diameter distribution. For. Sci. 2004, 50, 682–685. [Google Scholar]
  23. Parresol, B.; Fonseca, T.F.; Marques, C.P. Numerical Details and SAS Programs for Parameter Recovery of the SB Distribution; General Technical Report SRS-122; Asheville, N.C., Ed.; USA Department of Agriculture Forest Service, Southern Research Station: Asheville, NC, USA, 2010; p. 27. [Google Scholar]
  24. Haan, C.T. Statistical Methods in Hydrology; Iowa State Press: Ames, IA, USA, 2003; p. 378. [Google Scholar]
  25. Wingo, D.R. Maximum likelihood estimation of the parameters of the Weibull distribution by modified quasilinearization. IEEE Trans. Reliab. 1972, 2, 89–93. [Google Scholar] [CrossRef]
  26. Návar-Cháidez, J.J.; Contreras-Aviña, J. Ajuste de la distribución Weibull a las estructuras diametricas de rodales irregulares de pino de Durango, México. Agrociencia 2000, 34, 356–361. [Google Scholar]
  27. Parresol, B. Recovering parameters of Johnson’s SB distribution: A demonstration with loblolly pine. Can. J. For. Res. 2001, 31, 865–878. [Google Scholar] [CrossRef]
  28. Torres-Rojo, J.M. Predicción de distribuciones diamétricas multimodales a través de mezclas de distribuciones Weibull. Agrociencia 2005, 39, 211–220. [Google Scholar]
  29. Burke, T.E.; Newberry, J.D. A simple algorithm for moment based recovery of Weibull distribution parameters. For. Sci. 1984, 30, 329–332. [Google Scholar]
  30. Shiver, B.D. Sample size and estimation methods for the Weibull distribution for unthinned slash pine plantation diameter distributions. For. Sci. 1988, 34, 809–814. [Google Scholar]
  31. Lindsay, S.R.; Wood, G.R.; Woollons, R.C. Stand table modeling through the Weibull distribution and usage of skewness information. For. Ecol. Manag. 1996, 81, 19–23. [Google Scholar] [CrossRef]
  32. Zanakis, S.H. A simulation study of some simple estimators for the three parameter Weibull distribution. J. Stat. Comput. Simul. 1979, 9, 101–116. [Google Scholar] [CrossRef]
  33. Hyink, D.M.; Moser, J.W., Jr. A generalized framework for projecting forest yield and stand structure using diameter distributions. For Sci. 1983, 29, 85–95. [Google Scholar]
  34. Hynk, D.M. Diameter distribution approaches to growth and yield modeling. In Forecasting Forest Stand Dynamics; Brown, K.M., Clarke, F.R., Eds.; Lakehead University: Thunderbay, Ontario, Canada, 1980; pp. 138–163. [Google Scholar]
  35. Da Silva, J.A.A. Dynamics of Stand Structure in Fertilized Slash Pine Plantations. Ph.D. Thesis, University of Georgia, Athens, GA, USA, 1986; p. 139. [Google Scholar]
  36. Devore, J.L. Probability and Statistics for Engineers and the Sciences; Brooks/Cole Publishing Company: San Luis Obispo, CA, USA, 1987; p. 312. [Google Scholar]
  37. Návar-Cháidez, J.J. Estimaciones empíricas de parámetros de la distribución Weibull en bosques nativos del norte de México. Rev. For. Latinoam. 2009, 24, 51–68. [Google Scholar]
  38. Návar, J.; Jiménez, J.; Domínguez, P.A.; Aguirre, O.A.; Galvan, M.; Paez, M.A. Predicción del crecimiento de masas forestales irregulares en base a las distribuciones dimétricas en el sureste de Sinaloa, México. Investig. Agraría. Sis. Rec. For. 1996, 5, 214–229. [Google Scholar]
  39. Palahi, M.; Pukkala, T.; Trasobares, A. Modeling the diameter distribution of Pinus sylvestris, Pinus nigra and Pinus halepensis forest stands in Catalonia using the truncated Weibull function. Forestry 2006, 79, 553–562. [Google Scholar] [CrossRef]
  40. Corral-Rivas, S.; Návar-Cháidez, J.J. Comparación de técnicas de estimación de volumen fustal total para cinco especies de pino de Durango, México. RCHSCFA 2013, 15, 5–13. [Google Scholar]
  41. Merlin-Bermúdez, E.; Návar-Cháidez, J.J. Desarrollo de modelo de incremento y rendimiento para Quercus sideroxylla en bosques mixtos de Durango, México. Agrofaz 2005, 5, 875–882. [Google Scholar]
  42. Návar, J.J.; Rodríguez-Flores, F.J.; Domínguez-Calleros, P.A. Taper functions and merchantable timber for temperate forests of Northern Mexico. Ann. For. Res. 2013, 56, 165–178. [Google Scholar]
  43. Newnham, R.M. Variable-form taper functions for four Alberta trees. Can. J. For. Res. 1992, 22, 201–223. [Google Scholar] [CrossRef]
  44. Borders, B.E.; Patterson, T.W. Projecting stand tables—A comparison of the Weibull diameter distribution method, a percentile-based projection method, and a basal area growth projection method. For. Sci. 1992, 36, 413–424. [Google Scholar]
  45. Cao, Q.V.; Baldwin, V.C. A new algorithm for stand table projection models. For. Sci. 1999, 45, 506–511. [Google Scholar]
  46. Kangas, M.M.A.; Utera, J.; Tornianien, T.; Saramaki, J. Comparison of percentile based prediction methods and the Weibull distribution in describing the diameter distribution of heterogeneous Scots pine stands. For. Ecol. Manag. 2000, 133, 263–274. [Google Scholar] [CrossRef]
  47. Návar-Cháidez, J.J.; Domínguez-Calleros, P.A. Modelos de incremento y rendimiento: Ejemplos y aplicaciones para bisques templados Mexicanos. Rev. Mex. Cienc. For. 2013, 4, 8–26. [Google Scholar]
  48. Navarro-Cerrillo, R.; Manzanedo, R.; Bohorque, J.; Sánchez, J.; de Miguel, S.; Solano, D.; Qarro, M.; Griffith, D.; Palacios, G. Structure and spatio-temporal dynamics of cedar forests along a management gradient in Middle Atlas, Morocco. For. Ecol. Manag. 2013, 289, 341–353. [Google Scholar] [CrossRef]
  49. Laar, A.V.; Mosandl, R.; van Laar, A. Diameter distributions in young oak stands. Allg. For. Jagdzeitg. 1989, 160, 189–194. [Google Scholar]
  50. Nanang, D.M. Suitability of the normal, log-normal and Weibull distributions for fitting diameter distributions for neem plantations in northern Gahana. For. Ecol. Manag. 1998, 103, 1–7. [Google Scholar] [CrossRef]
  51. Knowe, S.A.; Harrington, T.B.; Shula, R.G. Incorporating the effects of interspecific competition and vegetation management treatments in diameter distribution models for Douglas fir saplings. Can. J. For. Res. 1992, 22, 1255–1262. [Google Scholar] [CrossRef]
  52. Newberry, J.D.; Moore, J.; Zhang, J.L.; Zhang, L. Evaluation of simple quantile estimation functions for modeling forest diameter distribution in even-aged stands of interior Douglas-fir. Can. J. For. Res. 1993, 23, 2376–2382. [Google Scholar] [CrossRef]
  53. Gove, J.H.; Patil, G.P. Modeling the basal area-size distribution of forest stands: A compatible approach. For. Sci. 1998, 44, 285–297. [Google Scholar]
  54. Márquez-Linares, M.A.; Alvarez-Zagoya, R. Construcción de una guía de densidad para Pinus cooperi var. Ornelasi con base en la clase de copa en Durango, Mexico. Madera y Bosques 1995, 1, 23–36. [Google Scholar]
  55. Callaway, R.M.; Walker, L.R. Competition and facilitation: A synthetic approach to interactions in plant communities. Ecology 1997, 78, 1958–1965. [Google Scholar] [CrossRef]
  56. Callaway, R.M. Competition and facilitation on elevation gradients in subalpine forests of the northern Rocky Mountains, USA. Oikos 1998, 82, 561–573. [Google Scholar] [CrossRef]
  57. Lafon, C.W.; Houston, M.A.; Horn, S.P. Effects of agricultural soil loss on forest succession rates and tree diversity in east Tennessee. Oikos 2000, 90, 431–441. [Google Scholar] [CrossRef]
  58. De Los Ríos, C.E. Facultad de Ciencias Forestales. Ph.D. Thesis, Universidad Nacional de Santiago del Estero, Linares, NL, México, 2001. [Google Scholar]
  59. Domínguez, P.A.; Návar, J. I Congreso Mexicano de Recursos Forestales; Sociedad Mexicana de Recursos Forestales: Saltillo, Coahuila, México, 1993. [Google Scholar]
  60. Návar, J.; Estrada, C.; Contreras, J.C.; Domínguez, P.A.; Muller-Using, B. Evaluation of the abundance, form of establishment, and the causes of variation of pine regeneration in coniferous stands of the western Sierra Madre of Durango, Mexico. Forstarchiv 2001, 72, 175–179. [Google Scholar]

