1. Introduction
Psocopterans comprise a major component of arthropod diversity on eastern hemlock,
Tsuga canadensis (L.) Carrière, occupying an important ecological role as major consumers of microepiphytes as well as an integral food source for predators [
1,
2]. Of the more than 300 species of Psocoptera described in North America [
2], 44 species have been documented on eastern hemlock, in the southern Appalachians [
3]. These arboreal species are commonly called “bark lice” and exhibit a variety of feeding habits, including microepiphytic grazing, scavenging, and detritus feeding. Population densities of arboreal psocopterans can be extremely high. For example, densities of Psocoptera on the bark of European larch,
i.e.,
Larix decidua Mill., have been reported at >4,000/m2, which Thornton [
1] equates to >6,000/m2 of land surface. Trees provide a complex of habitats within their canopies with an array of differing biotic and abiotic conditions resulting from the amount of live foliage, dead foliage, and open bark surfaces in which certain species of Psocoptera are associated. Mockford [
2] and García Aldrete [
4] reported that these habitat types can often be related to specific taxonomic groups.
Vertical stratification of arthropod assemblages noted in other studies [
5,
6,
7,
8,
9], can be attributed to determinates, such as abiotic factors, tree architecture, resource availability, arthropod behavior, and competition [
9]. Abiotic factors, such as light, air temperature, relative humidity, and water condensation, vary throughout the dense canopy of eastern hemlock. Tree architecture, such as needles, cones, branches, new growth, surface trunk area, and surface branch area, also has an influence on resource availability and may impact how species forage on eastern hemlock [
9]. The vertical distribution of spiders has been examined in eastern hemlock [
10], but has not been determined for other arthropods prior to this study. From visual observation of each stratum in eastern hemlocks, it appears that more mosses, vascular epiphytes, and debris are located in the lower stratum, while more crustose lichens appear to be located in the upper stratum, indicating a difference in the resources present within different strata. However, it is unknown how Psocoptera disperse within the canopy of eastern hemlock and if the distribution is indicative of a competitively structured community or a random community assemblage. Additionally, tree architecture and resource availability in eastern hemlocks have the potential to be altered directly and indirectly by insect pests, such as the hemlock woolly adelgid,
Adelges tsugae Annand (Homoptera: Adelgidae). Such exotics may reduce the amount of live foliage available and alter abiotic factors within the canopy, potentially impacting those species with specific habitat associations.
Populations of eastern hemlock have been dramatically reduced by the hemlock woolly adelgid, an exotic insect species. Eastern hemlock is a keystone species and is a vital component of biological diversity contributing to the economical and environmental stability of forests, within its geographic range. Rapid declines of eastern hemlocks stimulate changes in forest structure and composition [
11] resulting in altered arthropod food webs [
12]. The high diversity and abundance of psocopterans found in association with eastern hemlock [
3] serve as a major component of the food web associated with eastern hemlock in the southern Appalachians. As such, it is imperative to gain a better understanding of the distribution of these species throughout the canopy and their co-occurrence patterns prior to direct and indirect effects to hemlock systems due to the invasion by the hemlock woolly adelgid. The objectives of this study were to evaluate specimen abundance, species richness, species richness estimates, and species composition among three designated strata in the canopy of eastern hemlock, assess species for vertical stratification patterns, and determine if co-occurrence patterns of Psocoptera species are random or non-random.
2. Materials and Methods
2.1. Study Sites and Experimental Design
Eastern hemlocks (n = 6) were selected on 5 November 2005 at Indian Boundary within the Cherokee National Forest located in Monroe County in southeastern Tennessee (35°23.787N, 84°06.662W, elevation: 543 m). This study was arranged in a completely randomized one factor (stratum) design with six replicates. Two trees were established at each of the following locations: 35°23.787N, 84°06.662W, elevation: 543 m; 35°23.764N, 84°06.732W, elevation: 555 m; and 35°04.173N, 84°06.268W, elevation: 565 m. Tree characteristics (height, transparency, density, crown class, diameter breast height [dbh], foliage color, overall appearance, crown condition, and percent of the tree infested with hemlock woolly adelgid (based on number of branches infested)) were documented on 25–26 November 2005. Trees were selected based on how close any six trees matched in measured tree characteristics. Each tree was marked with a numbered metal tag. Trees heights ranged from 14–18 m. All six trees were located in a shortleaf pine–oak (type 76) forest [
13].
2.2. Sampling
To examine spatial differences in specimen abundance and species composition, each tree was divided into: lower, middle, and upper regions with each stratum representing ca. 1/3 of the total tree height. Because of the diversity of feeding habits and mobility among those species of Psocoptera associated with eastern hemlock, four sampling methods were used to capture a wide range of psocopteran species at each stratum on each tree in August 2006, September 2007, and June 2008, using an articulating boom (Genie Z 45/22, Tigard, OR). Specimens were collected using direct sampling (beat sheet, branch clipping, handpicking, and trunk vacuuming). Beat-sheet samples (four per tree) were taken at each cardinal direction by striking each branch five times with a one-meter stick allowing specimens to fall onto a meter cloth. Branch clippings 24 cm in length (4 branches per tree) were taken at each cardinal direction. Handpicking specimens involved visual observations, conducted on each tree for five minutes per stratum on each tree, with all observed psocopterans collected. Trunk vacuuming occurred on 61 cm of the circumference of the trunk.
2.3. Preserving and Identifying Specimens
Specimens collected from direct sampling were placed in pre-labeled vials (date, tree number, cardinal direction, stratum, and collecting method) containing 75% alcohol (6 dram). All specimens collected were sorted to family, genus, and species. For each taxon, insect specimens were sorted into 4 dram vials filled with 75% alcohol and labeled. Specimens were identified using standard keys. Voucher specimens were organized into Cornell drawers and incorporated into the University of Tennessee’s insect collection.
2.4. Data Analysis
Data (collection date, collection method, tree number, stratum, order, family, genus, species, author, number of specimens, and guild) were entered into an Excel® spreadsheet. Samples were pooled across all collection methods and dates for each stratum for specimen abundance and species richness analysis. Shapiro-Wilks W test for normality and Levene’s test of homogeneity of variances were used to verify that specimen abundance and species richness data conformed to the assumptions of analysis of variance (ANOVA). The assumptions of normality and homogeneity of variances were met. Differences in specimen abundance (number of specimens) and species richness (number of species) were analyzed using ANOVA and least significant differences (LSD) procedures in SAS [
14]. The number of Psocoptera species for each stratum was estimated using the Chao1 estimator using the software EstimateS 5.0.1 [
15]. The Chao 1 estimator was selected because, when compared with other estimators, it trends toward intermediate species richness estimates. Differences in species composition among strata were determined using analysis of similarity (ANOSIM) on Bray-Curtis distances constructed in a resemblance matrix using PRIMER version 6 software [
16]. Samples were pooled across collection method for each stratum and collection date. Differences in composition were illustrated using two-dimensional nonmetric multidimensional scaling (NMDS). Using the stress levels obtained by fitting the dissimilarities to the Bray-Curtis distance, a two-dimensional NMDS was chosen as the best representation (stress = 0.01) of the dissimilarities of community composition among strata.
To assess random and non-random co-occurrence patterns, a null model was established that species co-occur across each stratum randomly. Data were organized into a presence-absence matrix and imported into ECOSIM 7.0 [
17]. A fixed-fixed null model algorithm was used so totals were retained in the simulation with 5,000 iterations. A fixed-fixed model algorithm was chosen so differences in the frequency of occurrence of each psocopteran species (row sums) and differences in the number of psocopteran species per tree stratum are preserved. Additionally, this algorithm is less prone to type I errors and has good power for detecting non-randomness. The Stone and Roberts’ [
18] C-score index was used to quantify co-occurrence because of its minimal chance of Type I and Type II errors relative to other indices [
19]. The C-score index is a measure of the proportion of species pairs that do not co-occur among a group of communities [
20].
3. Results
3.1. Species Diversity, Abundance, and Richness
During this study, 942 psocopteran specimens were collected and identified, representing 27 species, 18 genera, and 10 families (
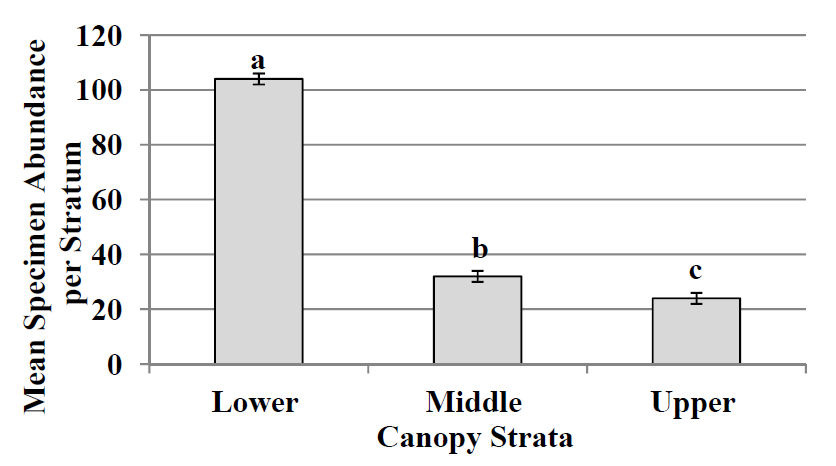
Table 1). Of the 942 specimens collected, 605 specimens were collected from the lower stratum representing 6 families, 11 genera, and 17 species. In the middle stratum 179 specimens were collected representing 4 families, 8 genera, and 8 species. In the upper stratum 158 specimens were collected representing 6 families, 6 genera, and 6 species. Specimen abundance was significantly different (LSD test;
p Figure 1). Specimen abundance was significantly higher (LSD test;
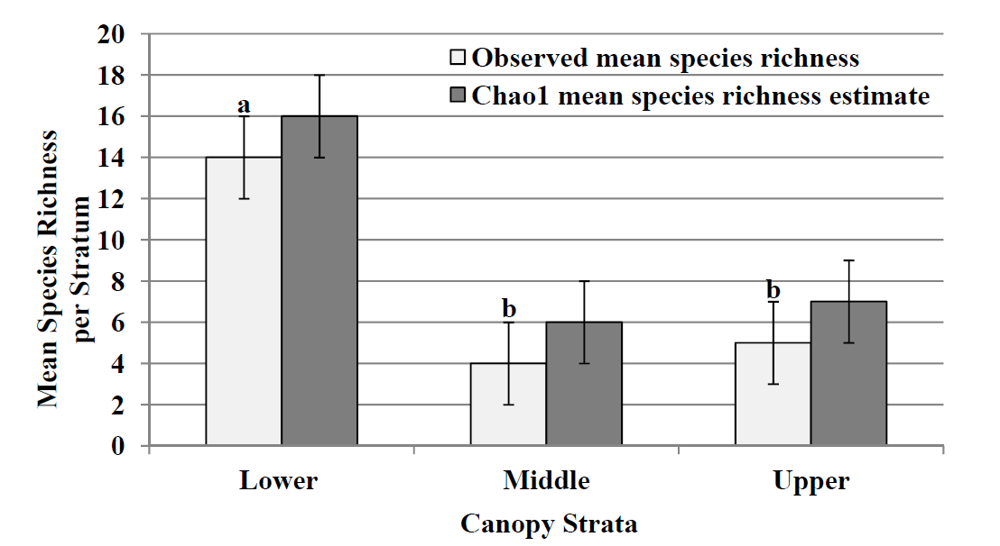
pp p Figure 2). Species richness in the middle and upper strata were not significantly different (LSD test;
p > 0.05). Chao1 species richness estimates (
Figure 2) for each stratum infer that the lower stratum had the highest mean estimate of species richness (n = 16) followed by the upper stratum (n = 7) and the middle stratum (n = 6), which coincides with the observed mean species richness.
Table 1.
Vertically sampledPsocoptera species associated with eastern hemlock in the southern Appalachians and corresponding collection methods.
Table 1.
Vertically sampledPsocoptera species associated with eastern hemlock in the southern Appalachians and corresponding collection methods.
| Family | Genus | Species | Author | Collecting method * | No. specimens |
|---|
| * B, Beat Sheet; BC, Branch Clipping; H, Hand Pick; T, Trunk Vacuum. |
| Caeciliusidae | Valenzuela | flavidus | (Stevens) | B, BC, H | 63 |
| Caeciliusidae | Valenzuela | pinicola | (Banks) | B, H | 57 |
| Caeciliusidae | Xanthocaecilius | sommermanae | (Mockford) | B, H | 23 |
| Ectopsocidae | Ectopsocopsis | cryptomeriae | (Enderlein) | B, BC, H | 29 |
| Ectopsocidae | Ectopsocus | meridionalis | Ribaga | B, H | 12 |
| Dasydemellidae | Teliapsocus | conterminus | (Walsh) | B, T | 33 |
| Lachesillidae | Lachesilla | contraforcepeta | Chapman | B, BC, H | 22 |
| Lachesillidae | Lachesilla | rufa | (Walsh) | B, BC, H | 15 |
| Lepidopsocidae | Echmepteryx | hageni | (Packard) | T | 31 |
| Myopsocidae | Lichenomima | sp. | | H, T | 34 |
| Peripsocidae | Peripsocus | alboguttatus | (Dalman) | H, T | 19 |
| Peripsocidae | Peripsocus | maculosus | Mockford | H, T | 26 |
| Peripsocidae | Peripsocus | madidus | (Hagen) | H, T | 28 |
| Peripsocidae | Peripsocus | subfasciatus | (Rambur) | H, T, | 14 |
| Philotarsidae | Aaroniella | maculosa | (Aaron) | B, H, T | 57 |
| Psocidae | Blaste | opposita | (Banks) | B, H, T | 52 |
| Psocidae | Blaste | quieta | (Hagen) | H, T | 63 |
| Psocidae | Blastopsocus | lithinus | (Chapman) | B, H, T | 27 |
| Psocidae | Cerastipsocus | venosus | (Burmeister) | B, H, T | 96 |
| Psocidae | Metylophorus | novaescotiae | (Walker) | H, T | 71 |
| Psocidae | Metylophorus | purus | (Walsh) | B, BC, T | 39 |
| Psocidae | Psocus | leidyi | Aaron | B, H, T | 27 |
| Psocidae | Ptycta | polluta | (Walsh) | B, H, T | 24 |
| Psocidae | Trichadenotecnum | alexanderae | Sommerman | B, H, T | 17 |
| Psocidae | Trichadenotecnum | castum | Betz | B, BC, T | 18 |
| Psocidae | Trichadenotecnum | quaesitum | (Chapman) | B, H, T | 26 |
| Stenopsocidae | Graphopsocus | cruciatus | (L.) | B, H, T | 19 |
Figure 1.
Mean specimen abundance (mean number of individuals ± SE) for each stratum. Different lower case letters above standard error bar indicate differences among strata (LSD test; p > 0.05).
Figure 1.
Mean specimen abundance (mean number of individuals ± SE) for each stratum. Different lower case letters above standard error bar indicate differences among strata (LSD test; p > 0.05).
Figure 2.
Observed mean species richness (mean number of species ± SE) for each stratum and Chao1 mean (±95% CL) species richness estimate. Different lower case letters above standard error bar indicate differences among strata (LSD test; p > 0.05).
Figure 2.
Observed mean species richness (mean number of species ± SE) for each stratum and Chao1 mean (±95% CL) species richness estimate. Different lower case letters above standard error bar indicate differences among strata (LSD test; p > 0.05).
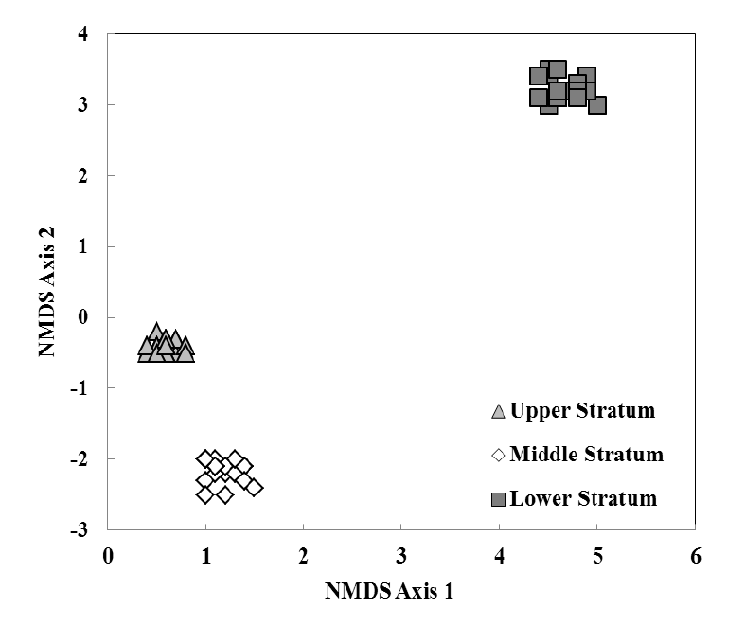
3.2. Species Composition, Vertical Stratification, and Co-Occurrence Pattern
Psocopteran species composition among strata had a high degree of dissimilarity (ANOSIM R = 0.981, n = 18, p Figure 3) resulting in unique identifiable assemblages within each stratum of the tree.The upper stratum had five unique species (species only found in a respective stratum): Teliapsocus conterminus (Walsh), Lichenomima sp., Blastopsocus lithinus (Chapman), Trichadenotecnum quaesitum (Chapman), and Graphopsocus cruciatus (L.). Echmepteryx hageni (Packard)was the only species found in both upper and middle strata. The middle stratum had four unique species: Metylophorus purus (Walsh),Psocus leidyi Aaron, Ptycta polluta (Walsh),andTrichadenotecnum alexanderae Sommerman. Ectopsocopsis cryptomeriae (Enderlein),Aaroniella maculosa (Aaron), andBlaste opposita (Banks) were found in both the middle and lower strata.The lower stratum had 14 unique species: Valenzuela flavidus (Stevens), Valenzuela pinicola (Banks), Xanthocaecilius sommermanae (Mockford), Ectopsocus meridionalis Ribaga, Lachesilla contraforcepeta Chapman, Lachesilla rufa (Walsh), Peripsocus alboguttatus (Dalman), Peripsocus maculosus Mockford, Peripsocus madidus (Hagen), Peripsocus subfasciatus (Rambur), Blaste quieta (Hagen), Cerastipsocusvenosus (Burmeister), Metylophorus novaescotiae (Walker), and Trichadenotecnum castum Betz. No species were found to occupy all three strata.
Figure 3.
Non-metric multidimensional scaling (NMDS) ordination of six eastern hemlock trees sampled three times based on specimen abundance and Bray-Curtis similarities. Each individual point (n = 18) represents a stratum within a host tree sampled at one sampling time. Distance between points represents the degree of dissimilarity in species composition, i.e., the further the distance, the more dissimilar the species composition.
The mean observed C-score (C-scoreobserved = 393.50) was significantly greater (
Pobs > exp = 0.0001) than the mean of the randomly simulated index (C-scoreexpected = 328.11). These higher observed C-scores indicate less co-occurrence than expected by chance, thus, suggesting a non-random competitively structured community [
19]. The probability that the mean observed C-score would be significantly lower than the mean of the randomly simulated index was not significant (
Pobs
4. Discussion
In this study, the lower stratum had the highest diversity and specimen abundance, followed by the middle and upper strata. This pattern of diversity may indicate a broader range of habitats and resource availability in the lower stratum compared with those in the middle and upper strata. The stratified species present in this study have a variety of habitat associations that coincide with specific habitat availability within different strata in the canopies. Species belonging to the families Psocidae, Myopsocidae, Peripsocidae, and Philotarsidae are usually found in association with open bark habitats [
2,
3]. Species in these families were almost exclusively found in the middle and/or lower stratum, where the majority of open bark surfaces were encountered, with the exception of a single species belonging to the family Myopsocidae found exclusively in the upper stratum. Psocoptera species in the family Caeciliidae are highly associated with living foliage [
2,
3] and are found almost exclusively on live branches within the lower stratum of the tree. Species belonging to the families Lachesillidae and Ectopsocidae are usually found in association with dead foliage. Lachesillids and Ectopsocids were found exclusively in the lower stratum where dead foliage accumulates among the live branches. While the non-random co-occurrence patterns found in this study infer competitive interactions, it is important to note that non-random structure can also be attributed to other mechanisms, such as species-environment relations, non-random spatial processes, non-overlapping habitats or niches, and historical effects [
19,
21,
22]. Non-random spatial processes within the canopy of eastern hemlock may dictate resource distribution, and thus influence how species distribute throughout the canopy.

