Abstract
Leaf litter conservation practices in forests can contribute to increasing CO2 storage in natural soils as organic matter; however, this process depends on the type of vegetation cover. This study, using different approaches, aimed to assess this process starting from the characteristics of three different types of litters and topsoil (0–5 cm depth) originating from chestnut, beech, and pine in various forest locations within the territory of Edolo (Camonica Valley, Central Italian Alps). Both labile (DOM) and recalcitrant (ROM) organic matter fractions were considered. Microbial degradation activity was strongly influenced by DOM (DOM vs. Respiration mg CO2 g−1 dry matter: r = 0.96), and NMR spectroscopy showed that aromatic C and polymethylene C in long-chain aliphatic structures (e.g., lipids, cutin) became more evident from litters to topsoils due to a concentration effect. Finally, chemometric elaboration of quantitative and qualitative data identified two principal component (PC) profiles, explaining 88% of the total variance, in which litter and the topsoil samples were spatially separated, indicating that significant changes occurred during the decomposition process. An Evolution Index (EI) calculated highlighted greater changes for chestnut (0.90) followed by pine (0.60) and beech (0.48), in agreement with chemical (degradation rates of 14.21%, 49.11%, and 48% for beech, chestnut, and pine litter, respectively) and spectroscopic data. Beech litter appears to be more efficient at conserving organic carbon. These findings underscore the importance of understanding litter characteristics for forest management, suggesting which species are most effective in promoting soil carbon storage.
1. Introduction
Forest ecosystems play a fundamental role in the global carbon cycle, acting as one of the main carbon sinks and thereby contributing to the regulation of greenhouse gases in the atmosphere [1]. In addition to carbon sequestration, forests provide a wide range of ecosystem services, including biodiversity conservation, soil fertility maintenance, erosion control, and the regulation of pathogenic organisms [2].
In Europe, forests cover approximately 35% of the land area, comprising coniferous (46%), broadleaved (37%), and mixed species trees (17%) [3]. Their capacity to absorb atmospheric CO2 makes them essential for achieving the European Union’s climate neutrality objectives, and current forest policies increasingly promote reforestation and conservation actions aimed at enhancing soil carbon sequestration [4].
A large portion of the carbon sequestered by forest ecosystems is stored in the litter layer and soil organic matter [5]. Litter consists of organic debris on the forest floor, including fallen leaves and partially decomposed plant material. This layer is distinct from the underlying mineral soil [6] and is strongly influenced by the overlying vegetation [7].
Litter decomposition is a key process in terrestrial ecosystems, regulating nutrient availability, plant productivity, and the long-term dynamics of soil organic carbon (OC) stocks [6]. It is controlled by a complex interplay of climatic factors, litter quality, and the composition of the soil microbial community.
While temperature and moisture are traditionally considered the primary drivers of decomposition at broad spatial scales [8], a recent evidence synthesis has highlighted the overriding influence of litter quality in many contexts [9].
Microorganisms are the primary agents of litter degradation, and through their metabolic activity, they release carbon dioxide, contributing to the global carbon balance and influencing Earth system models [10].
The chemical composition of litter, particularly the balance between structural and non-structural components, plays a critical role in determining its degradability [11,12,13,14]. The degradability of litter is largely influenced by the plant species of origin. This variability is linked to differences in chemical composition, particularly in terms of the content and ratios of structural and non-structural components such as soluble sugars, cellulose, hemicellulose, lignin, polyphenols, and tannins [11,12,13,14]. These constituents, and in particular their relative proportions, influence both the rate of decomposition and the transformations of carbon and nitrogen mediated by the soil microbial community [15,16]. Lignin content, for example, may range from 4% to 50%, while cellulose varies between 10% and 50%, and hemicellulose-to-cellulose ratios typically range from 0.7 to 1.2, with higher values observed in deciduous litter and lower values in coniferous litter [16]. Given this variability, it is reasonable to expect that different forest types exert differential effects on organic carbon turnover and its stabilization in soils.
Although chemical analyses provide insights into litter degradability, respirometric methods offer a more direct and functionally relevant approach. By measuring CO2 emissions from decomposing organic matter under controlled conditions, these methods assess biological stability and the potential contribution of litter to carbon retention or loss in soil systems [17]. Among the components of soil organic matter, dissolved organic matter (DOM) is the most dynamic fraction. Its composition is strongly influenced by vegetation type and can modulate microbial metabolism, thereby affecting soil respiration and contributing to long-term carbon stabilization within the soil matrix [15].
Identifying tree species whose litter promotes soil organic carbon (OC) accumulation is increasingly important for sustainable forest management. Strategies aimed at enhancing OC storage and reducing carbon dioxide emissions should consider litter quality and its effects on microbial activity, carbon mineralization, and the formation of stable organic matter [18].
Forest soils are among the largest global reservoirs of OC, and understanding the mechanisms of OC conservation is essential for predicting carbon stock responses to climate change [19].
Despite the ecological relevance of these processes, litter decomposition dynamics in Alpine forest ecosystems remain poorly studied. Camonica Valley, located in northeastern Italy, is a typical Alpine region with extensive forest cover. Previous studies have estimated total forest carbon storage in the area, including living biomass, litter, and deadwood [20]. However, data on carbon mineralization and immobilization in the litter layer of this specific region are currently lacking.
In this context, this study investigates the decomposition of litter and associated topsoils from three forest types in Camonica Valley: chestnut, beech, and pine. Using a multidisciplinary approach, we aim to characterize litter quality and decomposition behavior under controlled conditions. The results will provide a scientific basis for selecting forest management strategies that promote soil carbon storage and support climate mitigation efforts tailored to the ecological conditions of Alpine environments.
2. Materials and Methods
2.1. Study Site
The sampling was carried out in various forest locations within the territory of Edolo (720 m a.s.l.), a small town situated in Camonica Valley, an Alpine valley located in the center-east of Northern Italy (Latitude N 46°06′, Longitude E 10°20′) (Figure 1).
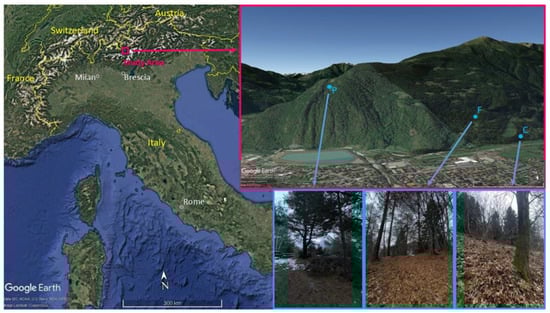
Figure 1.
Study area (in red), location and picture of Castanea sativa (C), Fagus sylvatica L. (F), and Pinus sylvestris (P) sampling sites. Source: Google Earth.
The study area is situated in the central-eastern sector of the Esalpic forest region, within geobotanical district no. 4—Alto Camuno, where humid air masses originating from Lake Iseo ascend Camonica Valley, influencing local ecological conditions. According to the meteorological records (Edolo meteorological station; ARPA Lombardia) during the period 1998–2023, temperature data show a minimum in winter (average temperature in January: 1.5 °C) and a maximum in summer (average temperature in July: 20.7 °C). The annual average temperature is 11.2 °C; while the mean annual precipitation is about 965 mm, concentrated mainly in spring and autumn. The study area is characterized by a Cfb climate type according to the Köppen–Geiger classification.
The bedrock consists mainly of Edolo schists. From a geopedological point of view, the study area is mainly characterized by the presence of Cambisols, Podzolic Cambisols, and Podzols (Basi informative dei suoli, 1:250,000; Regione Lombardia; https://www.geoportale.regione.lombardia.it/, accessed on 23 January 2025). The landscape is characterized by a mosaic of broadleaf and coniferous forests (Carta forestale; Regione Lombardia; https://www.geoportale.regione.lombardia.it/, accessed on 23 January 2025). The former mainly includes chestnut, beech, and oak, while the latter predominantly comprises spruce, larch Swiss stone pine, and Scots pine. Regarding the sampling areas, the one dominated by Castanea sativa also showed the presence of Ostrya carpinifolia, Fraxinus excelsior, and Prunus avium, accompanied by Crataegus monogyna and Corylus avellana. The area with Fagus sylvatica L. was an open deciduous forest also characterized by the presence of sparse shrubs and grassland species. Lastly, the area dominated by Pinus sylvestris also featured some specimens of Quercus petrae and Quercus pubescens.
Table 1 reports the main characteristics of the study sites (climate, altitude, soil classification).

Table 1.
Site description of the investigated litter and topsoil samples.
2.2. Litter and Topsoil Sampling
Samples of freshly fallen leaf litter and the underlying 5 cm of soil (topsoil) were collected in September 2022 from three different sites using a small shovel. Specifically, the six samples consisted of litter originating from chestnut (Castanea sativa, CL), beech (Fagus sylvatica L., FL), and Scots pine (Pinus sylvestris, PL), along with the corresponding topsoil samples identified as CS, FS, and PS (Table 1).
For each study site (25 m × 25 m), five sub-samples were collected and subsequently combined to obtain one composite sample per layer, providing approximately 1 kg per sample, for a total of six samples: three litters and three topsoils. All samples, both litter and topsoil, were collected and air-dried. Subsequently, the samples were milled to a particle size of 0.5 mm and prepared for analysis.
2.3. Standard Chemical Analyses of Litters and Topsoils
For CEC determination, soil samples were saturated with BaCl2-triethanolamine solution (pH 8.1) [21]. Water holding capacity (WHC) was determined using the Stackman box method [22], and texture was assessed by the pipette method [23].
Total Kjeldahl nitrogen (TKN) was quantified by Kjeldahl determination (BUCHI Labortechnik AG, Flawil, SG, Switzerland) on oven-dried samples, in accordance with standard analytical procedures for soil analysis [24]. Total organic carbon (TOC) content was determined using the dichromate method (Springer and Klee). For pH and electrical conductivity (EC) determination (PC 2700, Eutech Instruments, Thermo Fisher Scientific, Singapore), an aqueous solution was prepared using a 1:2.5 sample-to-water ratio [25]. Total phosphorus (P) was determined by inductively coupled plasma (ICP) mass spectrometry (Varian, Fort Collins, CA, USA), preceded by acid digestion of the samples [26]. For P quantification by ICP, a standard soil sample (National Institute of Standards and Technology, Gaithersburg, MD, USA) was analyzed alongside the study samples to ensure analytical precision. All analyses were performed in triplicate. All reagents were of analytical grade (CARLO ERBA Reagents S.r.l., Cornaredo, MI, Italy).
2.4. Respiration Determination of Litters and Topsoils
Soil respiration was monitored by measuring CO2 evolution using a modified titrimetric method [27]. Briefly, CO2 released by the samples (3–4 g), sealed in a glass pot, was trapped in 1 mol L−1 NaOH and titrated with 1 mol L−1 HCl, using phenolphthalein as an indicator after precipitation with 20% BaCl2. A humidity level equal to 60% of the water holding capacity was maintained throughout the test duration (161 days). The test was conducted in an incubator at 25 °C, in triplicate for each sample.
2.5. Dissolved Organic Matter (DOM) and Recalcitrant Organic Matter (ROM) Extraction and Determination from Litters and Topsoils
DOM and ROM were extracted from all samples after drying and milling to 0.2 mm. DOM from samples CL, FL, PL, CS, FS, and PS was extracted with distilled water using a solid-to-water ratio of 1:10 (w/v), on a dry matter basis, in a Dubnoff thermostatic bath (Cavallo Srl, Buccinasco, MI, Italy) at 80 oscillations per minute for 2 h at 25 °C. The suspension was then centrifuged at 10,000 rpm for 20 min (MPW-380, MPW MED. INSTRUMENTS, Warsaw, Poland), and the supernatant was filtered through a 0.45 μm membrane. ROM extraction was performed in a 250 mL Erlenmeyer flask with 0.1 N NaOH and 0.1 M Na4P2O7 under N2 atmosphere at 65 °C for 24 h, at 80 oscillations per minute in a Dubnoff thermostatic bath (Cavallo Srl, Buccinasco, MI, Italy). The samples were cooled at room temperature and centrifuged at 10,000 rpm for 20 min (MPW-380, MPW MED. INSTRUMENTS, Warsaw, Poland). This extract represents the so-called humic-like fraction. The organic carbon content in DOM and ROM extracts was determined using the dichromate method (Springer and Klee) on an aliquot of the extracted volume. The remaining DOM and ROM extracts were frozen at −80 °C and, subsequently, lyophilized (Steroglass S.r.l., San Martino in Campo, PG, Italy) for spectroscopic analyses.
2.6. Spectroscopic Characterization of Litters and Topsoils
Whole samples of CL, FL, PL, CS, FS, and PS were characterized using the solid-state Cross Polarization Magic Angle Spinning 13Carbon Nuclear Magnetic Resonance (CP MAS 13C NMR) technique. Spectra were acquired with a Bruker AV600 spectrometer (Bruker Biospin GmbH, Rheinstetten, Germany), using a 4 mm CP-MAS probe. Acquisition parameters included the following: pulse repetition 0.5 s; contact time 1 ms; line broadening of 100 for CL, FL, and PL, and 200 for CS, FS, and PS; number of scans 3200. The chemical shift scale used tetramethylsilane (δ = 0 ppm) as a reference. Spectra were divided into four regions: 0–47 ppm (C in straight chain, branched, and cyclic alkanes); 47–115 ppm (C in O-CH3 or N-alkyl-C or O-alkyl-C); 115–160 ppm (aromatic C); 160–210 ppm (C in carboxyl, carbonyl, amide, and ester groups) [28]. All NMR spectra were elaborated using TOPSPIN 1.3 software (Bruker BioSpin GmbH, Rheinstetten, Germany).
DOM and ROM (20 mg) extracted from CL, FL, PL, CS, FS, and PS were dissolved in 0.6 mL of D2O with a few µL of NaOD (pH = 12), vortexed, and centrifuged for 5 min at 10,000 rpm. 1H NMR spectra were acquired using the same equipment reported above, equipped with a z-gradient triple resonance TXI probe, at 25 °C with solvent suppression using “noesypr1d” sequence (Bruker library), and 1024 number of scans. 1H NMR spectra were divided into three regions: 0.6–2.9 ppm (H in straight chain, branched, and cyclic alkanes, CH3COOR); 2.9–6.2 ppm (H in O-CH3 or N-alkyl-H or O-alkyl-H); 6.2–9.0 ppm (aromatic and olefinic H). The relative proportion of different components in all samples was calculated by integration, after subtracting the integral area of the solvent peak. All the NMR spectra were elaborated by using TOPSPIN 1.3 software (Bruker BioSpin GmbH, Rheinstetten, Germany).
2.7. Statistical Analysis
Statistical comparisons between soil and topsoil samples were performed using one-way ANOVA, followed by Tukey’s post hoc test. Prior to conducting ANOVA, the Shapiro–Wilk test was applied to assess data normality, and Levene’s test was used to verify the homogeneity of variances. All statistical analyses were carried out using SPSS software (ver. 25, Chicago, IL, USA).
2.8. Calculation of the Evolution Index (EI)
Analytical data were used to perform the Principal Component Analysis (PCA) to compare the similarity between litters (L) and topsoils (S). The methodology was applied to L and S samples from all vegetal covers (F, C, P), using all available qualitative and quantitative data (thesis: ALL DATA). The data were auto-scaled before elaboration; only principal components (PC1 and PC2) with eigenvalues >1 were retained for the successive discussion [29,30,31]. Moreover, the estimation of the evolution from L to S (Evolution Index—EI) was attempted using a sub-dataset composed of organic matter (OM), and its recalcitrant and dissolved fractions (ROM and DOM, respectively) (SI, Table S2). Based on the PCA results, the differences between the coordinates (COO) on PC1 and PC2 of L and S for F, C, and P were calculated. Indeed, the values were weighed using the loading value (LV) of PC1 and PC2 as a multiplier factor (SI, Table S2) [32].
Finally, the EI was calculated as follows:
EI = (0.01∗ LVPC1∗|COOLPC1 − COOSPC1|) + (0.01∗ LVPC2∗|COOLPC2 − COOSPC2|)
All statistical analyses were carried out using SPSS software (ver. 25, Chicago, IL, USA).
3. Results and Discussion
3.1. Chemical Characteristics of Main Litters and Topsoils
Table 2 and Table 3 report the main chemical and physical characteristics of the samples studied. According to the literature [6], topsoil may differ from the litter layer; however, these differences tend to diminish in the intermediate layer, which consists of still recognizable plant residues and is primarily composed of amorphous organic matter.
Table 2.
Chemical characteristics of the topsoils and the litters used in the experiment.
Table 3.
Main physical characteristics of the topsoils studied.
EC was higher in the litter than in the corresponding topsoil (Table 2) probably because the soil texture (sandy/loamy) facilitated salt leaching derived from litter degradation [33]. Water holding capacity (WHC) differed among the three topsoils considered (Table 3), and the values were well correlated with the silt percentage (WHC vs. Silt %: r = 0.93; p < 0.05; n = 3). Furthermore, considering the degradation rate of the three different litter types, as discussed later, the data suggest that, in general [8] and in analogous contexts (temperate Alpine zones) [34], soil moisture may represent a key factor influencing litter decomposition. In fact, WHC and degradation rate showed a high correlation (r = 0.82; p < 0.05; n = 3).
The lower pH values observed in CL (4.72) and its associated topsoil (4.41) may indicate a higher presence of organic acids. Although these acids were not directly measured, their accumulation remains a plausible hypothesis, potentially linked to increased microbial activity. This assumption is supported by previous findings showing that low molecular weight organic acids (LMWOAs), such as citric, oxalic, and malic acids, commonly predominate in the upper soil layers of forest ecosystems and originate mainly from plant residues, root exudates, and microbial metabolites [35]. This interpretation is supported by the respiration test results presented below (Figure 2), which confirm enhanced microbial activity in these samples. PL, the only gymnosperm considered in this study, showed higher acidity than the underlying soil.
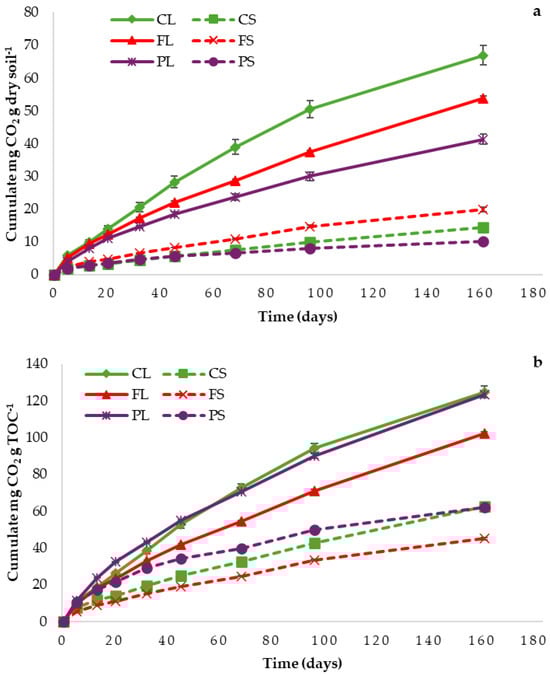
Figure 2.
Respiration trend for litters and topsoils: (a) data expressed on the bases of dry soil; (b) data expressed on the bases of litter/topsoil organic carbon content.
This pattern aligns with its chemical composition, rich in aliphatic and resin acids, and/or α-pinene and β-pinene, which are easily oxidized into carboxylic (-COOH) groups and can influence microbial and enzymatic activity [36,37,38]. TOC values decreased from litter to soil, with degradation rates of 14.21%, 49.11%, and 48% for FL, CL, and PL, respectively (Table 2). This trend reflects biological degradation processes. DOM content, although lower in soils, remained relatively stable as a percentage of TOC (average 3.25 ± 0.77%) (Table 4). This is likely due to ongoing microbial activity, which, through the degradation of organic matter, establishes a dynamic balance between the production of water-soluble carbon compounds (DOM) and their subsequent mineralization to carbon dioxide.
Table 4.
Organic carbon fractionation in soils and litters.
In contrast, except for FL and FS, which showed the same proportion of ROM relative to TOC, CL and PL, and their corresponding soils, had a higher percentage of recalcitrant organic matter in the soil. This suggests a faster degradation rate, leading to the accumulation of more resistant organic compounds [39]. These data agree with the previously reported degradation coefficients.
TKN values were higher in topsoils than in litters, likely due to carbon loss during decomposition (“concentration effect”). PL had the lowest nitrogen content (5.70 ± 0.19 g kg−1), while FL and CL showed higher and similar values (10.3 ± 1.2 and 9.53 ± 0.28 g kg−1, respectively; Table 2). These differences are relevant for understanding microbial activity, as nitrogen availability is a known limiting factor [6].
3.2. Respiration Measurement of Litters and Topsoils
As shown in Table S1 and Figure 2, the litter samples exhibited higher respiratory activity than their corresponding topsoils. This pattern reflects their higher total carbon content and a greater proportion of labile organic matter, which supports more intense microbial respiration. Among the samples, CL showed the highest respiration rates, consistent with its lower pH (accumulation of organic acids) and higher degradation rate [6]. PL and PS exhibited the lowest respiration activity, while FL and FS showed intermediate values. These findings align with the degradation rates and TOC values previously reported.
To establish a relationship between the chemical characteristics of the samples (Table 2) and their respiration activity (Table S1), various correlations were analyzed. A strong positive correlation was observed between TOC and respiration (TOC vs. Respiration mg CO2 g−1 dry matter: r = 0.84; p < 0.05; n = 6), indicating that microbial activity is closely linked to organic carbon content. An even stronger correlation was found between DOM and respiration (DOM vs. Respiration, mg CO2 g−1 dry matter: r = 0.96; p < 0.05; n = 6), highlighting the importance of labile carbon fractions in driving microbial processes [6].
This finding is supported by a study investigating the potential impact of soil DOM on soil respiration [40]. The authors, examining the electron transfer capacity of DOM in both agricultural and forest soils, found that DOM from forest soils exhibited a higher electron transfer capacity, facilitating electron transfer processes involved in soil respiration. These results have important implications for improving our understanding of the mechanisms underlying soil carbon sequestration.
When respiration was normalized to TOC (Table S1; Figure 2b), the results mirrored the degradation rates (Degradation (%) vs. Respiration, mg CO2 g−1 TOC: r = 0.99; p < 0.05; n = 3), with CL and PL exhibiting higher values and FL the lowest.
Respiration data, observed and expressed as mg CO2 g−1 TOC, agree with previous assessments of ex situ respiration measurements in temperate forest soils [41]. Although the high degradability rate of PL might initially appear anomalous, given the well-known high concentrations of lignins, waxes, resins, and tannins in pine needles, this result is supported by a previous study [42]. In that study, which investigated the decomposition of pine litter under similar environmental conditions (Italian Alps), not only were the degradation values comparable (53% in that study and 48% in our case), but it was also highlighted that soil microorganisms are likely forced to adapt their metabolism to the compounds present in the litter substrate. This supports the interpretation that differences in litter quality influence microbial respiration and carbon turnover.
3.3. Spectroscopic Characteristics of Litters and Topsoils
Spectroscopic analysis (Table 5, Figure S1) revealed consistent chemical signatures across all samples [28]. The region between 47 and 115 ppm, associated with alkyl carbon (ethers, alcohols, acetals) and carbohydrates (starch and cellulose), was dominant in all spectra, reflecting the typical composition of plant biomass. Signals at 72–74 ppm, attributed to O-alkyl-C atoms at positions C-2, C-3, and C-5 in polysaccharides, confirmed the presence of cellulose and hemicellulose. Additional peaks at 56 (methoxyl C and amino groups in lignin/proteins), 65 (C5 in xylan of polysaccharides), and 105 ppm (C2/C6 in syringyl units of lignin) indicated the presence of lignin and polysaccharide components. The shoulder at 89 ppm, attributed to non-crystalline cellulose, was detected only in litter samples, suggesting its preferential degradation during early decomposition stages.
Table 5.
Relative proportion (%) of C-containing functional groups obtained by 13C NMR analysis.
The 0–47 ppm region, indicative of aliphatic compounds such as lipids, cutin, and proteins, was present in all samples. The disappearance of the 21 ppm signal (CH3 in acetyl groups of lipids and hemicellulose) from litter to soil, and the increased intensity at 30 ppm (polymethylene C in long-chain aliphatics, e.g., lipids, cutin), suggest selective preservation of recalcitrant compounds during decomposition. These molecules, known for their structural role in plant tissues, contribute to the persistence of organic matter in soils [39]. The accumulation of such compounds, especially cutin, has also been documented in a previous study [43] investigating the decomposition dynamics of beech and pine litter.
A significant correlation was found between aliphatic and carboxyl carbon regions (aliphatic C vs. carboxyl C: r = 0.86; p < 0.05; n = 6), as the chemical shift at 172 ppm is indicative of carboxyl C in esters and amides, as well as in aliphatic acids [28]. Aromatic carbon (115–160 ppm), representative of lignin, increased in topsoils and was significantly correlated with TKN (Table 2) (aromatic C vs. TKN: r = 0.82; p < 0.05; n = 6), reinforcing the relevance of the lignin-to-nitrogen ratio as an indicator of decomposition stage [6]. This finding is consistent with the results of a previous study [43], which showed that an increase in lignin is a common result during litter decomposition processes.
1H NMR analysis was used to assess the composition of DOM and ROM fractions extracted from litter and topsoil samples (Table 6; Figures S2 and S3). DOM spectra (Figure S2) were generally similar across samples, except for PL, FL, and CL (both litter and soil), which showed sharp signals, indicating low molecular weight compounds, while PL exhibited broader signals, consistent with higher molecular weight aggregates.
Table 6.
Relative proportion (%) of ROM and DOM components as determined by 1H NMR analysis.
Carbohydrates dominated the DOM fractions (70–84%), except in PL (57%), which showed a higher proportion of aliphatic compounds (e.g., amino and fatty acids). Aromatic compounds (e.g., amino and fatty acids) were not detected, likely due to their low water solubility. FL and PL exhibited lower carbohydrate content in DOM compared to their respective soils (Table 6), possibly due to microbial degradation in surface layers. ROM spectra (Figure S3) were broadly consistent, with signals at 8.44 and 1.91 ppm corresponding to formate and acetate. PL and PS differed from other samples, showing lower carbohydrate content (28% and 33%) and higher aliphatic content, in line with the low respiration rate observed for PS (Figure 2a; Table S1). These aliphatic compounds, including cutin, suberin, and lipids, are known to resist microbial degradation. In PL, the predominance of aliphatic signals reflects its species-specific chemical traits.
These findings reinforce the patterns observed in the chemical and biological analyses. The NMR data confirm that differences in litter composition, particularly in PL, are reflected in the molecular characteristics of both DOM and ROM fractions [36,37]. The higher aliphatic content and lower carbohydrate proportion in PL and PS are consistent with their lower microbial activity and respiration rates [38]. Overall, the integration of spectroscopic and biochemical data provides a coherent understanding of how litter type influences organic matter composition and microbial dynamics in forest soils [9].
The previous discussion highlighted how several aspects, often in contrast, are involved in the evolution of organic matter from litter to soil. To synthetically identify the main drivers of this process, Principal Component Analysis (PCA) was performed. The first PCA application considered all samples and all available qualitative and quantitative data (SI). The results obtained were summarized by two significant PCs (eigenvalue > 1). Based on all indicators of qualitative and quantitative composition of organic matter, PCA yielded two components (PC1 and PC2) that captured 88% of the information contained in the original (Figure 3).
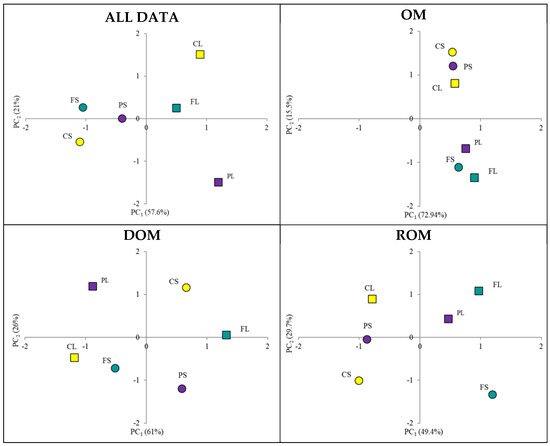
Figure 3.
Distribution of the samples in the space defined by the PC1 and PC2 obtained considering all, OM, DOM, and ROM analytical data.
By plotting the samples in the PC1–PC2 space, litters and topsoils were spatially separated along PC1 but not as clearly along PC2. This result showed that effectively the litters were more similar to each other than to their corresponding topsoils, indicating that significant changes occurred during the transition from litter to soil.
Using the Euclidean distance as a unit of measurement, the greatest difference was observed for chestnut (C), followed by pine (P) and beech (F). Each PC represents a synthetic expression of the indicators that correlate strongly with it (Figure 3). When parameters are meaningfully separated across PCs, each component can be interpreted as representing specific properties of the samples. However, in this case, the analysis of indicators vs. PCs did not allow attribution to specific aspects related to organic matter evolution or its fractions. To further investigate, the same approach was applied to three sub-datasets containing the qualitative and quantitative data of total organic matter, ROM, and DOM. This new elaboration confirmed the existence of differences between litter and topsoil across all organic matter fractions, with varying degrees depending on the fraction considered. Moreover, the correlation between parameters and PCs showed a clear distribution: qualitative parameters were associated with PC1, and quantitative ones with PC2. This distinction is useful for evaluating the influence of qualitative traits (expressed by the coordinate on PC1) and quantitative traits (expressed by the coordinate on PC2) (Figure 3). To estimate the evolution from litter to topsoil, the differences between the coordinates on PC1 and PC2 for each litter/topsoil pair were calculated (Table 7) and successively scaled by using the weight of PC as a multiplier factor [32].
Table 7.
Evolution Index of C, P, and F calculated from PCA data.
Finally, the sum of the two coordinates was used to calculate the Evolution Index (EI). The use of this index highlighted greater changes for chestnut (C), followed by pine (P) and beech (F), when considering total organic matter and its fractions. In the case of total organic matter, the result was primarily due to qualitative changes rather than quantitative ones. This finding agrees with the spectroscopic data (13C CP MAS NMR, Table 5), which showed the largest differences in the relative proportions (%) of C-containing functional groups in the following order: C > P > F, from litter to corresponding topsoil samples. These data confirm that the EI values reported in Table 7 follow the same trend (C > P > F), indicating a higher degree of evolution (i.e., greater changes) for chestnut litter. The DOM evolution of PL and FL confirmed the predominance of qualitative modification during the transition from litter to soil, although the quantitative change was slightly higher for chestnut. In this case as well, spectroscopic analyses, specifically 1H NMR, help to confirm these results (see relative differences in Table 6). A markedly different behavior was observed for the ROM fractions across samples. In C and P, both qualitative and quantitative aspects were dominant, whereas in F, the contributions were more balanced. In conclusion, considering the average EI values reported in Table 7, which suggest greater evolution for chestnut litter followed by pine and beech, and comparing these with the quantitative characterization reported in Table 1, the data are consistent with the EI values.
3.4. Limitations of the Study
One of the main limitations of this study lies in the sampling design, specifically the use of a single composite sample per site, resulting in a sample size of n = 1 for each forest type. While this approach allowed us to capture an overall representation of each site, it inherently introduces pseudoreplication, which restricts the strength of statistical inferences that can be drawn from the data. The lack of true replication prevents the assessment of within-site variability and limits the generalizability of the results.
We acknowledge that this limitation affects the generalizability of the findings and the strength of the inferences that can be drawn. Future studies should aim to incorporate replicated sampling schemes to better capture spatial heterogeneity and support more robust statistical evaluations. Despite this constraint, the results provide valuable preliminary insights into the ecological dynamics of the forest types investigated.
4. Conclusions
This study highlights the complex interplay between litter composition and organic matter transformation in Mediterranean forest soils, based on three different forest litters and investigated through a combination of chemical, spectroscopic, and chemometric techniques.
The results demonstrate that analyzing both labile and recalcitrant fractions of organic matter is a valuable approach to understanding the dynamics of litter decomposition and its conservation in forest topsoil, particularly regarding carbon release and stabilization.
Strong correlations between respiration rates and both total organic carbon and dissolved organic carbon confirm the central role of labile carbon in driving microbial activity. Spectroscopic analyses (13C CP MAS NMR and 1H NMR) further support the selective preservation of recalcitrant compounds.
The data revealed species-specific patterns in organic matter evolution: chestnut litter underwent the most rapid transformation, while beech litter was more effective in promoting organic carbon accumulation in the soil.
Principal Component Analysis (PCA) effectively synthesized the complex dataset, with the first two components explaining 88% of the total variance. The Evolution Index (EI) derived from the PCA confirmed that chestnut litter underwent the most pronounced transformation, followed by pine and beech.
These findings provide relevant insights for forest management and reforestation strategies by identifying plant species whose chemical composition favors soil carbon storage and contributes to the mitigation of CO2 emissions. However, these results should be interpreted in light of this study’s methodological limitations, particularly the lack of replication in the sampling design (see Section 3.4). Despite this constraint, this study provides a valuable contribution to the understanding of carbon sequestration mechanisms in forest soils under different types of vegetation cover.
Supplementary Materials
The following supporting information can be downloaded at https://www.mdpi.com/article/10.3390/f16081349/s1: Figure S1: 13C CPMAS NMR spectra of litter and topsoil samples; Figure S2: 1H NMR spectra of DOM extracted from litter and topsoil samples; Figure S3: 1H NMR spectra of ROM extracted from litter and topsoil samples; Table S1: Litter and topsoil cumulate respiration; Table S2. Dataset of Principal Component Analysis (PCA).
Author Contributions
F.T.: Conceptualization, Data curation, Formal analysis, Writing—original draft. P.B.: Sample collection, Formal analysis. L.B.: Sample collection, Formal analysis. M.Z.: Formal analysis, Data curation. G.B.: Formal analysis, Data curation. S.M.: Formal analysis, Data curation. B.S.: Data curation, Chemometric elaboration. A.G.: Data curation. A.M.: Data curation. All authors have read and agreed to the published version of the manuscript.
Funding
This research did not receive any specific grant from funding agencies in the public, commercial, or not-for-profit sectors.
Data Availability Statement
The original contributions presented in this study are included in the article and Supplementary Material. Further inquiries can be directed to the corresponding author.
Conflicts of Interest
The authors declare no conflict of interest.
References
- Alam, S.A.; Kivinen, S.; Kujala, H.; Tanhuanpää, T.; Forsius, M. Integrating carbon sequestration and biodiversity impacts in forested ecosystems: Concepts, cases, and policies. Ambio 2023, 52, 1687–1696. [Google Scholar] [CrossRef] [PubMed]
- Aznar-Sánchez, J.A.; Belmonte-Ureña, L.J.; López-Serrano, M.J.; Velasco-Muñoz, J.G. Forest Ecosystem Services: An Analysis of Worldwide Research. Forests 2018, 8, 453. [Google Scholar] [CrossRef]
- Walkiewicz, A.; Rafalska, A.; Bulak, P.; Bieganowski, A.; Osborne, B. How can litter modify the fluxes of CO2 and CH4 from forest soils?” A Mini-Review. Forests 2021, 12, 1276. [Google Scholar] [CrossRef]
- European Commission. Communication from the Commission to the European Parliament, the European Council, the Council, the European Economic and Social Committee and the Committee of the Regions. In The European Green Deal; European Commission: Brussels, Belgium, 2019. [Google Scholar]
- FAO. Global Forest Resources Assessment 2020—Key Findings; FAO: Rome, Italy, 2020. [Google Scholar] [CrossRef]
- Krishna, M.P.; Mohan, M. Litter decomposition in forest ecosystems: A review. Energy Ecol. Environ. 2017, 2, 236–249. [Google Scholar] [CrossRef]
- Wan, Q.; Zhu, G.; Guo, H.; Zhang, Y.; Pan, H.; Yong, L.; Ma, H. Influence of Vegetation Coverage and Climate Environment on Soil Organic Carbon in the Qilian Mountains. Sci. Rep. 2019, 9, 17623. [Google Scholar] [CrossRef]
- Sultana, T.; Jashimuddin, M.; Hasan, M.H. Leaf litter decomposition and associated nutrient release dynamics under varying temperature and precipitation in a south asian tropical forest. J. Soil Plant Environ. 2025, 4, 94–111. [Google Scholar] [CrossRef]
- Cornwell, W.K.; Cornelissen, J.H.C.; Amatangelo, K.; Dorrepaal, E.; Eviner, V.T.; Godoy, O.; Hobbie, S.E.; Hoorens, B.; Kurokawa, H.; Pérez-Harguindeguy, N.; et al. Plant species traits are the predominant control on litter decomposition rates within biomes worldwide. Ecol. Lett. 2008, 11, 1065–1071. [Google Scholar] [CrossRef]
- Ranucci, M.; Perez, M.; Lombardi, D.; Vitale, M. Is the Current Modelling of Litter Decomposition Rates Reliable under Limiting Environmental Conditions Induced by Ongoing Climate Change? Soil Syst. 2022, 6, 81. [Google Scholar] [CrossRef]
- Ball, B.A.; Christenson, L.M.; Wickings, K.G. A cross-system analysis of litter chemical dynamics throughout decomposition. Ecosystems 2022, 25, 1792–1808. [Google Scholar] [CrossRef]
- Zhang, Y.; Zou, J.; Meng, D.; Dang, S.; Zhou, J.; Osborne, B.; Ren, Y.; Liang, T.; Yu, K. Effect of soil microorganisms and labile C availability on soil respiration in response to litter inputs in forest ecosystems: A meta-analysis. Ecol. Evol. 2020, 10, 13602–13612. [Google Scholar] [CrossRef] [PubMed]
- Giweta, M. Role of litter production and its decomposition, and factors affecting the processes in a tropical forest ecosystem: A review. J. Ecol. Environ. 2020, 44, 11. [Google Scholar] [CrossRef]
- Yang, K.; Zhu, J.; Zhang, W.; Zhang, Q.; Lu, D.; Zhang, Y.; Zheng, X.; Xu, S.; Wang, G. Litter decomposition and nutrient release from monospecific and mixed litters: Comparisons of litter quality, fauna and decomposition site effects. J. Ecol. 2022, 110, 1673–1686. [Google Scholar] [CrossRef]
- Suominen, K.; Kitunen, V.; Smolander, A. Characteristics of dissolved organic matter and phenolic compounds in forest soils under silver birch (Betula pendula), Norway spruce (Picea abies) and Scots pine (Pinus sylvestris). Eur. J. Soil Sci. 2023, 54, 287–293. [Google Scholar] [CrossRef]
- Fengel, D.; Wegener, G. Wood: Chemistry, Ultrastructure, Reactions; De Gruyter: Berlin, Germany, 1983; p. 613. [Google Scholar] [CrossRef]
- Quideau, S.A.; Chadwick, O.A.; Benesi, A.; Graham, R.C.; Anderson, M.A. A direct link between forest vegetation type and soil organic matter composition. Geoderma 2001, 104, 41–60. [Google Scholar] [CrossRef]
- Berardi, D.; Brzostek, E.; Blanc-Betes, E.; Davison, B.; DeLucia, E.H.; Hartman, M.D.; Kent, J.; Parton, W.J.; Saha, D.; Hudiburg, T.W. 21st-century biogeochemical modelling: Challenges for Century-based models and where do we go from here? Glob. Change Biol. Bioenergy 2020, 12, 774–788. [Google Scholar] [CrossRef]
- Papa, G.; Scaglia, B.; Schievano, A.; Adani, F. Nanoscale structure of organic matter could explain litter decomposition. Biogeochemistry 2014, 117, 313–324. [Google Scholar] [CrossRef]
- Nonini, L.; Fiala, M. Estimation of carbon storage of forest biomass for voluntary carbon markets: Preliminary results. J. For. Res. 2021, 32, 329–338. [Google Scholar] [CrossRef]
- Rhoades, J.D. Cation exchange capacity. In Methods of Soil Analysis, Part 2; Page, A.L., Ed.; ASA and SSSA: Madison, WI, USA, 1982; pp. 149–157. [Google Scholar]
- Klute, A. Water Retention: Laboratory Methods. In Methods of Soil Analysis, Part 1, 2nd ed.; Klute, A., Ed.; ASA SSSA: Madison, WI, USA, 1986. [Google Scholar]
- Gee, G.W.; Bauder, J.W. Particle-size analysis. In Methods of Soil Analysis, Part 2; Page, A.L., Ed.; ASA and SSSA: Madison, WI, USA, 1986; pp. 383–441. [Google Scholar]
- Sparks, D.L.; Page, A.L.; Helmke, P.A.; Loeppert, R.H.; Soltanpour, P.N.; Tabatabai, M.A.; Johnston, C.T.; Sumner, M.E. Methods of Soil Analysis: Part 3 Chemical Methods; Soil Science Society of America, Inc.: Madison, WI, USA, 1996. [Google Scholar]
- Van Reeuwijk, L.P. Procedures for Soil Analysis; Technical paper n. 9; International Soil Reference and Information Centre: Wageningen, The Netherlands, 2002. [Google Scholar]
- EPA. Method EPA 3051. In Microwave Assisted Acid Digestion of Sediments, Sludges, Soils and Oils; EPA: Washington, DC, USA, 1998. [Google Scholar]
- ISO 16072; Soil Quality—Laboratory Methods for Determination of Microbial Soil Respiration. International Organization for Standardization: Geneva, Switzerland, 2002.
- Kögel-Knabner, I. The macromolecular organic composition of plant and microbial residues as inputs to soil organic matter. Soil Biol. Biochem. 2002, 34, 139–162. [Google Scholar] [CrossRef]
- Kaiser, H.F. The application of electronic computers to factor analysis. Educ. Psychol. Meas. 1960, 29, 141–151. [Google Scholar] [CrossRef]
- Brejda, J.J.; Mooman, T.B.; Karlen, D.L.; Dao, T.H. Identification of regional soil quality factors and indicators. I. Central and southern high plains. Soil Biol. Biochem. 2000, 64, 2115–2124. [Google Scholar] [CrossRef]
- Scaglia, B.; Tambone, F.; Corno, L.; Orzi, V.; Lazzarini, Y.; Garuti, G.; Adani, F. Potential agronomic and environmental properties of thermophilic anaerobically digested municipal sewage sludge measured by an unsupervised and a supervised chemometric approach. Sci. Tot. Environ. 2018, 637, 791–802. [Google Scholar] [CrossRef]
- Scaglia, B.; Adani, F. An index for quantifying the aerobic reactivity of municipal solid wastes and derived waste products. Sci. Tot. Environ. 2008, 394, 183–191. [Google Scholar] [CrossRef]
- Huang, J.; Hartemink, A.E. Soil and environmental issues in sandy soils. Earth-Sci. Rev. 2020, 208, 103295. [Google Scholar] [CrossRef]
- Gavazov, K.S. Dynamics of alpine plant litter decomposition in a changing climate. Plant Soil 2010, 337, 19–32. [Google Scholar] [CrossRef]
- Sokolova, T.A. Low-Molecular-Weight Organic Acids in Soils: Sources, Composition, Concentrations, and Functions: A Review. Eurasian Soil Sci. 2020, 53, 580–594. [Google Scholar] [CrossRef]
- Isidorov, V.A.; Smolewska, M.; Purzynska-Pugacewicz, A.; Tyszkiewicz, Z. Chemical composition of volatile and extractive compounds of pine and spruce leaf litter in the initial stages of decomposition. Biogeosc. Discuss. 2010, 7, 1727–1750. [Google Scholar] [CrossRef]
- Karapandzova, M.; Stefkova, G.; Cvetkovikja, I.; Stanoevab, J.P.; Stefovab, M.; Kulevanovaa, S. Flavonoids and other phenolic compounds in needles of Pinus peuce and other pine species from the Macedonian flora. Nat. Prod. Commun. 2015, 10, 987–990. [Google Scholar] [CrossRef]
- Blonska, E.; Lasota, J.; Januszekv, K. Variability of enzymatic activity in forest Cambisols and Brunic Arenosols of Polish lowland areas. Soil Sci. Ann. 2013, 64, 82–87. [Google Scholar] [CrossRef]
- Bonnefoy-Claudet, C.; Kaal, J.; Thevenot, M.; Panettieri, M.; Leveque, J.; Mathieu, O. Soil organic matter degradability as a function of forest species, a study based on Py-GC–MS analysis. Geoderma 2025, 459, 117374. [Google Scholar] [CrossRef]
- Bi, R.; Lu, Q.; Yu, W.; Yuan, Y.; Zhou, S. Electron transfer capacity of soil dissolved organic matter and its potential impact on soil respiration. J. Soils Sedim. 2013, 13, 1553–1560. [Google Scholar] [CrossRef]
- Zhang, H.; Zhou, Z. Recalcitrant carbon controls the magnitude of soil organic matter mineralization in temperate forests of northern China. Forest Ecosyst. 2018, 5, 17. [Google Scholar] [CrossRef]
- Margesin, R.; Minerbi, S.; Schinner, F. Litter decomposition at two forest sites in the Italian Alps: A field study. Arct. Antarct. Alp. Res. 2016, 48, 127–138. [Google Scholar] [CrossRef]
- Duboc, O.; Zehetner, F.; Djukic, I.; Tatzber, M.; Berger, T.W.; Gerzabek, M.H. Decomposition of European beech and Black pine foliar litter along an Alpine elevation gradient: Mass loss and molecular characteristics. Geoderma 2012, 189-190, 522–531. [Google Scholar] [CrossRef]
Disclaimer/Publisher’s Note: The statements, opinions and data contained in all publications are solely those of the individual author(s) and contributor(s) and not of MDPI and/or the editor(s). MDPI and/or the editor(s) disclaim responsibility for any injury to people or property resulting from any ideas, methods, instructions or products referred to in the content. |
© 2025 by the authors. Licensee MDPI, Basel, Switzerland. This article is an open access article distributed under the terms and conditions of the Creative Commons Attribution (CC BY) license (https://creativecommons.org/licenses/by/4.0/).