Article

Non-Structural Carbohydrate Concentration Increases and Relative Growth Decreases with Tree Size in the Long-Lived Agathis australis (D.Don) Lindl.

by
Julia Kaplick
1,2,
Benjamin M. Cranston
1 and
Cate Macinnis-Ng
1,3,*
1
School of Biological Sciences, Waipapa Taumata Rau, The University of Auckland, Private Bag 92019, Auckland Mail Centre, Auckland 1142, New Zealand
2
Landeskompetenzzentrum Forst Eberswalde, Alfred-Möller-Str. 1, 16225 Eberswalde, Germany
3
Te Pūnaha Matatini, Waipapa Taumata Rau, The University of Auckland, Private Bag 92019, Auckland Mail Centre, Auckland 1142, New Zealand
*
Author to whom correspondence should be addressed.
Forests 2025, 16(8), 1270; https://doi.org/10.3390/f16081270 (registering DOI)
Submission received: 1 June 2025 / Revised: 13 July 2025 / Accepted: 15 July 2025 / Published: 3 August 2025
(This article belongs to the Section Forest Ecophysiology and Biology)

Abstract

The southern conifer Agathis australis (D.Don) Lindl. is a large and long-lived species endemic to Aotearoa New Zealand. It is threatened due to past logging activities, pathogen attack and potentially climate change, with increasing severity and frequency of drought and heatwaves across its distribution. Like many large tree species, little is known about the carbon dynamics of this ecologically and culturally significant species. We explored seasonal variations in non-structural carbohydrates (NSCs) and growth in trees ranging from 20 to 175 cm diameter at breast height (DBH). NSCs were seasonally stable with no measurable pattern across seasons. However, we found growth rates standardised to basal area and sapwood area (growth efficiency) declined with tree age and stem NSC concentrations (including total NSCs, sugars and starch) all increased as trees aged. Total NSC concentrations were 0.3%–0.6% dry mass for small trees and 0.8%–1.8% dry mass for larger trees, with strong relationships between DBH and total NSC, sugar and starch in stems but not roots. Cumulative growth efficiency across the two-year study period declined as tree size increased. Furthermore, there was an inverse relationship between growth efficiency across the two-year study period and NSC concentrations of stems. This relationship was driven by differences in carbon dynamics in trees of different sizes, with trees progressing to a more conservative carbon strategy as they aged. Simultaneously declining growth efficiency and increasing NSC concentrations as trees age could be evidence for active NSC accumulation to buffer against carbon starvation in larger trees. Our study provides new insights into changing carbon dynamics as trees age and may be evidence for active carbon accumulation in older trees. This may provide the key for understanding the role of carbon processes in tree longevity.

1. Introduction

The role of non-structural carbohydrate (NSC) pools (including sugars (mainly sucrose) and starch) in tree functional processes including growth, respiration, osmoregulation, rhizodeposition and defence is well-established [1,2]. Concentrations of NSCs vary greatly within tree organs and between trees due to a range of factors. Stems and larger root tissues generally have lower concentrations than leaves and branches, but, due to larger volume, they often represent the largest pool [3]. Between trees, biotic and abiotic factors influence NSC concentrations. As trees become bigger as they age, NSC concentrations often increase in stem tissues [4,5,6]. Environmental conditions associated with higher elevation and latitudes drive higher NSC concentrations, likely due to growth but not necessarily photosynthesis, being limited by shorter seasons and lower temperatures in these areas [7]. Despite a good understanding of many of the factors that influence the dynamics of NSC concentrations in plant tissues, interactions between NSCs and growth rates as trees age remain understudied.
The interplay between growth and NSC supply has been linked to life history strategies [8] and used to infer sink versus source limitation of growth [9,10]. Under source limitation, growth is constrained by the supply of carbon, and under sink limitation, growth processes themselves constrain growth [11]. Understanding the constraints of growth is important for accurate modelling of carbon dynamics in future climates. For instance, water-limited plants may reduce growth while simultaneously increasing carbon stores, suggesting sink limitation [6,12]; however, if vegetation models focus on photosynthetic responses to climatic conditions (source limitation), they may produce inaccurate estimates of carbon uptake and storage [11]. Furthermore, the growth–storage trade-off is strongly mediated by disturbance events [13,14] and is key to tree longevity [15], so improving our understanding of growth and NSC supply is essential for the conservation of large old trees in a changing climate. However, NSC allocation data for large trees is currently very scarce, limiting our understanding of NSC status in long-lived tree species [16].
Drought is a climate change factor that strongly influences NSCs, and the role of NSCs in drought survival has received increasing attention [17,18,19]. Seedling survival during drought was significantly enhanced by greater NSC reserves [20], while multiple studies [21,22] found that NSC concentrations increase shortly after the onset of drought. The proposed explanation for these different findings is sink limitation release since growth declines much earlier than a reduction in photosynthesis during drought. If water is limited, turgor-driven cell expansion necessary for growth declines, eliminating growth as a sink for fresh assimilates [23]. This results in an accumulation of NSCs due to sink inhibition, which in turn causes down-regulation of photosynthesis [24,25,26,27]. However, questions concerning the distinction between sink limitation as opposed to carbon limitation remain [25,26,27,28], along with questions about the process of storage accumulation [1], and whether this is a passive process or an active process at the expense of growth [19,29,30]. Most studies focus on seedlings rather than carbon allocation in mature trees [2], and few studies explore how these processes play out in large long-lived trees. Due to biomass ratio changes during a tree’s lifetime, allocation dynamics in seedlings might not necessarily reflect those of mature trees even of the same species [31]. For instance, smaller trees may respond to environmental cues and stress more quickly [32]. Furthermore, Wiley and Helliker [28] present an alternative view that increasing carbon storage and decreasing growth is an active response to reduce the risk of carbon starvation, rather than being a result of sink limitation, but there are few combined datasets of growth and NSCs for mature trees. Blumstein et al. [33] recently presented evidence that carbon storage is active and acts as a conservative process to protect plants under stressful environmental conditions such as drought. Whether this life history strategy adjusts as trees age has not been explored.
NSC data for southern hemisphere evergreens are currently missing from global analyses [34]. Agathis australis (D.Don) Lindl. (commonly known as kauri) belongs to the Auracariaceae family and is endemic to New Zealand. Trees are large and long-lived with stem diameters of 1–2 m for trees 400–800 years old, but they can be up to 3–5 m for older trees [35]. Accurate maximum age estimates are difficult because large trees are often hollow, so counting tree rings is not possible. A commonly cited maximum age estimate is 1679 years and was measured by Enright and Ogden [36], who also reported a typical longevity of about 600 y. Earlier increment core analysis produced an age of 2144 y for a tree of 5.2 m diameter [35], but the same authors suggest a maximum age of 1500–1700 y.
A. australis have an active growing season (September to May) and a dormant season during winter (June to August), although more recent data is showing growth can continue as winters become more mild (Macinnis-Ng unpubl. data). Summer maximum temperatures are around 25 °C and winter maximum temperatures are around 13 °C. Annual rainfall is approximately 1900–2400 mm and is winter-dominant. There are frosts some winters but not all [37]. A. australis can be classified as isohydric based on the very conservative stomatal behaviour [38], likely because the species is highly vulnerable to xylem embolism [39]. Since larger NSC concentrations are linked to better drought survival [20], active investment into NSC storage could be an effective strategy of the species to deal with adverse environmental conditions that are similar to water shortage. A closely related species (within the same family), Araucaria araucana, had comparable NSC concentrations in healthy and water-stressed trees, and this maintenance of carbon dynamics was attributed to foliage loss under drought conditions [40]. A. australis has similarly been found to have decreased leaf area under drought conditions [41].
Our aim was to explore carbon and growth dynamics in mature trees of different sizes. We analysed NSC concentrations of root and stem wood of A. australis for a range of tree sizes (20 to 170 cm diameter at breast height) over two years and analysed leaf tissue on one occasion using canopy climbing. This allowed us to investigate seasonal variations in NSCs in roots and stems and explore relationships between NSCs and tree size. We asked how stem NSC concentration changed with tree size. Second, we analysed NSC concentrations in different tissues (leaves, stems and roots). Finally, we explored seasonal changes in NSC concentrations of stem and root tissues and compared these to patterns of growth to improve our understanding of the life history strategy in this long-lived tree.

2. Methods

2.1. Study Site and Sampling

The study was carried out at the University of Auckland Huapai Scientific Reserve (−36.796, 174.492, 90 m a.s.l.) west of Auckland, New Zealand. This 15 ha plot with a mature podocarp–broadleaf forest [42] is dominated by the southern conifer Agathis australis [43]. Six study trees were chosen to cover a range of sizes and were equipped with permanent girth tapes (UMS GmbH, Munich, Germany). Diameter at breast height (DBH) was recorded fortnightly from April 2014 to March 2016. The sapwood area was calculated for each tree from the sapwood depth determined using the dye-injection method of Meinzer et al. [44]. Sapwood depths were up to 18 cm in our study trees, reflecting the large sapwood volume of this species [45].
During a field campaign in February 2015, sun-exposed leaf samples (of 1–3 years of age) were taken throughout the day for two of the study trees (see Table 1). Samples for NSC measurements of stem and root tissues were taken seasonally (April 2014, July 2014, October 2014, January 2015, April 2015, May 2015, July 2015, October 2015, January 2016 and March 2016) using a trephor micro corer [46]. Four to five cores (2 mm × 15 mm, representing between 10 and 30 annual growth rings) were necessary to gain enough sample material for the chemical analysis. For stem xylem samples, the thick bark was removed with a chisel before taking the core at approximately breast height on the north side of the tree. For root xylem samples, we followed large surface roots and dug up smaller roots in the vicinity with diameters larger than 5 cm for sufficient corer samples. From April 2015 onwards we changed the sampling strategy and started collecting smaller diameter root segments using a chisel. All sampled roots from this point forward were between 1 and 3 cm in diameter, but all were xylem tissue. For two of the study trees (Table 1), it was not possible to take root samples as there were no larger surface roots that could be followed to roots of appropriate size. Any roots found by digging up soil around the bases of the two trees could not be clearly identified as belonging to the sample tree. Collecting wood samples in this way produces a strong wound response in A. australis [47]. While this type of sampling should not kill the trees, we were aware of the conservation status of the species as the fourth most threatened species globally [48] as well as the cultural significance of the species. As we wanted to repeatedly sample trees across seasons, we decided to work with a limited number of trees across the age range to avoid damaging too many trees. Leaves and cores were kept on ice until they were delivered to the lab. Upon return to the laboratory, samples were microwaved for 1 min to stop enzyme activity [49] and dried for 72 h at 75 °C. Finally, we ground the sample material into a 25 µm fine powder using a centrifugal mill (ZM200 Retsch, Haan, Germany). Samples were stored in Eppendorf tubes at room temperature in dry and dark conditions prior to chemical analysis.

2.2. Chemical Determination of NSC Content

Samples were analysed for NSC content using a protocol based on those described by Wong [50] and Hoch et al. [24], but using amyloglucosidase instead of the originally used clarase for starch hydrolyzation (e.g., [22,51]). This procedure quantifies the concentration of low molecular weight carbohydrates (free sugar: glucose, fructose and sucrose) as well as the total non-structural carbohydrate concentration (TNC: starch and free sugar). First, we extracted 10 to 12 mg of powdered samples (8 to 10 mg for leaves) in 2 mL distilled water over steam for one hour. For the free sugar analysis, an aliquot of the extract was mixed with invertase (from baker’s yeast, I4504 from Sigma Aldrich, Auckland, New Zealand), vortexed and left to react for one hour. The sucrose present in the sample was digested to glucose and fructose through this process. Glucose assay reagent (G3293, Sigma Aldrich, Auckland, New Zealand) and phospho-isomerase (P5381, Sigma Aldrich, Auckland, New Zealand) were mixed and added into 96-well plates. The self-absorption (without sample) was measured at 340 nm for both plates using a plate reader (SpectraMax ID3, Molecular Devices, San Jose, CA, USA). An aliquot of the sample extract was then added to the wells of both plates and left to react with the assay reagent for 20 min on a shaker. Finally, the absorption was measured at the same wavelength and re-measured once more after another 15 min had passed. In order to analyse the total NSC content (TNC, starch and free sugars combined) amyloglucosidase (10115, Sigma Aldrich, Auckland, New Zealand) was added to an aliquot of the initial sample extract and then placed in a 49 °C water bath, where starch and sucrose present in the sample were digested into glucose and fructose. The glucose concentration was then determined following the same steps described above for determining the free sugar concentration. Glucose standard solution (G6918, Sigma Aldrich, Auckland, New Zealand) was used to create standard curves, and fructose, sucrose and starch solutions at concentrations of 1 mg/mL were used throughout the chemical analysis for quality control. Finally, starch concentrations were calculated by subtracting free sugar values from TNC values.

2.3. Data Analysis

Linear regression models were developed to explore the relationships between tree size (DBH) and TNC, sugars and starch (with tree label as a random effect). After tests for homogeneity of variance (Levene’s test) and normal distributions (Kolmogorov–Smirnov test), ANOVA and Tukey’s tests were used to identify differences between NSC concentrations in different tree tissues and differences between NSC concentrations and sample dates. In order to investigate the relationship between growth and seasonally varying NSC concentrations, basal area increments were calculated for each tree from DBH measurements using the following equation:
B A I =   π 4   D B H 2 2     D B H 1 2
where DBH1 and DBH2 are consecutive diameter readings across the study period and π is the standard constant pi that represents the ratio of a circle’s circumference to its diameter. Due to the large variation of DBHs in the sample trees, we normalised the BAI by the basal area and sapwood area. This is known as growth efficiency, calculated as the BAI divided by the basal area or total sapwood area [6], and it avoids a bias towards the larger trees and accounts for the fact that larger trees grow more [52]. We used a linear regression model to describe the relationship between relative growth and NSC concentration, using growth data of the 14 days prior to the NSC sampling dates to capture the temporal nature of this relationship. We also used exponential decay curves and inverse first-order polynomial functions to describe the relationship between the total cumulative basal area increment standardised to the basal area and sapwood area (growth efficiency) and stem NSC concentrations pooled across the two-year sampling period for each tree to capture the influence of tree size. Analyses were all conducted using R version 3.2.0.

3. Results

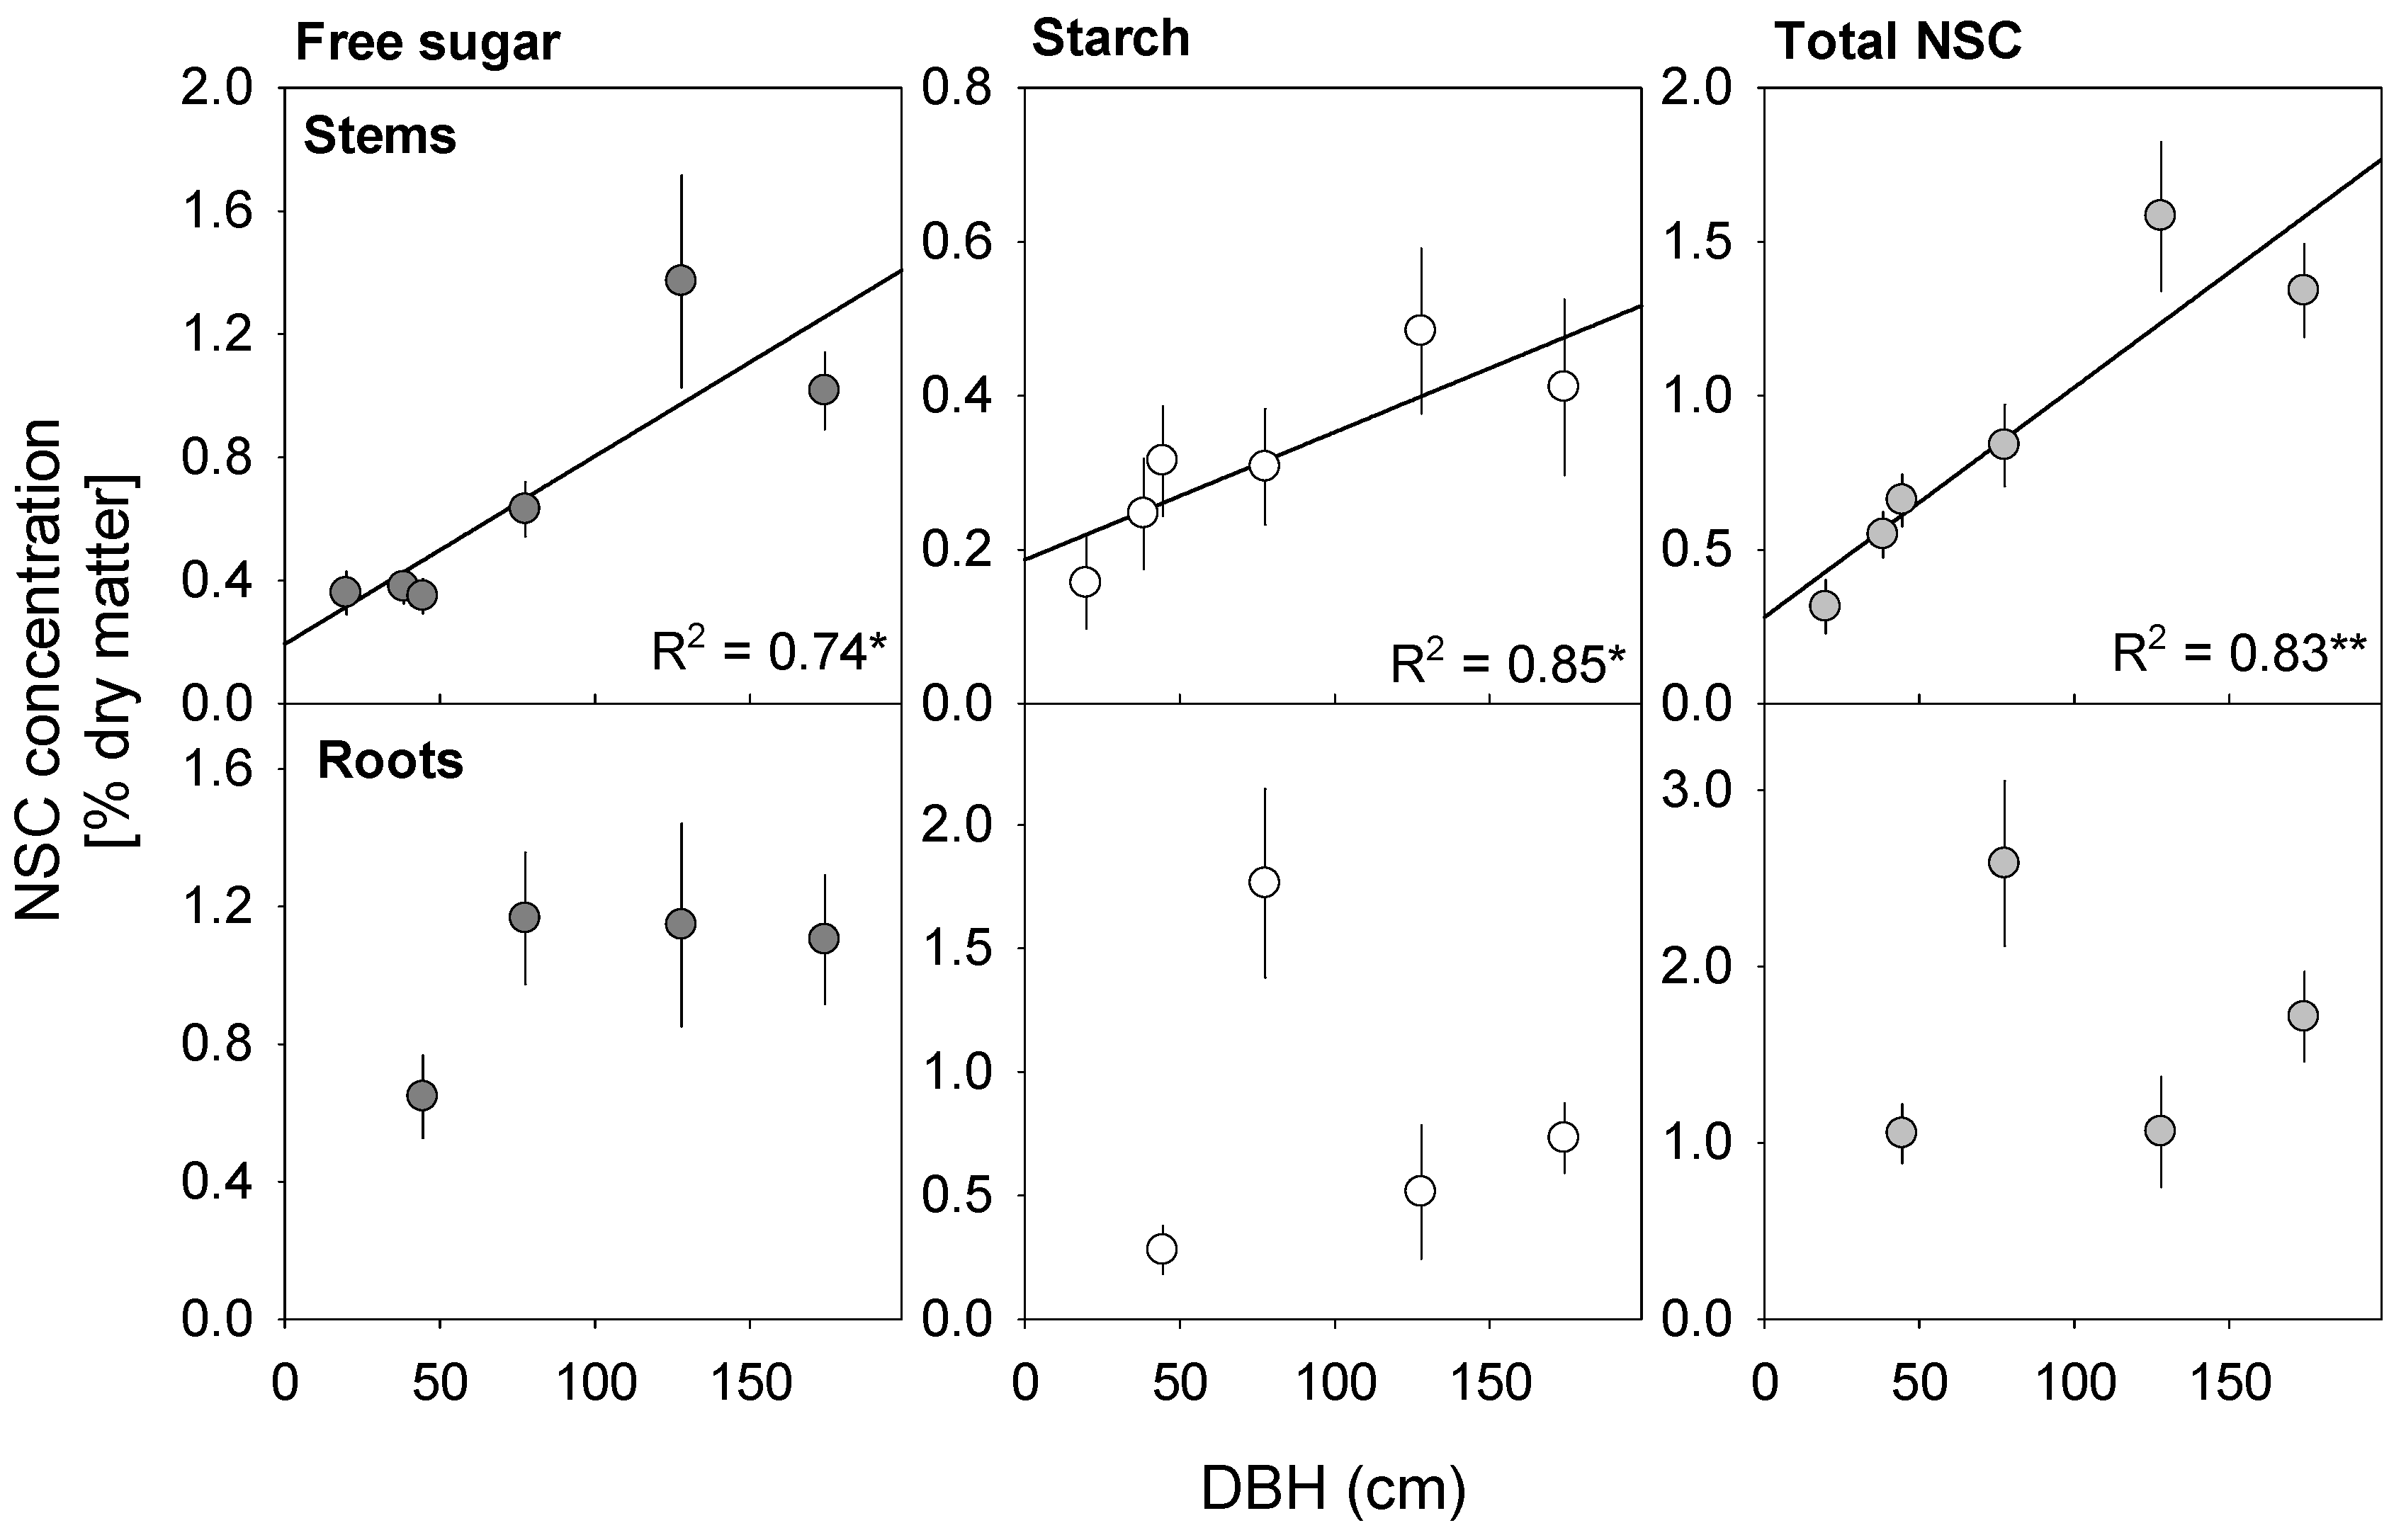
3.1. NSC Concentrations Vary with Tree Size

Concentrations of free sugars, starch and total NSCs in stems increased with tree DBH (Figure 1). For stem free sugar, 74% (p < 0.05) of the variation can be explained by increasing DBH. For total NSC and starch, increasing DBH explained 83 and 85% of the variation, respectively. There was no relationship between root NSC values (pooled across larger and smaller roots) and DBH (Figure 1).

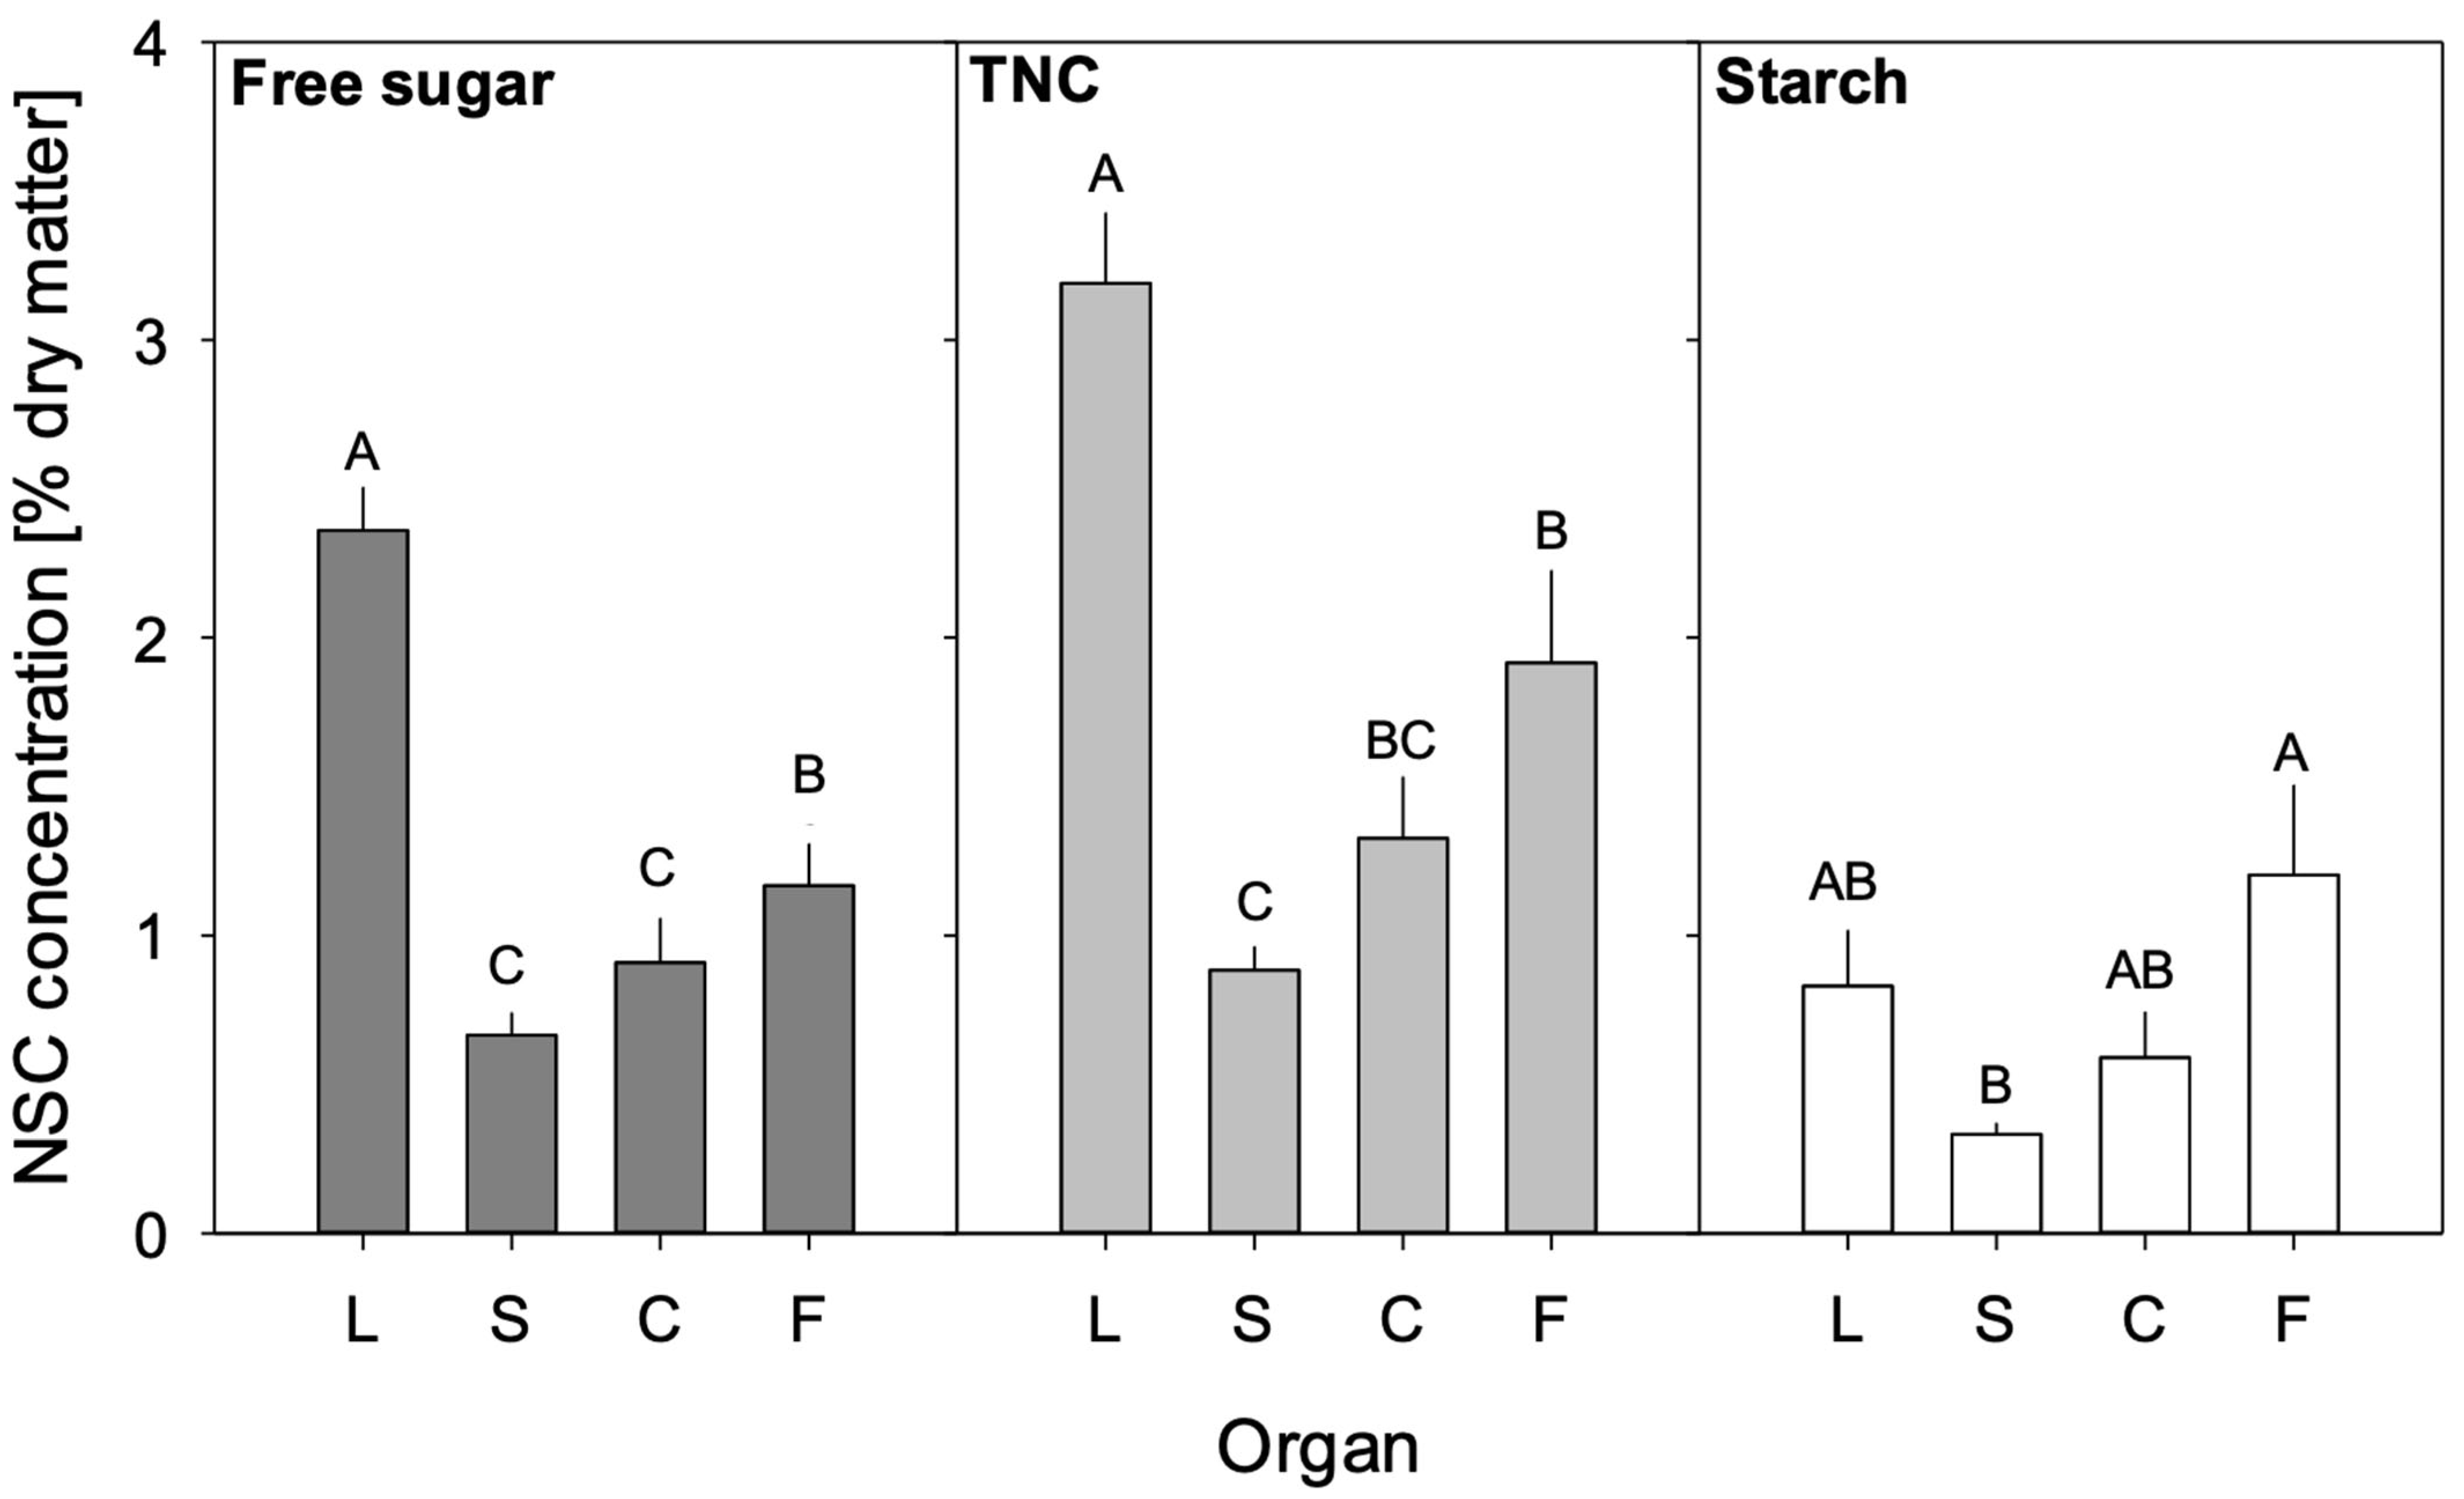
3.2. NSC Concentrations of Different Tree Organs

Significant differences were detected between mean NSC concentrations of different organs (Figure 2). Leaves had the highest concentrations of TNCs and free sugars, followed by smaller roots. Starch concentrations in smaller roots and leaves were similar. Stem concentrations of all NSC classes were lower than in other organs; however, no significant difference could be detected with the slightly higher concentration in larger roots. Mean TNC concentrations in leaves were 3.19 ± 0.24%, about 30% lower in smaller roots (1.91 ± 0.31%), and about two-thirds lower in stem tissue (0.88 ± 0.08%). In all organs, TNCs were made up of a greater proportion of free sugar than starch.

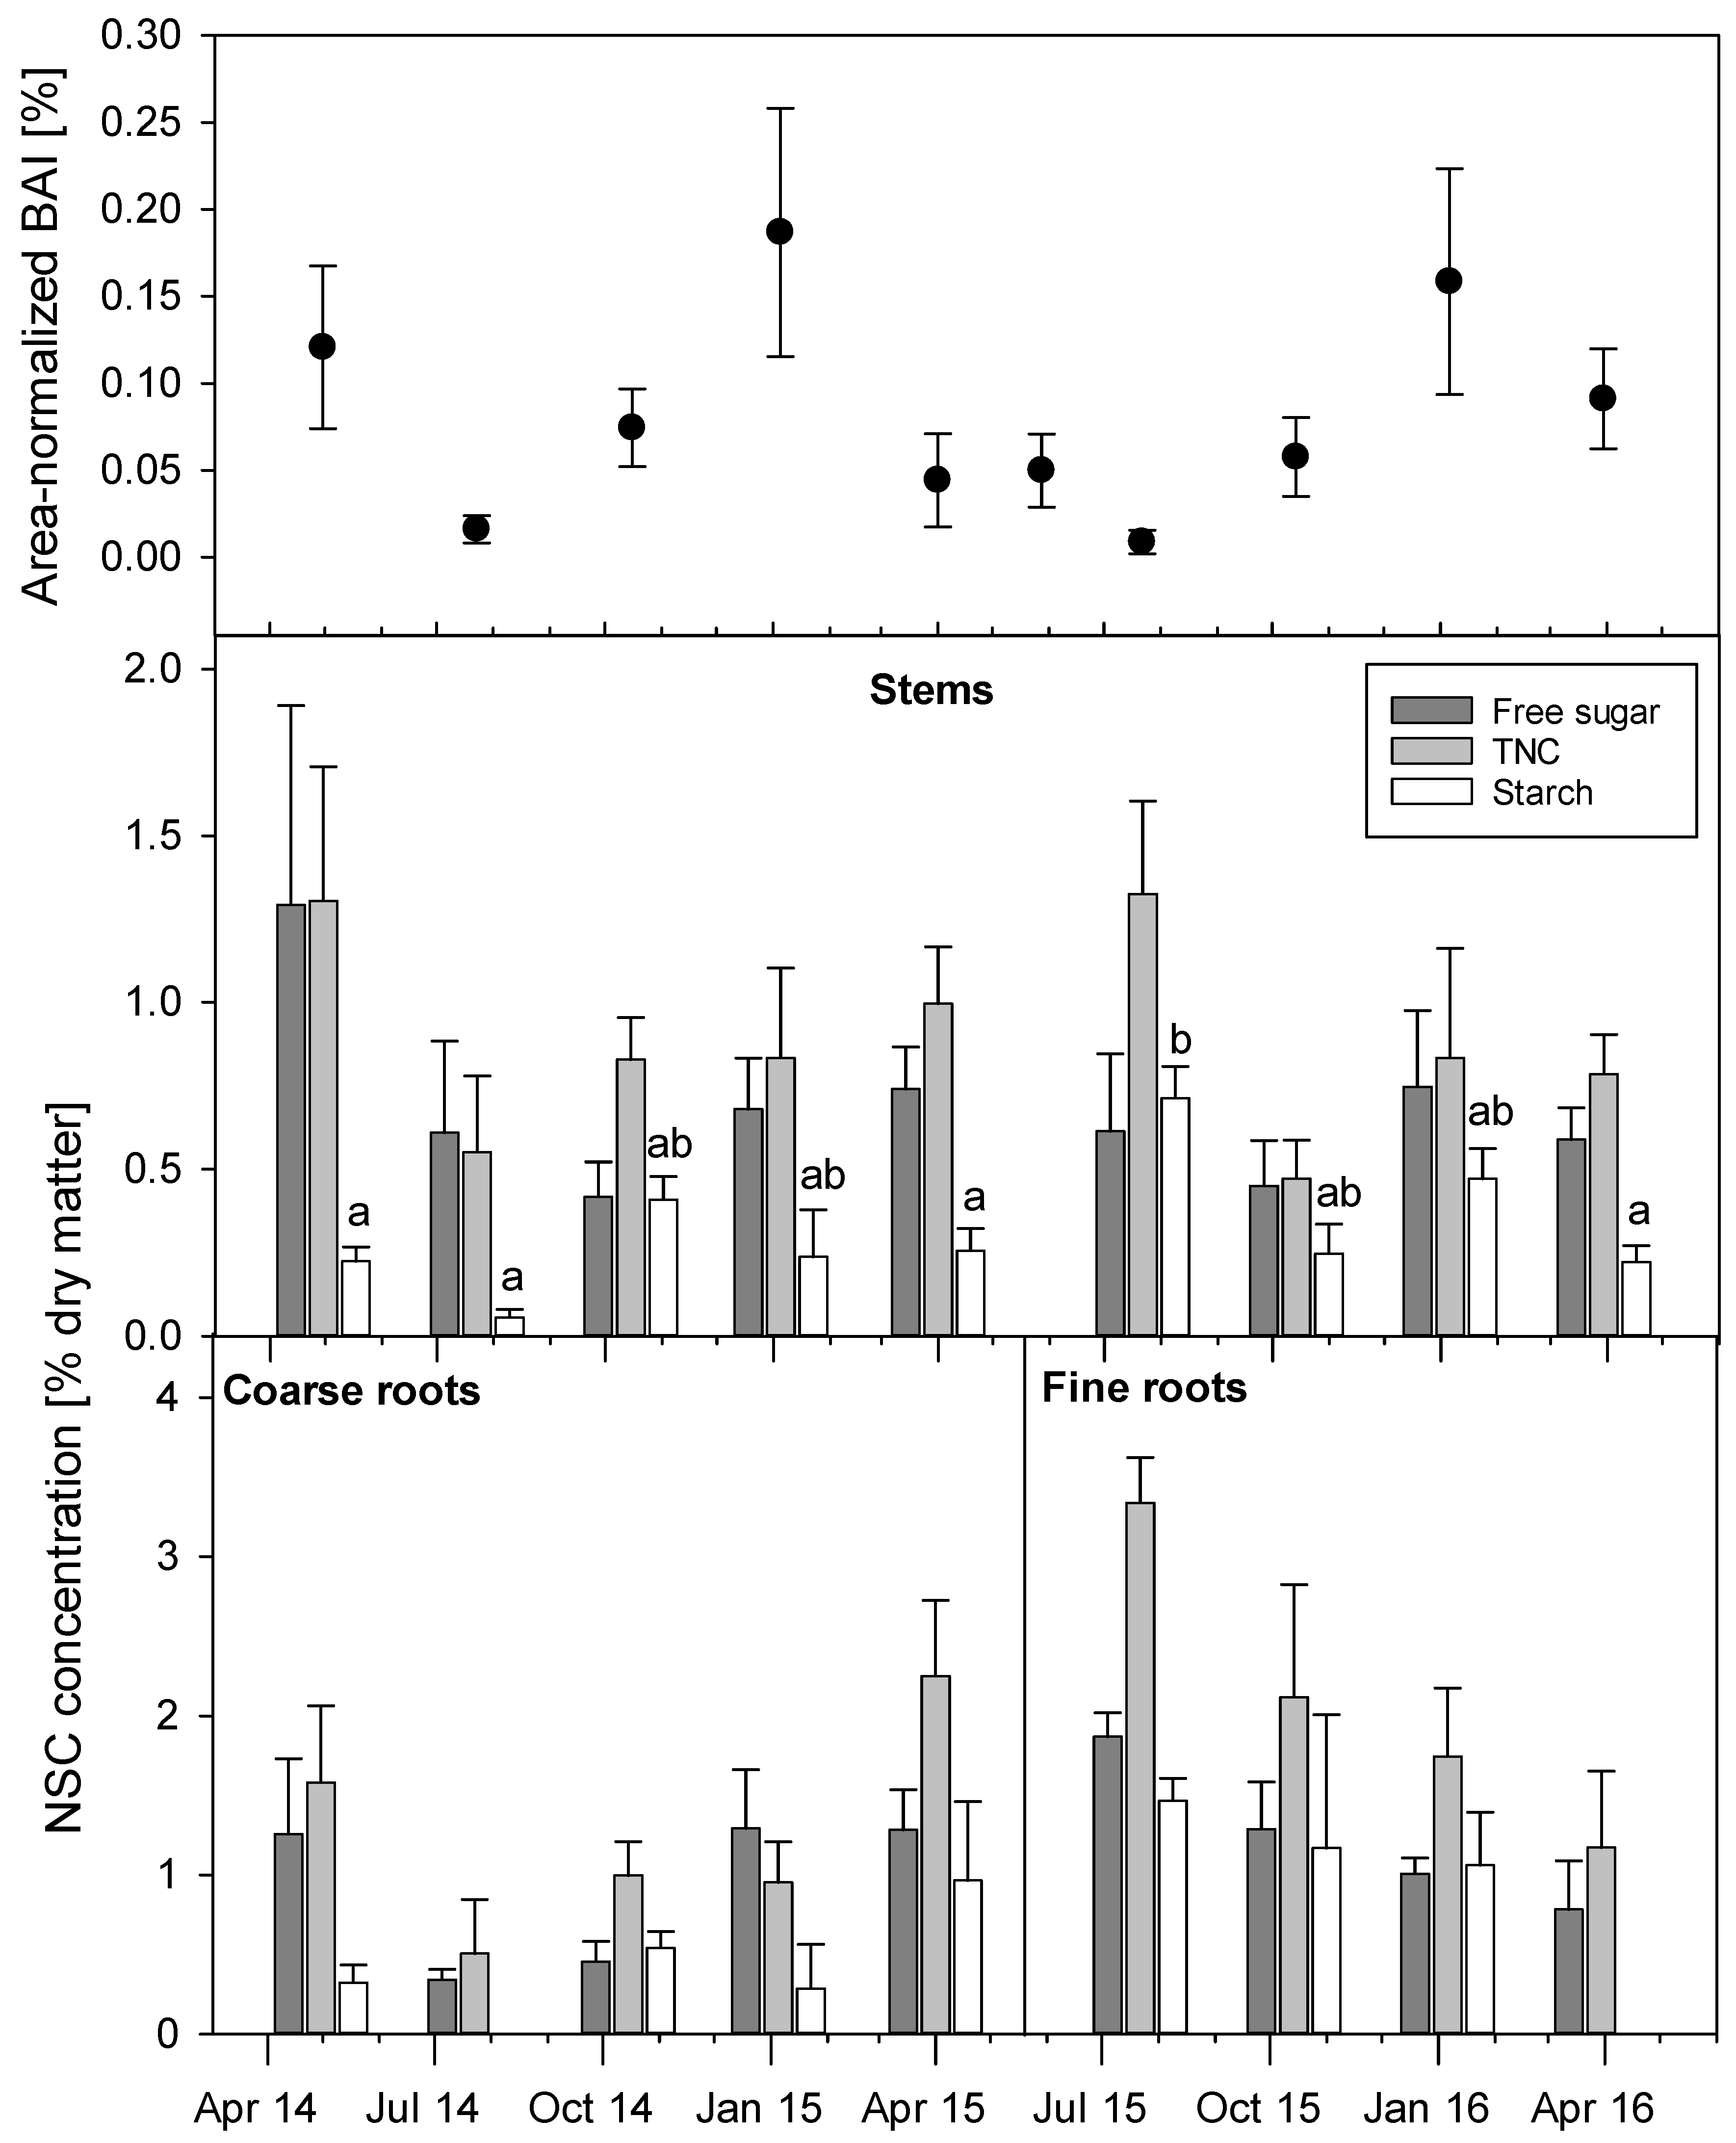
3.3. Seasonal Variations of NSC Concentrations and Growth

Incremental growth commenced around September for all six study trees in both spring seasons. The largest growth increments were observed in spring and early summer, with little to no growth from July to September each year. While normalised incremental growth was smallest for the largest trees and greatest for the smallest tree (Figure 3 and Figure 3 inset), the largest trees still added more area overall. DBH explained 79% of the variation in the normalised total basal area growth (Figure 3 inset). The basal area increment was much larger in the two large trees compared to the smallest trees.
The concentration of total NSCs in stem tissues of individual trees showed the lowest sugar concentration either in winter (late July) or mid-spring (October) and the highest sugar concentration for the January (summer) and April (early autumn) sampling dates (Figure 4). Variation in the root concentration of free sugars was similar to that in stem tissue for the larger surface roots, with low values in July and October. Smaller roots had the lowest concentrations in summer. TNC and starch concentrations in stems and roots did not follow a clear seasonal trend when looking at individual trees. Occasionally, TNC values were lower than free sugar values, resulting in negative starch values. Mean values (and standard errors) for the standards were 94.036 ± 1.24, 91.34 ± 1.35 and 64.20 ± 1.17% for starch, fructose and sucrose, respectively.
Mean stem tissue free sugar concentrations of the six study trees showed the lowest concentrations in winter and spring and higher concentrations in January and April (Figure 4). Starch concentrations were highest in autumn and winter and lowest in October. Overall, the seasonal variations were small and not statistically significant (Table 2). Sugar concentrations in large roots were lowest in July (winter) and only slightly higher in October. The rest of the sampling dates showed similar sugar levels. Mean starch and TNC concentrations peaked in April and, like the sugar levels, were at their lowest in July. Smaller root NSC concentrations peaked in October and then decreased until April the following year. Again, there were no significant differences in the mean NSC concentrations for roots at the different sampling dates.
When NSCs, sugar and starch were pooled across trees for each sampling time and plotted against the standardised BAI, higher stem sugar was associated with increased standardised BAI (Figure 5). Total NSC and starch concentrations were not associated with increased BAI in stems, and there were no relationships between sugar, starch and total NSCs of roots and BAI (Figure 5). To explore changes in the dynamics of relationships between NSCs and growth, stem NSC concentrations (pooled for the two-year sampling period) were plotted against the total basal area growth (standardised for basal area and sapwood area (growth efficiency) and raw) for the two-year study period; significant exponential decay curves and inverse first-order polynomial functions were produced for free sugar, total NSCs and starch (Figure 6a–f). However, there was no relationship between total raw growth, free sugar, total NSCs and starch (Figure 6g–i).

4. Discussion

Our results indicate that A. australis trees adjust to a more conservative life history strategy [33] as they age. We found coordination between tree size, relative growth rates and NSC concentrations. Larger trees had higher concentrations of sugar, total NSCs and starch than smaller trees, indicating larger carbon stores. While total growth (normalised to basal area) declined with tree size, stem sugar was positively related to growth across sampling times, resulting in an inverse relationship between cumulative normalised growth across the study period and NSC concentrations driven by tree size effects. Similar to previous studies, we found significantly different NSC concentrations among different tissues consistent across tree sizes, with leaves having higher concentrations than roots and stem wood. Seasonal variations in stems and larger roots followed a similar trend, with the lowest values mainly in winter and spring followed by a gradual increase towards autumn; small diameter root concentrations displayed the opposite trend. The comparatively stable seasonal concentrations of NSCs are consistent with the findings of Jiménez-Castillo et al. [40] for a closely related southern conifer.

4.1. Methodological Challenges

TNC and starch measurements showed some inconsistencies. Specifically, some of the TNC values were smaller than the free sugar values, resulting in negative values for starch. The occasions where this occurred were not consistent between tissue or sampling dates, which points towards methodology issues, but glucose, fructose and starch standards run frequently during analysis showed no indication of drift. Most studies show higher starch than sugar concentrations (e.g., [6,53,54,55,56,57,58]), and even though the absolute values might not be comparable [59], the relative changes of starch and sugar can be compared. The starch control standard used was a purified corn starch and showed accurate measurements for all runs. In the tree tissue samples, there may have been incomplete hydrolysis of starch to soluble sugar, accounting for zero or near-zero values. As leaf, root and stem tissues are likely chemically different to corn starch, either the reaction time or the pH could have been incompatible with complete hydrolysis. Another possibility, although less probable (as this would have had an effect on sugar measurements as well), could be other substances present in the sample interfering with the photometric measurements [59]. These could be plant phenols, for instance [60]. Some NSC studies have added additional steps to their chemical protocols to extract phenols before the actual NSC analysis (e.g., [61]), which should be performed for future measurements. Additionally, higher acidity levels could be used during the starch digestion to aid the process of hydrolysis. Furthermore, a number of plant species (Pinus sylvestris, P. cembra, P. ponderosa, Tilia and Betula) store large amounts of lipids [24,55]. Lipids are fatty acids and, like starch, are used as a storage compound. Pinus sylvestris, for instance, had low sugar and starch concentrations, but lipid concentrations were substantial [55], so including lipids in future studies may provide more information about A. australis carbon dynamics. Despite these challenges, we believe our comparisons between seasons and trees of different sizes are valid.

4.2. NSC Concentrations in Tissues

Evergreen tree species, and especially conifers, generally have lower NSC levels compared to deciduous species [34,55,62], and our values were particularly low compared to values in the literature. However, given the methodological issues highlighted by Quentin et al. [59], we have refrained from undertaking an extensive comparison with published values because we are unsure if any differences are due to methodological differences or true differences with other species or plant functional types. Nevertheless, comparing relative differences in seasonal dynamics or different tissues amongst studies and differences within the same study is considered valid [59].
As expected, leaves showed the highest concentration of NSCs, followed by smaller, then larger, roots. The stems had the lowest concentrations (Figure 2). This is a common observation in NSC studies where concentrations in different organs are compared, and it occurs in evergreen and deciduous trees alike (e.g., [22,54,56,63,64,65,66,67,68]). The differences in concentration reflect the functions of the different organs [34]. NSCs are produced in the leaves [69], so one would expect the concentration of sugars in particular to be highest here. Branches also show high NSC concentrations, probably due to their close proximity to the leaves [63]. Concentrations in the stem drop considerably, but even though concentrations are low, stems can account for the greatest pool overall [67]. Considering this, A. australis likely have a large stem NSC pool because of the deep active sapwood, despite the low stem concentrations. Roots generally have higher concentrations than stems and starch concentrations can be even higher than in leaves [34], but the overall picture for roots is less clear as it is influenced greatly by the sampling strategy and the functional differences between sampled roots [70].

4.3. Seasonal NSC Dynamics

Overall, seasonal variations of NSC concentrations in stem and root wood were not significant in A. australis. Piispanen and Saranpää [5] suggested that seasonal oscillations are more pronounced in more seasonal climates with a clear distinction between more and less favourable conditions for C assimilation. Therefore, less pronounced seasonal variations in this maritime temperate climate were somewhat expected (e.g., [25,55,58]).
The mean stem sugar levels were lowest in October (spring), which is during the primary growing season. It is often reported that sugar levels are lowest right around the time of leaf flush [34,71], but this is more pronounced in deciduous compared to evergreen trees and more so in branches than in stems or roots [58]. In contrast, Guo et al. [72] found that leaf starch peaked in spring and wet periods. The onset of growth was around September in both study years, and leaf growth of A. australis usually begins a few weeks earlier than the onset of stem growth [73]. No marked decline can be reported for this time, as we did not capture that particular period with our measurements in A. australis. However, it can be assumed that the concentrations were low at that time since they were also relatively low during the sampling in late July. Over the summer, concentrations likely increased because of greater photosynthetic C supply and a continuous allocation of sugar to the stem. This pattern is consistent with other studies [55,64,66,74], and higher transpiration rates [75,76] for this period support this conclusion. Winter values were slightly higher than the lowest values in spring, indicating decreased supply from the leaves and greater respiratory demand relative to productivity. In comparison to transpiration rates, Macinnis-Ng et al. [52] demonstrated that stem respiration in winter does not drop as much, but is about half the rate of summer respiration in canopy-dominant trees, while efflux in intermediate trees remains relatively constant year-round. Canopy-dominant A. australis, consequently, have year-round C demand for respiration. NSCs used for respiration are often several years old [77], and can be up to a decade old [78] or older [4], which means that C demand for respiration is frequently met by NSCs from storage and not only from fresh assimilates. Richardson et al. [79] provided evidence for two physically distinct pools of NSCs with fast and slow cycling patterns. For A. australis, the patterns in individual trees were not as clear as the mean, with some trees showing the lowest values in winter instead of spring; however, the increase in sugars towards autumn was consistent among the study trees. In contrast, the trends in TNC and starch values were less clear than in the soluble sugars, a pattern which we attribute to the previously mentioned methodological issues.
While we recorded differences in NSC concentrations and growth rates according to tree size (discussed further below), there was also some indication that periods of high sugar concentrations were associated with higher BAI values. The linear regression revealed a clear positive relationship between free sugar and normalised basal area increment (Figure 5) and a weak negative relationship between growth and stem starch concentration. This indicates convergence in availability of sugars and rates of growth across different seasons. The nature of the relationship between sugars and starch and growth rates in A. australis is contrary to the findings of Furze et al. [80], who reported sugar pools peaking in the dormant season and starch pools peaking in the growing season across five trees species representative of forests of the northeastern USA. However, Furze et al. [80] measured smaller trees (DBH < 50 cm) and did not directly measure growth rates, so there are several possible explanations for the apparently conflicting results.
Root NSC values were not significantly different across seasons (Figure 4), but they did show some patterns. Larger root (>5 cm diameter) NSC dynamics followed the same seasonal patterns as stems, indicating a similar functional role [34] for storage and redistribution of resources. Dynamics in smaller roots were different than in larger roots, with high sugar and starch concentrations in winter followed by a decline during the growing season and lowest values in autumn, which is similar to root dynamics reported by Aubrey and Teskey [53] and Smith et al. [67] for starch concentrations of Pinus palustris and Eucalyptus species, respectively. This could be due to the conversion of starch to sugar and the subsequent use for growth and maintenance. As the smaller root dynamics and stem dynamics show differing trends, there might also be some transport of NSCs between the two organs. Roots are more likely to use stored NSCs for growth and respiration than stems are [81]. The difference in NSC dynamics and the lower stem growth rates during summer point towards different temporal growth dynamics, as root and shoot growth periods often alternate [82]. Root growth could predominantly occur during the summer months in A. australis and is in line with observations of potted A. australis seedlings exhibiting greater root than shoot growth during dryer conditions [83,84]. Additionally, A. australis are likely to rely on mycorrhiza to increase nutrient uptake, as soil fertility in kauri forests is low [85,86]. The decline in NSCs could therefore also point to maintenance of this symbiotic relationship at times when nutrients are most needed for photosynthesis and growth [70,81].

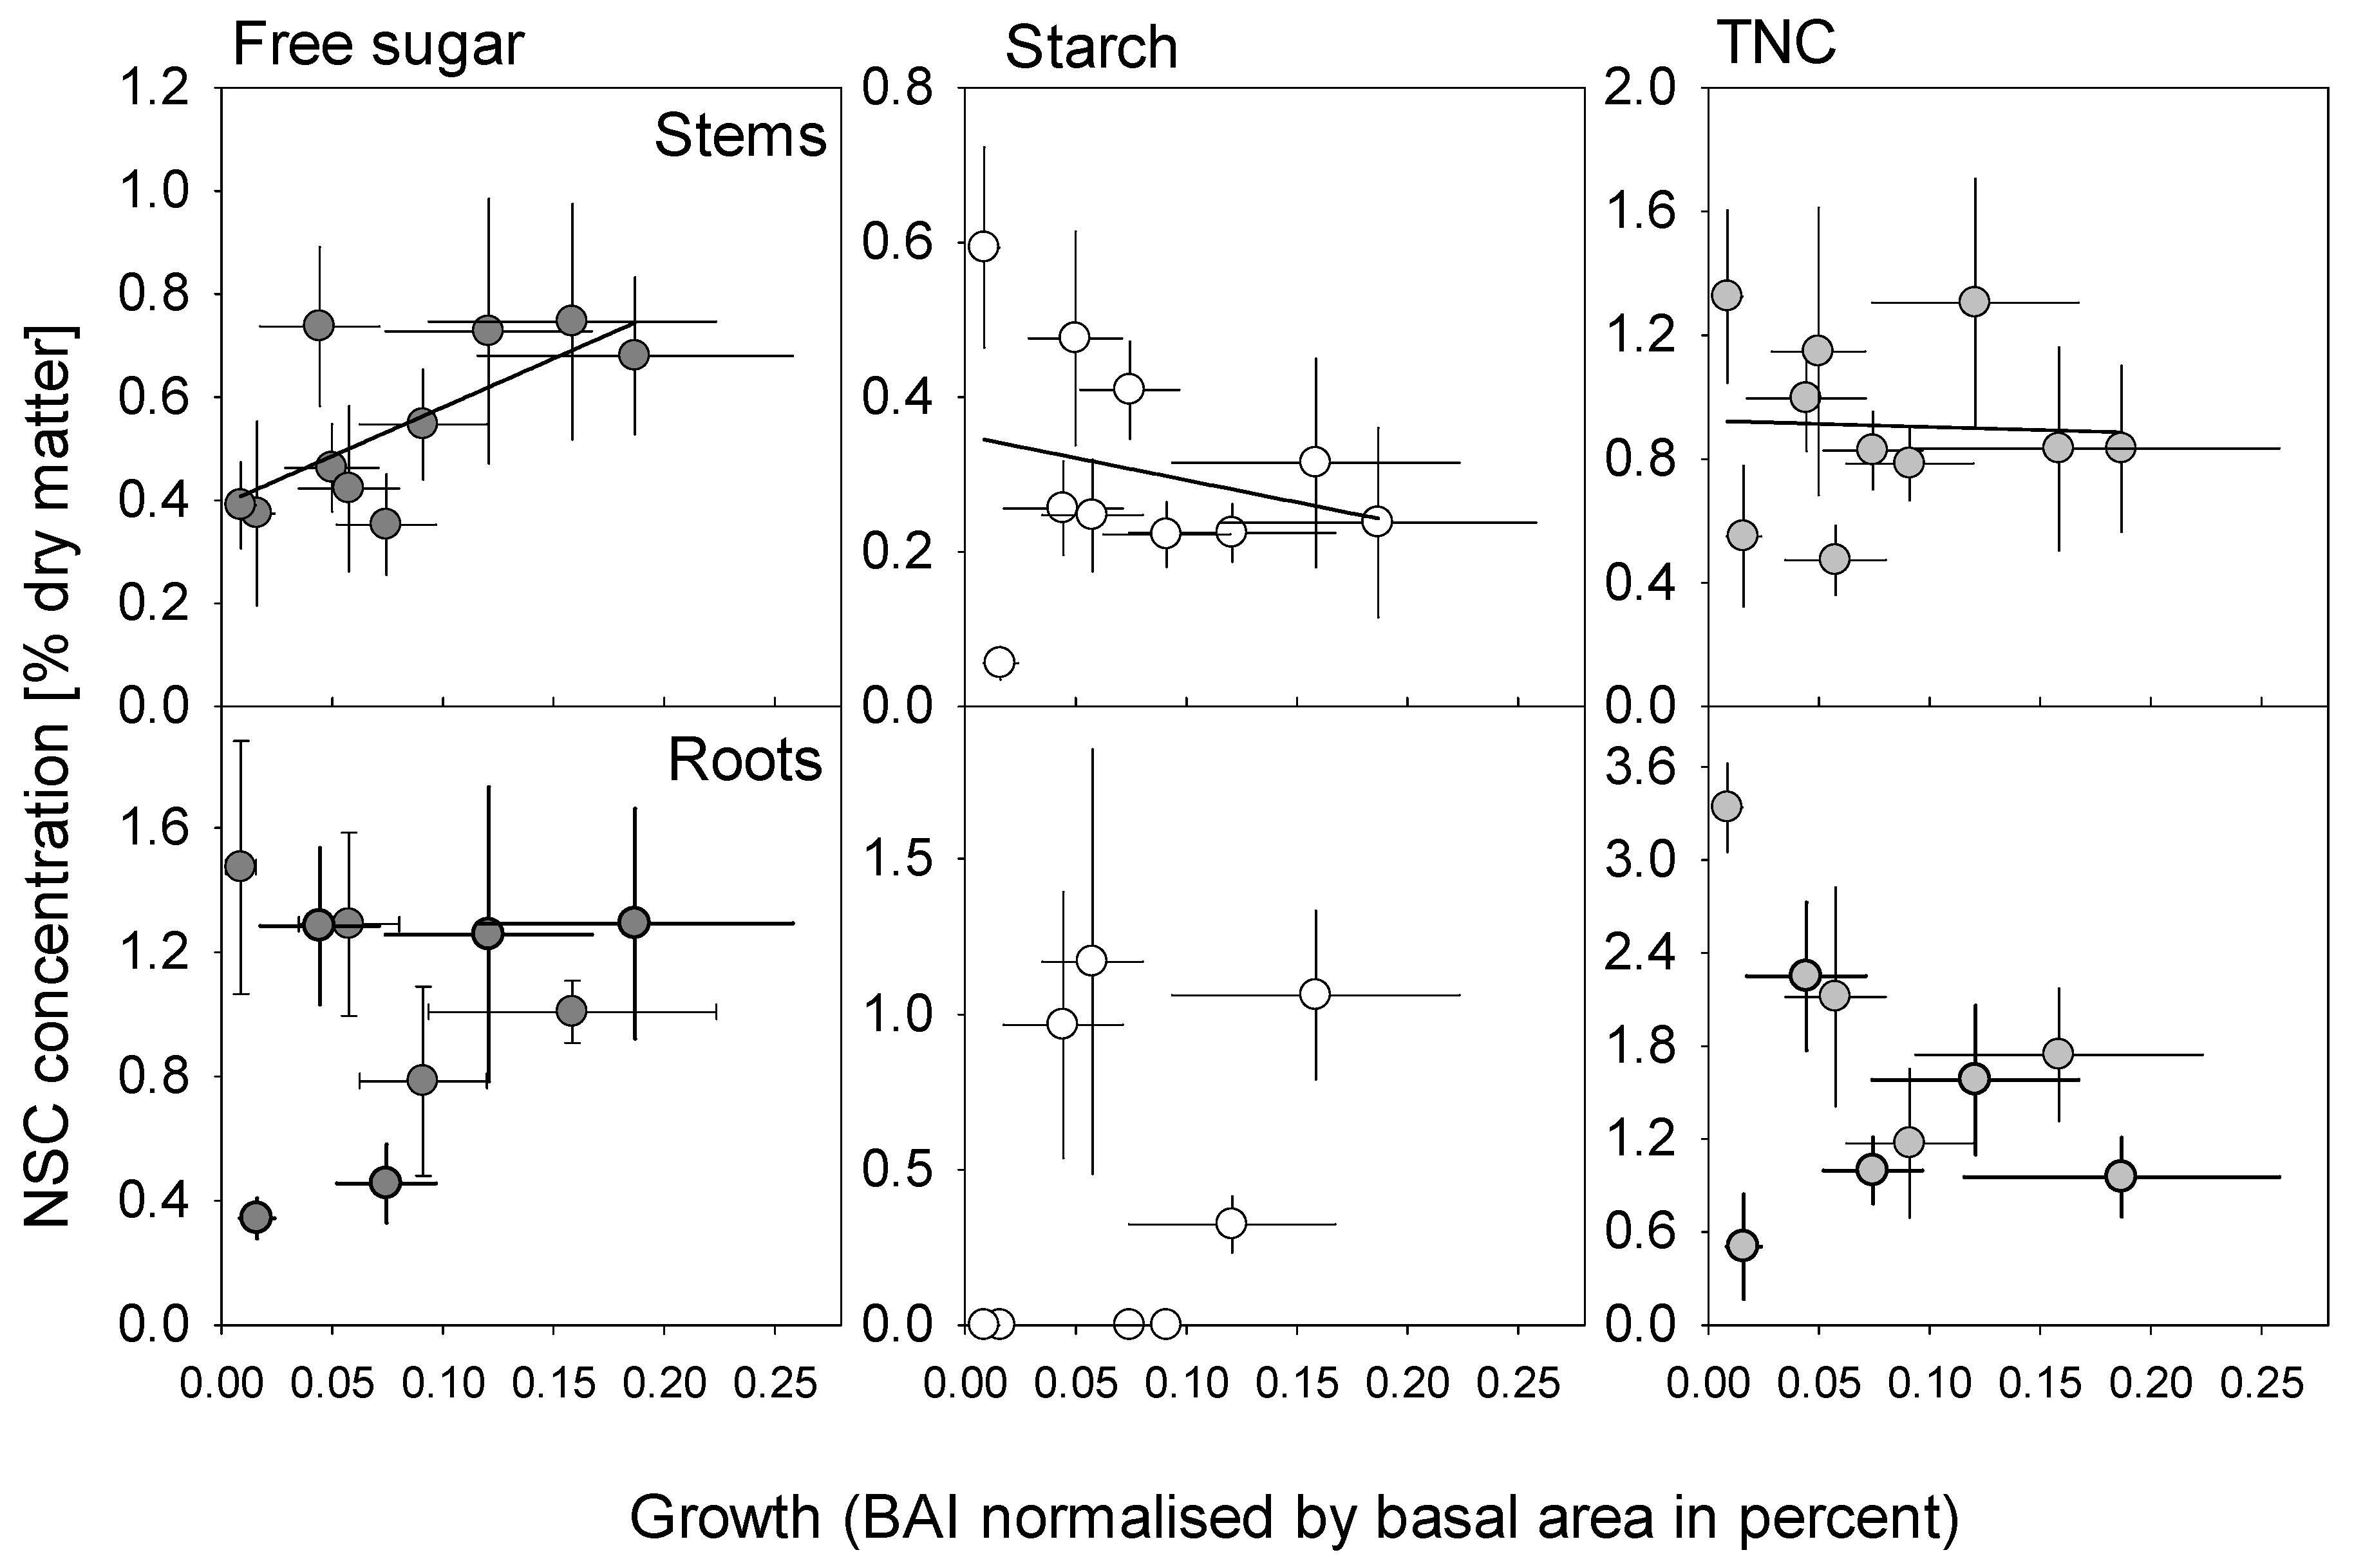
4.4. Relationships Between Tree Size, NSC Concentration and Growth

Our largest tree (175 cm DBH) has been aged at over 600 years using tree-ring analysis (A. Fowler, pers. comm.), while our smallest tree (20 cm DBH) may only be decades old. Our dataset therefore contributes to our understanding of NSC dynamics in long-lived trees as they age. Sala and Hoch [6] showed convincing evidence of increases in NSCs and lipids in larger Pinus ponderosa. They also found declining growth efficiency in taller trees, which is a common phenomenon [87]. While the effects of tree age have not been explicitly explored, we assume taller trees are also older, so we expect some commonality. Decreasing growth efficiency in older A. australis is consistent with different growth rates in different-sized trees [52] and also consistent with declining growth efficiency in taller trees. Similar results were reported by Woodruff and Meinzer [68], who measured NSC concentrations along a height gradient in Pseudotsuga menziesii, while Genet et al. [88] observed the same decrease in growth rates in Fagus sylvatica and Quercus petraea, but saw no apparent increase in NSC concentration with tree age. We note it is important to separate stand growth from the growth of individual large trees. Once a stand is sufficiently aged, growth may decline overall (due to the mortality of large trees) while surviving individual trees continue to grow [89,90].
There are several possible explanations for the increasing NSC concentrations as trees age. As trees grow older and taller, pathlength resistance increases, which causes greater xylem tension. As a result, turgor pressure is reduced [91], potentially limiting cell expansion, which, in turn, limits growth (hydraulic limitation hypothesis [87]). The reduction in growth is consequently due to sink limitation [25], which leads to an accumulation of NSCs, as shown by Sala and Hoch [6]. However, this is probably just one part of the story for A. australis; even though they can grow incredibly old, they do not grow very tall. In fact, the tallest living A. australis (Tāne Mahuta) is only 45.2 m tall [92], despite being older than a thousand years. Our sampled trees all have similar heights of 20–23 m (Table 1). The two larger trees probably have longer pathlengths because their crowns have more complex branching, but this alone cannot explain the substantially higher NSC concentrations.
The main difference between the two larger and the four smaller A. australis trees is the biomass. The trunks are much bigger, the crown branches out more and the leaf area is a lot greater in comparison. The larger leaf area is responsible for higher C acquisition, regardless of potentially lower stomatal conductance and assimilation of older A. australis due to hydraulic limitations. Therefore, C supply is higher in the two older individuals, which is one reason for the greater NSC concentration. Second, the larger biomass (leaves, branches, trunks and root system) creates an increased demand of NSCs for respiration. This can be thought of as a positive feedback loop whereby growth of more tissues enables increased resource capture, which in turn requires more resource use for maintenance. In other words, to avoid running out of carbon, larger trees need larger stores of NSCs to meet their respiratory costs. Macinnis-Ng et al. [52] measured stem efflux rates in the same forest and showed around 30%–50% higher rates (~3 µmol CO2 m−2 s−1) for trees from the dominant canopy class than for the co-dominant and intermediate classes (~1.5 to 2 µmol CO2 m−2 s−1). Considering the larger surface area of the stems of the two large A. australis, the difference in overall stem respiration would be substantial. The higher concentration of larger A. australis is therefore not only due to the size/age difference but also due to the higher C supply which is necessary because of the higher metabolic demand. Further research is needed to understand the interplay between the role of stem water storage [93,94] and NSC dynamics, especially under drought conditions [95,96].
A further consideration is the concurrent increase in NSC pools in larger trees (Figure 1) and declining growth efficiency in larger trees (Figure 3). In light of this result, the usefulness of NSC concentration as a proxy for the rate of C supply or productivity [12] remains questionable [54,68] since the ratio between NSC concentration and growth efficiency changes as trees age. NSC concentrations should only be used as a proxy for productivity within the same age/size group or the same tree over time. In addition, minimum thresholds of NSC concentrations required for tree survival as reported by Weber et al. [97] for a variety of seedlings cannot be simply used to assess the vigour of mature trees (even for the same species), as minimum NSC supply likely scales with age due to greater C demand for metabolic maintenance. Wiley and Helliker [28] advocated for more studies with simultaneous growth and NSC measurements, especially for larger trees. Our results support their suggestion that this combination of accumulating carbon reserves and declining growth is an active strategy to protect against carbon starvation under drought conditions and are consistent with the results of Jiménez-Castillo et al. [40] in a closely related species. A. australis also shows a drought–deciduous response to drying soils [41], so A. australis may have similar carbon storage maintenance strategies to the closely related Araucaria araucana. The importance of NSCs for protection and recovery of tree hydraulics under stress conditions is receiving growing attention [98], and this may be especially important for trees that are highly vulnerable to xylem embolism, such as A. australis [39].

5. Conclusions

While our dataset includes only a small number of trees, it contributes to the scarce literature on growth rates and NSC concentrations in large mature trees. We found older trees had higher concentrations of NSCs and lower growth efficiency, consistent with an increasingly protective carbon strategy. Seasonal dynamics of NSCs were small in A. australis and radial growth did not have an obvious impact on NSC stores, indicating that stem growth in A. australis relied mostly on fresh assimilates. The concentrations of NSCs in stems increased with age and the diameter of A. australis. The combination of declining growth efficiency and increasing NSC concentrations with age is likely evidence for active NSC accumulation to avoid carbon starvation. This strategy likely assists large trees during stressful periods, such as droughts, and indicates that larger trees may be more resilient under climate change. While A. australis shows evidence for hydraulic acclimation to dry periods, the role of NSCs in buffering drought impacts remains unclear, and this may be important for protecting ancient trees that take centuries to replace.

Author Contributions

J.K. and C.M.-N. designed the project and carried out field sampling; J.K. and B.M.C. conducted laboratory analysis; J.K. analysed the data and prepared the first draft of the manuscript. All authors have read and agreed to the published version of the manuscript.

Funding

This work was supported by the Marsden Fund under grant UOA1207 and a Rutherford Discovery Fellowship under grant RDF-UOA1504 from the Royal Society Te Apārangi.

Data Availability Statement

The raw data supporting the conclusions of this article will be made available by the authors on request.

Acknowledgments

We thank Daniel Taylor, Fredrik Hjelm, Scott Forrest and Chrissy Spence for assistance with tree climbing. Melanie Zacharias assisted with sample grinding. Thanks to Erin Wiley for advice on interpretation of our results.

Conflicts of Interest

The authors report there are no competing interests to declare.

References

  1. Dietze, M.C.; Sala, A.; Carbone, M.S.; Czimczik, C.I.; Mantooth, J.A.; Richardson, A.D.; Vargas, R. Nonstructural carbon in woody plants. Ann. Rev. Plant Biol. 2014, 65, 667–687. [Google Scholar] [CrossRef]
  2. Hartmann, H.; Trumbore, S. Understanding the roles of nonstructural carbohydrates in forest trees–from what we can measure to what we want to know. New Phytol. 2016, 211, 386–403. [Google Scholar] [CrossRef]
  3. Hoch, G.; Körner, C. The carbon charging of pines at the climatic treeline: A global comparison. Oecologia 2003, 135, 10–21. [Google Scholar] [CrossRef]
  4. Carbone, M.S.; Czimczik, C.I.; Keenan, T.F.; Murakami, P.F.; Pederson, N.; Schaberg, P.G.; Xu, X.; Richardson, A.D. Age, allocation and availability of nonstructural carbon in mature red maple trees. New Phyolt. 2013, 200, 1145–1155. [Google Scholar] [CrossRef] [PubMed]
  5. Piispanen, R.; Saranpää, P. Variation of non-structural carbohydrates in silver birch (Betula pendula Roth) wood. Trees 2001, 15, 444–451. [Google Scholar] [CrossRef]
  6. Sala, A.; Hoch, G. Height-related growth declines in ponderosa pine are not due to carbon limitation. Plant Cell Environ. 2009, 32, 22–30. [Google Scholar] [CrossRef]
  7. Hoch, G.; Körner, C. Global patterns of mobile carbon stores in trees at the high-elevation tree line. Glob. Ecol. Biogeogr. 2012, 21, 861–871. [Google Scholar] [CrossRef]
  8. Wang, X.; Hu, G.; Zhang, Q.; Quan, X.; Zhang, H.; Aubrey, D.P.; Wang, C. Annual Tree Biomass Increment Is Positively Related to Nonstructural Carbohydrate Pool Size and Depletion: Evidence for Carbon Limitation? Forests 2025, 16, 619. [Google Scholar] [CrossRef]
  9. Friend, A.D.; Eckes-Shephard, A.H.; Fonti, P.; Rademacher, T.T.; Rathgeber, C.B.K.; Richardson, A.D.; Turton, R.H. On the need to consider wood formation processes in global vegetation models and a suggested approach. Ann. For. Sci. 2019, 76, 1–13. [Google Scholar] [CrossRef]
  10. Hartmann, H.; Bahn, M.; Carbone, M.; Richardson, A.D. Plant carbon allocation in a changing world—Challenges and progress: Introduction to a Virtual Issue on carbon allocation: Introduction to a virtual issue on carbon allocation. New Phytol. 2020, 227, 981–988. [Google Scholar] [CrossRef]
  11. Fatichi, S.; Leuzinger, S.; Körner, C. Moving beyond photosynthesis: From carbon source to sink-driven vegetation modeling. New Phytol. 2014, 201, 1086–1095. [Google Scholar] [CrossRef]
  12. Sala, A.; Woodruff, D.R.; Meinzer, F.C. Carbon dynamics in trees: Feast or famine? Tree Physiol. 2012, 32, 764–775. [Google Scholar] [CrossRef] [PubMed]
  13. El Omari, B. Accumulation versus storage of total non-structural carbohydrates in woody plants. Trees 2022, 36, 869–881. [Google Scholar] [CrossRef]
  14. Gessler, A.; Zweifel, R. 2024. Beyond source and sink control–toward an integrated approach to understand the carbon balance in plants. New Phytol. 2024, 242, 858–869. [Google Scholar] [CrossRef]
  15. Begović, K.; Schurman, J.S.; Svitok, M.; Pavlin, J.; Langbehn, T.; Svobodová, K.; Mikoláš, M.; Janda, P.; Synek, M.; Marchand, W.; et al. Large old trees increase growth under shifting climatic constraints: Aligning tree longevity and individual growth dynamics in primary mountain spruce forests. Glob. Change Biol. 2023, 29, 143–164. [Google Scholar] [CrossRef]
  16. Landhäusser, S.M.; Adams, H.D. Getting to the root of carbon reserve dynamics in woody plants: Progress, challenges, and goals. Tree Physiol. 2024, 44, 1–10. [Google Scholar] [CrossRef] [PubMed]
  17. Allen, C.D.; Macalady, A.K.; Chenchouni, H.; Bachelet, D.; McDowell, N.; Vennetier, M.; Kitzberger, T.; Rigling, A.; Breshears, D.D.; Hogg, E.H.; et al. A global overview of drought and heat-induced tree mortality reveals emerging climate change risks for forests. For. Ecol. Manag. 2010, 259, 660–684. [Google Scholar] [CrossRef]
  18. Anderegg, W.R.L.; Hicke, J.A.; Fisher, R.A.; Allen, C.D.; Aukema, J.; Bentz, B.; Hood, S.; Lichstein, J.W.; Macalady, A.K.; McDowell, N.; et al. Tree mortality from drought, insects, and their interactions in a changing climate. New Phytol. 2015, 208, 674–683. [Google Scholar] [CrossRef]
  19. Stefaniak, E.Z.; Tissue, D.T.; Dewar, R.C.; Medlyn, B.E. Optimal carbon storage during drought. Tree Physiol. 2024, 44, 34–45. [Google Scholar] [CrossRef]
  20. O’Brien, M.J.; Leuzinger, S.; Philipson, C.D.; Tay, J.; Hector, A. Drought survival of tropical tree seedlings enhanced by non-structural carbohydrate levels. Nat. Clim. Change 2014, 4, 710–714. [Google Scholar] [CrossRef]
  21. Granda, E.; Camarero, J.J. Drought reduces growth and stimulates sugar accumulation: New evidence of environmentally driven non-structural carbohydrate use. Tree Physiol. 2017, 37, 997–1000. [Google Scholar] [CrossRef] [PubMed]
  22. Piper, F.I.; Fajardo, A.; Hoch, G. Single-provenance mature conifers show higher non-structural carbohydrate storage and reduced growth in a drier location. Tree Physiol. 2017, 37, 1001–1010. [Google Scholar] [CrossRef] [PubMed]
  23. Körner, C. Paradigm shift in plant growth control. Curr. Opin. Plant Biol. 2015, 25, 107–114. [Google Scholar] [CrossRef]
  24. Hoch, G.; Popp, M.; Körner, C. Altitudinal increase of mobile carbon pools in Pinus cembra suggests sink limitation of growth at the Swiss treeline. Oikos 2002, 98, 361–374. [Google Scholar] [CrossRef]
  25. Körner, C. Carbon limitation in trees. J. Ecol. 2003, 91, 4–17. [Google Scholar] [CrossRef]
  26. McDowell, N.G.; Fisher, R.A.; Xu, C.; Domec, J.C.; Hölttä, T.; Mackay, D.S.; Sperry, J.S.; Boutz, A.; Dickman, L.; Gehres, N.; et al. Evaluating theories of drought-induced vegetation mortality using a multimodel–experiment framework. New Phytol. 2013, 200, 304–321. [Google Scholar] [CrossRef]
  27. Sala, A.; Piper, F.; Hoch, G. Physiological mechanisms of drought-induced tree mortality are far from being resolved. New Phytol. 2010, 186, 274–281. [Google Scholar] [CrossRef]
  28. Wiley, E.; Helliker, B. A re-evaluation of carbon storage in trees lends greater support for carbon limitation to growth. New Phytol. 2012, 195, 285–289. [Google Scholar] [CrossRef]
  29. Schippers, P.; Vlam, M.; Zuidema, P.A.; Sterck, F. Sapwood allocation in tropical trees: A test of hypotheses. Funct. Plant Biol. 2015, 42, 697–709. [Google Scholar] [CrossRef]
  30. Silpi, U.; Lacointe, A.; Kasempsap, P.; Thanysawanyangkura, S.; Chantuma, P.; Gohet, E.; Musigamart, N.; Clément, A.; Améglio, T.; Thaler, P. Carbohydrate reserves as a competing sink: Evidence from tapping rubber trees. Tree Physiol. 2007, 27, 881–889. [Google Scholar] [CrossRef]
  31. Hartmann, H.; Adams, H.D.; Hammond, W.M.; Hoch, G.; Landhäusser, S.M.; Wiley, E.; Zaehle, S. Identifying differences in carbohydrate dynamics of seedlings and mature trees to improve carbon allocation in models for trees and forests. Environ. Exper. Bot. 2018, 152, 7–18. [Google Scholar] [CrossRef]
  32. Oswald, S.W.; Aubrey, D.P. Modeling starch dynamics from seasonal variations of photosynthesis, growth and respiration. Tree Physiol. 2024, 44, 11–27. [Google Scholar] [CrossRef]
  33. Blumstein, M.; Sala, A.; Weston, D.J.; Holbrook, N.M.; Hopkins, R. Plant carbohydrate storage: Intra-and inter-specific trade-offs reveal a major life history trait. New Phytol. 2022, 235, 2211–2222. [Google Scholar] [CrossRef]
  34. Martínez-Vilalta, J.; Sala, A.; Asensio, D.; Galiano, L.; Hoch, G.; Palacio, S.; Piper, F.I.; Lloret, F. Dynamics of non-structural carbohydrates in terrestrial plants: A global synthesis. Ecol. Monogr. 2016, 86, 495–516. [Google Scholar] [CrossRef]
  35. Steward, G.A.; Beveridge, A.E. A review of New Zealand kauri (Agathis australis (D. Don) Lindl.): Its ecology, history, growth and potential for management for timber. N. Z. J. For. Sci. 2010, 40, 33–59. [Google Scholar]
  36. Enright, N.J.; Ogden, J. The southern conifers—A synthesis. In Ecology of the Southern Conifers; Enright, N.J., Hill, R.S., Eds.; Melbourne University Press: Melbourne, Australia, 1995; pp. 271–287. [Google Scholar]
  37. Macinnis-Ng, C.; Wyse, S.; Veale, A.; Schwendenmann, L.; Clearwater, M. Sap flow of the southern conifer, Agathis australis during wet and dry summers. Trees 2016, 30, 19–33. [Google Scholar] [CrossRef]
  38. Macinnis-Ng, C.; Webb, T.; Lin, Y.-S.; Schwendenmann, L.; Medlyn, B. Leaf age-related and diurnal variation in gas exchange of kauri (Agathis australis). N. Z. J. Bot. 2017, 55, 80–99. [Google Scholar] [CrossRef]
  39. Pittermann, J.; Sperry, J.S.; Hacke, U.G.; Wheeler, J.K.; Sikkema, E.H. Inter-tracheid pitting and the hydraulic efficiency of conifer wood: The role of tracheid allometry and cavitation protection. Am. J. Bot. 2006, 93, 1265–1273. [Google Scholar] [CrossRef] [PubMed]
  40. Jiménez-Castillo, M.; Fajardo, A.; Lobos-Catalán, P.; Torres-Morales, P.; Piper, F.I. No carbon shortage in declining trees of the isohydric species Araucaria araucana (Molina) K. Koch under drought. Ann. For. Sci. 2022, 79, 10. [Google Scholar] [CrossRef]
  41. Macinnis-Ng, C.; Schwendenmann, L. Litterfall, carbon and nitrogen cycling in a southern hemisphere conifer forest dominated by kauri (Agathis australis) during drought. Plant Ecol. 2015, 216, 247–262. [Google Scholar] [CrossRef]
  42. Thomas, G.; Ogden, J. The scientific reserves of Auckland University. I. General introduction to their history, vegetation, climate and soils. Tane 1983, 29, 143–162. [Google Scholar]
  43. Wunder, J.; Perry, G.L.W.; McCloskey, S.P.J. Structure and Composition of a Mature Kauri (Agathis australis) Stand at Huapai Scientific Reserve, Waitakere Range; Tree-Ring Laboratory Report; School of Environment, The University of Auckland: Auckland, New Zealand, 2010. [Google Scholar]
  44. Meinzer, F.; Goldstein, G.; Andrade, J. Regulation of water flux through tropical forest canopy trees: Do universal rules apply? Tree Physiol. 2001, 21, 19–26. [Google Scholar] [CrossRef]
  45. Macinnis-Ng, C.; Schwendenmann, L.; Clearwater, M.J. Radial variation of sap flow of kauri (Agathis australis) during wet and dry summers. Acta Hortic. 2013, 991, 205–213. [Google Scholar] [CrossRef]
  46. Rossi, S.; Anfodillo, T.; Menardi, R. Trephor: A New Tool for Sampling Microcores from tree stems. IAWA J. 2006, 27, 89–97. [Google Scholar] [CrossRef]
  47. Beever, R.; Waipara, N.; Ramsfield, T.; Dick, M.; Horner, I. Kauri (Agathis australis) under threat from Phytophthora. Phytophthoras For. Nat. Ecosyst. 2009, 74, 74–85. [Google Scholar]
  48. Forest, F.; Moat, J.; Baloch, E.; Brummitt, N.; Bachman, S.; Ickert-Bond, S.; Hollingsworth, P.; Liston, A.; Little, D.P.; Mathews, S.; et al. Gymnosperms on the EDGE. Sci. Rep. 2018, 8, 1–11. [Google Scholar] [CrossRef] [PubMed]
  49. Popp, M.; Lied, W.; Meyer, A.J.; Richter, A.; Schiller, P.; Schwitte, H. Sample preservation for determination of organic compounds: Microwave versus freeze-drying. J. Exp. Bot. 1996, 47, 1469–1473. [Google Scholar] [CrossRef]
  50. Wong, S.-C. Elevated atmospheric partial pressure of CO2 and plant growth: II. Non-structural carbohydrate content in cotton plants and its effect on growth parameters. Photosynth. Res. 1990, 23, 171–180. [Google Scholar] [CrossRef] [PubMed]
  51. Bachofen, C.; Moser, B.; Hoch, G.; Ghazoul, J.; Wohlgemuth, T. No carbon “bet hedging” in pine seedlings under prolonged summer drought and elevated CO2. J. Ecol. 2018, 106, 31–46. [Google Scholar] [CrossRef]
  52. Macinnis-Ng, C.; Wyse, S.V.; Webb, T.; Taylor, D.; Schwendenmann, L. Sustained carbon uptake in a mixed age southern conifer forest. Trees 2017, 31, 967–980. [Google Scholar] [CrossRef]
  53. Aubrey, D.P.; Teskey, R.O. Stored root carbohydrates can maintain root respiration for extended periods. New Phytol. 2018, 218, 142–152. [Google Scholar] [CrossRef]
  54. Fajardo, A.; Piper, F.I.; Hoch, G. Similar variation in carbon storage between deciduous and evergreen treeline species across elevational gradients. Ann. Bot. 2013, 112, 623–631. [Google Scholar] [CrossRef]
  55. Hoch, G.; Richter, A.; Körner, C. Non-structural carbon compounds in temperate forest trees. Plant Cell Environ. 2003, 26, 1067–1081. [Google Scholar] [CrossRef]
  56. Klein, T.; Hoch, G.; Yakir, D.; Körner, C. Drought stress, growth and nonstructural carbohydrate dynamics of pine trees in a semi-arid forest. Tree Physiol. 2014, 34, 981–992. [Google Scholar] [CrossRef] [PubMed]
  57. Michelot, A.; Simard, S.; Rathgeber, C.; Dufrêne, E.; Damesin, C. Comparing the intra-annual wood formation of three European species (Fagus sylvatica, Quercus petraea and Pinus sylvestris) as related to leaf phenology and non-structural carbohydrate dynamics. Tree Physiol. 2012, 32, 1033–1045. [Google Scholar] [CrossRef]
  58. Newell, E.; Mulkey, S.; Wright, J. Seasonal patterns of carbohydrate storage in four tropical tree species. Oecologia 2002, 131, 333–342. [Google Scholar] [CrossRef]
  59. Quentin, A.G.; Pinkard, E.A.; Ryan, M.G.; Tissue, D.T.; Baggett, L.S.; Adams, H.D.; Maillard, P.; Marchand, J.; Landhäusser, S.M.; Lacointe, A.; et al. Non-structural carbohydrates in woody plants compared among laboratories. Tree Physiol. 2015, 35, 1146–1165. [Google Scholar] [CrossRef]
  60. Hendrix, D.L.; Peelen, K.K. Artifacts in the Analysis of Plant Tissues for Soluble Carbohydrates. Crop Sci. 1987, 27, 710–715. [Google Scholar] [CrossRef]
  61. Gruber, A.; Pirkebner, D.; Florian, C.; Oberhuber, W. No evidence for depletion of carbohydrate pools in Scots pine (Pinus sylvestris L.) under drought stress. Plant Biol. 2012, 14, 142–148. [Google Scholar] [CrossRef]
  62. Würth, M.K.; Pelaez-Riedl, S.; Wright, S.J.; Körner, C. Non-structural carbohydrate pools in a tropical forest. Oecologia 2005, 143, 11–24. [Google Scholar] [CrossRef] [PubMed]
  63. Barbaroux, C.; Bréda, N.; Dufrêne, E. Distribution of above-ground and below-ground carbohydrate reserves in adult trees of two contrasting broad-leaved species (Quercus petraea and Fagus sylvatica). New Phytol. 2003, 157, 605–615. [Google Scholar] [CrossRef] [PubMed]
  64. Jung, Y.; Burd, A. Seasonal changes in above- and below-ground non-structural carbohydrates (NSC) in Spartina alterniflora in a marsh in Georgia, USA. Aquat. Bot. 2017, 140, 13–22. [Google Scholar] [CrossRef]
  65. Kannenberg, S.A.; Novick, K.A.; Phillips, R.P. Coarse roots prevent declines in whole-tree non-structural carbohydrate pools during drought in an isohydric and an anisohydric species. Tree Physiol. 2018, 38, 582–590. [Google Scholar] [CrossRef] [PubMed]
  66. Klein, T.; Vitasse, Y.; Hoch, G. Coordination between growth, phenology and carbon storage in three coexisting deciduous tree species in a temperate forest. Tree Physiol. 2016, 36, 847–855. [Google Scholar] [CrossRef]
  67. Smith, M.G.; Miller, R.E.; Arndt, S.K.; Kasel, S.; Bennett, L.T. Whole-tree distribution and temporal variation of non-structural carbohydrates in broadleaf evergreen trees. Tree Physiol. 2018, 38, 570–581. [Google Scholar] [CrossRef]
  68. Woodruff, D.R.; Meinzer, F.C. Water stress, shoot growth and storage of non-structural carbohydrates along a tree height gradient in a tall conifer. Plant Cell Environ. 2011, 34, 1920–1930. [Google Scholar] [CrossRef]
  69. Chapin III, F.S.; Schulze, E.-D.; Mooney, H.A. The ecology and economics of storage in plants. Annu. Rev. Ecol. Syst. 1990, 21, 423–447. [Google Scholar] [CrossRef]
  70. McCormack, M.L.; Dickie, I.A.; Eissenstat, D.M.; Fahey, T.J.; Fernandez, C.W.; Guo, D.; Helmisaari, H.; Hobbie, E.A.; Iversen, C.M.; Jackson, R.B.; et al. Redefining fine roots improves understanding of below-ground contributions to terrestrial biosphere processes. New Phytol. 2015, 207, 505–518. [Google Scholar] [CrossRef]
  71. Palacio, S.; Camarero, J.J.; Maestro, M.; Alla, A.Q.; Lahoz, E.; Montserrat-Martí, G. Are storage and tree growth related? Seasonal nutrient and carbohydrate dynamics in evergreen and deciduous Mediterranean oaks. Trees 2018, 32, 777–790. [Google Scholar] [CrossRef]
  72. Guo, J.S.; Gear, L.; Hultine, K.R.; Koch, G.W.; Ogle, K. Non-structural carbohydrate dynamics associated with antecedent stem water potential and air temperature in a dominant desert shrub. Plant Cell Environ. 2020, 43, 1467–1483. [Google Scholar] [CrossRef]
  73. Ogden, J.; Ahmed, M. Climate response function analyses of kauri (Agathis australis) tree-ring chronologies in northern New Zealand. J. R. Soc. N. Z. 1989, 19, 205–221. [Google Scholar] [CrossRef]
  74. Deslauriers, A.; Giovannelli, A.; Rossi, S.; Castro, G.; Fragnelli, G.; Traversi, L. Intra-annual cambial activity and carbon availability in stem of poplar. Tree Physiol. 2009, 29, 1223–1235. [Google Scholar] [CrossRef]
  75. Kaplick, J.; Clearwater, M.J.; Macinnis-Ng, C. Comparative water relations of co-occurring trees in a mixed podocarp-broadleaf forest. J. Plant Ecol. 2018, 12, 163–175. [Google Scholar] [CrossRef]
  76. Zhao, X.; Zhao, P.; Zhu, L.; Wang, Q.; Hu, Y.; Cranston, B.M.; Kaplick, J.; Lei, O.; Chen, X.; Ni, G.; et al. Exploring the influence of biological traits and environmental drivers on water use variations across contrasting forests. Forests 2021, 12, 161. [Google Scholar] [CrossRef]
  77. Muhr, J.; Angert, A.; Negrón-Juárez, R.I.; Muñoz, W.A.; Kraemer, G.; Chambers, J.Q.; Trumbore, S.E. Carbon dioxide emitted from live stems of tropical trees is several years old. Tree Physiol. 2013, 33, 743–752. [Google Scholar] [CrossRef]
  78. Muhr, J.; Trumbore, S.; Higuchi, N.; Kunert, N. Living on borrowed time–Amazonian trees use decade-old storage carbon to survive for months after complete stem girdling. New Phytol. 2018, 220, 111–120. [Google Scholar] [CrossRef]
  79. Richardson, A.D.; Carbone, M.S.; Huggett, B.A.; Furze, M.E.; Czimczik, C.I.; Walker, J.C.; Xu, X.; Schaberg, P.G.; Murakami, P. Distribution and mixing of old and new nonstructural carbon in two temperate trees. New Phytol. 2015, 206, 590–597. [Google Scholar] [CrossRef]
  80. Furze, M.E.; Huggett, B.A.; Aubrecht, D.M.; Stolz, C.D.; Carbone, M.S.; Richardson, A.D. Whole-tree nonstructural carbohydrate storage and seasonal dynamics in five temperate species. New Phytol. 2019, 221, 1466–1477. [Google Scholar] [CrossRef] [PubMed]
  81. Langley, J.; Drake, B.; Hungate, B. Extensive belowground carbon storage supports roots and mycorrhizae in regenerating scrub oaks. Oecologia 2002, 131, 542–548. [Google Scholar] [CrossRef] [PubMed]
  82. Herrmann, S.; Buscot, F. Why and How Using Micropropagated Trees rather than Germinations for Controlled Synthesis of Ectomycorrhizal Associations? In Mycorrhiza: State of the Art, Genetics and Molecular Biology, Eco-Function, Biotechnology, Eco-Physiology, Structure and Systematics; Varma, A., Ed.; Springer: Berlin, Germany, 2008; pp. 439–465. [Google Scholar]
  83. Bieleski, R. Factors affecting growth and distribution of kauri (Agathis australis Salisb.) III. Effect of temperature and soil conditions. Aust. J. Bot. 1959, 7, 279–294. [Google Scholar] [CrossRef]
  84. Wyse, S.V.; Macinnis-Ng, C.M.O.; Burns, B.R.; Clearwater, M.J.; Schwendenmann, L. Species assemblage patterns around a dominant emergent tree are associated with drought resistance. Tree Physiol. 2013, 33, 1269–1283. [Google Scholar] [CrossRef]
  85. Padamsee, M.; Johansen, R.B.; Stuckey, S.A.; Williams, S.E.; Hooker, J.E.; Burns, B.R.; Bellgard, S.E. The arbuscular mycorrhizal fungi colonising roots and root nodules of New Zealand kauri Agathis australis. Fungal Biol. 2016, 120, 807–817. [Google Scholar] [CrossRef]
  86. Silvester, W.B. The biology of kauri (Agathis australis) in New Zealand II. Nitrogen cycling in four kauri forest remnants. N. Z. J. Bot. 2000, 38, 205–220. [Google Scholar] [CrossRef]
  87. Ryan, M.G.; Yoder, B.J. Hydraulic limits to tree height and tree growth. BioScience 1997, 47, 235–242. [Google Scholar] [CrossRef]
  88. Genet, H.; Bréda, N.; Dufrêne, E. Age-related variation in carbon allocation at tree and stand scales in beech (Fagus sylvatica L.) and sessile oak (Quercus petraea (Matt.) Liebl.) using a chronosequence approach. Tree Physiol. 2010, 30, 177–192. [Google Scholar] [CrossRef]
  89. Sillett, S.C.; Van Pelt, R.; Koch, G.W.; Ambrose, A.R.; Carroll, A.L.; Antoine, M.E.; Mifsud, B.M. Increasing wood production through old age in tall trees. For. Ecol. Manag. 2010, 259, 976–994. [Google Scholar] [CrossRef]
  90. Stephenson, N.L.; Das, A.J.; Condit, R.; Russo, S.E.; Baker, P.J.; Beckman, N.G.; Coomes, D.A.; Lines, E.R.; Morris, W.K.; Rüger, N.; et al. Rate of tree carbon accumulation increases continuously with tree size. Nature 2014, 507, 90–93. [Google Scholar] [CrossRef] [PubMed]
  91. Woodruff, D.R.; Bond, B.J.; Meinzer, F.C. Does turgor limit growth in tall trees? Plant Cell Environ. 2004, 27, 229–236. [Google Scholar] [CrossRef]
  92. Cadwallader BG (2011) The New Zealand Tree Register. Available online: https://register.notabletrees.org.nz/tree/view/800 (accessed on 19 October 2022).
  93. Kaplick, J.; Clearwater, M.J.; Macinnis-Ng, C. Stem water storage of New Zealand kauri (Agathis australis). Acta Hortic. 2017, 1222, 59–66. [Google Scholar] [CrossRef]
  94. Cranston, B.M.; Macinnis-Ng, C. Saving some for later: Seasonal variations in sap flow, withdrawal and elastic storage in large trees under throughfall exclusion. Acta Hortic. 2023, 1419, 143–152. [Google Scholar] [CrossRef]
  95. Zhao, X.; Cranston, B.M.; Macinnis-Ng, C. Water relations of the southern conifer Agathis australis in a throughfall exclusion experiment. Acta Hortic. 2019, 1300, 73–80. [Google Scholar] [CrossRef]
  96. Cranston, B.M.; Powers, B.F.; Macinnis-Ng, C. Inexpensive throughfall exclusion experiment for single large trees. Appl. Plant Sci. 2020, 8, e11325. [Google Scholar] [CrossRef] [PubMed]
  97. Weber, R.; Schwendener, A.; Schmid, S.; Lambert, S.; Wiley, E.; Landhäusser, S.; Hartmann, H.; Hoch, G. Living on next to nothing: Tree seedlings can survive weeks with very low carbohydrate concentrations. New Phytol. 2018, 218, 107–118. [Google Scholar] [CrossRef] [PubMed]
  98. Tomasella, M.; Petrussa, E.; Petruzzellis, F.; Nardini, A.; Casolo, V. The possible role of non-structural carbohydrates in the regulation of tree hydraulics. Int. J. Mol. Sci. 2020, 21, 144. [Google Scholar] [CrossRef]
Figure 1. Relationship between DBH and mean concentrations of low molecular weight (free) sugars, starch and total non-structural carbohydrates (TNCs) in stems (top row) and roots pooled across larger (>5 cm) and smaller roots (1–3 cm diameter) (bottom row) of the six studied A. australis pooled across the sampling period for each tree. Note variable scales on y-axes. Error bars represent the standard errors of the means. The regression coefficient (R2) is given with * (p < 0.05) or ** (p < 0.001) indicating significance. Regression relationships were non-significant for roots.
Forests 16 01270 g001
Figure 2. Comparison of mean values of free sugars, total non-structural carbohydrates (TNCs) and starch for all samples by tissue type (L—leaves, S—stems, C—larger roots (>5 cm diameter), F—smaller roots (<5 cm diameter)). Error bars represent the standard errors of the means. Tissues showed significant differences in their means when the letters above the bars are different to other bars (one-way ANOVA and Tukey’s post hoc comparison). For free sugars, n = 13, 47, 13 and 19 for L, S, C and F, respectively. For TNC and starch, n = 13, 40, 11 and 14 for L, S, C and F, respectively.
Forests 16 01270 g002
Figure 3. Cumulative basal area increment normalised to stem cross-sectional area across the thirty-month study period. Inset shows relationship between diameter at breast height (DBH) and total normalised area increment across the 2 y study period. Line indicates linear regression, R2 = 0.79. See Table 1 for details about tree size.
Forests 16 01270 g003
Figure 4. Seasonal patterns of area-normalised basal area increment (BAI) (top panel), stem NSC concentrations (middle panel) and root NSC concentrations for larger and smaller roots (lower panel). All values represent means and standard errors pooled across all trees. Smaller roots were sampled later in the sample period because larger roots were not available. Each point in the top panel represents the mean basal area change since the last measurement, standardised to the basal area (growth efficiency). All error bars represent standard errors of the means. Austral summer occurs from December to February. Different letters above starch values for stems indicate statistically different groups. Where there is no letter shown, there were no significantly different groups.
Forests 16 01270 g004
Figure 5. Relationships between growth (measured as basal area increment) and sugar, starch and total non-structural carbohydrates in stems (upper row) and roots (lower row). Each point represents one sampling time period with values averaged across all trees (n = 6) to capture convergence in temporal patterns of NSCs and BAI. Lines indicate significant regression relationships. Pearson’s product moment r value was 0.46 (p < 0.05) for stem sugar vs. BAI, but all other r values were <0.1.
Forests 16 01270 g005
Figure 6. Relationship between total basal area increment standardised to basal area (m2 m−2) (ac), sapwood area (df) and total raw growth (gi) across the two-year sample period and stem values of free sugar (top row), total non-structural carbohydrates (middle row) and starch (lower row). All points show the mean for one tree with the standard error of the mean. Values were pooled across the whole sampling period. Plotted lines are exponential decay curves (ac) and inverse first-order polynomial functions (df). Tree size increases moving left to right on the plots.
Forests 16 01270 g006
Table 1. Overview of the sampled trees. Leaves were sampled only once (February 2015). Stem and root tissue samples were taken at least seasonally. All trees were similar heights of 20–23 m. Different tissue samples were collected for trees marked x.
Tree SpeciesIDDBH in cmCanopy PositionLeaf NSCStem Tissue NSCRoot Tissue NSC
Agathis
australis
1 (B079)19.8Intermediate x
2 (A046)38.4Co-dominant x
3 (A109)44.5Co-dominant xx
4 (A050)77.6Dominantxxx
5 (C022)128.0Dominant xx
6 (D024)174.2Dominantxxx
Table 2. Analysis of variance. Stars in brackets (*) indicate significant differences (* p < 0.05, *** p < 0.001) found during the analysis of variance but not in the following Tukey’s pairwise comparisons. Means for different dates or different trees were only compared within the same tissue type. Degrees of freedom (df) values are the numerator.
EffectResponse VariabledfF Ratiop ValuedfF Ratiop ValuedfF Ratiop Value
Tissue typeTNC concentration332.88<0.001 ***
Free sugar concentration331.66<0.001 ***
Starch concentration38.891<0.001 ***
Stem tissueLarger roots (~5 cm diameter)Smaller roots (1–3 cm diameter)
DateTNC concentration91.3770.2343.1480.0637.9550.19
Free sugar concentration90.9660.4843.1630.048 (*)42.4190.13
Starch concentration94.700<0.001 ***40.6680.6320.1030.90
TreeTNC concentration511.77<0.001 ***31.1790.3634.7930.03 *
Free sugar concentration58.073<0.001 ***30.8670.4830.7570.55
Starch concentration51.2140.32333.3280.0723.8530.10
Disclaimer/Publisher’s Note: The statements, opinions and data contained in all publications are solely those of the individual author(s) and contributor(s) and not of MDPI and/or the editor(s). MDPI and/or the editor(s) disclaim responsibility for any injury to people or property resulting from any ideas, methods, instructions or products referred to in the content.

