Article

Climate Change Mitigation ODA Improved the Human Development Index but Had a Limited Impact on Greenhouse Gas Mitigation

Forest Strategy Division, Future Forest Strategy Department, National Institute of Forest Science, Seoul 02455, Republic of Korea
*
Author to whom correspondence should be addressed.
Forests 2025, 16(8), 1247; https://doi.org/10.3390/f16081247
Submission received: 16 June 2025 / Revised: 17 July 2025 / Accepted: 28 July 2025 / Published: 31 July 2025
(This article belongs to the Section Forest Economics, Policy, and Social Science)

Abstract

Climate change mitigation Official Development Assistance (ODA) primarily aims to reduce greenhouse gas (GHG) emissions in developing countries while also seeking to enhance human welfare as a fundamental goal of development aid. This study investigates whether climate mitigation ODA contributes to achieving the principles of the doughnut framework—staying within the ecological ceiling (mitigating GHG emissions) while meeting the social foundation (enhancing human development index, HDI). We analyzed data from 77 developing countries between 2010 and 2020, including subgroup analyses by income level (high-, middle-, and low-income groups), using an instrumental variable–fixed effect approach. The results show that climate change mitigation ODA significantly improved the HDI but had no impact on reducing overall GHG emissions, including fossil fuel-based and land use change and forestry-based mitigations. When disaggregated by income level, ODA was found to improve the HDI and reduce fossil fuel-based GHG emission in low-income countries; however, these effects weakened as income levels increased. Across all income groups, there was no significant reduction in GHG emissions resulting from land use change or forestry. These findings suggest that climate change mitigation ODA can yield a greater impact when prioritized for low-income countries and that current ODA strategies for addressing GHG emissions related to land use change and forestry should be reconsidered.

Graphical Abstract

1. Introduction

Official Development Assistance (ODA) refers to “government aid that promotes and specifically targets the economic development and welfare of developing countries” [1]. Initially, ODA primarily focused on poverty eradication and economic growth in developing countries. However, its scope has recently expanded to address quality of life and environmental issues, aligning with the Sustainable Development Goals (SDGs) [2,3]. The scale of global ODA has also increased, reaching USD 288 billion in 2023, and continues to serve as an important source of relatively stable and predictable external financing for developing countries [4].
With the growing interest in SDGs, the demand for ODA aimed at environmental improvement and sustainable development is increasing [5]. Such ODA can be identified using the environmental marker or Rio markers, which include markers for climate change mitigation, climate change adaption, biodiversity, and desertification. The environmental marker indicates that the primary objective of bilateral ODA is environmental improvement, whereas the Rio markers signify alignment with the goals of the Rio Conventions. For example, the climate change mitigation and adaptation markers correspond to the objectives of the United Nations Framework Convention on Climate Change (UNFCCC); the biodiversity conservation marker aligns with the United Nations Convention on Biological Diversity (UNCBD); and the desertification prevention marker relates to the goals of the United Nations Convention to Combat Desertification (UNCCD) [6]. These markers also play an important role in monitoring ODA contributions to global initiatives such as the Paris Agreement and the Sustainable Development Goals (SDGs). ODA tagged with environmental or Rio markers serve dual goals: contributing to environmental improvement as its primary aim while also fundamentally promoting the economic and social welfare of recipient countries as part of its development mandate. In this study, we specifically focus on climate change mitigation ODA, which aims to reduce the greenhouse gas (GHG) emissions in recipient countries.
Climate change mitigation ODA aligns with the doughnut framework in this context, which seeks to achieve a sustainable balance between human well-being and planetary boundaries. The doughnut framework, proposed by Raworth [7], integrates two key dimensions: (1) a social foundation—the minimum standards necessary for a decent life that must not be compromised, and (2) an ecological ceiling—the environmental boundaries that must not be exceeded [7,8]. Humanity can thrive safely, justly, and sustainably by staying within this “doughnut space,” where the social foundation is secured without surpassing the ecological ceiling. The social foundation includes essential needs such as energy, water, food, health, education, income and work, peace and justice, political voice, social equity, gender equality, housing, and networks. Meanwhile, the ecological ceiling encompasses key environmental challenges such as climate change, ocean acidification, chemical pollution, nitrogen and phosphorus loading, freshwater withdrawals, land conversion, biodiversity loss, air pollution, and ozone layer depletion [7]. Since climate change mitigation ODA strives to strengthen the social foundation (i.e., economy and welfare) while working to prevent ecological overshoot (i.e., climate change mitigation), it serves as a practical application of the doughnut framework.
Despite its conceptual relevance, few empirical studies have assessed whether ODA effectively enhances the social foundation without exceeding the ecological ceiling. While the social foundation consists of various dimensions, this study employs the human development index (HDI) as a comprehensive indicator of human welfare. The HDI is a composite measure comprising three core components: standard of living (measured by gross national income per capita), education (expected years of schooling and mean years of schooling), and health (life expectancy at birth). HDI scores range from 0 to 1, with higher values indicating better welfare in economic conditions, educational, and health outcomes [9,10,11]. Similarly, although the ecological ceiling spans numerous dimensions, this study focuses specifically on climate change mitigation. GHG emissions are used as the primary indicator of climate change mitigation, including carbon dioxide (CO2), methane (CH4), and nitrous oxide (N2O). These emissions are further categorized into those from fossil fuels (GHGfossil) and those from land use and land cover change and forestry (GHGlulucf). The impacts of ODA on both the HDI and GHG emissions have been examined in previous studies, which will be discussed in the Literature Review Section.
This study aims to evaluate whether climate change mitigation ODA effectively improves the social foundation (i.e., improving HDI) while mitigating ecological overshoot (i.e., reducing GHG emissions) in developing countries. If effective, this ODA should be positively associated with the HDI and negatively linked with GHG emissions. To test this hypothesis, we employed an instrumental variable–fixed effect approach (IV-FE) using data from 2010 to 2020, with climate change mitigation ODA as the independent variable, the HDI and GHG emissions as the dependent variables, and additional control variables selected based on previous research.

2. Literature Review

2.1. Impacts of ODA on HDI

Previous studies predominantly indicate that ODA provided to developing countries positively impacts their HDI. For instance, an analysis of total ODA granted to eight Southeast Asian countries between 1990 and 2004 found that ODA, gross domestic product (GDP), and foreign direct investment (FDI) were all positively correlated with the HDI [12]. Similarly, a panel analysis of 124 developing countries from 2009 to 2013 showed that both public ODA and FDI for private sector development had a significant positive effect on the HDI [13]. The researchers explained that ODA and FDI help alleviate shortages of funds and resources, with ODA directly contributing to economic growth, education, and healthcare. Likewise, an analysis of total ODA provided by a single donor country to 15 Asian countries from 2006 to 2016 significantly improved the recipient countries’ HDI [14]. In another study covering 22 countries from 1990 to 2017, ODA showed a positive causal relationship with the HDI [15]. An analysis of 115 developing countries from 1990 to 2020 found that the positive effects of ODA on the HDI emerged with varying time lags [16]. These findings suggest that as developing countries receive more ODA, their income, education levels, life expectancy, and overall quality of life tend to improve.
However, some studies have found no significant relationship between ODA and the HDI, raising questions about its effectives. For instance, from 1995 to 2005, remittances sent by overseas workers positively impacted the HDI in low-income countries, whereas ODA and FDI showed no significant effects [17]. An analysis of 163 developing countries from 1990 to 2018 similarly found that neither ODA nor FDI influenced the HDI and that domestic factors such as increased investment in education and reduced income inequality play a more crucial role [18]. A study of 23 Asian countries from 2000 to 2017 also found no significant link between ODA and the HDI [19].
Meanwhile, a few studies have reported a negative correlation between ODA and the HDI. For example, ODA provided to Nigeria from 1960 to 2010, one of the poorest countries in the world, was associated with a decline in both the HDI and GDP per capita [20]. In addition, an analysis of 130 countries from 1990 to 2018 found that while FDI had a positive effect on the HDI, ODA weakened this relationship [21]. In the Economic Community of West African States, ODA consistently had a negative impact on the HDI between 1996 and 2023 [22].
In summary, while most studies suggest that ODA positively affects the HDI, its effectiveness varies. Notably, we could not find any previous research specifically examining the impact of climate change mitigation ODA on the HDI. Based on these studies, we build the following hypothesis.
H1. 
Climate change mitigation ODA has a positive and significant effect on the human development index of developing countries.

2.2. Impacts of ODA on GHG Emissions

Some researchers argue that ODA helps reduce the emissions of CO2, a major GHG. For example, ODA provided by a single donor country to 30 developing countries between 1993 and 2017 had both direct and indirect effects on CO2 mitigation. Initially, economic development led to higher CO2 emissions, but beyond a certain level, emissions began to decline, forming an inverted U-shaped Environmental Kuznets Curve [23]. In another case, ODA provided to India between 1978 and 2014 significantly reduced CO2 emissions, whereas energy aid contributed to increase emissions [24]. A study analyzing ODA received by 52 countries with varying development levels from 1980 to 2016 found that climate change mitigation and adaption ODA effectively reduced CO2 emissions through two mechanisms: (1) directly, via carbon monitoring, and (2) indirectly, by supporting the transition from fossil fuel-based technologies to low-carbon technologies [25]. Additionally, ODA provided to 49 Asian countries between 2001 and 2019 helped decrease CO2 emissions by promoting energy-efficient and low-carbon industrial technologies, while FDI increased emissions by expanding industries [26]. Likewise, ODA to six Southeast Asian countries between 1986 and 2018 was associated with both short- and long-term CO2 mitigation [27]. In BRICS countries, the total aid received from 1992 to 2016 contributed to reducing the ecological footprint comprising the carbon footprint and resource exploitation [28].
In contrast, some studies argue that ODA can accelerate economic growth, leading to higher energy consumption and increased GHG emissions. For example, Wang et al. [3] examined 59 low- and lower middle-income countries and found that ODA tended to increase emissions, especially when urbanization surpassed a certain threshold. Similarly, countries receiving higher amounts of climate change mitigation ODA had significantly higher CO2 emissions in 2020 than their 2000 levels, relatively to those receiving less [29].
Other studies suggest that ODA alone does not significantly impact GHG emissions. Li et al. [5] found that climate change mitigation ODA allocated to carbon-intensive fossil fuel sectors such as energy, transport, and industry in 86 countries did not significantly reduce CO2 emissions. However, they noted that the emission reductions were more likely in countries with higher institutional quality (i.e., economic freedom, rule of law, and control of corruption). Still, this analysis excluded non-CO2 GHG emissions and non-fossil fuel-based sector such as land use, land use change, and forestry (LULUCF) which play a critical role in both carbon absorption and emissions.
In summary, while many studies suggest that ODA contributes to reducing CO2 emissions, its effectiveness varies by country context and data coverage period. Moreover, further research is needed to examine its impact on non-CO2 emissions and land use and forestry sectors. Based on these studies, we propose the following hypothesis.
H2. 
Climate change mitigation ODA has a negative and significant effect on greenhouse gas (GHG) emissions, GHG emissions from fossil fuels (GHGfossil), and GHG emissions from land use, land use change, and forestry (GHGlulucf) in developing countries.

2.3. ODA Effectiveness According to Income of Recipient Countries

Another important factor is that the effectiveness of ODA varies depending on the income level of the recipient country. ODA tends to be more effective in lower-income countries. Regarding GHG emissions, low-income countries often prioritize economic development to meet basic living standards, leading to higher dependence on fossil fuels and weaker regulations on GHG emissions. As a result, ODA aimed at reducing carbon emissions may have a greater potential impact in these countries compared to higher-income countries [30]. From an economic perspective, ODA emphasizing capital and labor inputs tends to yield more immediate results in low-income countries. In contrast, middle- and high-income countries may face slower or limited economic gains from ODA, often falling into the “middle-income trap” [31]. In terms of welfare, the same amount of ODA may significantly improve welfare in low-income countries while having a limited effect in middle-income countries [32]. Accordingly, this study adopts an income-level-based approach to analyze the impacts of climate change mitigation ODA. Based on these insights, we propose the following hypothesis.
H3. 
The effect of climate change mitigation ODA on improving HDI and reducing GHG emissions is stronger in the low-income group among developing countries.

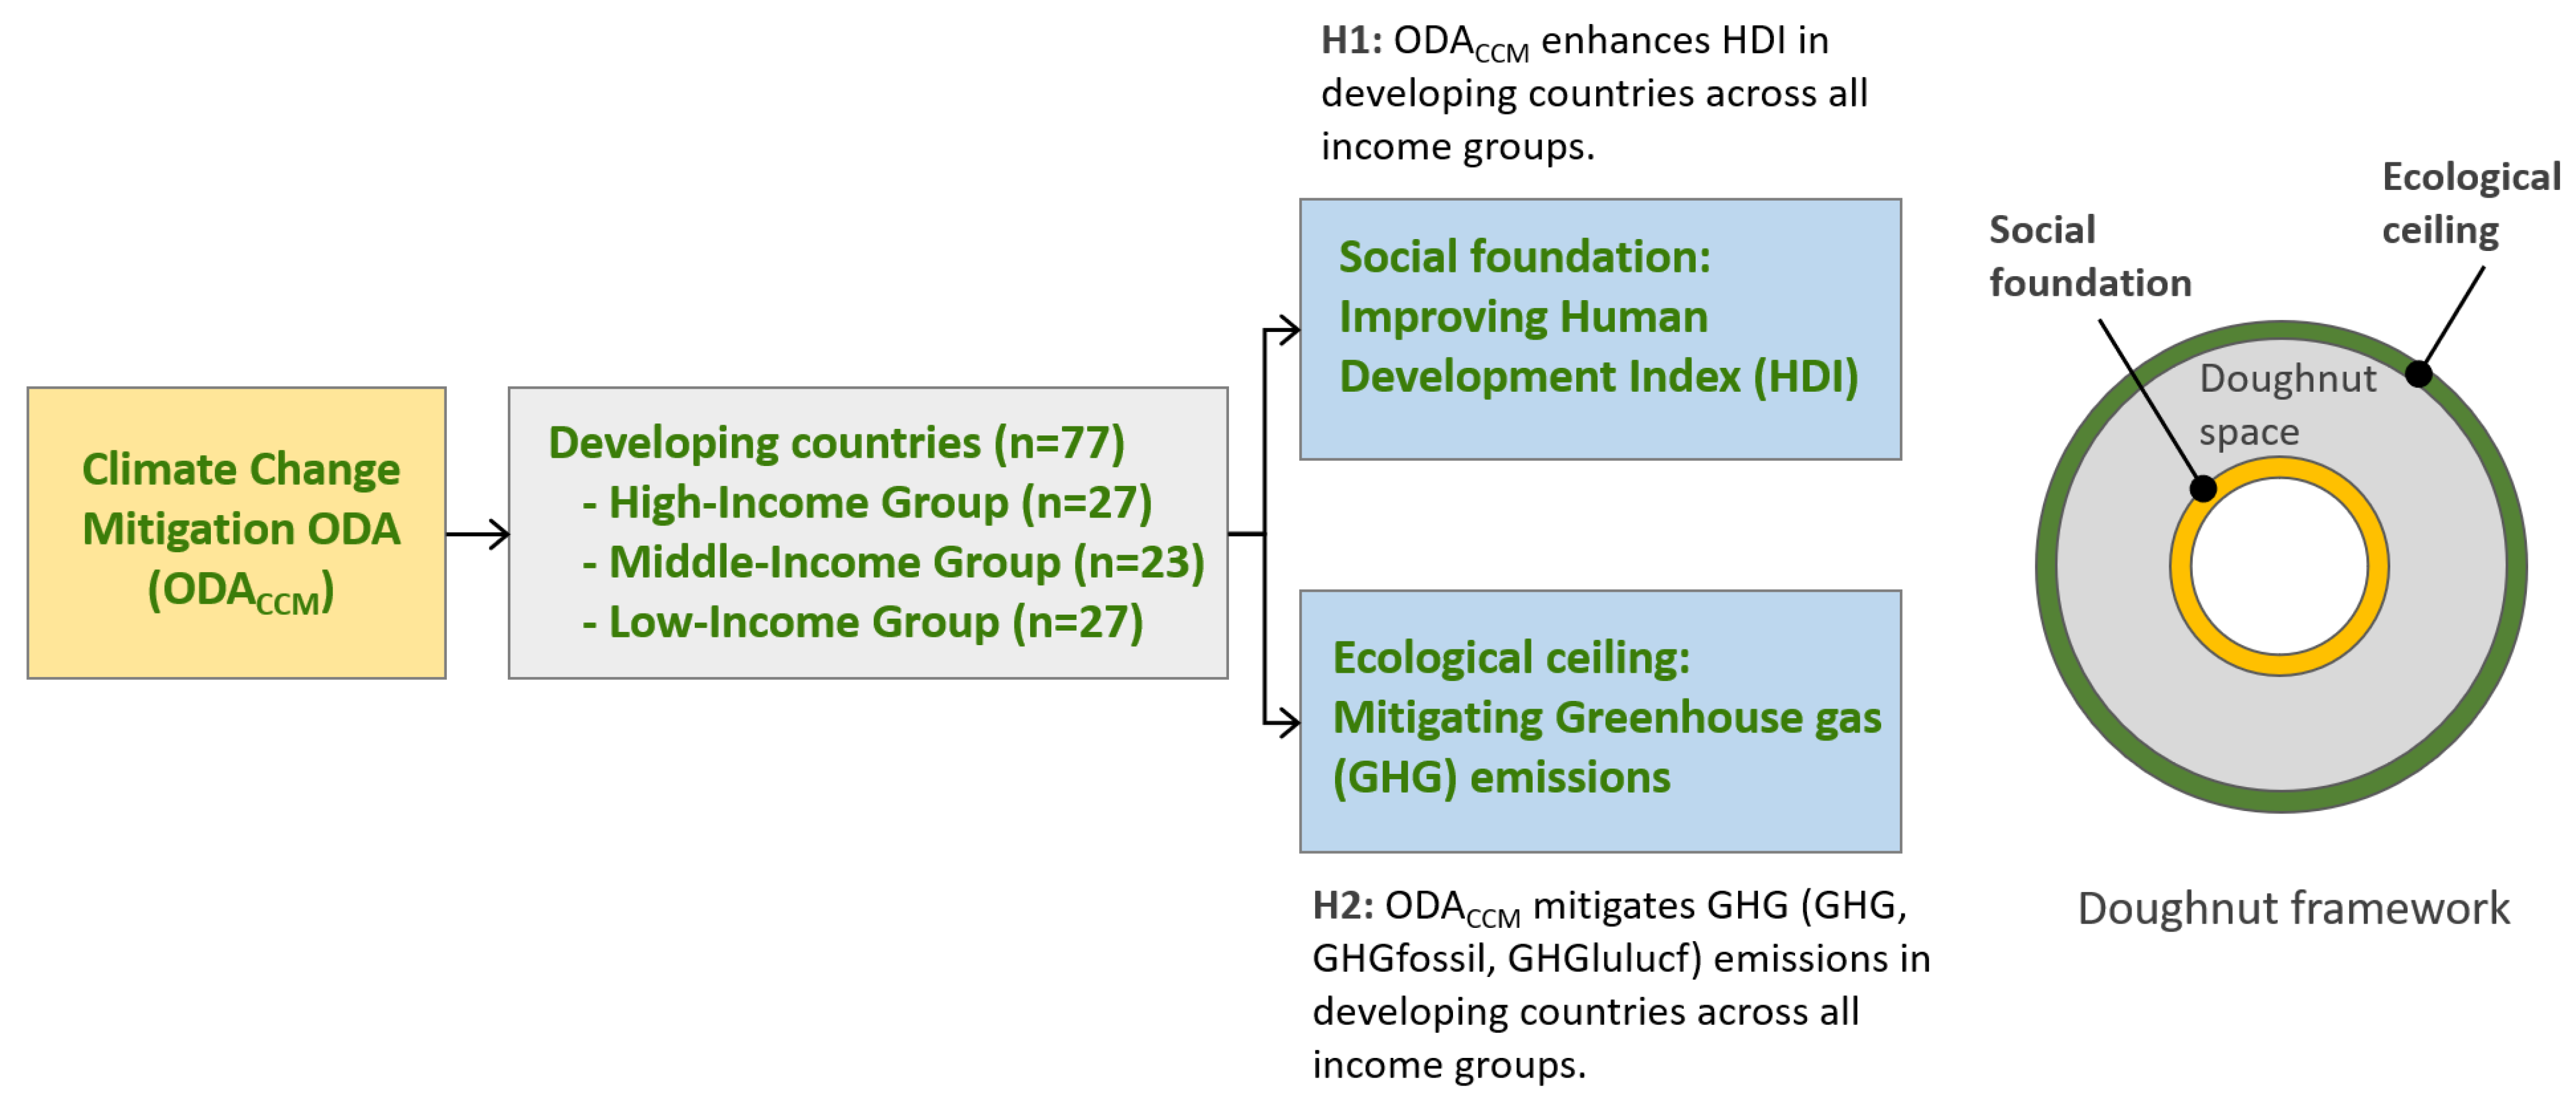
3. Materials and Methods

3.1. Research Framework

Figure 1 illustrates the research framework. This study investigated whether climate change mitigation ODA contributes to improving the HDI and reducing GHG emissions in recipient countries across different income levels. Panel data were constructed by selecting independent, dependent, instrumental, and control variables based on previous studies. To ensure data quality, countries with more than three missing values were excluded. The remaining missing values were imputed using linear interpolation, and all variables were log-transformed for estimation. These developing countries were classified into relatively high-, middle-, and low-income groups based on the classification in the Creditor Reporting System (CRS). Finally, after estimating the instrumental variable–fixed effect (IV-FE) model, we applied Driscoll–Kraay standard errors to obtain robust estimates that account for both cross-sectional and temporal correlation, as well as heteroskedasticity.

3.2. Explanation of Variables

We selected the amount of climate change mitigation ODA received by each developing country as the independent variable. The HDI and GHG emissions were chosen as dependent variables, as the HDI represents welfare and economic growth, while GHG emissions are major contributors to climate change [9,10,11]. Data on climate change mitigation ODA, identified by the climate mitigation marker, were obtained from the OECD’s CRS database. From 2010 to 2020, a total of 151 countries received climate mitigation ODA. However, after merging the ODA data with other variables, we retained only 77 countries with no more than three missing values.
HDI data were collected from the UNDP, while GHG emission data were sourced from the World Bank’s Carbon-Brief Emission database. GHG emissions included CO2, CH4, and N2O, measured in CO2 equivalent, and categorized into emissions from fossil fuel consumption (GHGfossil) and emissions from land use, land use change, and forestry (GHGlulucf).
We included control variables to account for potential confounding factors influencing the relationship between ODA and the dependent variables. For the HDI model, the control variables included foreign direct investment (FDI), GDP per capita, health expenditure, education expenditure, control of corruption, and the vulnerability index. For the GHG, GHGfossil, and GHGlulucf emission models, control variables included FDI, GDP per capita, population, forest area, renewable energy rate, control of corruption, and the vulnerability index. FDI and GDP per capita were included in both models as major financial indicators alongside ODA [5,13,19,21,23]. Control of corruption was incorporated as a proxy for institutional quality, which can influence ODA effectiveness [5,14,26]. The vulnerability index, measuring a country’s vulnerability to environmental risks such as climate change, was also used in both models [33,34]. For the HDI model, government expenditure on health and education was added as a moderating factor to reflect recipient countries’ domestic investment in these sectors [17,18]. For the GHG emission model, forest area and the renewable energy rate were included as additional moderating variables, as they can either reduce or exacerbate emissions [3,35,36]. All control variables were obtained from the World Bank database, and annual data from 2010 to 2020 were used for all variables. A detailed description of the variables and their sources is provided in Table 1.
To ensure accurate data interpretation, missing values can be completely excluded [37], replaced with substitute values [38], or handled using linear interpolation [39,40]. This study aimed to avoid introducing bias by artificially filling excessive missing values while also ensuring that key recipients of climate change mitigation ODA were not excluded solely due to a one or two data gaps. As a result, 77 countries were selected for analysis, and the remaining missing values—accounting for less than 1% of the dataset—were filled using linear interpolation. Descriptive statistics for each variable are presented in Table 2.
The recipient countries were classified based on the income group categories defined by the OECD Creditor Reporting System [41]. For statistical analysis, these categories were consolidated into three income level groups (Table 3). The high-income group included 27 countries, all of which were upper middle-income countries and territories (UMICs), representing relatively high-income developing countries. The middle-income group comprised 23 countries classified as lower middle-income countries and territories (LMICs). The low-income group consisted of 27 countries categorized as the least developed countries (LDCs), representing the poorest countries. Due to missing values, countries classified as low-income countries (LICs) and More Advanced Developing Countries and Territories (MADCTs) were excluded from the final dataset.

3.3. Description of Methodology

After assembling the complete dataset and categorizing countries by income level, we conducted multicollinearity diagnostics and Im–Pesaran–Shin (IPS) unit root tests for both the HDI and GHG models. Multicollinearity refers to high correlations among independent variables in a regression model, which—if severe—can inflate standard errors, distort estimated coefficients, or obscure statistical significance, thereby complicating interpretation [43]. Accordingly, we calculated the Variance Inflation Factor (VIF) to assess multicollinearity and found that none of the independent variables in any model exhibited problematic levels of collinearity (see Supplementary S1 and S2). We also conducted panel unit root tests using the IPS test, which tests for stationarity by averaging individual Dickey–Fuller t-statistics across cross-sectional units into a single τ statistic [44]. Variables found to be non-stationary were first-differenced and re-tested, after which all variables were confirmed to be stationary. In addition, to address any residual multicollinearity and stabilize coefficient estimates, we applied ridge regression [45] in the first stage of IV-FE estimation. Ridge regression shrinks parameter estimates, thereby improving model stability and predictive accuracy.
This study employed an instrumental variable–fixed effect (IV-FE) model. By incorporating instrumental variables, we address potential endogeneity issues and more robustly estimate causal relationships within panel data [46]. The first-stage estimation equation of the IV-FE model is as follows:
C C M O D A i , t = a 1 C C M O D A i , t 1 + k a k X k , i , t + μ i + λ t + ν i , t
1   C C M O D A i , t = a 0   + a 1 C C M O D A i , t 1 + a 2 F D I i , t + a 3 G D P P C A P i , t + a 4 H E A L T H i , t + a 5 E D U i , t + a 6 C O R R U P T i , t + a 7 V U L i , t + μ i + λ t + ν i , t
2   C C M O D A i , t = γ 0 + γ 1 C C M O D A i , t 1 + γ 2 F D I i , t + γ 3 G D P P C A P i , t + γ 4 C O R R U P T i , t + γ 5 V U L i , t + γ 6 P O P i , t + γ 7 F O R E S T i , t + γ 8 R E N E W E i , t + μ i + λ t + ν i , t
In the first stage, we used the one-period lag of climate change mitigation ODA, C C M O D A i , t 1 , as the instrumental variable. Additional control variables X i , t , k were included, incorporating μ i and λ t to account for country-specific, time-invariant heterogeneity and common temporal shocks. The control variables are defined as follows: F D I refers to foreign direct investment; G D P P C A P denotes GDP per capita; H E A L T H represents health expenditure; E D U refers to education expenditure; C O R R U P T indicates control of corruption; V U L denotes the vulnerability index; P O P refers to population; F O R E S T indicates the forest area rate; and R E N E W E represents the renewable energy rate. Here, μ i captures each country’s unobserved, time-invariant characteristics; λ t denotes the year fixed effects; and ν i , t is the residual arising from other unobserved factors. This procedure yields a fitted value of C C M O D A i , t , which isolates the exogenous variation in climate change mitigation ODA by controlling for reverse causality and unobserved heterogeneity. We assessed instrument strength via the first-stage F-statistic, which indicates how well the instrument explains the endogenous variable. A first-stage F-statistic greater than 10 is generally considered sufficient to mitigate concerns about weak instruments, thereby reducing bias and variance in the second-stage estimates [47]. In our analysis, all instrumental variables used across the models met this threshold (F > 10), confirming instrument strength.
H D I i , t = β 0 + β 1 C C M O D A i , t + β 2 F D I i , t + β 3 G D P P C A P i , t + β 4 H E A L T H i , t + β 5 E D U i , t + β 6 C O R R U P T i , t + β 7 V U L i , t + μ i + λ t + ξ i , t
G H G i ,   t = δ 0 + δ 1 C C M O D A i , t + δ 2 F D I i , t + δ 3 G D P P C A P i , t + δ 4 C O R R U P T i , t + δ 5 V U L i , t + δ 6 P O P i , t + δ 7 F O R E S T i , t + δ 8 R E N E W E i , t + μ i + λ t + ξ i , t
In the second stage, we used the fitted value of C C M O D A i , t as the primary explanatory variable to estimate both the HDI and GHG models. This two-stage estimation procedure helps reduce bias stemming from country-specific heterogeneity and common time effects, thereby yielding more reliable estimates of the casual impact of climate change mitigation ODA on the HDI and GHG emissions. Finally, to ensure robustness to both heteroskedasticity and serial correlation, we applied Driscoll–Kraay standard errors [48] in all final estimations.

4. Results

4.1. Climate Change Mitigation ODA Trends During 2010–2020

The annual amount of climate change mitigation ODA granted to 77 countries fluctuated over time but generally increased until 2016 and remained above USD 10 billion through 2020 (Figure 2). The percentage of total ODA allocated to climate change mitigation also varied, but it consistently stayed above approximately 20%, except in 2010 when the total ODA volume was relatively low compared to other years. This trend demonstrates sustained global interest in climate change mitigation ODA.
However, climate change mitigation ODA was heavily concentrated in a small number of countries. The top 10% of recipient countries —India, Bangladesh, Indonesia, Brazil, Vietnam, Kenya, Mexico, and China—received approximately 60% of the total cumulative climate change mitigation ODA from 2010 to 2020 (Figure 3). Meanwhile, the top 20 recipient countries accounted for as much as 82% of the total. In contrast, the bottom 30 recipient countries (e.g., Central African Republic, Gambia, Congo, Saint Lucia, and Eswatini) each received less than 0.5%.
Over the 11-year period, more than half of total climate change mitigation ODA was allocated to the middle-income group, while only 28% and 20% went to the high- and low-income groups, respectively (Table 4). On a per-country basis, middle-income group countries received twice as much ODA per country compared to those in the low- and high-income groups.

4.2. Effectiveness of Climate Change Mitigation ODA

4.2.1. Total Recipient Countries

Climate change mitigation ODA received by 77 recipient countries significantly improved their HDI at the 1% significance level; however, it did not reduce GHG emissions, GHGfossil emissions, or GHGlulucf emissions (Table 5). The HDI was positively associated with climate change mitigation ODA, as well as health expenditure and control of corruption, but negatively associated with foreign direct investment and the vulnerability index. For GHGfossil emissions, the vulnerability index and renewable energy rates had negative effects, while population and forest area had positive effects. The R2 values of GHG and GHGlulucf emissions were negligible, indicating limited explanatory power.

4.2.2. High-Income Group

In the high-income group, climate change mitigation ODA neither contributed to improvements in the HDI nor led to reductions in GHG emissions (Table 6). The HDI was positively associated with GDP per capita and health expenditure but negatively associated with foreign direct investment, control of corruption, and the vulnerability index. The models for GHG, GHGfossil, and GHGlulucf emissions showed limited explanatory power.

4.2.3. Middle-Income Group

In the middle-income group, climate change mitigation ODA did not contribute to improving the HDI. In contrast, it significantly reduced GHG emissions at the 0.1% level, although the explanatory power of the model was low (Table 7). Its mitigation effects on GHGfossil and GHGlulucf were not statistically significant. The HDI was negatively affected by foreign direct investment, health expenditure, and the vulnerability index but positively associated with control of corruption. GHG emissions were negatively associated with climate change mitigation ODA as well as GDP per capita and the renewable energy rate, while they were positively associated with control of corruption, the vulnerability index, and population.

4.2.4. Low-Income Group

Unlike the other income groups, climate change mitigation ODA significantly improved the HDI at the 0.1% level and significantly reduced GHGfossil emissions at the 0.1 level in the low-income group (Table 8). However, its mitigation effects on GHG emissions and GHGlulucf emissions were not observed. The HDI was negatively associated with foreign direct investment and the vulnerability index, while it was positively associated with climate change mitigation ODA as well as health expenditure, education expenditure, and control of corruption. GHGfossil emissions were positively affected by population but negatively affected by climate change mitigation ODA and the renewable energy rate.

5. Discussion

5.1. Effects of Climate Change Mitigation ODA on HDI

This study investigated whether climate change mitigation ODA improves the HDI and reduces GHG emissions in developing countries. Our first key finding is that H1 (climate change mitigation ODA has a positive and significant effect on the human development index (HDI) of developing countries) and H3 (its effect on improving the HDI is stronger in the low-income group among developing countries) were supported by the results. Specifically, climate change mitigation ODA had a positive impact on the HDI in the 77 recipient countries (Table 5). When we disaggregated the countries by income levels, only the low-income group (i.e., least developed countries, LDCs) showed a significant impact of climate change mitigation ODA on improving the HDI, while the high- and middle-income groups did not show clear evidence of such an effect (Table 6, Table 7 and Table 8).
The limited impact of climate change mitigation ODA on the HDI in the high- and middle-income groups may be due to the relatively small amount of the ODA received, which may have been insufficient to bring about significant improvements in the HDI. In contrast, the amount received by the poorest countries in the low-income group may have been substantial enough to make a noticeable impact [32]. This finding suggests that the effectiveness of climate change mitigation ODA in enhancing the HDI may be substantially greater in the low-income groups, even with the same level of aid. Furthermore, HDI improvement is known to be closely linked to ODA allocations in sectors such as the economy, education, and healthcare [13,14]. However, in this study, although climate change mitigation ODA was not primarily directed toward those sectors but rather concentrated in the transport, energy, environment protection, agriculture, water, and forestry sectors—together accounting for 88% of total—its significant effect on improving the HDI remains a noteworthy result.

5.2. Effects of Climate Change Mitigation ODA on GHG Emissions

The second key finding is that H2 (climate change mitigation ODA has a negative and significant effect on GHG, GHGfossil, and GHGlulucf in developing countries) was not supported, while H3 (its effects on mitigating GHG, GHGfossil, and GHGlulucf are stronger in the low-income group among developing countries) was partially supported by this study. Climate change mitigation ODA did not significantly reduce total GHG emissions in the full sample, nor in the high- and low-income groups. Only the middle-income group showed a statistically significant reduction in GHG emissions, although the model had low explanatory power (Table 5, Table 6, Table 7 and Table 8). In contrast, this type of ODA significantly reduced the GHGfossil emissions only in the low-income group and had no statistically significant effect on GHGlulucf emissions across any income group. These findings imply that the mitigation effect was limited to GHGfossil emissions in the least developed countries with low income and that other types of GHG emissions and other income groups did not exhibit significant effects. This result aligns with previous studies, which revealed that climate change mitigation ODA had no significant impact on reducing CO2 emissions in developing countries without accounting for differences in income levels [3,5,29]. In other words, even when the analysis was broadened to include non-CO2 emissions and account for GHG emission from both fossil fuel and land use, land use change, and forestry, the findings remained largely unchanged. However, this study highlights the importance of disaggregating countries by income level, as it can reveal significant differences in outcomes.
The reason why the effects of climate change mitigation ODA on mitigating GHG emissions are evident only in low-income developing counties and become less pronounced as income levels increase is as follows: Low-income countries often prioritize economic development to meet basic living standards, leading to higher dependence on fossil fuels and weaker regulations on GHG emissions. Consequently, even the same amount of ODA targeted at GHG emission reduction may have a relatively higher potential impact in these countries than in higher-income countries [30]. However, climate change mitigation ODA has often been allocated more heavily to middle- and high-income developing countries rather than to the poorest countries, which potentially limits its effectiveness [29]. Our study also observed this trend: the middle-income group received the largest share of ODA, while only 20% was allocated to the low-income group (Table 4). The current situation, in which only a small portion of climate change mitigation ODA is allocated to low-income countries, reduces the potential GHG reduction that the same amount of ODA could achieve. Therefore, to effectively achieve the goal of climate change mitigation, an ODA allocation strategy that prioritizes low-income countries is necessary. Additionally, the total amount of climate change ODA is relatively small compared to other forms of climate finance, which may obscure its effects on mitigating GHG emissions. Nevertheless, in the absence of a transparent and unified system for tracking and reporting diverse climate finance flows, focusing on climate change mitigation ODA continues to be a valid and meaningful analytical approach.
Interestingly, different patterns emerged in different types of GHG emissions. GHGfossil emissions decreased as climate change mitigation ODA increased in the low-income group, while GHGlulucf emissions were not significantly reduced by climate change mitigation ODA at any income level. Climate change mitigation ODA primarily aims to (1) reduce GHG emissions by transitioning to energy-efficient or renewable energy industries [25,26] and (2) enhance carbon sequestration through forests. Our findings suggest that while the first approach had an effect in reducing GHGfossil emissions, especially in the poorest countries, there was no evidence that the second approach contributed to reducing GHGlulucf emissions at any income level. In our study, the allocation of climate change mitigation ODA to fossil fuel-based sectors (i.e., sum of transport and energy) in the low-income group was not significantly higher than that in other income groups (Table 9). Nevertheless, the observed mitigation effects on GHGfossil indicate that even a relatively small amount of ODA was sufficient for the low-income group to reduce these emissions. In contrast, in the middle- and high-income groups, the allocation of climate change mitigation ODA to land use, land use change, and forestry sectors (i.e., environmental protection and forestry) increased, yet this did not contribute to GHGlulucf emission reduction. These results imply that the current approach to allocating climate change mitigation ODA to land use, land use change, and forestry sectors should be reconsidered.

5.3. Implications and Limitations

Overall, climate change mitigation ODA has succeeded in meeting the social foundation but has failed to prevent the ecological ceiling from being exceeded within the doughnut framework. To ensure that climate change mitigation ODA effectively guides recipient countries toward a safe and just doughnut space, we recommend prioritizing its allocation strategy to the lowest-income countries and reassessing the effectiveness in the land use, land use change, and forestry sectors. These strategies will enhance the impact of climate change mitigation ODA in both improving human welfare and mitigating GHG emissions.
Despite the novel contributions of this study, there are some limitations. First, due to limited data availability, this study analyzed only 77 countries out of 151 actual recipient countries. Many developing countries lack the capacity for consistent long-term data monitoring and reporting. More comprehensive results covering all recipient countries could be achieved if missing data are supplemented. Second, some of the regression models presented in this study show low R2 values, which can indicate the possibility of the presence of omitted variables (e.g., technological capacity, policy intensity). These findings suggest that further research incorporating broader socio-economic and institutional factors could enhance the explanatory power of future models. Third, issues related to the classification of climate change mitigation ODA due to marker labeling pose a challenge. In some cases, markers are omitted or incorrectly recorded during classification, particularly if project designers are unaware of the marker system. This could lead to an underestimation of the actual amount allocated for climate change mitigation. To address this, project managers should be better informed about marker labeling, and clear guidelines should be provided to ensure accurate classification. Future research could benefit from disaggregating the effects of climate change mitigation ODA by type (grants vs. loans), conducting more in-depth analyses of its impacts on specific GHG sectors (i.e., bunker fuels, energy, industrial processes, waster, agriculture, and land use change and forestry), or expanding the analysis to include a larger number of developing countries if data availability allows.

6. Conclusions

Our study revealed that climate change mitigation ODA had a positive and significant effect on the human development index (HDI) but had no significant effect on the total GHG, GHGfossil, and GHGlulucf emissions of 77 developing countries. However, when the countries were further disaggregated into income levels, the low-income countries (i.e., least developed countries, LDCs) showed effective GHGfossil emission reduction as well as HDI improvement. In contrast, GHGlulucf emissions were not affected by any income level. Our findings indicate that, to achieve the dual goals of fostering economic growth and welfare while improving environmental conditions, climate change mitigation ODA needs to be prioritized for the poorest countries, and its effectiveness in the land use, land use change, and forestry (LULUCF) sectors should be critically reassessed. Addressing these issues will enable climate change mitigation ODA to more effectively support developing countries in achieving a safe and just doughnut space—where social foundations are secured without exceeding the ecological ceiling.

Supplementary Materials

The following supporting information can be downloaded at https://www.mdpi.com/article/10.3390/f16081247/s1.

Author Contributions

Conceptualization, H.Y.; methodology, H.Y. and J.C.; software, J.C.; validation, H.Y. and E.C.; investigation, H.Y. and J.C.; resources, E.C.; data curation, H.Y. and J.C.; writing—original draft preparation, H.Y., J.C. and E.C.; writing—review and editing, H.Y., J.C. and E.C.; visualization, J.C.; supervision, H.Y. and E.C.; project administration, E.C.; funding acquisition, E.C. All authors have read and agreed to the published version of the manuscript.

Funding

This study was funded by the National Institute of Forest Science (Grant No. FM0800-2021-03-2025).

Data Availability Statement

Data available on request from the authors.

Conflicts of Interest

The authors declare no conflicts of interest.

References

  1. OECD. Official Development Assistance (ODA). Available online: https://www.oecd.org/dac/financing-sustainable-development/development-finance-standards/official-development-assistance.htm (accessed on 26 March 2024).
  2. Jung, S.; Jeon, C.; Choi, E. Analysis on the effectiveness of official development assistance on forestry sector using global panel data applied by R software. Korean J. Int. Agric. 2022, 34, 191–198. [Google Scholar] [CrossRef]
  3. Wang, Q.; Guo, J.; Li, R. Official development assistance and carbon emissions of recipient countries: A dynamic panel threshold analysis for low- and lower-middle-income countries. Sustain. Prod. Consum. 2022, 29, 158–170. [Google Scholar] [CrossRef]
  4. UN Trade & Development. Aid at the Crossroads: Trends in Official Development Assistance. Available online: https://unctad.org/publication/aid-crossroads-trends-official-development-assistance (accessed on 11 July 2025).
  5. Li, D.D.; Rishi, M.; Bae, J.H. Green official development aid and carbon emissions: Do institutions matter? Environ. Dev. Econ. 2021, 26, 88–107. [Google Scholar] [CrossRef]
  6. OECD. Questions & Answers: Rio Marker Climate and Environment-Related Development Finance Statistics; OECD: Paris, France, 2016. [Google Scholar]
  7. Raworth, K. Doughnut Economics: Seven Ways to Think Like a 21st-Century Economist; Chelsea Green Publishing: White River Junction, VT, USA, 2017; p. 320. [Google Scholar]
  8. Fanning, A.L.; O’Neill, D.W.; Hickel, J.; Roux, N. The social shortfall and ecological overshoot of nations. Nat. Sustain. 2021, 5, 26–36. [Google Scholar] [CrossRef]
  9. van den Bergh, J.C.J.M.; Botzen, W.J.W. Global impact of a climate treaty if the Human Development Index replaces GDP as a welfare proxy. Clim. Policy 2018, 18, 76–85. [Google Scholar] [CrossRef]
  10. Carfora, A.; Scandurra, G.; Thomas, A. Factors affecting official development assistance distribution: A panel investigation. J. Clean. Prod. 2021, 304, 126970. [Google Scholar] [CrossRef]
  11. Mpuure, D.M.N.; Mengba, J.D. Natural resource dependence, policy and institutions for environmental sustainability and African welfare. Sustain. Dev. 2024, 32, 2176–2193. [Google Scholar] [CrossRef]
  12. Lin Moe, T. An empirical investigation of relationships between official development assistance (ODA) and human and educational development. Int. J. Soc. Econ. 2008, 35, 202–221. [Google Scholar] [CrossRef]
  13. Agusty, G.J.; Damayanti, S.M. The effect of foreign direct investment & official development assistance to human development index of developing countries in 2009–2013. J. Bus. Manag. 2015, 4, 882–889. [Google Scholar]
  14. Lee, E.; Jung, K.; Sul, J. Searching for the various effects of subprograms in official development assistance on human development across 15 Asian countries: Panel regression and fuzzy set approaches. Sustainability 2019, 11, 1152. [Google Scholar] [CrossRef]
  15. Tatli, H. Empirical analysis of renewable energy consumption, environmental pollution and official development assistance impact on human development: Evidence from OECD countries. Int. J. Energy Environ. Manag. 2022, 30, 399–428. [Google Scholar]
  16. Lee, G.; Kim, S. The impact of official development assistance (ODA) on the human development index (HDI) in developing countries—A focus on the time lag effect. J. Int. Stud. 2023, 476, 219–247. (In Korean) [Google Scholar]
  17. Ustubici, A.; Irdam, D. The impact of remittances on human development: A quantitative analysis and policy implications. Econ. Sociol. 2012, 5, 74–95. [Google Scholar] [CrossRef]
  18. Signor, J.; Vandernoot, J. Does foreign aid contribute to HDI improvement? Adv. Manag. Appl. Econ. 2021, 11, 13–27. [Google Scholar] [CrossRef]
  19. Herdika, R.; Handoyo, R.D.; Hudang, A.K.; Haryanto, T. Official development assistance effect on infant mortality and human development index: Asia evidence. J. Dev. Econ. 2022, 7, 180–197. [Google Scholar] [CrossRef]
  20. Okon, E.O. Five decades of development aid to Nigeria: The impact on human development. J. Econ. Dev. Stud. 2012, 3, 32–43. [Google Scholar]
  21. Kim, Y.; Cho, Y.J. The moderating effects of official development assistance on the relationship between foreign direct investment and human development. Korean J. Int. Stud. 2023, 21, 219–238. [Google Scholar] [CrossRef]
  22. Onyekwere, S.C.; Chikhungu, L.C. ODA and HDI nexus in sub-Saharan Africa pre- and post-Global Financial Crisis (GFC): New evidence from the ECOWAS region. J. Contemp. Afr. Studies. 2025, 1–24. [Google Scholar] [CrossRef]
  23. Lee, S.K.; Choi, G.; Lee, E.; Jin, T. The impact of official development assistance on the economic growth and carbon dioxide mitigation for the recipient countries. Environ. Sci. Pollut. Res. 2020, 27, 41776–41786. [Google Scholar] [CrossRef]
  24. Mahalik, M.K.; Villanthenkodath, M.A.; Mallick, H.; Gupta, M. Assessing the effectiveness of total foreign aid and foreign energy aid inflows on environmental quality in India. Energy Policy 2021, 149, 112015. [Google Scholar] [CrossRef]
  25. Wu, X.; Pan, A.; She, Q. Direct and indirect effects of climate aid on carbon emissions in recipient countries. J. Clean. Prod. 2021, 290, 125204. [Google Scholar] [CrossRef]
  26. Farooq, U. Foreign direct investment, foreign aid, and CO2 emissions in Asian economies: Does governance matter? Environ. Sci. Pollut. Res. 2022, 29, 7532–7547. [Google Scholar] [CrossRef] [PubMed]
  27. Cabañero, J.G. Do financing sources affect CO2 emissions? The case of growing ASEAN. Southeast Asian J. Econ. 2023, 11, 159–187. [Google Scholar]
  28. Villanthenkodath, M.A.; Ansari, M.A.; Mahalik, M.K.; Lean, H.H. External finance for climate change mitigation: Assessing the impact of energy aid and total aid inflows on the ecological footprint. J. Clim. Finance 2023, 5, 100028. [Google Scholar] [CrossRef]
  29. Kenny, C. Does Mitigation ODA Reduce Emissions? Center for Global Development Note 359. 2024. Available online: http://www.cgdev.org/publication/does-mitigation-oda-reduce-emissions (accessed on 26 March 2024).
  30. Wang, Q.; Wang, L. The nonlinear effects of population aging, industrial structure, and urbanization on carbon emissions: A panel threshold regression analysis of 137 countries. J. Clean. Prod. 2021, 287, 125381. [Google Scholar] [CrossRef]
  31. Kim, B. How to escape the middle-income trap: Lessons for the ODA policy. J. Policy Stud. 2023, 38, 45–58. [Google Scholar] [CrossRef]
  32. Dissanayake, R.; Kenny, C.; Plant, M. What Is the Role of Aid in Middle-Income Countries? CGD Policy Paper 201; Center for Global Development: Washington, DC, USA, 2020. [Google Scholar]
  33. Notre Dame Global Adaptation Initiative (ND-GAIN). Country Index Methodology. University of Notre Dame. Available online: https://gain.nd.edu/our-work/country-index/methodology/ (accessed on 7 August 2024).
  34. World Bank. Vulnerability Index Indicator. Available online: https://prosperitydata360.worldbank.org/en/indicator/UND+NDGAIN+vulnerability (accessed on 7 August 2024).
  35. Pearson, T.R.H.; Brown, S.; Murray, L.; Sidman, G. Greenhouse gas emissions from tropical forest degradation: An underestimated source. Carbon Balance Manag. 2017, 12, 3. [Google Scholar] [CrossRef]
  36. Li, R.; Guo, J.; Wang, Q. Evaluating the impact of official development assistance on ecological environments in agricultural and renewable energy sectors. Humanit. Soc. Sci. Commun. 2024, 11, 1607. [Google Scholar] [CrossRef]
  37. Jung, J.H.; Kim, J.S.; Choi, K.; Lee, B.H. Effectiveness of government R&D on firm’s R&D spending. J. Korea Content Assoc. 2016, 16, 150–162. [Google Scholar] [CrossRef]
  38. An, J.H.; Yun, Y.D.; Lim, H. The life satisfaction analysis of middle school students using Korean children and youth panel survey data. J. Digit. Converg. 2016, 14, 197–208. [Google Scholar] [CrossRef]
  39. Barro, R.J.; Lee, J.W. A new data set of educational attainment in the world, 1950–2010. J. Dev. Econ. 2013, 104, 184–198. [Google Scholar] [CrossRef]
  40. Sapkota, P.; Bastola, U. Foreign direct investment, income, and environmental pollution in developing countries: Panel data analysis of Latin America. Energy Econ. 2017, 64, 206–212. [Google Scholar] [CrossRef]
  41. OECD. CRS: Creditor Reporting Systems (Flows). Available online: https://stats.oecd.org/Index.aspx?DataSetCode=crs1 (accessed on 12 December 2024).
  42. United Nations (UN). Handbook on the Least Developed Country Category: Inclusion, Graduation and Special Support Measures, 4th ed.; UN: New York, NY, USA, 2021. [Google Scholar]
  43. Bornhorst, F.; Baum, C.F. ‘IPSHIN: Stata Module to Perform Im-Pesaran-Shin Panel Unit Root Test,’ Statistical Software Components. Available online: https://ideas.repec.org/c/boc/bocode/s419704.html (accessed on 9 July 2025).
  44. Clemens, M.A.; Radelet, S.; Bhavnani, R.R.; Bazzi, S. Counting chickens when they hatch: Timing and the effects of aid on growth. Econ. J. 2012, 122, 590–617. [Google Scholar] [CrossRef]
  45. Hoerl, A.E.; Kennard, R.W. Ridge Regressio: Biased Estimation for Nonorthogonal Problems. Technometrics 1970, 12, 55–67. [Google Scholar] [CrossRef]
  46. Choi, K.D.; Kwon, H.; Choi, I.; Lee, Y. The Impact of Grandparent Caregiving on Health, Cognitive Functioning and Satisfaction with Life of Older People; Korean Institute for Health and Social Affairs: Sejong City, Republic of Korea, 2022.
  47. Staiger, D.; Stock, J.H. Instrumental Variables Regression with Weak Instruments. Encometrica 1997, 65, 557–586. [Google Scholar] [CrossRef]
  48. Driscoll, J.C.; Kraay, A.C. Consistent Covariance Matrix Estimation with Spatially Dependent Panel Data. Rev. Econ. Stat. 1998, 80, 549–560. [Google Scholar] [CrossRef]
Figure 1. Research framework.
Forests 16 01247 g001
Figure 2. Annual climate change mitigation ODA and its percentage of total ODA provided to 77 recipient countries. The green bars represent annual climate change mitigation ODA (in USD millions), while the yellow line represents its percentage of total ODA (%).
Forests 16 01247 g002
Figure 3. Climate change mitigation ODA by top 20 recipient countries from 2010 to 2020 and its contribution to the total climate change migration ODA. The green bars represent climate change mitigation ODA (in USD millions) by recipient countries, while the yellow line represents its contribution (%).
Forests 16 01247 g003
Table 1. Data explanation and source.
TypeVariable (Unit)ExplanationSource (Link)
Independent variablesClimate change mitigation ODA (USD millions)The amount of Official Development Assistance (ODA) marked by a climate change mitigation marker in its principal or significant objective.OECD Statistics—Creditor Reporting System (CRS)
https://stats.oecd.org/Index.aspx?DataSetCode=crs1 (accessed on 7 December 2024)”
Dependent variablesHDI (unitless)A summary measure of the average achievement in key dimensions of human development (i.e., a long and healthy life, being knowledgeable, and having a decent standard of living) with the range 0–1. A higher value indicates better human development.UNDP
https://hdr.undp.org/data-center/human-development-index#/indicies/HDI (accessed on 7 December 2024)”
GHG emissions (Mt CO2 eq)Greenhouse gas (CO2, CH4, N2O) emissions, including emissions from fossil fuel and land use, land use change, and forestry, are measured in million tons of CO2 equivalents.World Bank—
Carbon Brief—Emission data
https://prosperitydata360.worldbank.org/en/dataset/OWID+CB (accessed on 7 December 2024)”
GHGfossil
emissions
(Mt CO2 eq)
Greenhouse gas (CO2, CH4, N2O) emissions from fossil fuels (excluding land use, land use change, and forestry) are measured in millions of tons of CO2 equivalents.
GHGlulucf emissions
(Mt CO2 eq)
Greenhouse gas (CO2, CH4, N2O) emissions from land use, land use change, and forestry are measured in millions of tons of CO2 equivalents.
Control variablesForeign direct
investment
Foreign direct investment (net inflows) refers to direct investment equity flows in the reporting economy.World Bank
https://data.worldbank.org/ (accessed on 7 December 2024)”
GDP per capita
(constant 2015 USD)
Gross Domestic Product (GDP) divided by the midyear population.
Health expenditure (%)The level of current health expenditure is expressed as a percentage of GDP.
Education expenditure (%)Government expenditure on education expressed as a percentage of total general government expenditure on all sectors (including health, education, social services).
Population (capita)Total population based on the de facto definition of population, which counts all residents regardless of legal status or citizenship.
Forest area (%)Forest area (% of land area) under natural or planted stands of trees of at least 5 m in situ, whether productive or not, excluding tree stands in agricultural production systems and trees in urban parks and gardens.
Renewable
energy (%)
Renewable energy consumption is the share of renewable energy in total energy consumption.
Control of
corruption
(unitless)
Control of corruption is the perception of the extent to which public power is exercised for private gain, including petty and grand forms of corruption, ranging from −2.5 to 2.5. A higher value indicates less corruption.
Vulnerability index (unitless)Overall vulnerability through a country’s exposure, sensitivity, and capacity to adapt to the negative effects of climate change by considering six life-supporting sectors (i.e., food, water, health, ecosystem service, human habitat, and infrastructure). The range is 0–1, and lower values indicate less vulnerability.World Bank—
ND-GAIN Index “https://prosperitydata360.worldbank.org/en/indicator/UND+NDGAIN+vulnerability (accessed on 7 December 2024)”
Notes: HDI, GHG, GHGfossil, and GHGlulucf stand for human development index, greenhouse gas emissions, greenhouse gas emissions from fossil fuels, and greenhouse gas emissions from land use, land use change, and forestry, respectively.
Table 2. Summarized statistics of variables.
TypeVariableMeanMedianStandard ErrorMinMax
Dependent variableClimate change mitigation ODA141.32724.31413.7380.0025677.732
Independent variablesHDI0.6280.6400.0040.3360.853
GHG emissions322.7248.1945.37 5.4012295.62
GHGfossil
emissions
303.6530.6447.510.1312942.87
GHGlulucf
emissions
19.075.874.42 707.611147.43
Control variablesForeign direct investment7.05 × 1097.74 × 1089.87 × 108 7.4 × 1092.91 × 1011
GDP per capita 3612.302551.48110.41263.3620142.16
Health
expenditure
5.5625.1340.0781.75219.690
Education
expenditure
4.2433.9500.0581.10810.315
Control of
corruption
0.540 0.6030.020 1.5631.618
Vulnerability index0.4640.4700.0020.3200.660
Population6.52 × 1071.47 × 1077.41 × 1061709351.41 × 109
Forest area 33.2630.350.740.8091.78
Renewable
energy
45.4643.401.020.1095.10
Notes: HDI, GHG, GHGfossil, and GHGlulucf stand for human development index, greenhouse gas emissions, greenhouse gas emissions from fossil fuels, and greenhouse gas emissions from land use, land use change, and forestry, respectively.
Table 3. Income classification.
ClassificationClassExplanationCountries (Total Number)
High-Income groupUMICs (Upper middle-income countries and territories)Per capita GNI USD 4096–USD 12,695 in 2020Albania, Argentina, Armenia, Azerbaijan, Belarus, Botswana, Brazil, China, Colombia, Costa Rica, Ecuador, Fiji, Gabon, Guatemala, Jamaica, Kazakhstan, Lebanon, Malaysia, Mexico, Moldova, Namibia, Paraguay, Peru, South Africa, St. Lucia, Thailand, Turkiye (27)
Middle-Income groupLMICs (Lower middle-income countries and territories)Per capita GNI USD 1046–USD 4095 in 2020Algeria, Belize, Bolivia, Cabo Verde, Cameroon, Congo, Côte d’Ivoire, El Salvador, Eswatini, Ghana, Honduras, India, Indonesia, Kenya, Kyrgyzstan, Mongolia, Pakistan, Sri Lanka, Tajikistan, Ukraine, Uzbekistan, Vietnam, Zimbabwe (23)
Low-Income groupLDCs (Least developed countries)The Committee for Development Policy utilizes three criteria to identify least developed countries [42]:
a. GNI per capita.
b. HAI (human assets index).
c. EVI (economic and environmental vulnerability index).
Angola, Bangladesh, Benin, Bhutan, Burkina Faso, Burundi, Cameroon, Central African Republic, Chad, Ethiopia, Gambia, Guinea, Lao PDR, Liberia, Madagascar, Malawi, Mozambique, Nepal, Niger, Rwanda, Sao Tome and Principe, Senegal, Sierra Leone, Tanzania, Togo, Uganda, Zambia (27)
Table 4. Climate change mitigation ODA by income group from 2010 to 2021.
Income GroupClimate Change Mitigation ODA (USD Millions)Climate Change Mitigation ODA per Country (USD Millions)
High32,781 (28%)1214
Middle62,187 (52%)2303
Low24,029 (20%)1045
Total118,997 (100%)-
Table 5. Summarized statistics of the effects of climate change mitigation ODA on the human development index and greenhouse gas emissions in the total recipient countries.
VariablesHDIGHG EmissionsGHGfossil
Emissions
GHGlulucf
Emissions
Climate change
mitigation ODA
0.003 ** 0.002 0.0030.003
(0.001)(0.002)(0.002)(0.002)
Foreign direct
investment
0.003 **0.0020.003 0.004
(0.001)(0.003)(0.003)(0.002)
GDP per capita0.0370.0460.0510.090
(0.021)(0.042)(0.053)(0.080)
Health expenditure0.012 **---
(0.005)---
Education expenditure0.004---
(0.007)---
Control of corruption0.048 ***0.132 0.0120.041
(0.011)(0.097)(0.056)(0.048)
Vulnerability index 0.933 ***1.143 ** 0.688 **1.083 *
(0.193)(0.430)(0.247)(0.441)
Population-0.789 ***0.974 ***0.265 ***
-(0.112)(0.037)(0.069)
Forest area-0.3250.126 *0.493
-(0.232)(0.055)(0.355)
Renewable energy rate- 0.095 *** 0.249 ***0.136 **
-(0.021)(0.015)(0.047)
Observations847847847847
R20.2860.0920.4690.014
Adjusted R20.208 0.0080.411 0.095
F-statistic317.747 ***77.467 ***673.366 ***10.983
Notes: * Denotes statistical significance with p < 0.05; ** indicates p < 0.01; *** means p < 0.001. Standard errors of each parameter are estimated in brackets.
Table 6. Summarized statistics of the effects of climate change mitigation ODA on the human development index and greenhouse gas emissions in the high-income group.
VariablesHDIGHG EmissionsGHGfossil
Emissions
GHGlulucf
Emissions
Climate change
mitigation ODA
0.002 0.0040.0040.011
(0.001)(0.003)(0.003)(0.010)
Foreign direct
investment
0.001 * 0.005 ** 0.004 ** 0.004
(0.001)(0.002)(0.001)(0.004)
GDP per capita0.078 **0.0880.0440.391
(0.025)(0.094)(0.082)(0.312)
Health expenditure0.039 **---
(0.014)---
Education expenditure 0.012---
(0.008)---
Control of corruption 0.028 *** 0.198 *** 0.114 ** 0.143
(0.008)(0.037)(0.035)(0.089)
Vulnerability index 0.426 **1.582 ***0.634 ***3.533
(0.165)(0.176)(0.138)(2.070)
Population-0.611 ***0.339 ***0.564 ***
-(0.092)(0.076)(0.131)
Forest area-1.215 ***0.578 ***2.888
-(0.169)(0.172)(1.785)
Renewable energy rate-0.120 * 0.072 **0.302 ***
-(0.047)(0.027)(0.073)
Observations297297297297
R20.4430.1420.0680.048
Adjusted R20.3730.031 0.053 0.076
F-statistic204.358 ***43.025 ***19.309 *13.373
Notes: * Denotes statistical significance with p < 0.05; ** indicates p < 0.01; *** means p < 0.001. Standard errors of each parameter are estimated in brackets.
Table 7. Summarized statistics of the effects of climate change mitigation ODA on the human development index and greenhouse gas emissions in the middle-income group.
VariablesHDIGHG EmissionsGHGfossil
Emissions
GHGlulucf
Emissions
Climate change
mitigation ODA
0.00003 0.019 *** 0.003 0.0002
(0.002)(0.005)(0.002)(0.008)
Foreign direct
investment
0.001 *** 0.001 0.004 ***0.004
(0.0001)(0.002)(0.001)(0.002)
GDP per capita0.029 0.032 ***0.0360.052
(0.018)(0.004)(0.031)(0.069)
Health expenditure 0.041 *---
(0.018)---
Education expenditure0.012---
(0.009)---
Control of corruption0.082 ***0.418 **0.0050.678 ***
(0.018)(0.127)(0.099)(0.053)
Vulnerability index 0.748 ***4.039 *** 0.7531.669
(0.187)(0.651)(0.467)(0.892)
Population-0.907 ***1.017 ***0.197
-(0.197)(0.110)(0.267)
Forest area-0.1490.375 ***0.415
-(0.160)(0.070)(0.431)
Renewable energy rate- 0.300 *** 0.300 ***0.014
-(0.021)(0.024)(0.033)
Observations253253253253
R20.3190.0880.6900.021
Adjusted R20.231 0.0350.648 0.111
F-statistic104.698 ***21.182 **494.209 ***4.720
Notes: * Denotes statistical significance with p < 0.05; ** indicates p < 0.01; *** means p < 0.001. Standard errors of each parameter are estimated in brackets.
Table 8. Summarized statistics of the effects of climate change mitigation ODA on the human development index and greenhouse gas emissions in the low-income group.
VariablesHDIGHG EmissionsGHGfossil
Emissions
GHGlulucf
Emissions
Climate change
mitigation ODA
0.010 ***0.010 0.008 ***0.012
(0.003)(0.007)(0.002)(0.008)
Foreign direct
investment
0.005 ** 0.0030.002 0.007 **
(0.001)(0.002)(0.002)(0.003)
GDP per capita0.0160.0300.0450.027
(0.017)(0.026)(0.034)(0.027)
Health expenditure0.045 ***---
(0.004)---
Education expenditure0.008*---
(0.004)---
Control of corruption0.079 ***0.245 ** 0.0110.358 ***
(0.022)(0.090)(0.053)(0.072)
Vulnerability index 1.524 *** 0.752 0.804 1.649
(0.297)(1.290)(0.491)(1.764)
Population-0.655 ***0.970 ***0.245
-(0.191)(0.052)(0.279)
Forest area-0.4480.1270.490
-(0.434)(0.076)(0.672)
Renewable energy rate- 0.473 *** 0.786 ***0.103
-(0.133)(0.102)(0.166)
Observations297297297297
R20.3850.2300.6600.060
Adjusted R20.3080.1300.616 0.062
F-statistic198.941 ***78.798 ***507.887 ***16.903 *
Notes: * Denotes statistical significance with p < 0.05; ** indicates p < 0.01; *** means p < 0.001. Standard errors of each parameter are estimated in brackets.
Table 9. Key sectoral climate change mitigation ODA by income group from 2010 to 2020.
SectorLow-Income GroupMiddle-Income GroupHigh-Income Group
Transport19.1%40.0%18.8%
Energy42.8%35.2%26.1%
Environmental protection7.7%8.9%26.9%
Water3.6%2.3%6.6%
Agriculture10.9%2.1%2.1%
Forestry1.9%2.5%3.1%
Disclaimer/Publisher’s Note: The statements, opinions and data contained in all publications are solely those of the individual author(s) and contributor(s) and not of MDPI and/or the editor(s). MDPI and/or the editor(s) disclaim responsibility for any injury to people or property resulting from any ideas, methods, instructions or products referred to in the content.

