
Drivers of Forest Dieback and Growth Decline in Mountain Abies fabri Forests (Gongga Mountain, SW China)

 , ,
, ,  ,
, 

Abstract
1. Introduction
2. Materials and Methods
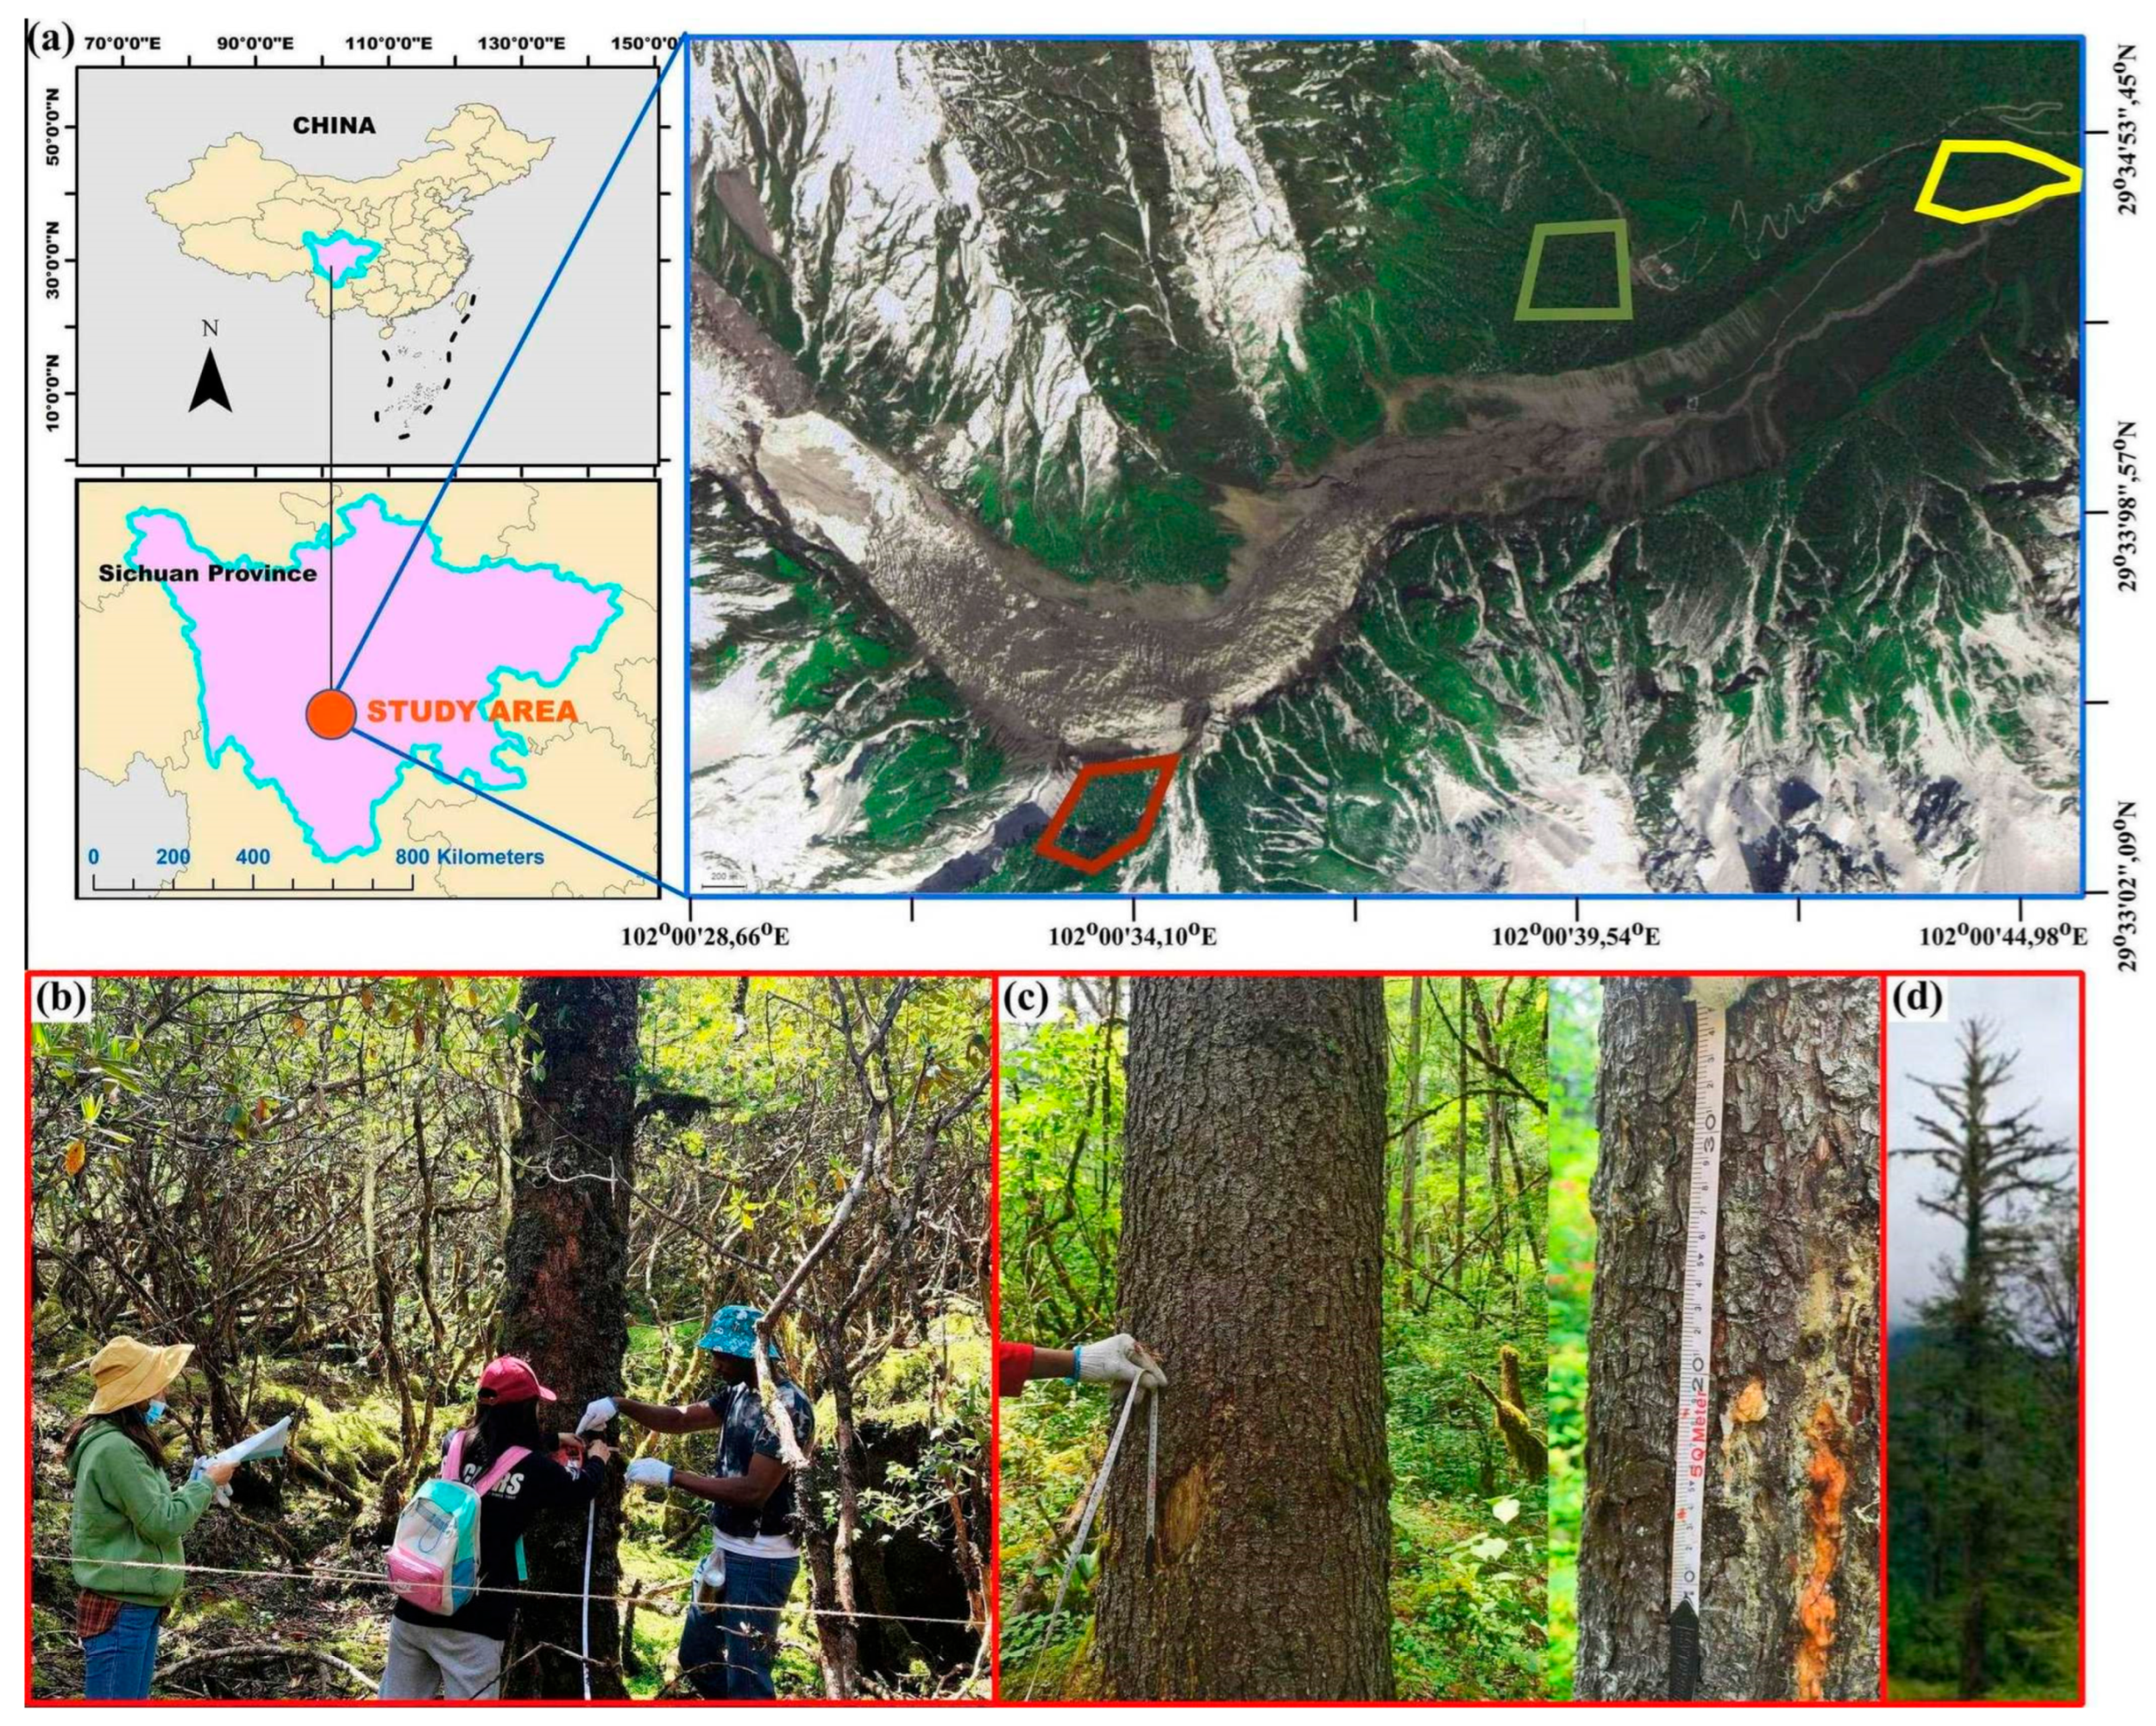
2.1. Study Area and Study Species
2.2. Experimental Design and Field Data
- Crown Defoliation: We assessed the level of leaf loss or discoloration in the crown. Healthy trees typically exhibited full, green crowns with minimal leaf loss, while declining trees showed significant defoliation, with reduced leaf density and browning or yellowing of foliage. Healthy trees typically exhibited full, green crowns with minimal leaf loss. Declining trees showed significant defoliation, defined as more than 25% cumulative defoliation, reduced leaf density, and browning or yellowing of foliage.
- Crown Structure: In addition to defoliation, the overall structure of the crown was evaluated. Healthy trees generally had a well-developed, symmetrical crown shape, while declining trees often presented irregularities such as thinning or uneven branch distribution.
- Stem Condition: The health of the tree trunk was also assessed through visual inspections for signs of damage or disease, such as bark lesions, cankers, or signs of decay. Healthy trees typically exhibited robust bark and a strong stem, while declining trees often showed signs of decline, including fungal infections or resin pockets due to bark beetle attacks.
2.3. Climate Data
2.4. Tree Core Sample Collection, Processing, and Analysis
2.5. Climate–Growth Relationships
2.6. Soil and Leaf Samples: Collection and Analyses
2.7. Data Analyses
3. Results
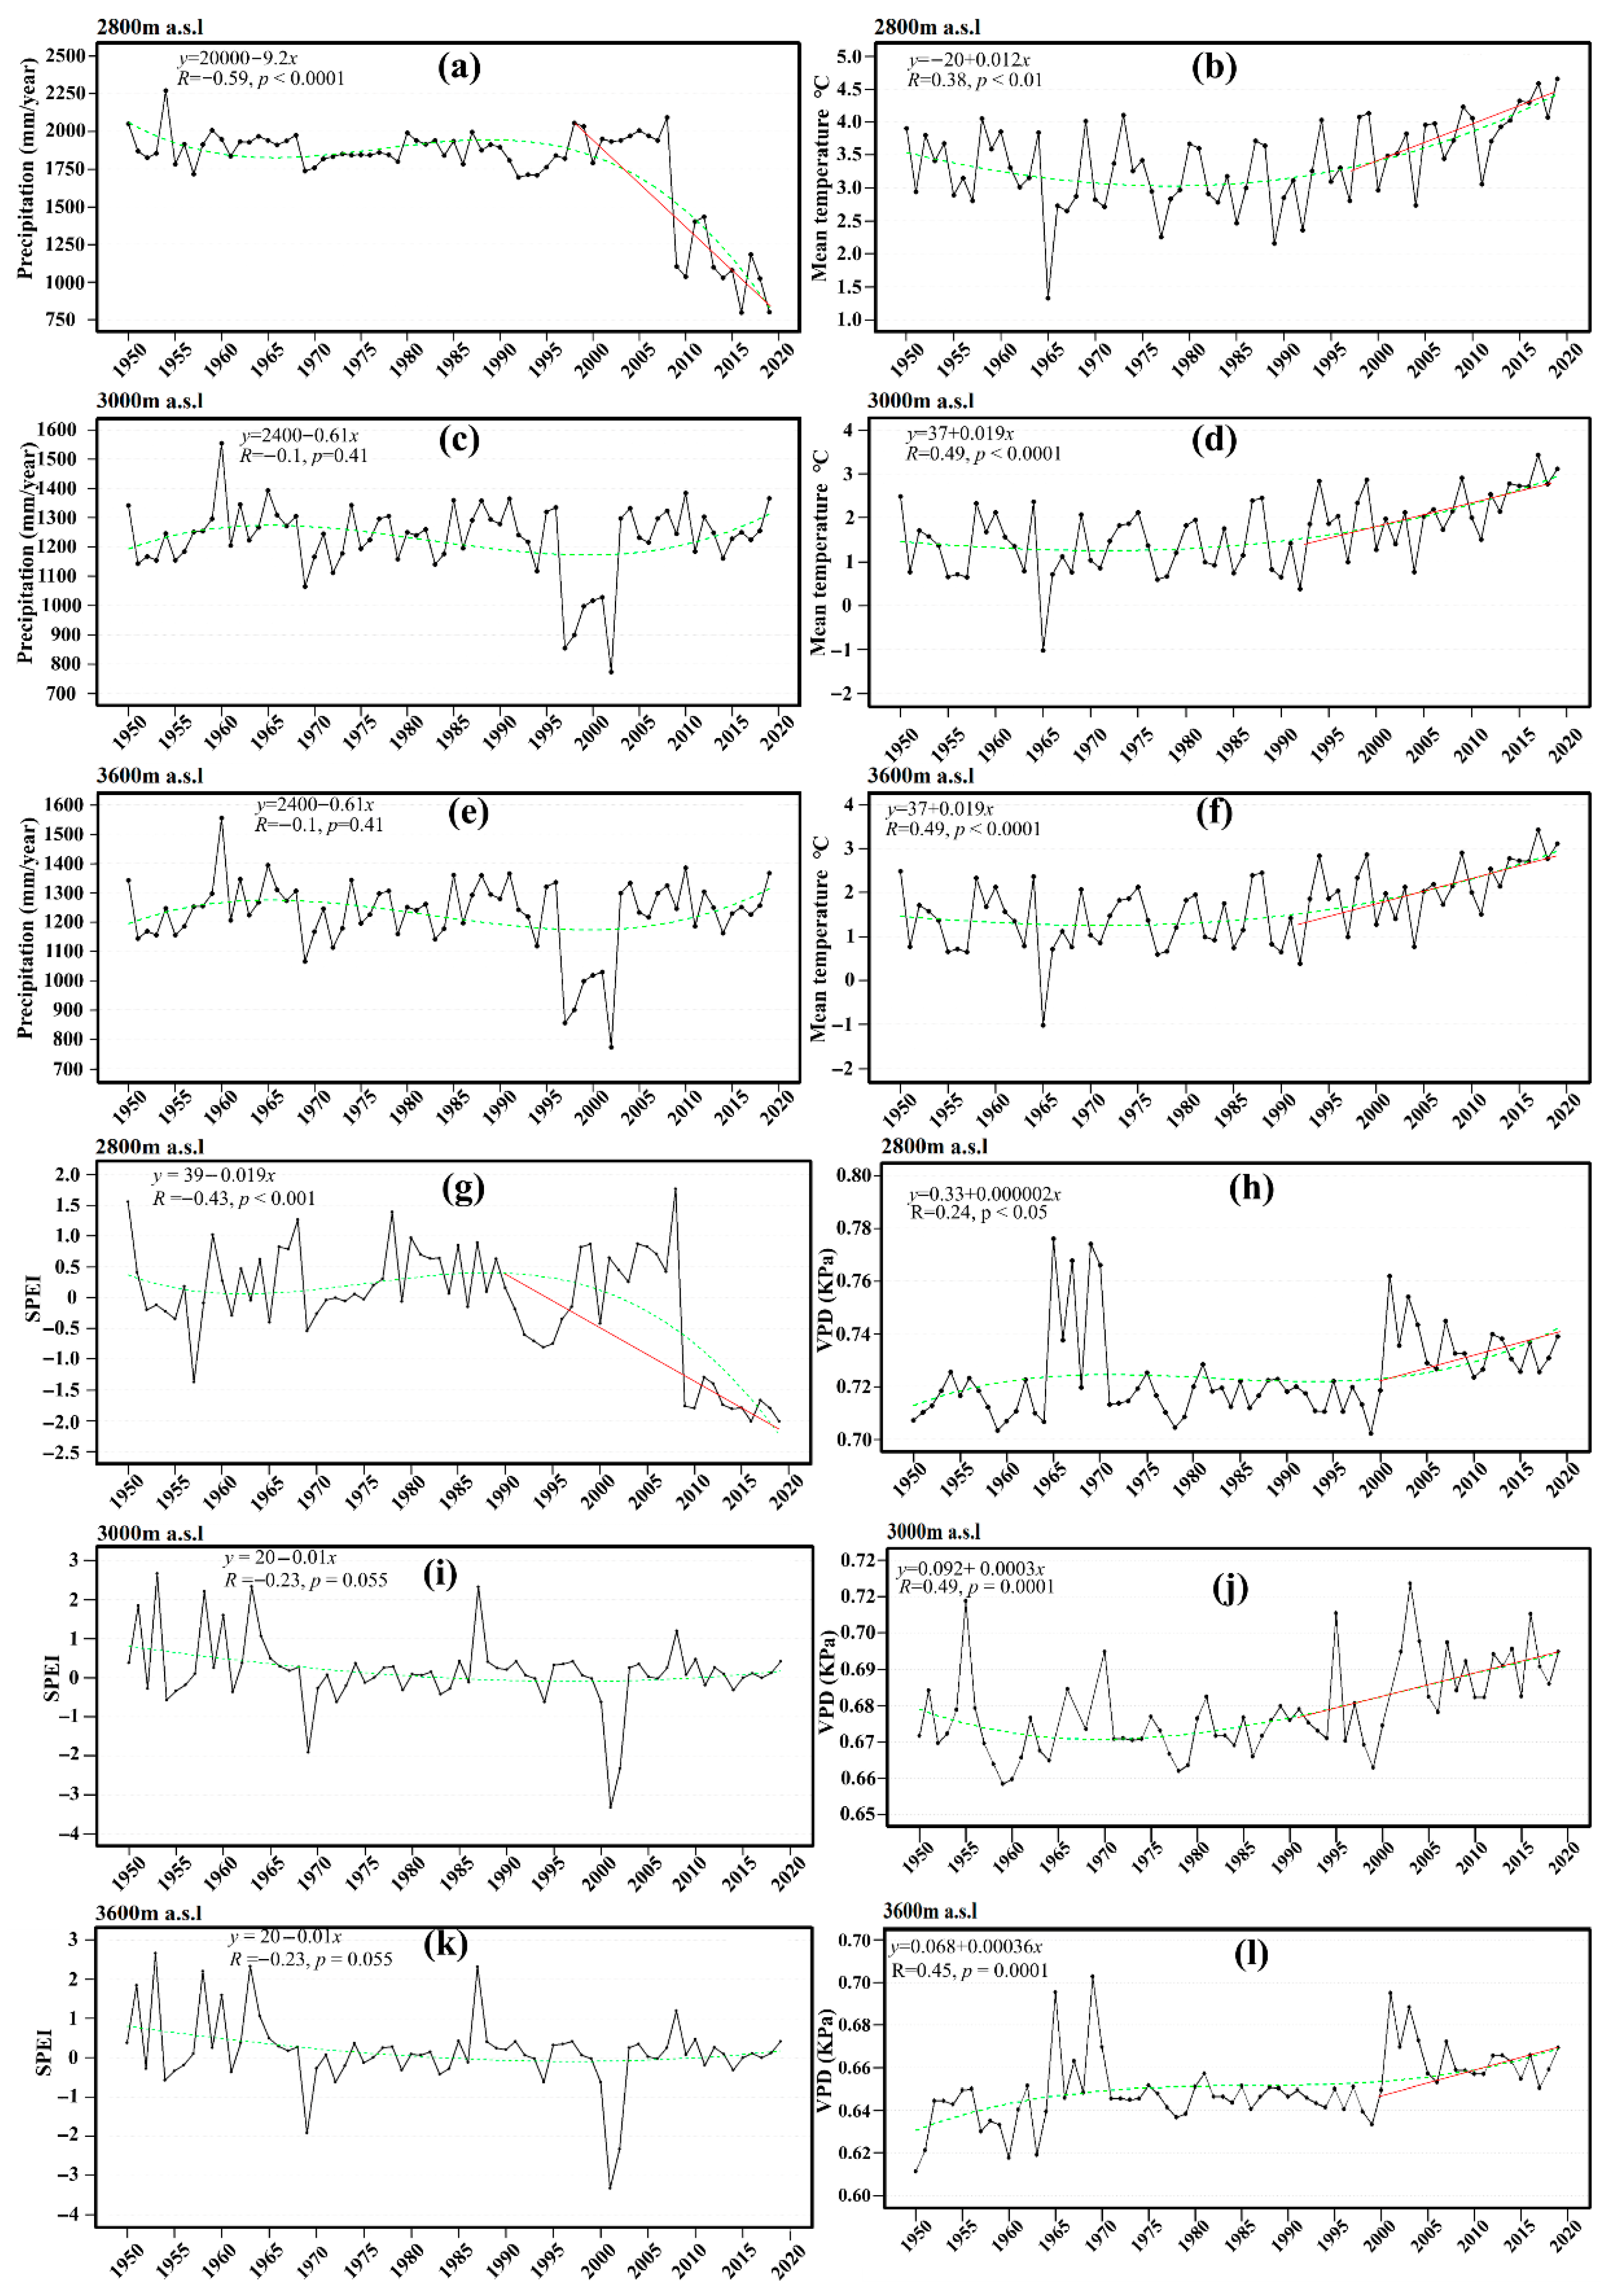
3.1. Climate Trends
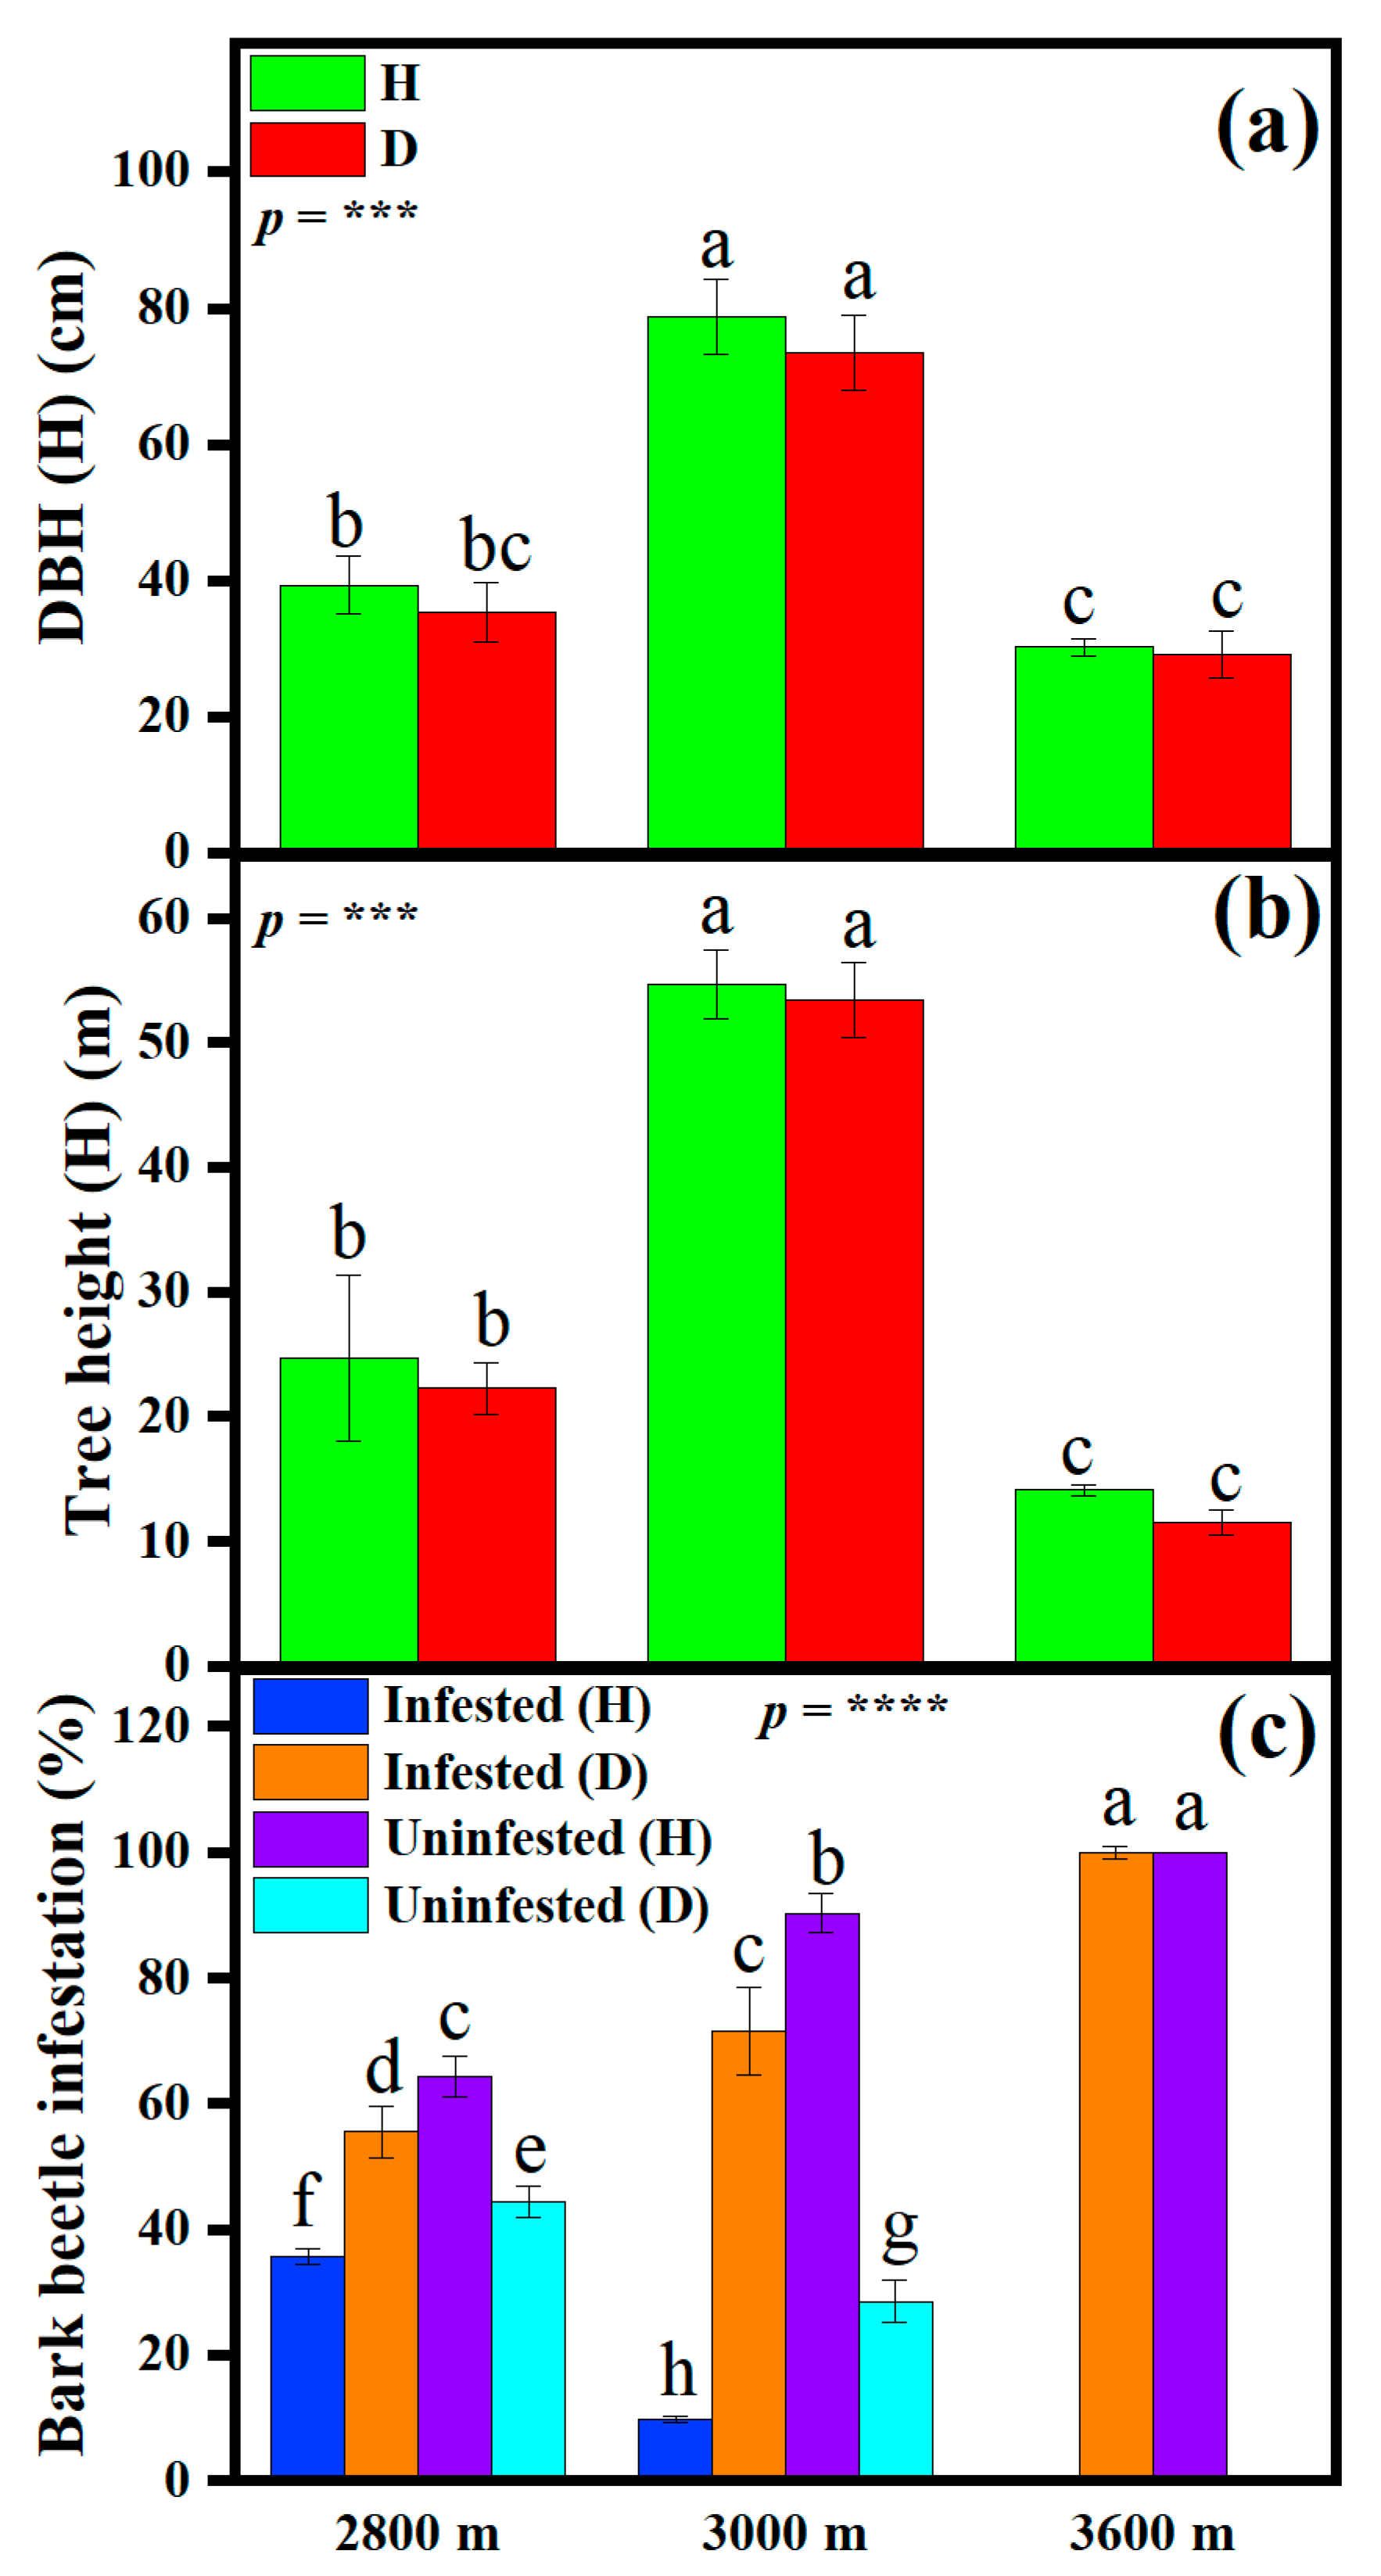
3.2. Changes in Tree Size and Beetle Infestation Along the Elevational Gradient
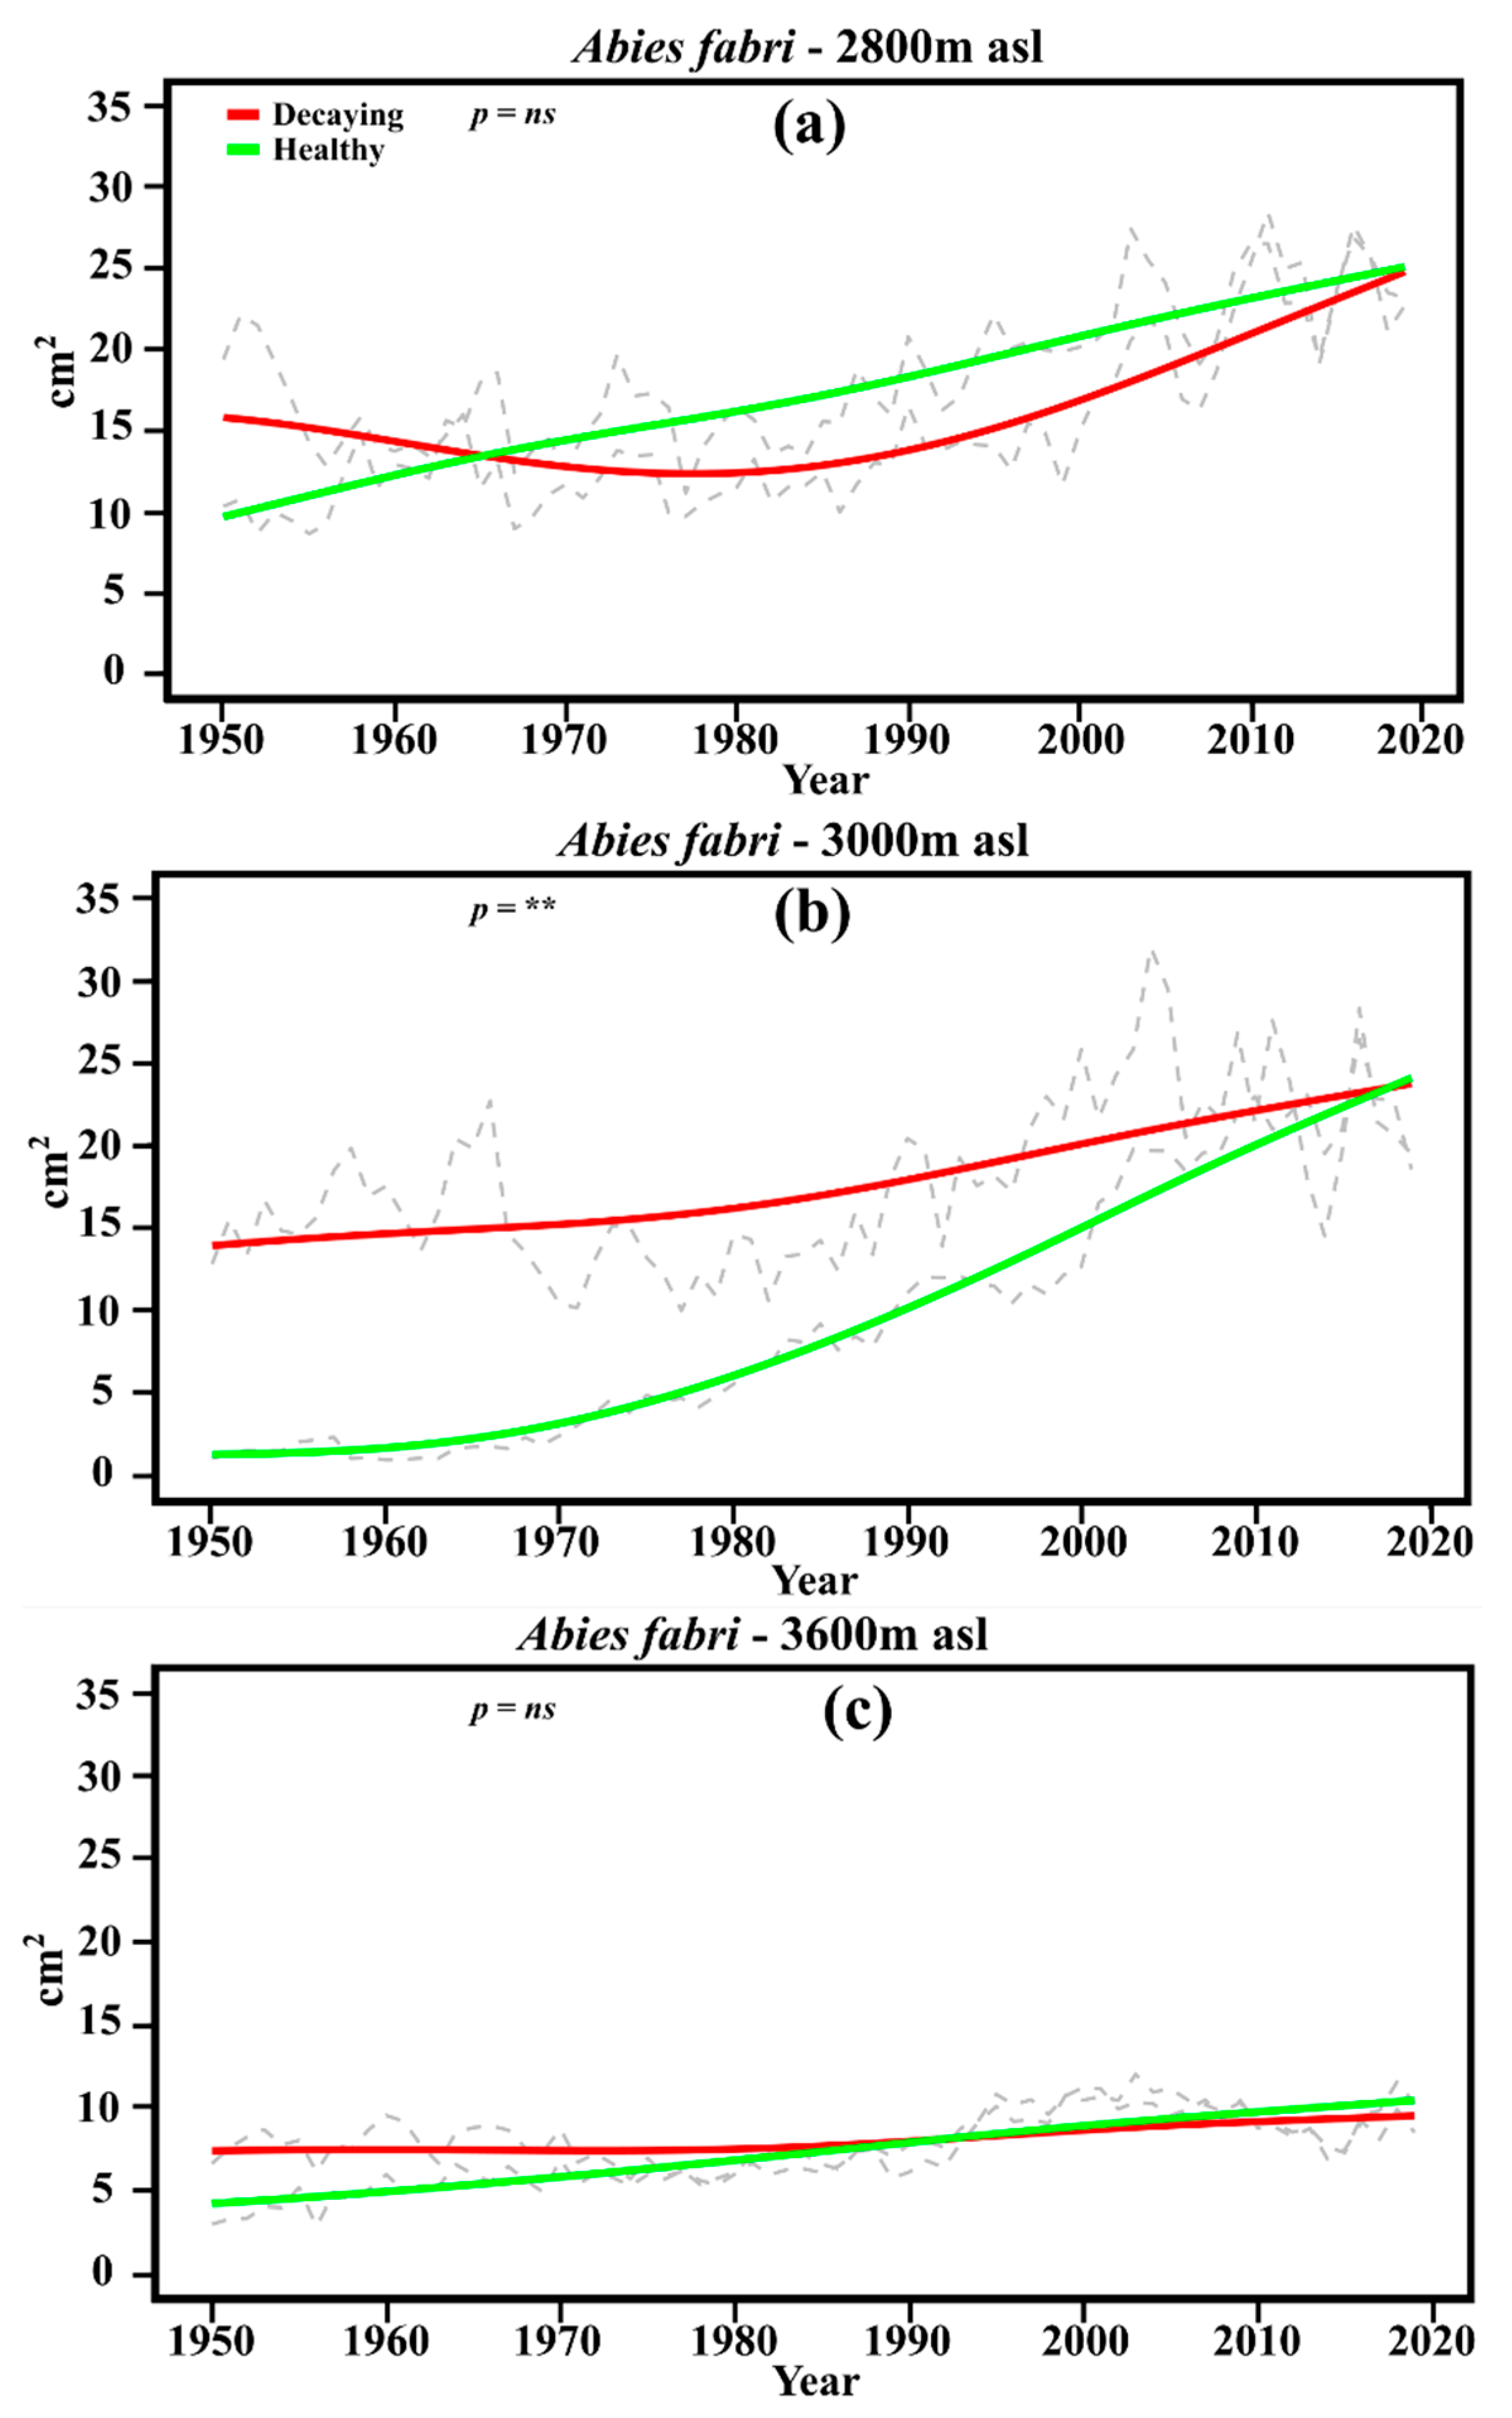
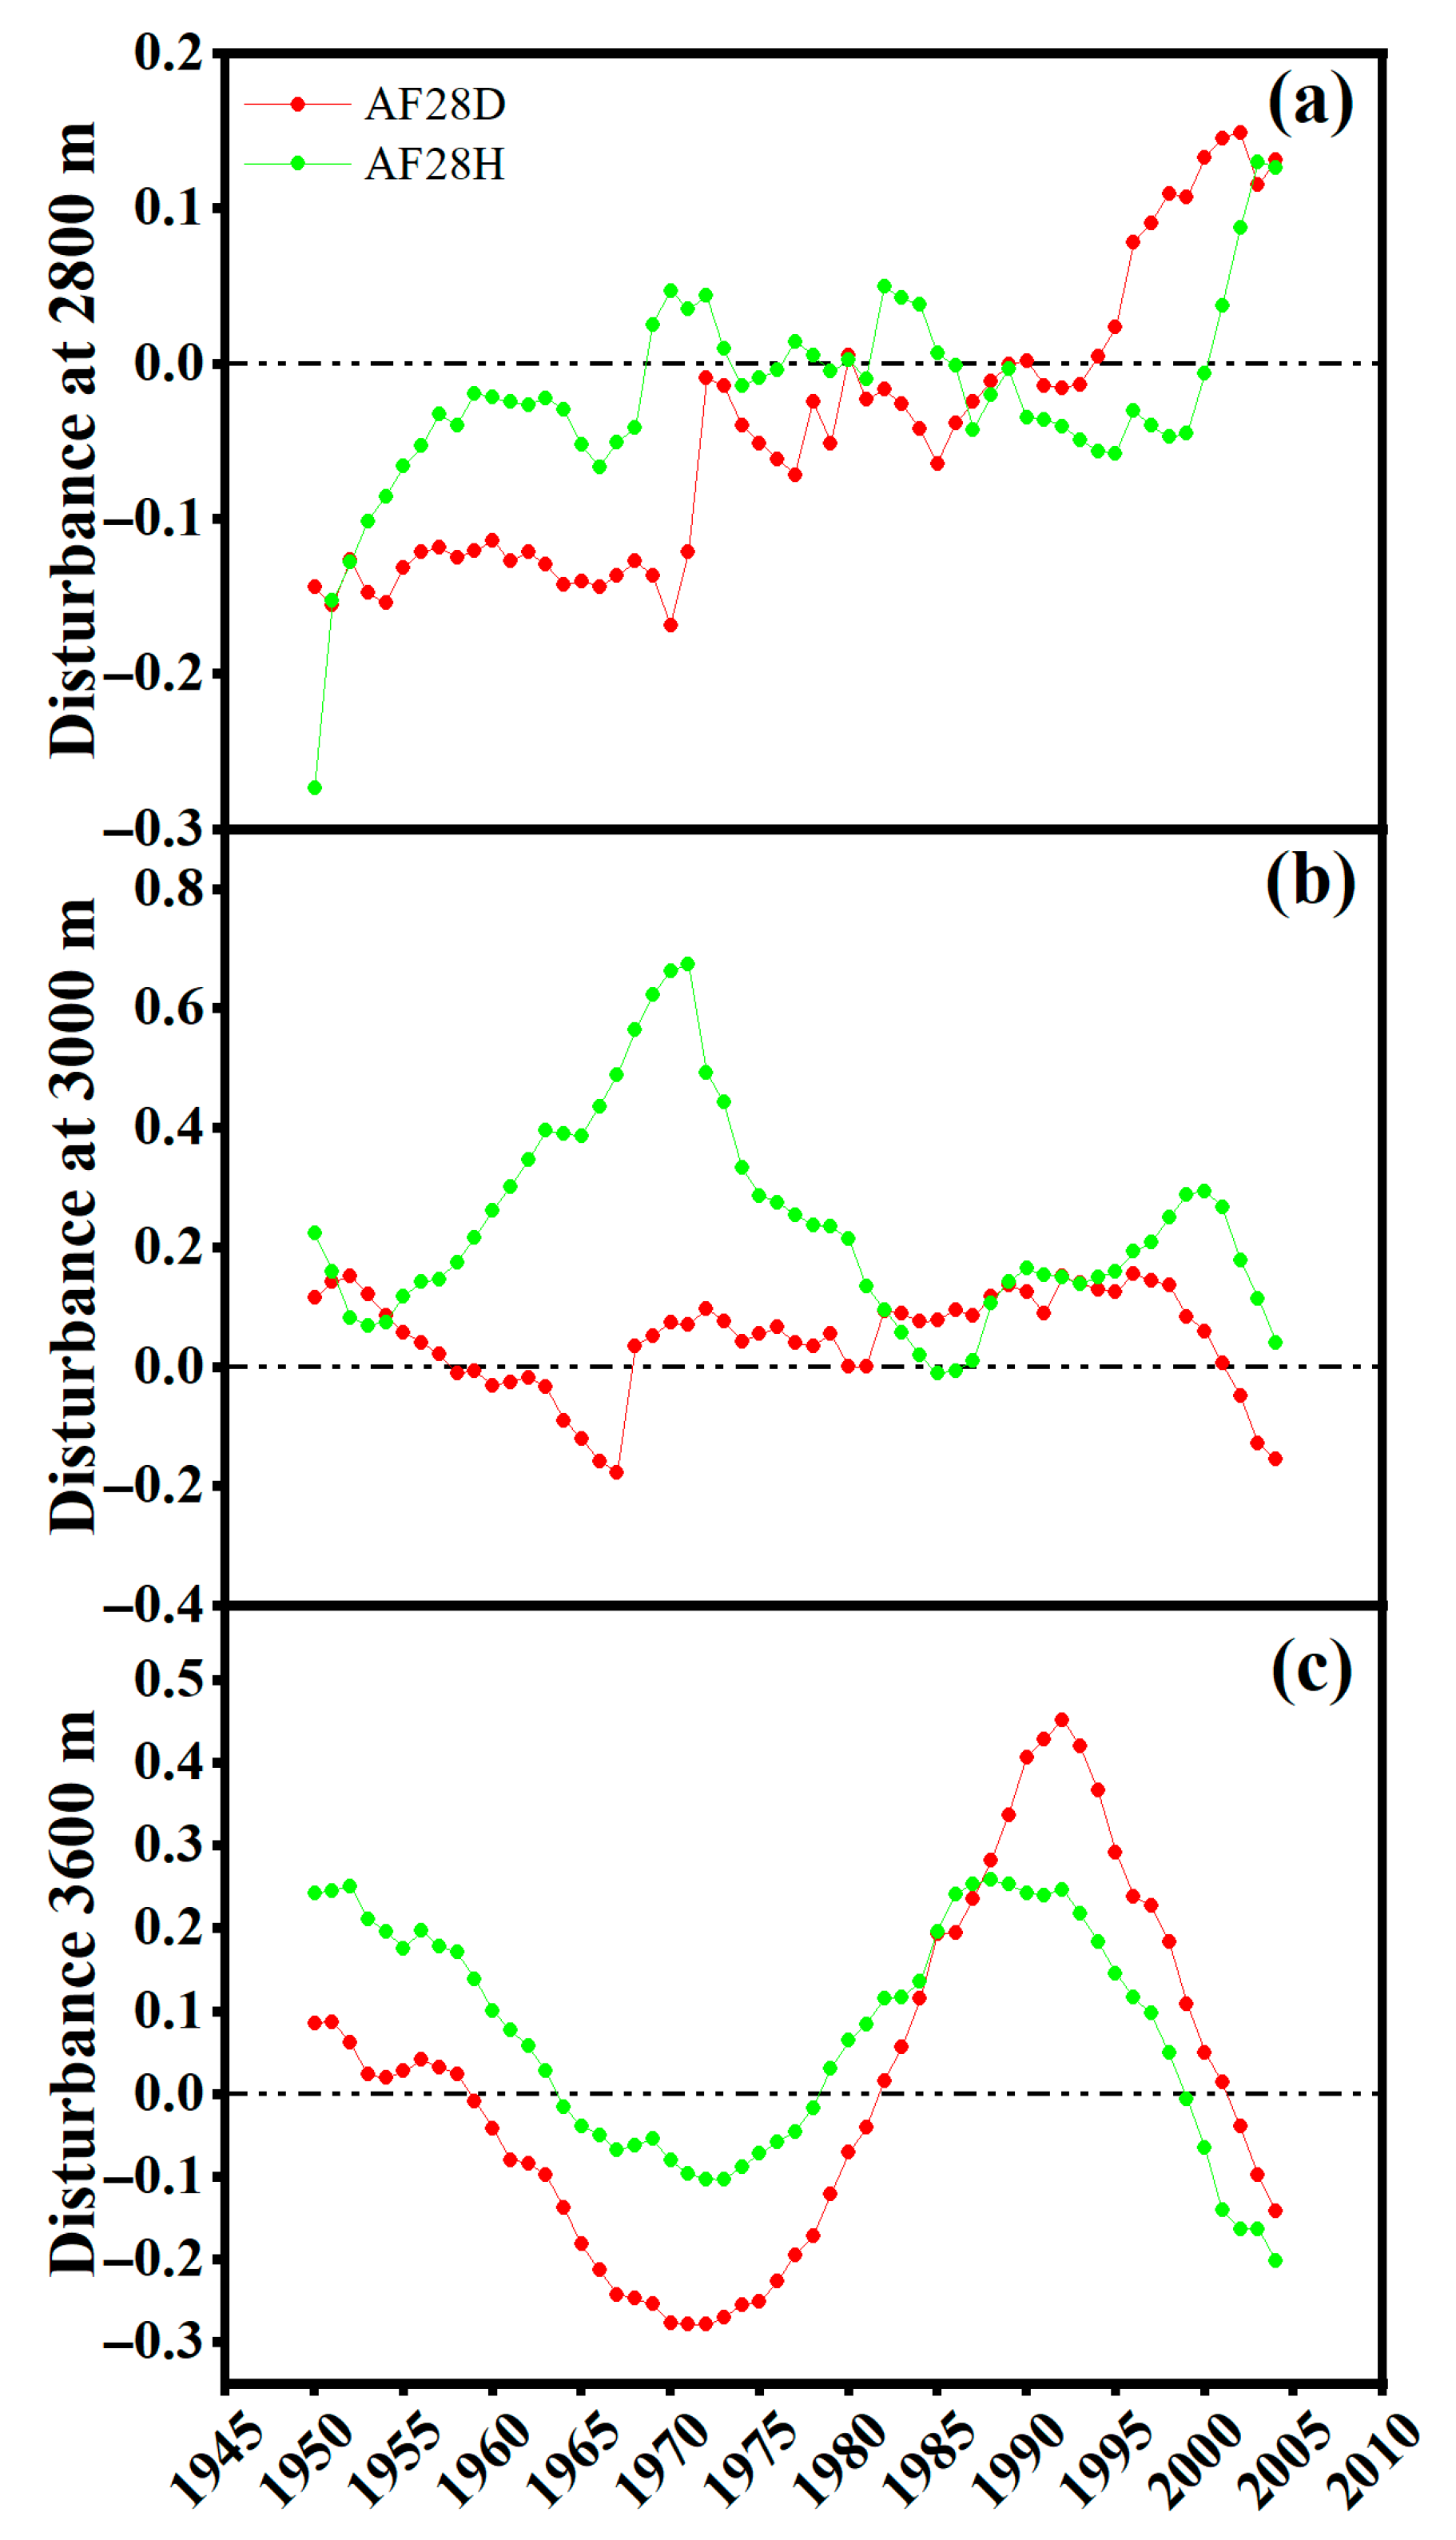
3.3. Growth Trends and Disturbances
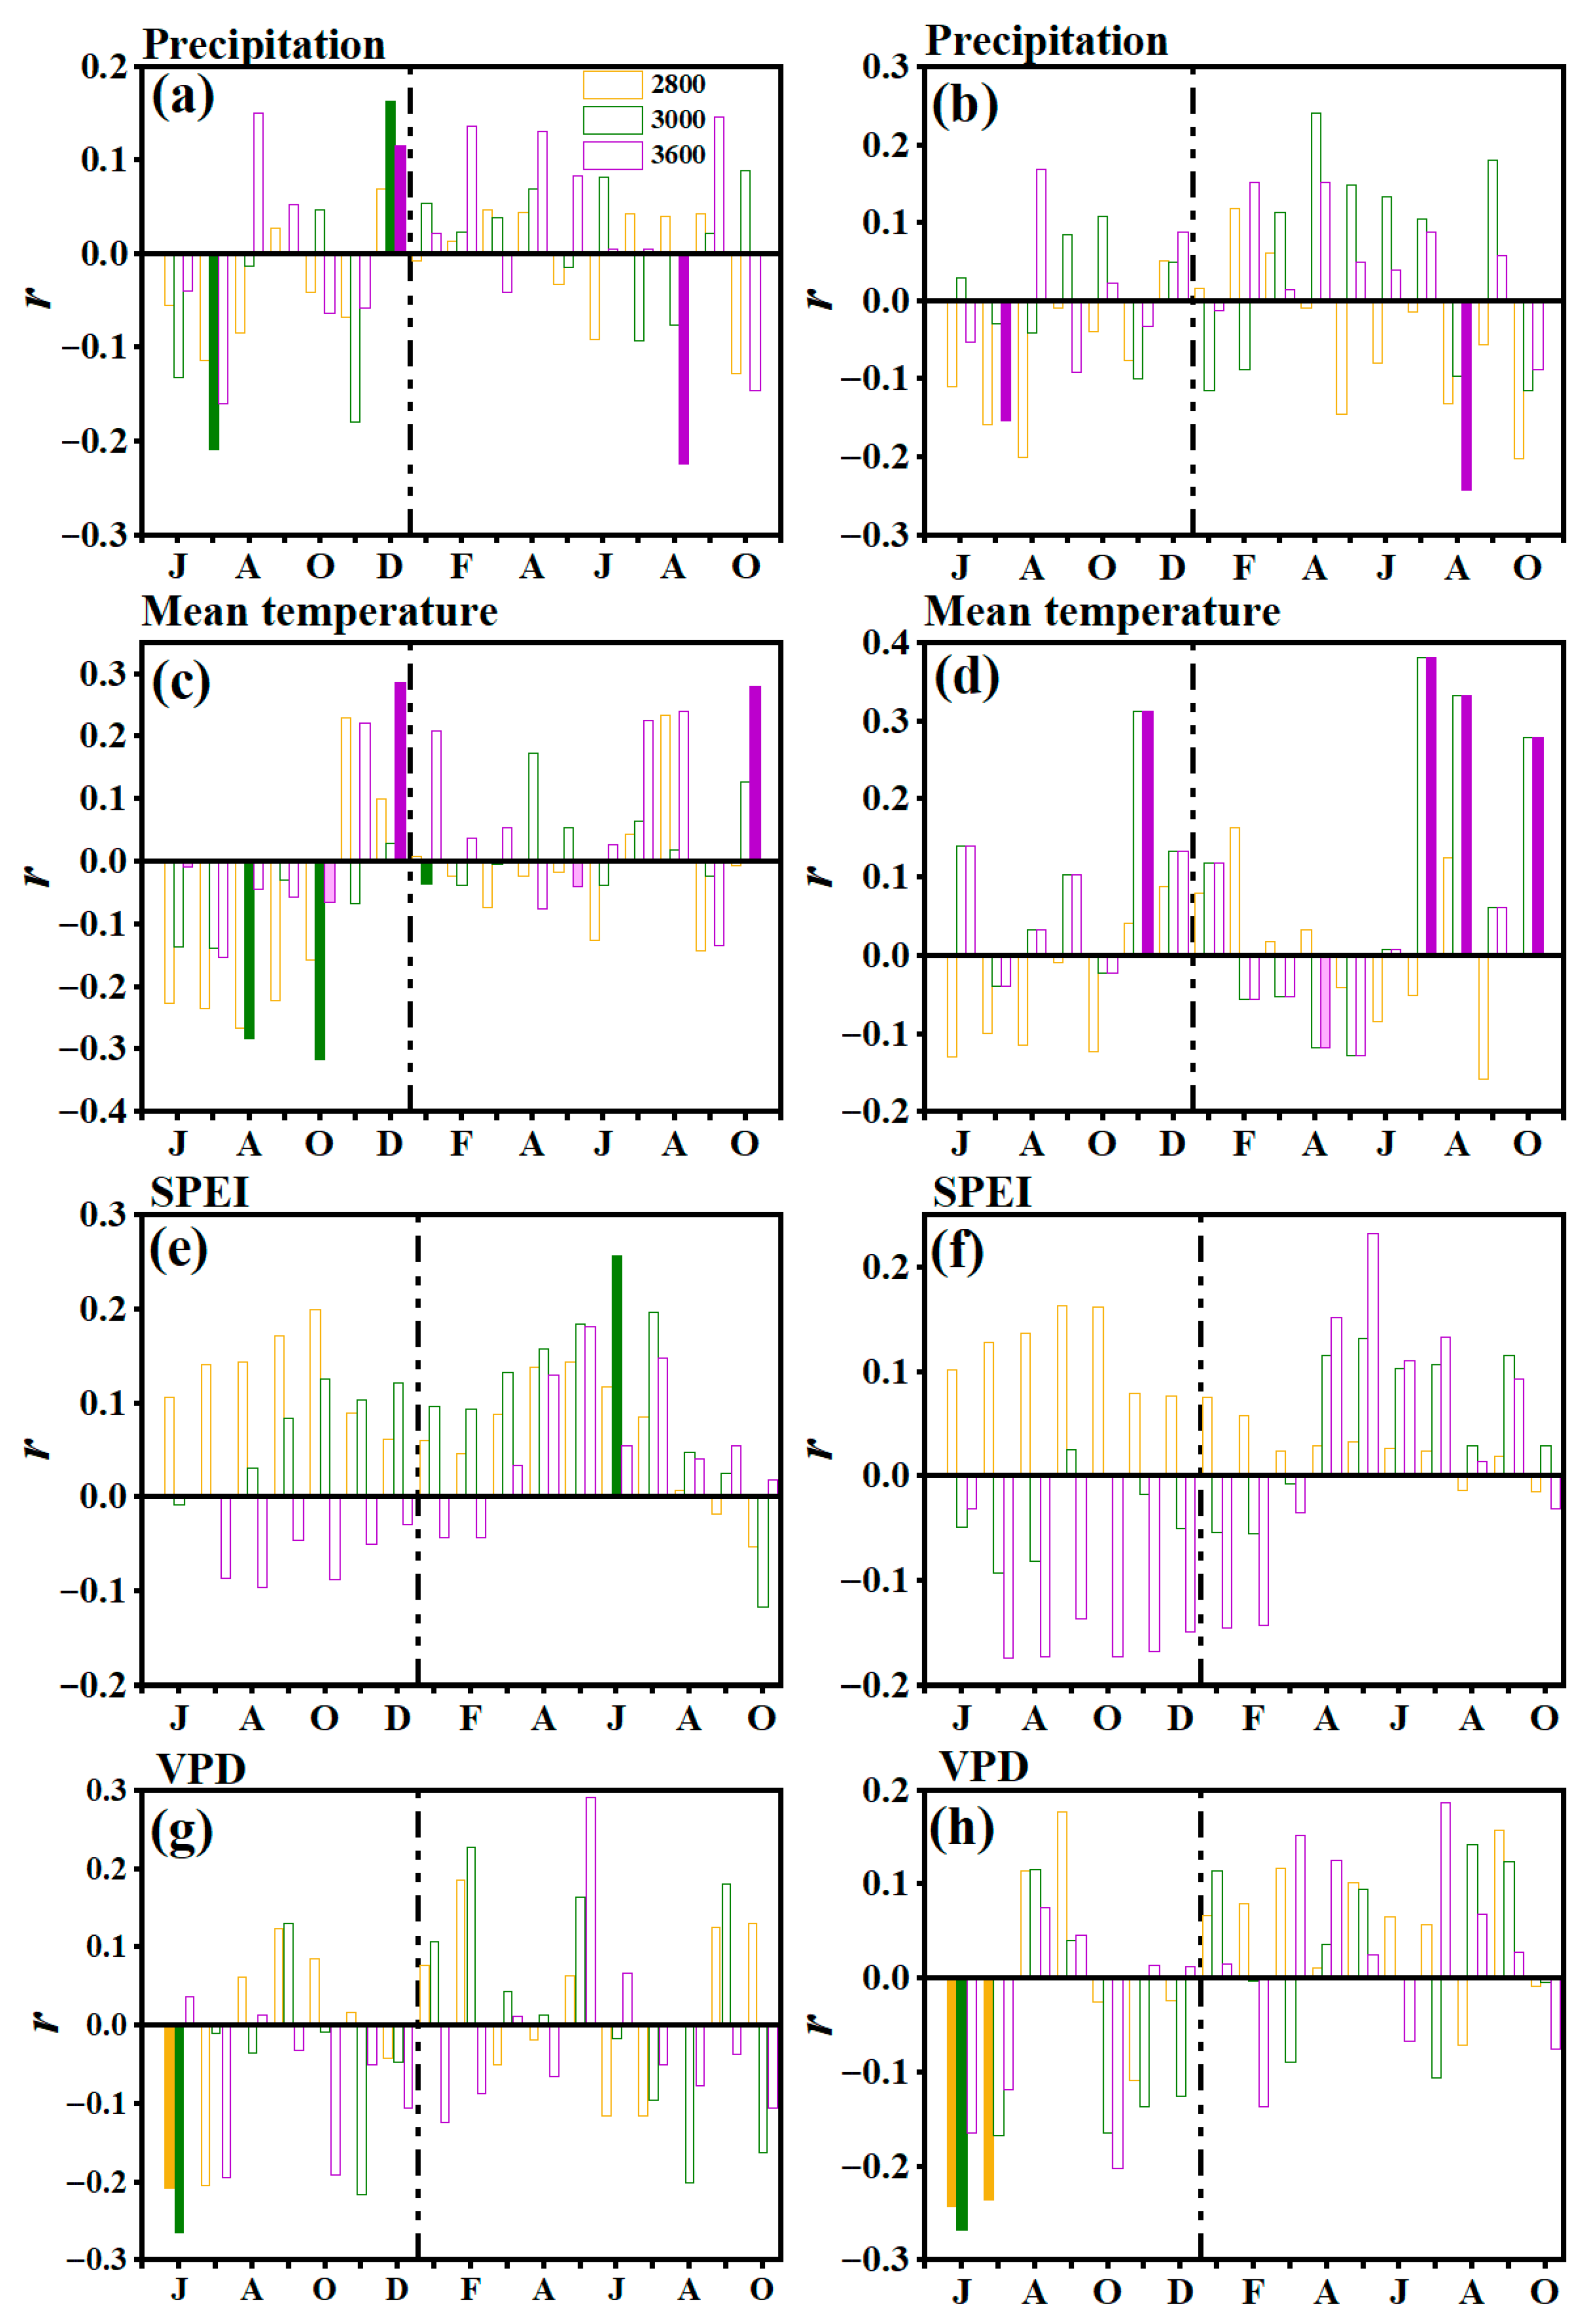
3.4. Climate–Growth Relationships
3.5. Soil and Leaf Nutrient Concentrations
4. Discussion
4.1. Elevation Changes in Climate Trends and Their Role in Tree Health
4.2. Tree Growth Trends and Climate–Growth Variability
4.3. Disturbance Dynamics and Their Links with Tree Health
4.4. Climate Change and Its Impacts on a. Fabri Health
5. Conclusions
Supplementary Materials
Author Contributions
Funding
Data Availability Statement
Conflicts of Interest
References
- Anderson, K.; Fawcett, D.; Cugulliere, A.; Benford, S.; Jones, D.; Leng, R. Vegetation expansion in the subnival Hindu Kush Himalaya. Glob. Change Biol. 2020, 26, 1608–1625. [Google Scholar] [CrossRef] [PubMed]
- Allen, C.D.; Breshears, D.D.; Mcdowell, N.G.; Allen, C.; Breshears, D.D.; Mcdowell, N.G. On Underestimation of global vulnerability to tree mortality and forest die-off from hotter drought in the Anthropocene. Ecosphere 2015, 6, 129. [Google Scholar] [CrossRef]
- Blomdahl, E.M.; Speer, J.H.; Kaye, M.; Zampieri, N.E.; Rochner, M.; Currey, B.; Alving, D.; Cahalan, G.D.; Hagedorn, B.; Li, H.; et al. Drivers of forest change in the Greater Yellowstone Ecosystem. J. Veg. Sci. 2022, 33, 1–14. [Google Scholar] [CrossRef]
- Hammond, W.M.; Williams, A.P.; Abatzoglou, J.T.; Adams, H.D.; Klein, T.; López, R.; Sáenz-Romero, C.; Hartmann, H.; Breshears, D.D.; Allen, C.D. Global field observations of tree die-off reveal hotter-drought fingerprint for earth’s forests. Nat. Commun. 2022, 13, 1761. [Google Scholar] [CrossRef] [PubMed]
- Zhao, P.; Xu, C.; Zhou, M.; Zhang, B.; Ge, P.; Zeng, N.; Liu, H. Rapid regeneration offsets losses from warming-induced tree mortality in an aspen-dominated broad-leaved forest in Northern China. PLoS ONE 2018, 13, e0195630. [Google Scholar] [CrossRef] [PubMed]
- Qiu, S.; Xu, M.; Li, R.; Zheng, Y.; Clark, D.; Cui, X.; Liu, L.; Lai, C.; Zhang, W.; Liu, B. Climatic information improves statistical individual-tree mortality models for three key species of Sichuan Province, China. Ann. For. Sci. 2015, 72, 443–455. [Google Scholar] [CrossRef]
- Mutch, L.S.; Parsons, D.J.; Workinger, D.A.; Aston, S.; Molden, C.; Roland, J. Mixed conifer forest mortality and establishment before and after prescribed fire in Sequoia National Park, California. For. Sci. 1998, 44, 341–355. [Google Scholar] [CrossRef]
- Fan, C.; Zhang, C.; Zhao, X. Functional traits explain growth–mortality trade-offs in a mixed broadleaf-conifer forest in Northeastern China. Eur. J. For. Res. 2022, 141, 117–128. [Google Scholar] [CrossRef]
- Xu, P.; Fang, W.; Zhou, T.; Li, H.; Zhao, X.; Berman, S.; Zhang, T.; Yi, C. Satellite Evidence of Canopy-Height Dependence of forest drought resistance in Southwestern China. Environ. Res. Lett. 2022, 17, 025005. [Google Scholar] [CrossRef]
- Wang, Y.; Wang, Y.; Chen, Y.; Chen, H.; Li, X.; Ding, Z.; Han, X.; Tang, X. Spatial and temporal characteristics of drought events in Southwest China over the past 120 years. Remote Sens. 2023, 15, 3008. [Google Scholar] [CrossRef]
- Qiu, J. China drought highlights future climate threats. Nature 2010, 465, 142–143. [Google Scholar] [CrossRef] [PubMed]
- Wu, Z.; Yan, S.; He, L.; Shan, Y. Spatiotemporal changes in forest loss and its linkage to burned areas in China. J. Res. 2020, 31, 2525–2536. [Google Scholar] [CrossRef]
- Ren, H.; Zhang, L.; Yan, M.; Chen, B.; Yang, Z.; Ruan, L. Spatiotemporal assessment of forest fire vulnerability in China using automated machine learning. Remote Sens. 2022, 14, 5965. [Google Scholar] [CrossRef]
- Chi, X.; Tang, Z.; Xie, Z.; Guo, Q.; Zhang, M.; Ge, J.; Xiong, G.; Fang, J. Effects of size, neighbors, and site condition on tree growth in a subtropical evergreen and deciduous broad-leaved mixed forest, China. Ecol. Evol. 2015, 5, 5149–5161. [Google Scholar] [CrossRef] [PubMed]
- Pérez-Harguindeguy, N.; Díaz, S.; Garnier, E.; Lavorel, S.; Poorter, H.; Jaureguiberry, P.; Bret-Harte, M.S.; Cornwell, W.K.; Craine, J.M.; Gurvich, D.E.; et al. New Handbook for standardised measurement of plant functional traits worldwide. Aust. J. Bot. 2013, 61, 167–234. [Google Scholar] [CrossRef]
- Chaturvedi, R.K.; Raghubanshi, A.S.; Singh, J.S. Leaf attributes and tree growth in a tropical dry forest. J. Veg. Sci. 2011, 22, 917–931. [Google Scholar] [CrossRef]
- Boyden, S.; Binkley, D.; Stape, J.L. Competition among eucalyptus trees depends on genetic variation and resource supply. Ecology 2008, 89, 2850–2859. [Google Scholar] [CrossRef] [PubMed]
- Stephenson, N.L.; Das, A.J.; Condit, R.; Russo, S.E.; Baker, P.J.; Beckman, N.G.; Coomes, D.A.; Lines, E.R.; Morris, W.K.; Rüger, N.; et al. Rate of tree carbon accumulation increases continuously with tree size. Nature 2014, 507, 90–93. [Google Scholar] [CrossRef] [PubMed]
- Chamard, J.; Faticov, M.; Blanchet, F.G.; Chagnon, P.L.; Laforest-Lapointe, I. Interplay of Biotic and Abiotic Factors Shapes Tree Seedling Growth and Root-Associated Microbial Communities. Commun. Biol. 2024, 7, 360. [Google Scholar] [CrossRef] [PubMed]
- Zveushe, O.K.; Sajid, S.; Dong, F.; Han, Y.; Zeng, F.; Geng, Y.; Shen, S.; Xiang, Y.; Kang, Q.; Zhang, Y.; et al. Different sex combinations of Populus cathayana affect soil respiration and tea litter decomposition by influencing plant growth and soil functional microbial diversity. Plant Soil 2023, 490, 631–650. [Google Scholar] [CrossRef]
- Zonnevylle, H.M.; Acharya, K.; Potvin, L.; Romanski, M.; Ibáñez, I. Long-Term effects of herbivory on tree growth are not consistent with browsing preferences. J. For. Res. 2023, 53, 234–243. [Google Scholar] [CrossRef]
- Ramos, R.F.; Sobucki, L.; Pawlowski, E.; Sarzi, J.S.; Rabuske, J.E.; Savian, L.G.; Kaspary, T.E.; Bellé, C.; Ramos, R.F.; Sobucki, L.; et al. Perspective chapter: Microorganisms and their relationship with tree health. In Current and Emerging Challenges in the Diseases of Trees; IntechOpen: London, UK, 2023. [Google Scholar]
- Chen, N.; Zhang, Y.; Yuan, F.; Song, C.; Xu, M.; Wang, Q.; Hao, G.; Bao, T.; Zuo, Y.; Liu, J.; et al. Warming-induced vapor pressure deficit suppression of vegetation growth diminished in Northern Peatlands. Nat. Commun. 2023, 14, 7885. [Google Scholar] [CrossRef] [PubMed]
- Grossiord, C.; Buckley, T.N.; Cernusak, L.A.; Novick, K.A.; Poulter, B.; Siegwolf, R.T.W.; Sperry, J.S.; McDowell, N.G. Plant responses to rising vapor pressure deficit. New Phytol. 2020, 226, 1550–1566. [Google Scholar] [CrossRef] [PubMed]
- Novick, K.A.; Ficklin, D.L.; Grossiord, C.; Konings, A.G.; Martínez-Vilalta, J.; Sadok, W.; Trugman, A.T.; Williams, A.P.; Wright, A.J.; Abatzoglou, J.T.; et al. The impacts of rising vapour pressure deficit in natural and managed ecosystems. Plant Cell Environ. 2024, 47, 3561–3589. [Google Scholar] [CrossRef] [PubMed]
- Dale, A.G.; Frank, S.D. Water availability determines tree growth and physiological response to biotic and abiotic stress in a temperate North American urban forest. Forests 2022, 13, 1012. [Google Scholar] [CrossRef]
- Marchin, R.M.; Esperon-Rodriguez, M.; Tjoelker, M.G.; Ellsworth, D.S. Crown dieback and mortality of urban trees linked to heatwaves during extreme drought. Sci. Total Environ. 2022, 850, 157915. [Google Scholar] [CrossRef] [PubMed]
- Yuanqing, H.; Zongxing, L.; Xiaomei, Y.; Wenxiong, J.; Xianzhong, H.; Bo, S.; Ningning, Z.; Qiao, L. Changes of the Hailuogou Glacier, Mt. Gongga, China, against the background of global warming in the last several decades. J. China Univ. Geosci. 2008, 19, 271–281. [Google Scholar] [CrossRef]
- Durand-Gillmann, M.; Cailleret, M.; Boivin, T.; Nageleisen, L.M.; Davi, H. Individual vulnerability factors of silver fir (Abies alba Mill.) to parasitism by two contrasting biotic agents: Mistletoe (Viscum album L. ssp. abietis) and bark beetles (Coleoptera: Curculionidae: Scolytinae) during a decline process. Ann. For Sci. 2014, 71, 659–673. [Google Scholar] [CrossRef]
- Kelsey, R.G.; Gallego, D.; Sánchez-García, F.J.; Pajares, J.A. Ethanol accumulation during severe drought may signal tree vulnerability to detection and attack by bark beetles. Can. J. For. Res. 2014, 44, 554–561. [Google Scholar] [CrossRef]
- González de Andrés, E.; Gazol, A.; Querejeta, J.I.; Igual, J.M.; Colangelo, M.; Sánchez-Salguero, R.; Linares, J.C.; Camarero, J.J. The role of nutritional impairment in carbon-water balance of silver fir drought-induced dieback. Glob. Change Biol. 2022, 28, 4439–4458. [Google Scholar] [CrossRef] [PubMed]
- McGivney, E.; Gustafsson, J.P.; Belyazid, S.; Zetterberg, T.; Löfgren, S. Assessing the impact of acid rain and forest harvest intensity with the HD-MINTEQ model-soil chemistry of three Swedish conifer sites from 1880 to 2080. Soil 2019, 5, 63–77. [Google Scholar] [CrossRef]
- Li, Y.; Wang, Y.; Wang, Y.; Wang, B. Effects of simulated acid rain on soil respiration and its component in a mixed coniferous-broadleaved forest of the Three Gorges reservoir area in Southwest China. For. Ecosyst. 2019, 6, 32. [Google Scholar] [CrossRef]
- Ibrahim, M.H.; Kasim, S.; Ahmed, O.H.; Mohd. Rakib, M.R.; Hasbullah, N.A.; Islam Shajib, M.T. Impact of simulated acid rain on chemical properties of Nyalau Series soil and its leachate. Sci. Rep. 2024, 14, 3534. [Google Scholar] [CrossRef] [PubMed]
- Wu, F.H.; Chen, J.; Liu, T.W.; Li, Z.J.; Chen, J.; Chen, L.; Guan, S.H.; Li, T.Y.; Dong, X.J.; Patton, J.; et al. differential responses of Abies fabri and Rhododendron calophytum at two sites with contrasting pollution deposition and available calcium in Southwestern China. Plant Ecol. 2013, 214, 557–569. [Google Scholar] [CrossRef]
- Zeng, S.; Li, X.; Yang, L.; Wang, D. Understanding heavy metal distribution in timberline vegetations: A case from the Gongga Mountain, Eastern Tibetan Plateau. Sci. Total Environ. 2023, 874, 162523. [Google Scholar] [CrossRef] [PubMed]
- Sun, X.Y.; Wang, G.X. The hydro-chemical characteristics study of forest ecosystem precipitation distribution in Gongga Mountain. Res. Soil Water Conserv. 2009, 16, 120. [Google Scholar]
- Xiao, J.; Peng, X.; Yang, H.; Yang, S.; Zhang, H.; Yang, M.; Yang, Z.; Yang, Z. The preliminary analysis on the chemical characteristics of forest precipitation of Leigong Mountains Nature Reserve. Guizhou Sci. 2007, B05, 502–509. [Google Scholar]
- Ran, F.; Liang, Y.M.; Yang, Y.; Yang, Y.; Wang, G.X. Spatial-Temporal dynamics of an Abies fabri population near the alpine treeline in the Yajiageng Area of Gongga Mountain, China. Shengtai Xuebao 2014, 34, 6872–6878. [Google Scholar]
- Linares, J.C.; Camarero, J.J.; Carreira, J.A. Interacting effects of changes in climate and forest cover on mortality and growth of the Southernmost European Fir forests. Glob. Ecol. Biogeogr. 2009, 18, 485–497. [Google Scholar] [CrossRef]
- Jiang, Y.; Song, H.; Lei, Y.; Korpelainen, H.; Li, C. Distinct co-occurrence patterns and driving forces of rare and abundant bacterial subcommunities following a glacial retreat in the Eastern Tibetan Plateau. Biol. Fertil. Soils 2019, 55, 351–364. [Google Scholar] [CrossRef]
- Zhao, W.; Yang, M.; Chang, R.; Zhan, Q.; Li, Z.L. Surface warming trend analysis based on MODIS/Terra land surface temperature product at Gongga Mountain in the Southeastern Tibetan Plateau. J. Geophys. Res. Atmos. 2021, 126, e2020JD034205. [Google Scholar] [CrossRef]
- Lei, Y.; Zhou, J.; Xiao, H.; Duan, B.; Wu, Y.; Korpelainen, H.; Li, C. Soil nematode assemblages as bioindicators of primary succession along a 120-year-old chronosequence on the Hailuogou Glacier Forefield, SW China. Soil Biol. Biochem. 2015, 88, 362–371. [Google Scholar] [CrossRef]
- Lu, X.; Cheng, G.; Xiao, F.; Fan, J. Modeling effects of temperature and precipitation on carbon characteristics and GHGs emissions in Abies fabric forest of subalpine. J. Environ. Sci. 2008, 20, 339–346. [Google Scholar] [CrossRef] [PubMed]
- Bao-hua, Z.; Yu-rong, H.; Hong-yi, Z.; Gen-wei, C. The features of soil aggregation and its eco-environmental effects under different subalpine forests on the east slope of Gongga Mountain, China. J. For. Res. 2003, 14, 80–82. [Google Scholar] [CrossRef]
- Bárta, V.; Hanuš, J.; Dobrovolný, L.; Homolová, L. Comparison of field survey and remote sensing techniques for detection of bark beetle-infested trees. For. Ecol. Manag. 2022, 506, 119984. [Google Scholar] [CrossRef]
- Raffa, K.F.; Aukema, B.H.; Bentz, B.J.; Carroll, A.L.; Hicke, J.A.; Kolb, T.E. Responses of tree-killing bark beetles to a changing climate. In Climate Change and Insect Pests; Cabi: Wallington, UK, 2015; pp. 173–201. [Google Scholar]
- ERA5-Land Hourly Data from 1950 to Present. Available online: https://cds.climate.copernicus.eu/datasets/reanalysis-era5-land?tab=overview (accessed on 3 December 2024).
- Fritts, H.C. Tree Rings and Climate; Academic Press: Cambridge, MA, USA, 1976; ISBN 9780122684500. [Google Scholar]
- Maxwell, R.S.; Larsson, L.A. Measuring tree-ring widths using the CooRecorder software application. Dendrochronologia 2021, 67, 125841. [Google Scholar] [CrossRef]
- Holmes, R.L.; Adams, R.K.; Fritts, H.C. Tree-Ring Chronologies of Western North America: California, Eastern Oregon and Northern Great Basin with Procedures Used in the Chronology Development Work Including Users Manuals for Computer Programs COFECHA and ARSTAN; Laboratory of Tree-Ring Research, The University of Arizona: Tucson, AZ, USA, 1986. [Google Scholar]
- Bunn, A.G. Statistical and visual crossdating in R using the DplR library. Dendrochronologia 2010, 28, 251–258. [Google Scholar] [CrossRef]
- R Core Team. R: The R Project for Statistical Computing, Vienna, Austria. Available online: https://www.r-project.org/ (accessed on 4 November 2023).
- Friedman, J.H. A Variable Span Smoother; Stanford University: Stanford, CA, USA, 1984. [Google Scholar]
- Bunn, A.G. A Dendrochronology Program Library in R (DplR). Dendrochronologia 2008, 26, 115–124. [Google Scholar] [CrossRef]
- Wigley, T.; Briffa, K.; Jones, P. On the average value of correlated time series, with applications in dendroclimatology and hydrometeorology. J. Clim. Appl. Meteorol. 1984, 23, 201–213. [Google Scholar] [CrossRef]
- Lorimer, C.G.; Frelich, L.E. A Methodology for estimating canopy disturbance frequency and intensity in dense temperate forests. Can. J. For. Res. 1989, 19, 651–663. [Google Scholar] [CrossRef]
- Altman, J.; Fibich, P.; Dolezal, J.; Aakala, T. TRADER: A package for tree ring analysis of disturbance events in R. Dendrochronologia 2014, 32, 107–112. [Google Scholar] [CrossRef]
- Vicente-Serrano, S.M.; Beguería, S.; López-Moreno, J.I. A Multiscalar drought index sensitive to global warming: The standardized precipitation evapotranspiration index. J. Clim. 2010, 23, 1696–1718. [Google Scholar] [CrossRef]
- Santiago Beguería, A.; Vicente-Serrano, S.M.; Santiago Beguería, M. Package “SPEI” Title Calculation of the Standardised Precipitation-Evapotranspiration Index; R Foundation for Statistical Computing: Vienna, Austria, 2013. [Google Scholar]
- Zang, C.; Biondi, F. Treeclim: An R package for the numerical calibration of proxy-climate relationships. Ecography 2015, 38, 431–436. [Google Scholar] [CrossRef]
- Bray, R.H.; Kurtz, L.T. Determination of total organic and available forms of phosphorus in soils. Soil. Sci. 1945, 59, 39–45. [Google Scholar] [CrossRef]
- Øien, A.; Selmer-Olsen, A.R. A laboratory method for evaluation of available nitrogen in soil. Acta Agric. Scand. 1980, 30, 149–156. [Google Scholar] [CrossRef]
- Sarkadi, J.; Loch, J. Experiences with 0.01M calcium chloride as an extraction reagent for use as a soil testing procedure in Hungary. Commun. Soil. Sci. Plant Anal. 1994, 25, 1771–1777. [Google Scholar]
- Cornelissen, J.H.C.; Lavorel, S.; Garnier, E.; Díaz, S.; Buchmann, N.; Gurvich, D.E.; Reich, P.B.; Ter Steege, H.; Morgan, H.D.; Van Der Heijden, M.G.A.; et al. A handbook of protocols for standardised and easy measurement of plant functional traits worldwide. Aust. J. Bot. 2003, 51, 335–380. [Google Scholar] [CrossRef]
- Pequerul, A.; Pérez, C.; Madero, P.; Val, J.; Monge, E. A Rapid wet digestion method for plant analysis. In Optimization of Plant Nutrition; Springer: Dordrecht, The Netherlands, 1993; pp. 3–6. [Google Scholar] [CrossRef]
- Dunnett, C.W. Pairwise multiple comparisons in the homogeneous variance, unequal sample size case. J. Am. Stat. Assoc. 1980, 75, 789–795. [Google Scholar] [CrossRef]
- Martinez del Castillo, E.; Torbenson, M.C.A.; Reinig, F.; Konter, O.; Ziaco, E.; Büntgen, U.; Esper, J. Diverging growth trends and climate sensitivities of individual pine trees after the 1976 extreme drought. Sci. Total Environ. 2024, 946, 174370. [Google Scholar] [CrossRef] [PubMed]
- Tang, Z.; Zhai, B.; Wang, G.; Gessler, A.; Sun, S.; Hu, Z. elevational variations in stem hydraulic efficiency and safety of Abies fabri. Funct. Ecol. 2023, 37, 2570–2582. [Google Scholar] [CrossRef]
- Teshome, D.T.; Zharare, G.E.; Naidoo, S. The threat of the combined effect of biotic and abiotic stress factors in forestry under a changing climate. Front. Plant Sci. 2020, 11, 601009. [Google Scholar] [CrossRef] [PubMed]
- Gay, J.D.; Currey, B.; Brookshire, E.N.J. Global distribution and climate sensitivity of the tropical montane forest nitrogen cycle. Nat. Commun. 2022, 13, 7364. [Google Scholar] [CrossRef] [PubMed]
- Pichler, P.; Oberhuber, W. Radial growth response of coniferous forest trees in an inner alpine environment to heat-wave in 2003. For. Ecol. Manag. 2007, 242, 688–699. [Google Scholar] [CrossRef]
- Pandey, J.; Sigdel, S.R.; Lu, X.; Camarero, J.J.; Liang, E. Declining growth resilience to drought of alpine juniper shrub along an East–West precipitation gradient in the Central Himalayas. Agric. For. Meteorol. 2025, 367, 110515. [Google Scholar] [CrossRef]
- Lesica, P. Arctic-alpine plants decline over two decades in Glacier National Park, Montana, U.S.A. Arct. Antarct. Alp. Res. 2014, 46, 327–332. [Google Scholar] [CrossRef]
- Tang, W.; Liu, S.; Jing, M.; Healey, J.R.; Smith, M.N.; Farooq, T.H.; Zhu, L.; Zhao, S.; Wu, Y. Vegetation growth responses to climate change: A cross-scale analysis of biological memory and time lags using tree ring and satellite data. Glob. Change Biol. 2024, 30, e17441. [Google Scholar] [CrossRef] [PubMed]
- Coutts, M.P.; Philipson, J.J. Tolerance of tree roots to waterlogging: II. adaptation of Sitka spruce and Lodgepole pine to waterlogged soil. New Phytol. 1978, 80, 71–77. [Google Scholar] [CrossRef]
- Lang, V.; Schneider, V.; Puhlmann, H.; Schengel, A.; Seitz, S.; Schack-Kirchner, H.; Schäffer, J.; Maier, M. Spotting ethylene in forest soils—What influences the occurrence of the phytohormone? Biol. Fertil. Soils 2023, 59, 953–972. [Google Scholar] [CrossRef]
- Thayamkottu, S.; Masta, M.; Skeeter, J.; Pärn, J.; Knox, S.H.; Smallman, T.L.; Mander, Ü. Dual controls of vapour pressure deficit and soil moisture on photosynthesis in a restored temperate bog. Sci. Total Environ. 2025, 963, 178366. [Google Scholar] [CrossRef] [PubMed]
- Mirabel, A.; Girardin, M.P.; Metsaranta, J.; Way, D.; Reich, P.B. Increasing atmospheric dryness reduces boreal forest tree growth. Nat. Commun. 2023, 14, 6901. [Google Scholar] [CrossRef] [PubMed]
- Chen, S.; Wei, W.; Tong, B.; Chen, L. Effects of soil moisture and vapor pressure deficit on canopy transpiration for two coniferous forests in the Loess Plateau of China. Agric. For. Meteorol. 2023, 339, 109581. [Google Scholar] [CrossRef]
- Klein, T.; Cahanovitc, R.; Sprintsin, M.; Herr, N.; Schiller, G. A nation-wide analysis of tree mortality under climate change: Forest loss and its causes in Israel 1948–2017. For. Ecol. Manag. 2019, 432, 840–849. [Google Scholar] [CrossRef]
- Kolb, T.E.; Fettig, C.J.; Ayres, M.P.; Bentz, B.J.; Hicke, J.A.; Mathiasen, R.; Stewart, J.E.; Weed, A.S. Observed and anticipated impacts of drought on forest insects and diseases in the United States. For. Ecol. Manag. 2016, 380, 321–334. [Google Scholar] [CrossRef]
- Jin, S.; Chi, Y.; Li, X.; Shu, P.; Zhu, M.; Yuan, Z.; Liu, Y.; Chen, W.; Han, Y. Predicting the response of three common subtropical tree species in China to climate change. Front. For. Glob. Change 2023, 6, 1299120. [Google Scholar] [CrossRef]
- Blanco, J.A.; de Andrés, E.G.; Lo, Y.H. Influence of climate change on tree growth and forest ecosystems: More than just temperature. Forests 2021, 12, 630. [Google Scholar] [CrossRef]
- Cheng, G.W.; Lu, X.Y.; Wang, X.D.; Sun, J. Rebirth after death: Forest succession dynamics in response to climate change on Gongga Mountain, Southwest China. J. Mt. Sci. 2018, 15, 1671–1681. [Google Scholar] [CrossRef]
- Wason, J.W.; Beier, C.M.; Battles, J.J.; Dovciak, M. Acidic deposition and climate warming as drivers of tree growth in high-elevation spruce-fir forests of the Northeastern US. Front. For. Glob. Change 2019, 2, 492454. [Google Scholar] [CrossRef]
- Mohnen, V.A. The Challenge of Acid Rain. Sci. Am. 1988, 259, 30–39. [Google Scholar] [CrossRef]
- Liu, X.; Ma, S.; Jia, Z.; Ramzan, M.; Meng, M.; Wang, J.; Li, C.; Zhang, Y.; Zhang, J. Complex effects of different types of acid rain on root growth of Quercus acutissima and Cunninghamia lanceolata saplings. Ecol. Process 2022, 11, 8. [Google Scholar] [CrossRef]
- Dahe, J. A lagrangian backward trajectory model and its application to the study of acid rain in the Emei Mountainous District. Atmos. Environ. Part. B. Urban. Atmos. 1991, 25, 59–65. [Google Scholar] [CrossRef]
- Hu, Y.; Elfstrand, M.; Stenlid, J.; Durling, M.B.; Olson, Å. The conifer root rot pathogens Heterobasidion irregulare and Heterobasidion occidentale employ different strategies to infect Norway spruce. Sci. Rep. 2020, 10, 5884. [Google Scholar] [CrossRef] [PubMed]
- Asiegbu, F.O.; Adomas, A.; Stenlid, J. Conifer Root and Butt Rot Caused by Heterobasidion annosum (Fr.) Bref. s.l. Mol. Plant Pathol. 2005, 6, 395–409. [Google Scholar] [CrossRef] [PubMed]
- Hernández, L.; Camarero, J.J.; Gil-Peregrín, E.; Saz Sánchez, M.Á.; Cañellas, I.; Montes, F. Biotic factors and increasing aridity shape the altitudinal shifts of marginal Pyrenean silver fir populations in Europe. For. Ecol. Manag. 2019, 432, 558–567. [Google Scholar] [CrossRef]

| Tree Health Class | Elevation (m) | No Trees | Timespan | Mean Tree-Ring Width (mm) | SD (mm) | First-Order Autocorrelation | Mean Sensitivity | Correlation with Master | Variance PC1 (%) | EPS | Best-Replicated Timespan |
|---|---|---|---|---|---|---|---|---|---|---|---|
| D | 2800 | 16 | 1884–2019 | 2.14 | 0.91 | 0.83 | 0.19 | 0.36 | 38.50 | 0.85 | 1923–2019 |
| H | 2800 | 15 | 1892–2019 | 2.51 | 0.98 | 0.77 | 0.21 | 0.27 | 37.10 | 0.82 | 1946–2019 |
| D | 3000 | 11 | 1838–2019 | 2.20 | 0.80 | 0.74 | 0.22 | 0.30 | 55.40 | 0.98 | 1929–2019 |
| H | 3000 | 17 | 1904–2019 | 2.18 | 0.71 | 0.77 | 0.16 | 0.37 | 39.30 | 0.87 | 1965–2019 |
| D | 3600 | 16 | 1856–2019 | 1.21 | 0.50 | 0.82 | 0.17 | 0.45 | 42.30 | 0.88 | 1920–2019 |
| H | 3600 | 19 | 1829–2019 | 1.19 | 0.47 | 0.78 | 0.17 | 0.37 | 39.00 | 0.86 | 1924–2019 |
Disclaimer/Publisher’s Note: The statements, opinions and data contained in all publications are solely those of the individual author(s) and contributor(s) and not of MDPI and/or the editor(s). MDPI and/or the editor(s) disclaim responsibility for any injury to people or property resulting from any ideas, methods, instructions or products referred to in the content. |
© 2025 by the authors. Licensee MDPI, Basel, Switzerland. This article is an open access article distributed under the terms and conditions of the Creative Commons Attribution (CC BY) license (https://creativecommons.org/licenses/by/4.0/).
Share and Cite
Zveushe, O.K.; Granda, E.; Camarero, J.J.; Dong, F.; Han, Y.; Resco de Dios, V. Drivers of Forest Dieback and Growth Decline in Mountain Abies fabri Forests (Gongga Mountain, SW China). Forests 2025, 16, 1222. https://doi.org/10.3390/f16081222
Zveushe OK, Granda E, Camarero JJ, Dong F, Han Y, Resco de Dios V. Drivers of Forest Dieback and Growth Decline in Mountain Abies fabri Forests (Gongga Mountain, SW China). Forests. 2025; 16(8):1222. https://doi.org/10.3390/f16081222
Chicago/Turabian StyleZveushe, Obey Kudakwashe, Elena Granda, Jesús Julio Camarero, Faqin Dong, Ying Han, and Víctor Resco de Dios. 2025. "Drivers of Forest Dieback and Growth Decline in Mountain Abies fabri Forests (Gongga Mountain, SW China)" Forests 16, no. 8: 1222. https://doi.org/10.3390/f16081222
APA StyleZveushe, O. K., Granda, E., Camarero, J. J., Dong, F., Han, Y., & Resco de Dios, V. (2025). Drivers of Forest Dieback and Growth Decline in Mountain Abies fabri Forests (Gongga Mountain, SW China). Forests, 16(8), 1222. https://doi.org/10.3390/f16081222