Article

Scots Pine at Its Southern Range in Siberia: A Combined Drought and Fire Influence on Tree Vigor, Growth, and Regeneration

by
Viacheslav I. Kharuk
1,2,*,
Il’ya A. Petrov
1,2,
Alexander S. Shushpanov
1,3,
Sergei T. Im
1,2,3 and
Sergei O. Ondar
4
1
Sukachev Institute of Forests, Federal Scientific Center, Russian Academy of Science, Siberian Branch, Academgorodok 50/28, Krasnoyarsk 660036, Russia
2
Institute of Space and Information Technologies, Institute of Ecology and Geography, Siberian Federal University, Svobodny Str. 79, Krasnoyarsk 660041, Russia
3
Institute of Space Research and High Technologies, Reshetnev Siberian State University of Science and Technology, Krasnoyarsky Rabochy Str. 31, Krasnoyarsk 660014, Russia
4
Department of Biology and Ecology, Tuvan State University, Lenina Str. 36, Kyzyl 667000, Russia
*
Author to whom correspondence should be addressed.
Forests 2025, 16(5), 819; https://doi.org/10.3390/f16050819
Submission received: 26 March 2025 / Revised: 25 April 2025 / Accepted: 12 May 2025 / Published: 14 May 2025
(This article belongs to the Section Forest Ecology and Management)

Abstract

:
Climate models have predicted changes in woody plant growth, vitality, and species distribution. Those changes are expected mainly within the boundaries of species ranges. We studied the influence of changing hydrothermal and burning-rate regimes on relict pine stands at the southern edge of the Pinus sylvestris range in Siberia. We hypothesize that (1) warming has stimulated pine growth under conditions of sufficient moisture supply, and (2) increased burning rate has threatened forest viability. We found that the increase in air temperature, combined with the decrease in soil and air drought, stimulated tree growth. Since the “warming restart” around 2000, the growth index (GI) of pines has exceeded its historical value by 1.4 times. The GI strongly correlates with the GPP and NPP of pine stands (r = 0.82). Despite the increased fire rate, the GPP/NPP and EVI index of both pine stands and surrounding bush–steppes are increasing, i.e., the pine habitat is “greening” since the warming restart. These results support the prediction (by climatic scenarios SSP4.5, SSP7.0, and SSP8.5) of improvement in tree habitat in the Siberian South. Meanwhile, warming has led to a reduction in the fire-return interval (up to 3–5 y). Although the post-fire density of seedlings on burns (ca. 10,000 per ha) is potentially sufficient for pine forest recovery, repeated surface fires have eliminated the majority of the undergrowth and afforestation. In a changing climate, the preservation of relict pine forests depends on a combination of moisture supply, burning rate, and fire suppression.

1. Introduction

Observed and predicted changes in thermal and hydrology regimes lead to the redistribution of tree species and tree vigor and growth changes [1,2]. Thus, conifers in the boreal zone have experienced large-scale decline and mortality caused by the combined influence of wildfires, droughts, and pathogen attacks. Conifer mortality has been observed in North America, where a synergy of droughts, fires, and bark-beetle attacks has caused pine stand mortality over vast areas [3,4,5]. Large-scale decline and mortality of spruce (Picea abies L., P. obovata L.) in Western and Eastern Europe and in the European part of Russia is attributed to low precipitation and root-zone humidity in combination with bark-beetle attacks [6,7,8]. In the Mediterranean zone, the future of the endemic pines is strongly dependent on the combined effect of drought and fire [9]. Alongside conifers, softwood and hardwood species have also experienced negative consequences of climate warming in the boreal zone [10,11].
In Siberia, precipitation-sensitive Siberian pine (Pinus sibirica Du Tour), fir (Abies sibirica Ledeb.), and spruce (Picea obovata) have experienced growth decline and mortality within areas of low precipitation (i.e., taiga forests in the lowlands) [12,13]. By contrast, rising air temperatures drive the uphill migration of those species to areas of sufficient moisture supply, e.g., into the mountain tundra [14].
Scots pine (Pinus sylvestris L.) can survive in habitats with limited water supply, including semi-desert areas. In addition, this pyrophytic species has adapted to periodic surface fires. However, recent data have indicated a negative influence of the burning rate on the growth and area of pine stands, especially within the southern range of pine [15,16,17,18]. Similarly, other Siberian pyrophytic and drought-resistant species, e.g., larch (Larix spp.), have experienced thinning and mortality of stands within the southern edge of their habitat in the Trans-Baikal area [19,20,21]. Most of the observed warming-driven negative and positive influences on trees refer to the so-called period of the “warming restart”, i.e., a pronounced increase in the warming rate since ca. 1998 [22].
Prognostic models suggest that the most pronounced changes in tree vigor and range should occur within the transitions (ecotones) between forest and non-forest communities [1]. This study focuses on Scots pine tree growth and pine forest burning during the “warming restart” in the 21st century. For our study, we selected relict pine stands at the southern edge of the Pinus sylvestris range in Siberia. We analyzed the dependence of the radial growth index (GI) of trees on climate variables and the influence of wildfires on pine forests.
Checked hypothesis:
  • Warming-driven air temperature increase stimulates the growth of Pinus sylvestris in conditions of sufficient moisture supply;
  • Warming-driven increase in burning rate is a threat to the Pinus sylvestris habitat within its southern range in Siberia.
We are seeking answers to the following questions:
  • How do changing hydrothermal regimes influence the growth index of pine trees?
  • How does the changing burning rate influence pine stands and pine regeneration?

2. Materials and Methods
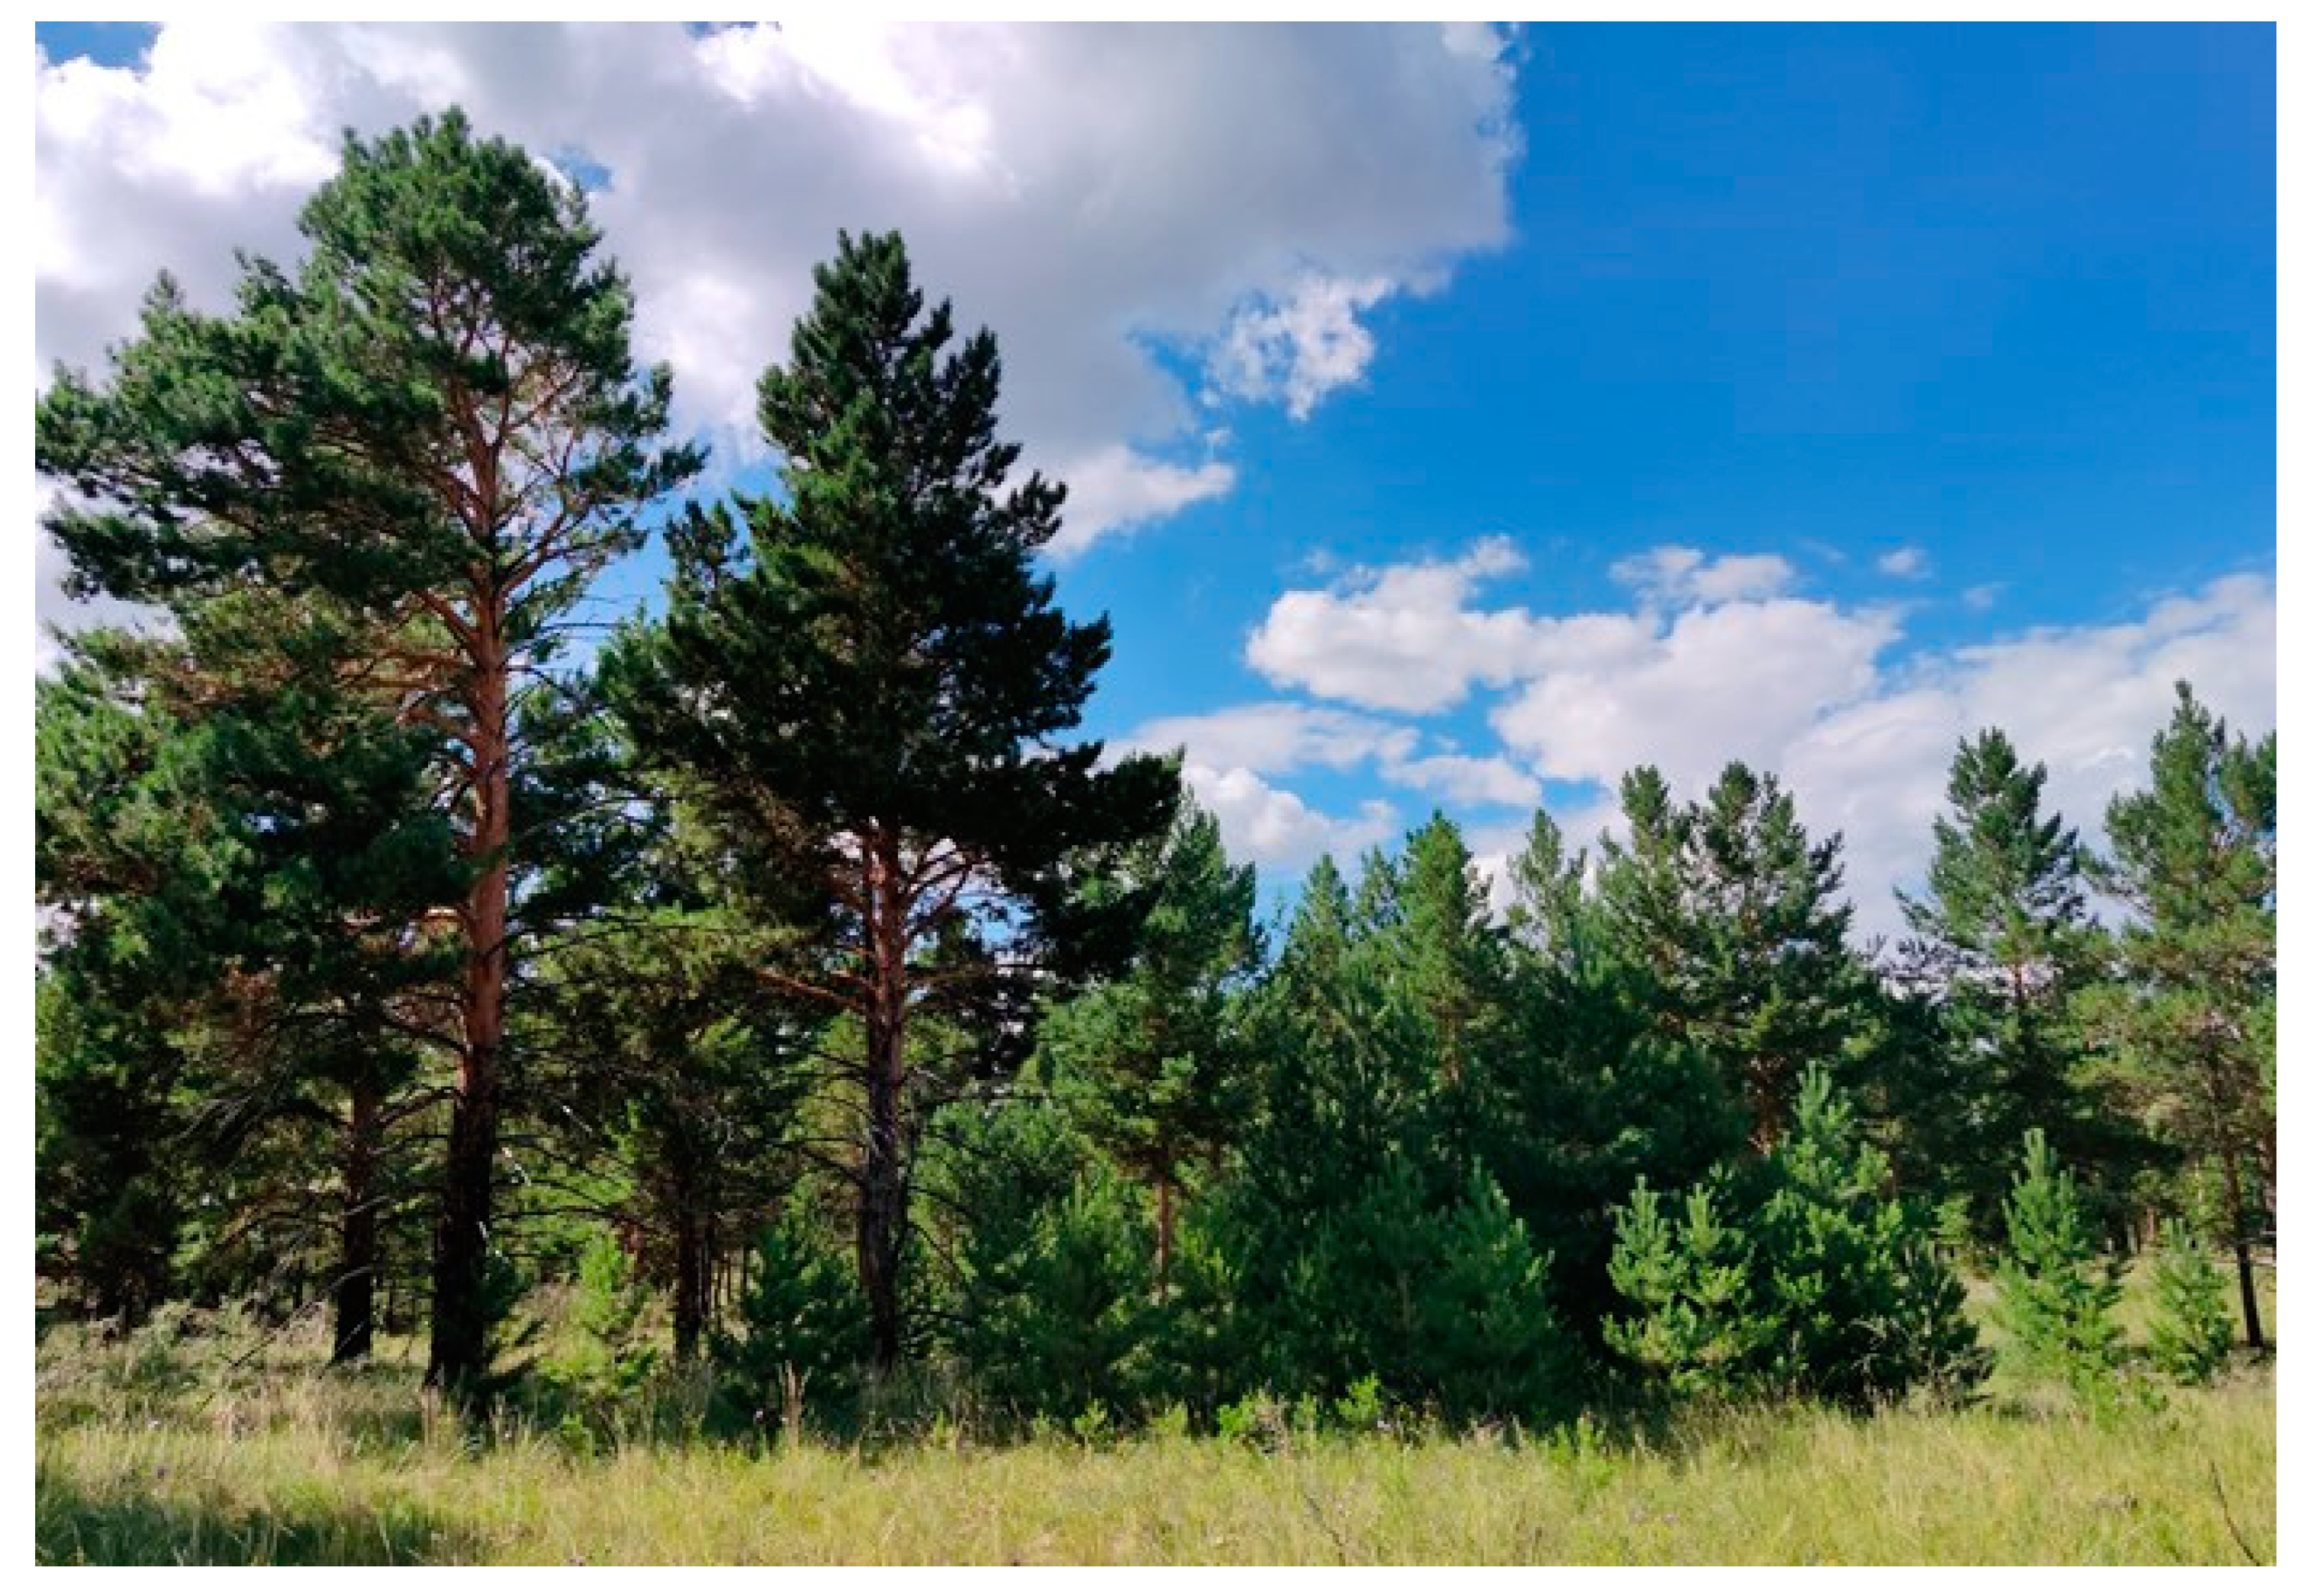
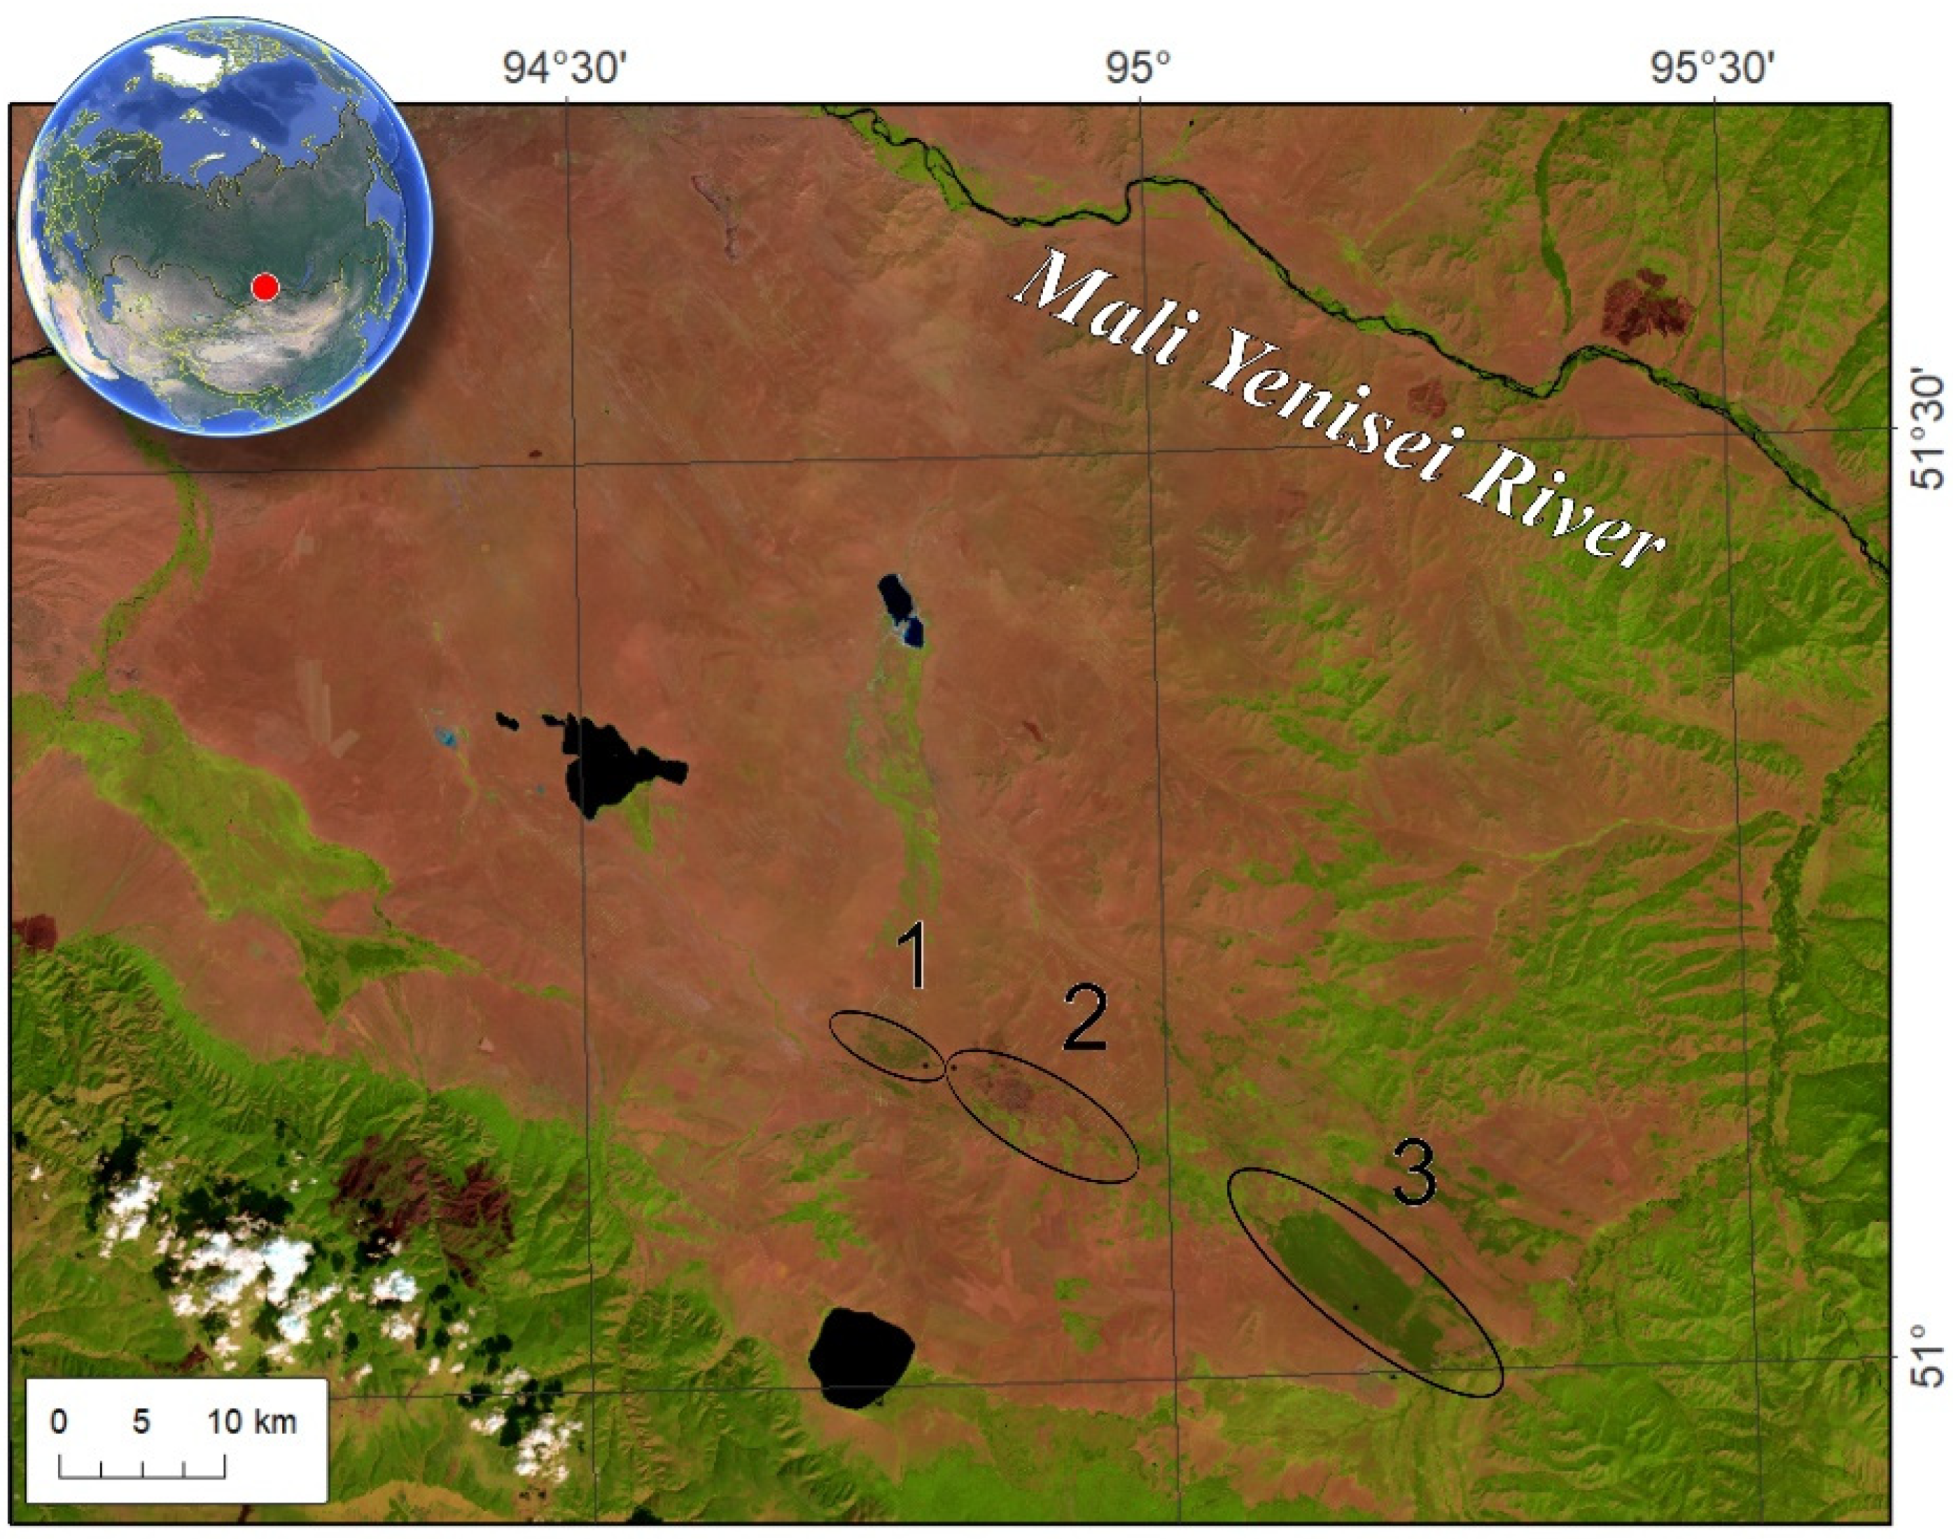
The research is based on remote-sensing data, fieldwork, and GIS technologies.

2.1. Study Area

The study area is located in the Tuva basin, in Mid Siberia (elevations are about 850–950 m above sea level). This is the southern edge of the Pinus sylvestris range. The climate within the study area is dry, with warm summers and cold winters. The average summer and annual temperatures and precipitation are +16 °C and −1.7 °C and 180 and 350 mm, respectively. We studied “Ulug-Hady” (or Big Pines), “Biche-Hady” (or Minor Pines), and “Balgazyn” pine forests (Figure 1). Forest areas were 600, 3000, and 5500 ha (according to Landsat-5 scene taken in 1986). These are the forest conservation areas. All stands are growing on sandy soils with a poor organic horizon. Surface fires are typical in these areas.

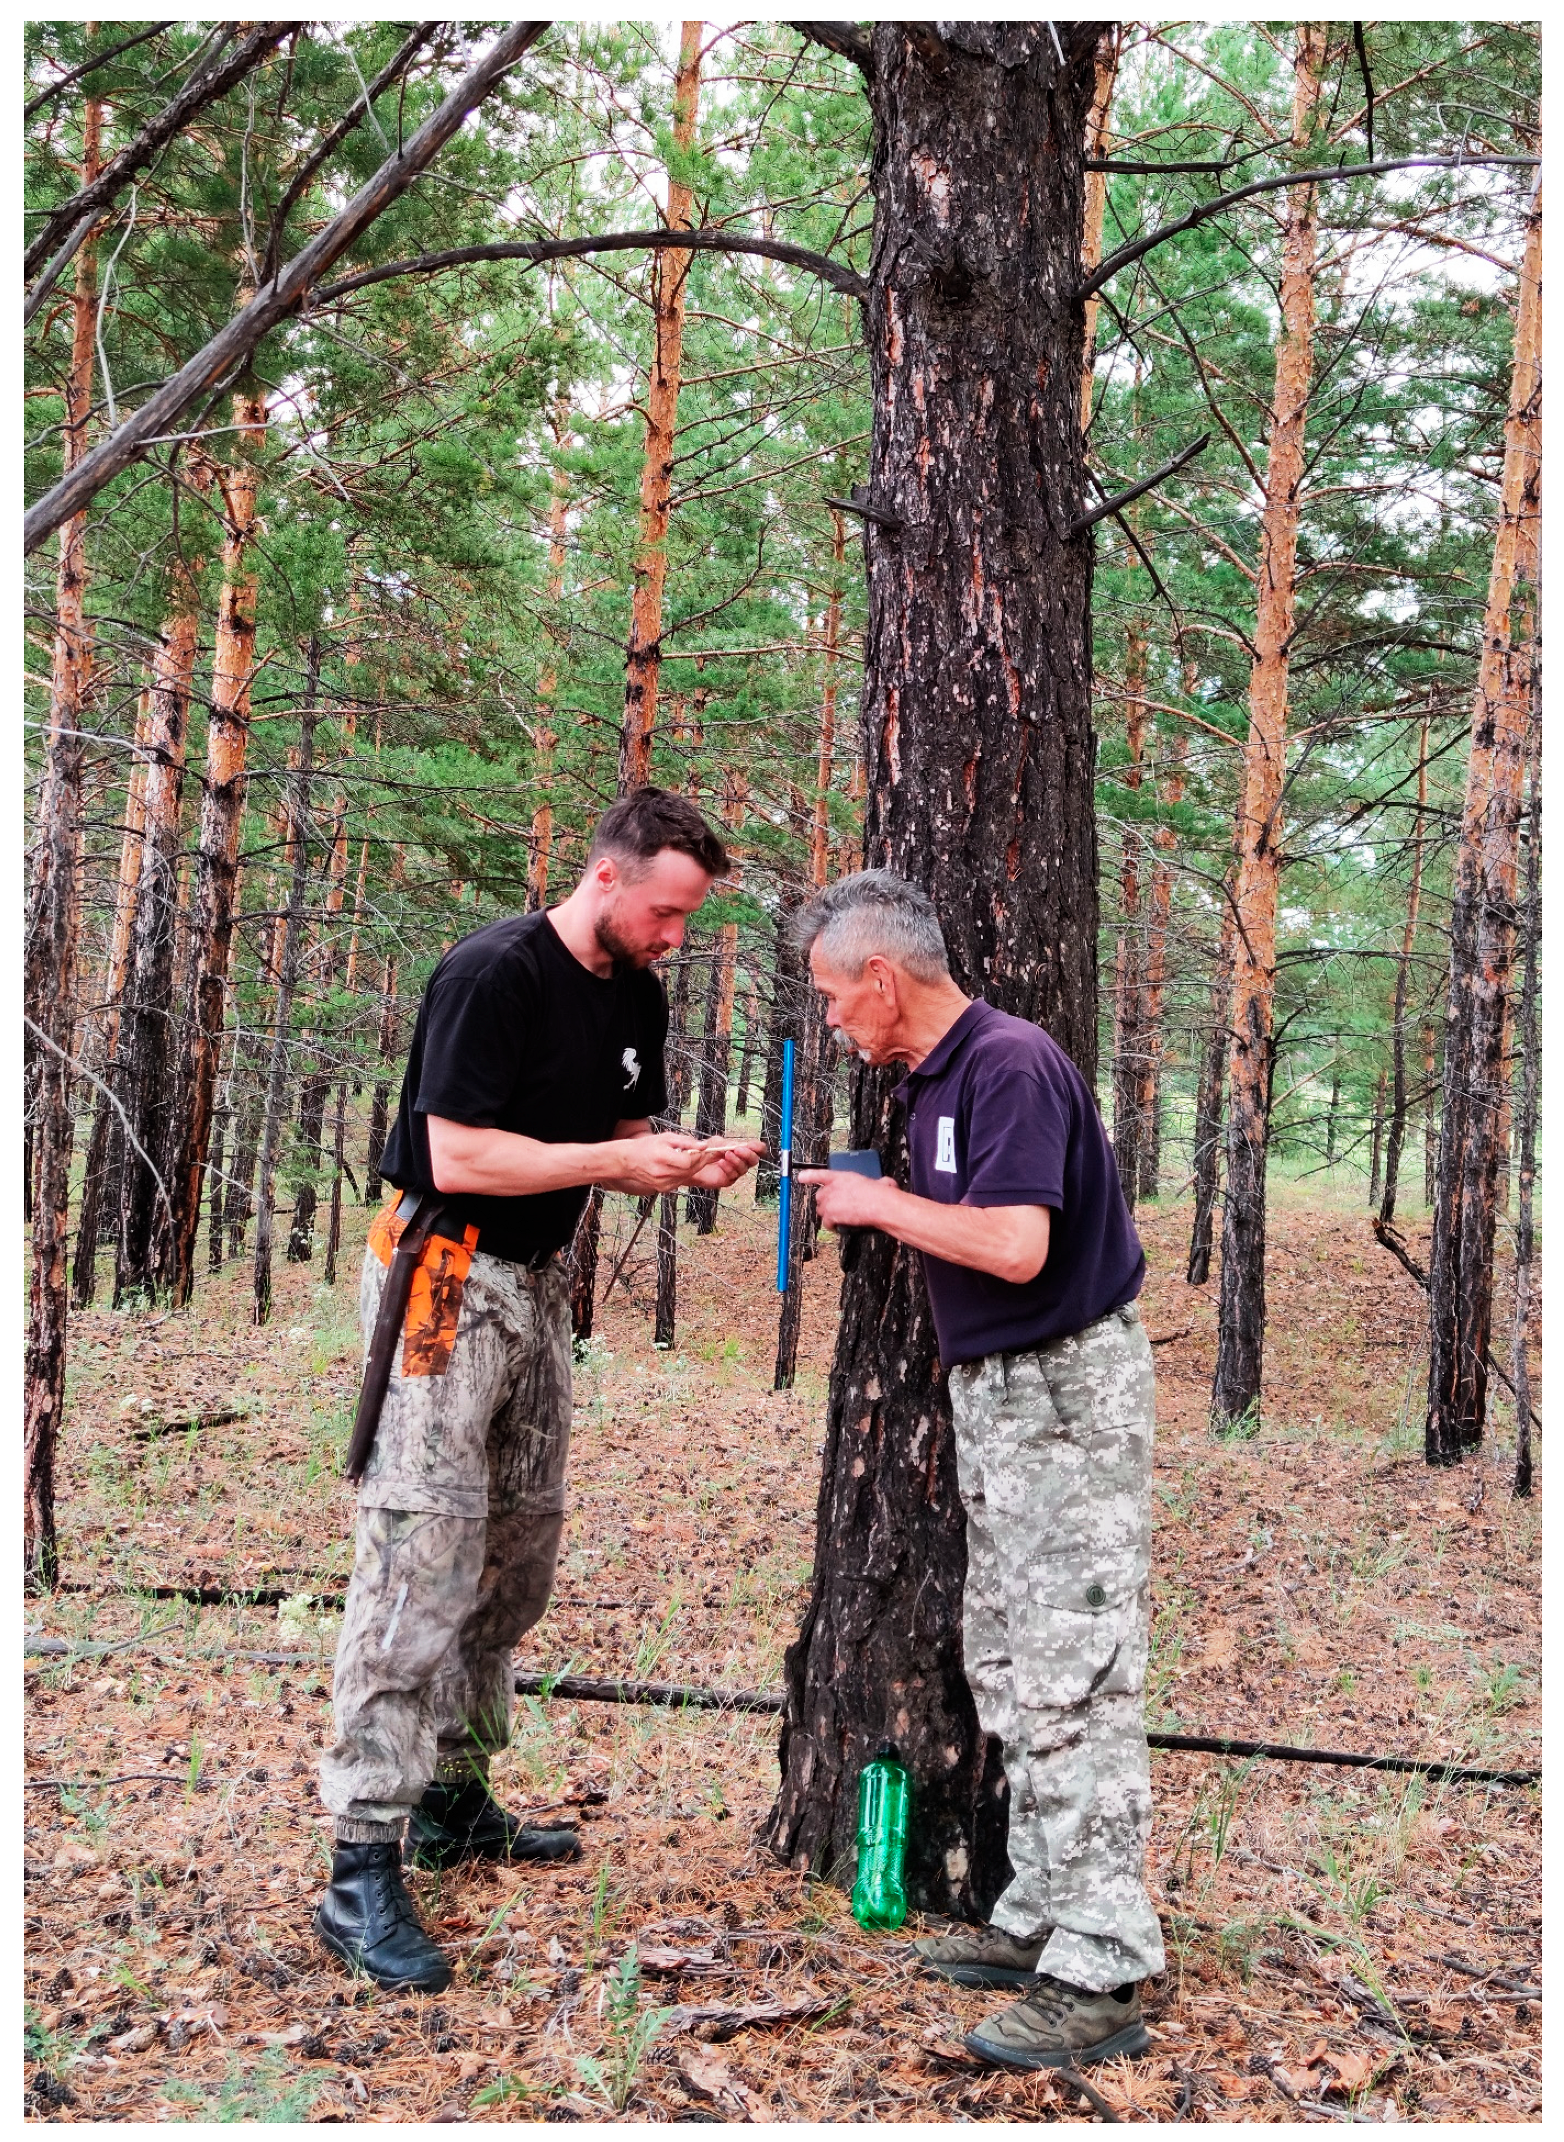
2.2. Ground Survey Data

Fieldwork was conducted in 2024 on the temporary test plots with radii of 9.8 m (S ~0.03 ha; N = 6). We obtained the forest inventory, soil type, and geobotanical data, as well as slope steepness and aspect values. The seedlings were counted on plots 2 × 2, 3 × 3, or 5 × 5 m2 in size, depending on the density of seedlings. Seedlings without signs of damage or replaced apical shoots, partial yellowing of the crown, or reduced growth were considered to be viable. Seedlings with a crown yellowing >30% and little or no apical growth were considered to be declining. For dendrochronological analysis, trees were randomly selected in an area of about 0.5 ha around the center point of test plots. Wood samples were collected at a height of 1.3 m using an increment borer (Figure A1).

2.3. Dendrochronological Analysis

Tree-ring chronologies were developed for all the studied areas. Since the habitats of Biche-Hady, Ulug-Hady, and Balgazyn were similar (in fact, they represent fragments of a former pine forest), the chronologies in these areas were strongly synchronized (the inter-series correlation was 0.66). Therefore, we used a combined chronology (based on 127 model trees) in further analysis.
Measurements of wood cores were taken using the LINTAB 6 platform with an accuracy of 0.01 mm. Time series of the tree-ring width in mm were obtained for each sample. The quality of measurements was assessed based on cross-dating methods using the COFECHA v. 6.02 and TSAP v. 4.67 software [23,24]. The initial tree-ring width values (in mm) were converted into a dimensionless growth index (GI) using a negative exponential function or a linear regression with a negative slope in the ARSTAN program [25]. We used “residual” chronologies due to their higher sensitivity to the climatic signal.

2.4. The Burning-Rate Analysis

The fire dynamics were determined using MODIS MCD64A1 (https://modis-fire.umd.edu/ba.html (accessed on 20 February 2025)), fire monitoring (FIRMS) (https://firms.modaps.eosdis.nasa.gov (accessed on 20 February 2025)), and Landsat data (https://landsat.gsfc.nasa.gov (accessed on 20 January 2025)) (83 scenes covering the period from 1986 to 2024 with a spatial resolution of 30 m; https://earthexplorer.usgs.gov (accessed on 20 January 2025)). We also used high-resolution images (2–3.7 m; QuickBird (USA), WorldView-3 (USA), and Pléiades (France) satellites) (https://earth.google.com/web (accessed on 20 January 2025)).
The MCD64A1 product comprises vector polygons of burned areas with a spatial resolution of 500 m (period: 2001–2024) (https://search.earthdata.nasa.gov/search?q=mcd64a1 (accessed on 20 February 2025)). The FIRMS data are the vector data of temperature anomalies (hotspots) with a spatial resolution of 1 × 1 km (https://firms.modaps.eosdis.nasa.gov (accessed on 20 February 2025)). Based on these data, burned area maps were generated. Burns in Landsat images were identified using the ISODATA method and expert knowledge [26]. The following parameters were used for clustering: the number of classes was 30–40, the number of iterations was 500, minimal class size was 100 pixels.

2.5. Vegetation Productivity and Index Data
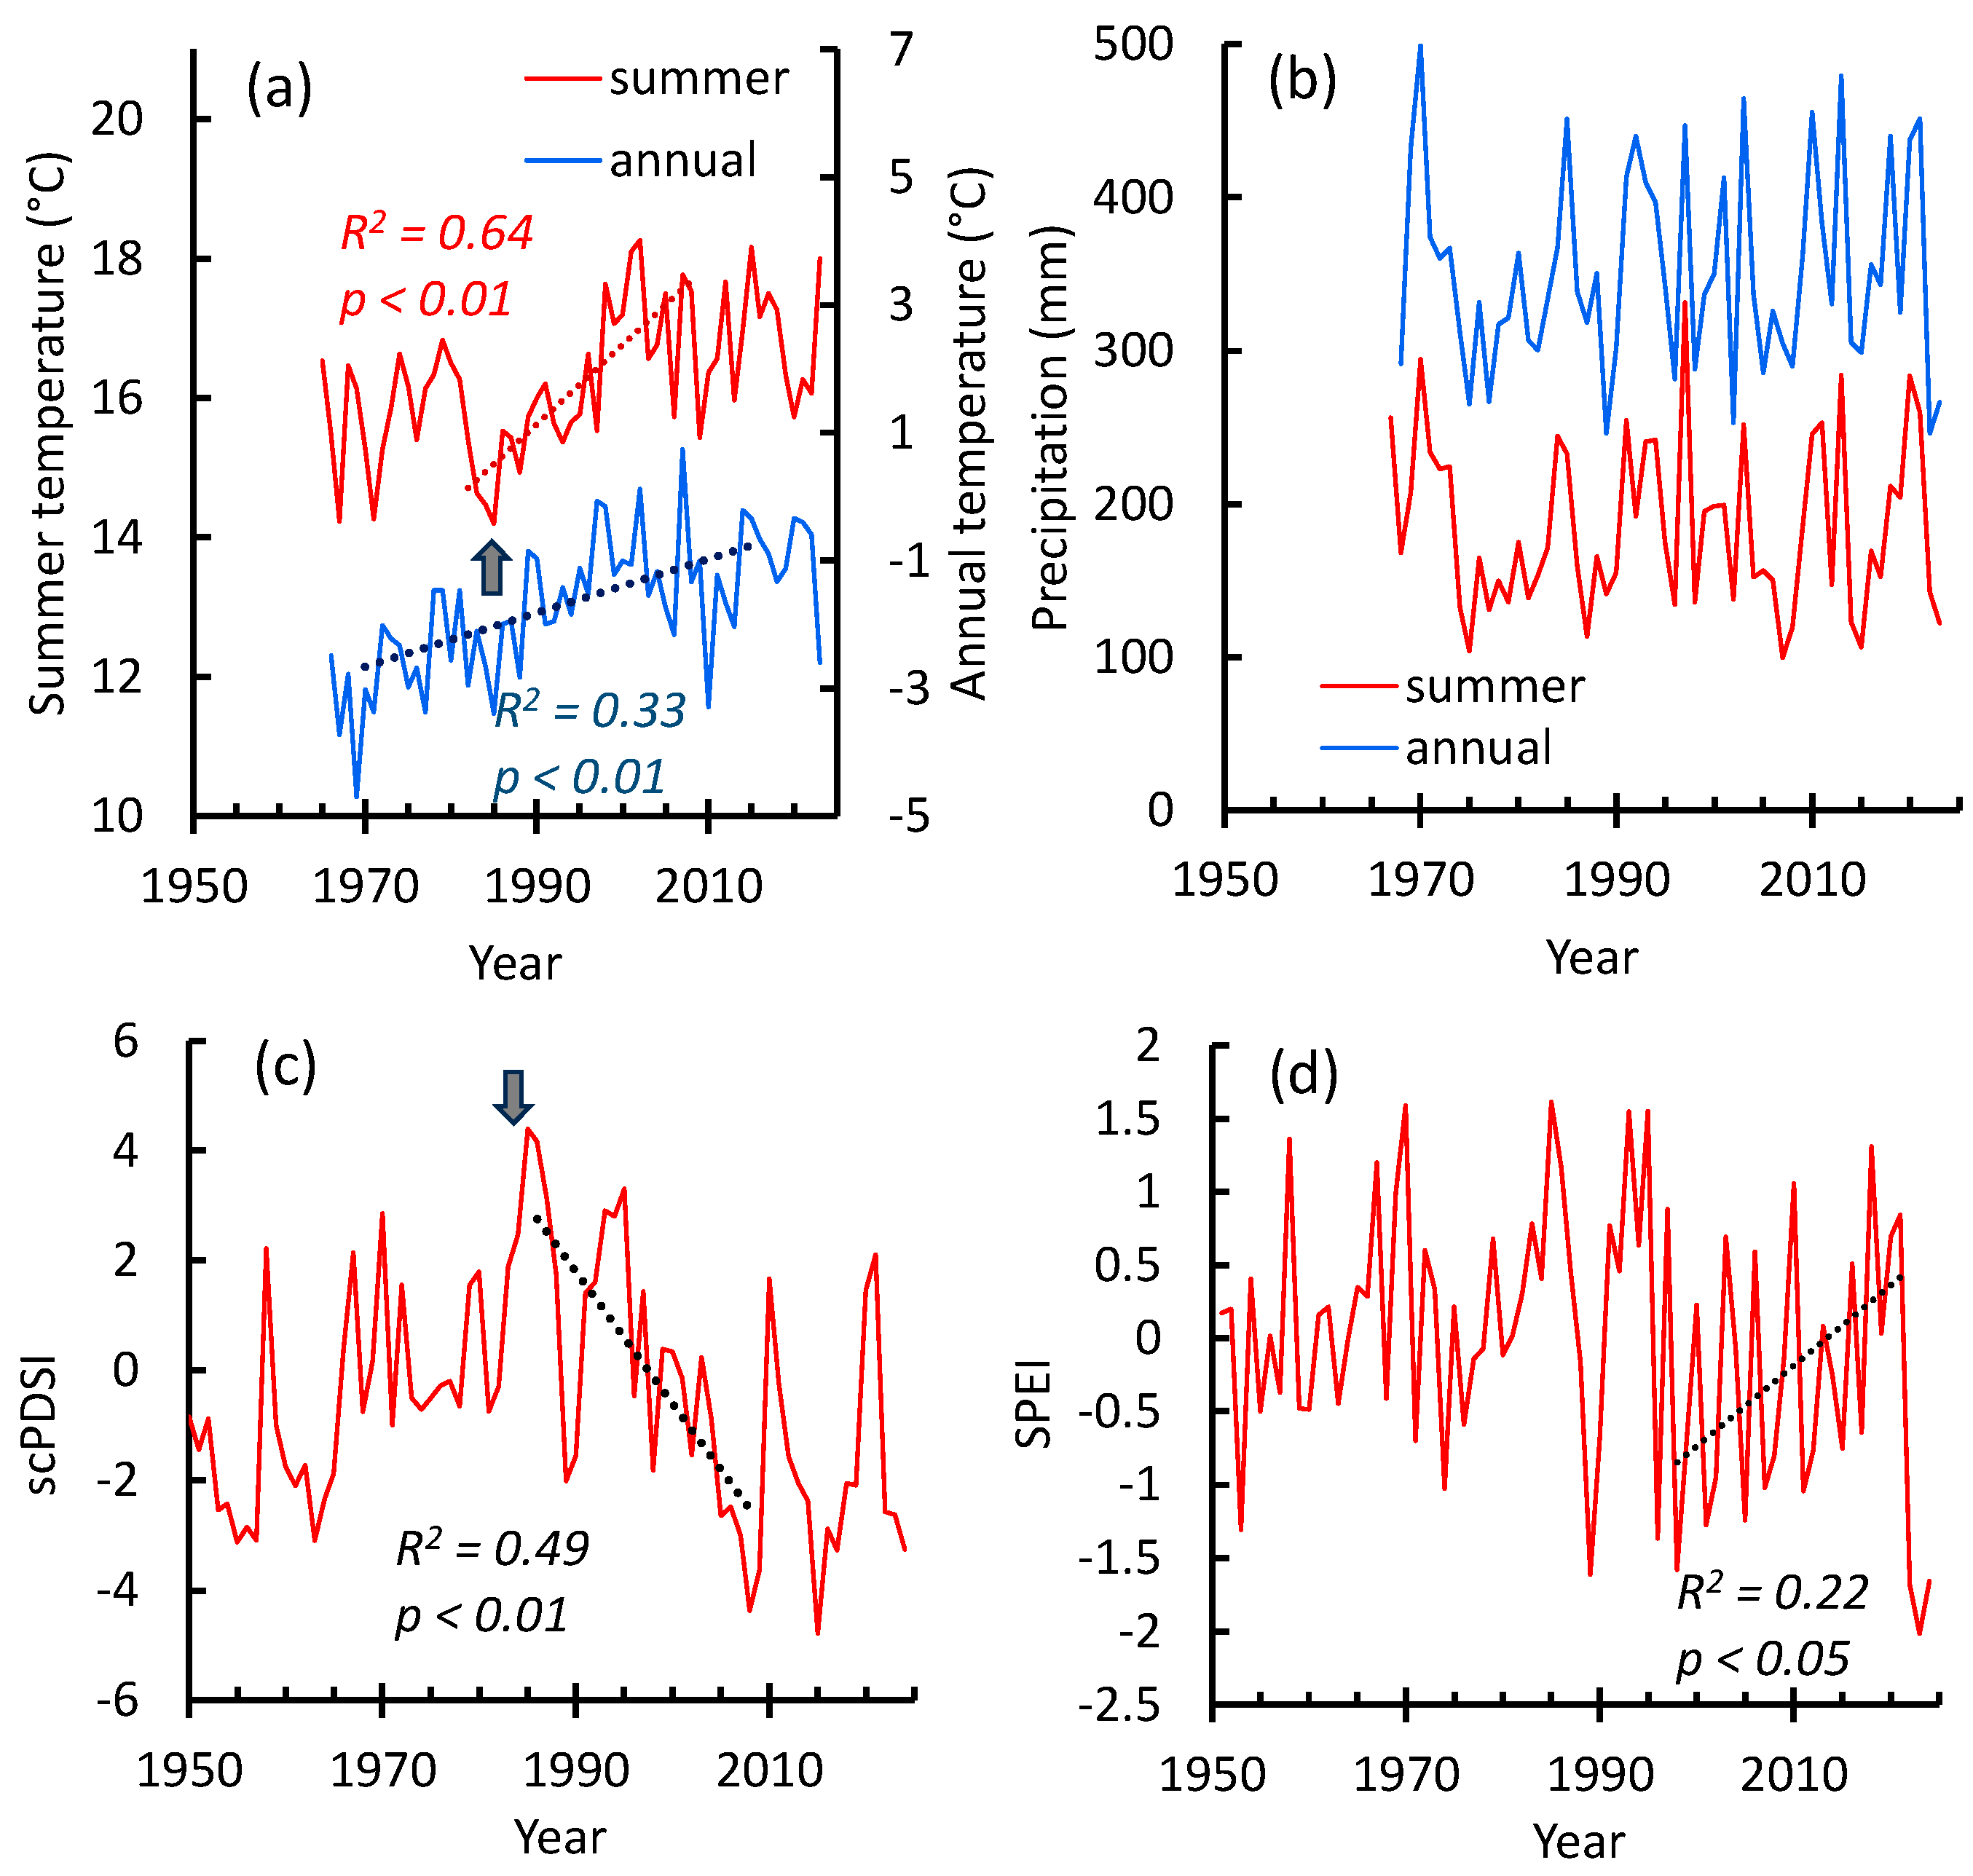
The net (NPP) and gross (GPP) primary productivity of vegetation cover was estimated using the MODIS MOD17A3HGF product [27]. These data represent raster composites of NPP and GPP values (kgC/m2) with a spatial resolution of 500 m (https://lpdaac.usgs.gov/products/mod17a3hgfv006 (accessed on 20 February 2025)). The GPP and NPP estimations are based on the following equations [27]:
G P P a n n u a l = y e a r G P P d a i l y
where G P P a n n u a l and G P P d a i l y are annual and daily GPP;
G P P d a i l y = 0.45 · e m a x · T M I N s c a l a r · V P D s c a l a r · S W R · F P A R
where emax [kgC/MJ] is the maximum radiation conversion efficiency (extracted from BIOME-BGC, an ecosystem process model that estimates storage and flux of carbon, nitrogen, and water; https://www.ntsg.umt.edu/project/biome-bgc.php (accessed on 20 February 2025)) and the MODIS MOD12 product). T M I N s c a l a r is the scaled [0, 1] daily minimal ambient temperature; V P D s c a l a r is the scaled [0, 1] daily daylight average vapor pressure deficit, and SWR [W/m2/ha] is net incident shortwave radiation. T M I N s c a l a r , V P D s c a l a r , and SWR are extracted from the BPLUT. FPAR is the fraction of absorbed photosynthetically active radiation extracted from the MODIS MOD15 product.
N P P a n n u a l = 0.8 · G P P a n n u a l R m
where N P P a n n u a l is the annual net primary productivity, and Rm is plant maintenance respiration.
The Enhanced Vegetation Index data were extracted from the MODIS MOD13Q1 product [28]. These data indicate the health status of the vegetation cover with a spatial resolution of 250 m. Time series of GPP, NPP, and EVI data were obtained from the EarthData geoportal (https://www.earthdata.nasa.gov (accessed on 20 February 2025)). The original NPP, GPP, and EVI data were converted into multi-band images for further analysis.
Maps of GPP, NPP, and EVI trends were created using the Theil–Sen algorithm (p < 0.05). The Theil–Sen estimator is a non-parametric robust method that fits a regression line through the median of slopes determined by all pairs of sample points [29]. “Delta” maps of NPP, GPP, and EVI changes (between 2001–2009 and 2010–2024) were calculated using the Mann–Whitney U-test.

2.6. Climate Data

Air temperature and precipitation were obtained from the Sosnovka weather station (WMO index 36,099, distance to test sites is 20–30 km) using the AISORI online database [30]. Climate aridity was estimated based on Palmer’s scPDSI (Self-Calibrated Palmer Drought Severity Index) and SPEI (Standardized Precipitation Evaporation Index) indexes [31]. The scPDSI is sensitive to soil and air moisture. Negative values of scPDSI indicate drought conditions, and positive values indicate wet conditions [32]. The scPDSI calculation was performed in the R-Studio v.2024.09.0 build 375 (https://posit.co/download/rstudio-desktop (accessed on 20 March 2025)) using the R v.4.1.3 programming language. (https://cran.rstudio.com (accessed on 20 March 2025)) and based on the scPDSI v0.1.3 library (https://github.com/Sibada/scPDSI (accessed on 20 March 2025)). The input parameters were the data on total monthly precipitation and potential evapotranspiration for 1950–2024 extracted from the ERA5-Land database [33,34]. The SPEI estimated an atmospheric drought [35]. SPEI increase, similar to Palmer’s, indicated an air drought decrease, and vice versa. The SPEI and potential evapotranspiration (PET) were calculated based on precipitation and evaporation data extracted from the ERA5-Land database and using the SPEI R library (https://cran.r-project.org/web/packages/SPEI (accessed on 20 March 2025)) scripting in the R-Studio.
An increase in summer air temperature (1985 until ca. 1998) is followed by fluctuations (Figure 2a). In the 21st century, mean summer temperature surpassed former values by about +1.3 °C. The annual air temperature increased from the 1970s until ca. 2010 (Figure 2a). Warming-driven summer temperature increase (1985) coincided with soil drought increase (indicated by the decrease in the Palmer index (Figure 2c,d)). The precipitation trend is difficult to understand due to the fluctuation, although significant local maximums of precipitation occurred in the 2010–2013 and 2020–2023 years (Figure 2b). Soil and air drought decrease was observed during 2010–2023 years (Figure 2b–d).

2.7. Statistical Analysis

Spatial data were processed using the ESRI ArcGIS software package version 10.8 (https://www.esri.com/ru-ru/arcgis/geospatial-platform/overview (accessed on 20 January 2025)). Microsoft Excel 2016 and StatSoft Statistica version 10 (https://statsoftai.ru (accessed on 20 January 2025)) software were used for statistical calculations. Standard correlation (Pearson and Spearman) and regression (simple linear and Theil–Sen) analyses were used to identify the relationships between dendrochronological series, satellite data, and climate variables.

3. Results

3.1. Field Data

Stands inventory data are given in Table 1. Stands in Ulug-Hady and Biche-Hady are mostly low closed (crown closure about 0.3). The crown closure in the Balgazyn site was about 0.6. All study pine stands are growing in poor organic sandy soils. The ground cover comprises Poaceae species, Artemisia spp. and Orostachys spinosa L., Centaurea sp., and Caragana sp.). All stands were influenced by periodic surface fires, which caused partial mortality of the mother canopy and severe mortality of the young cohort of Scots pine (Figure 3).

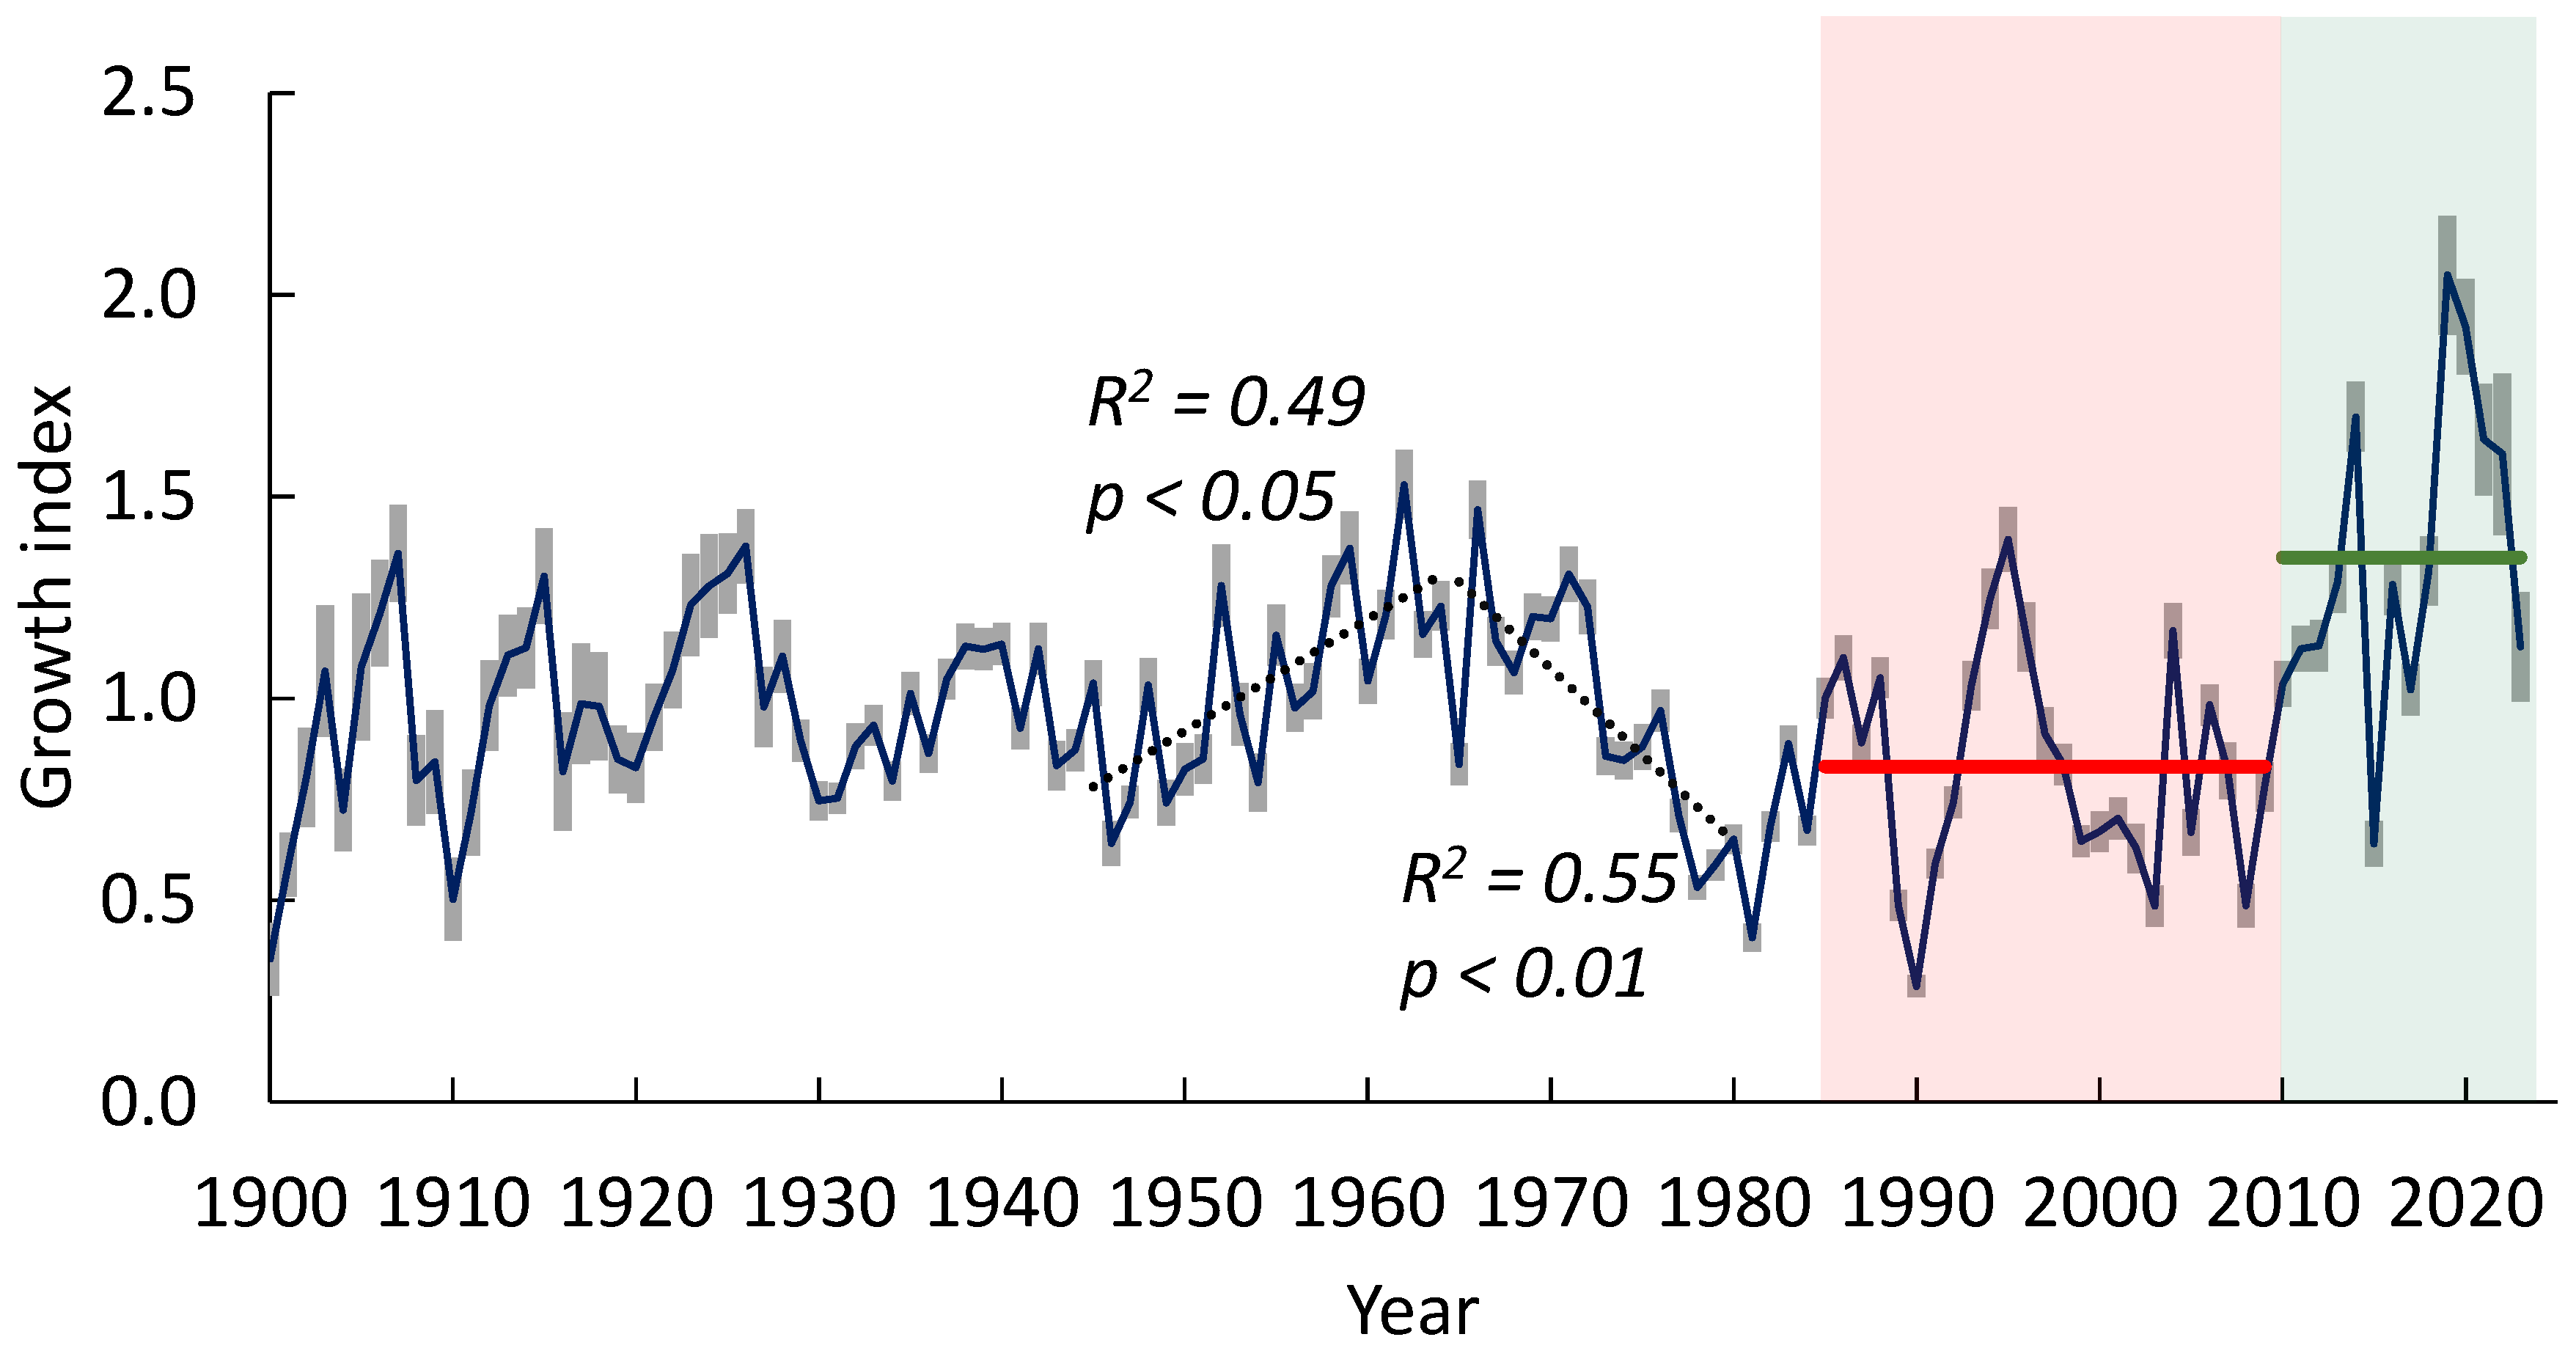
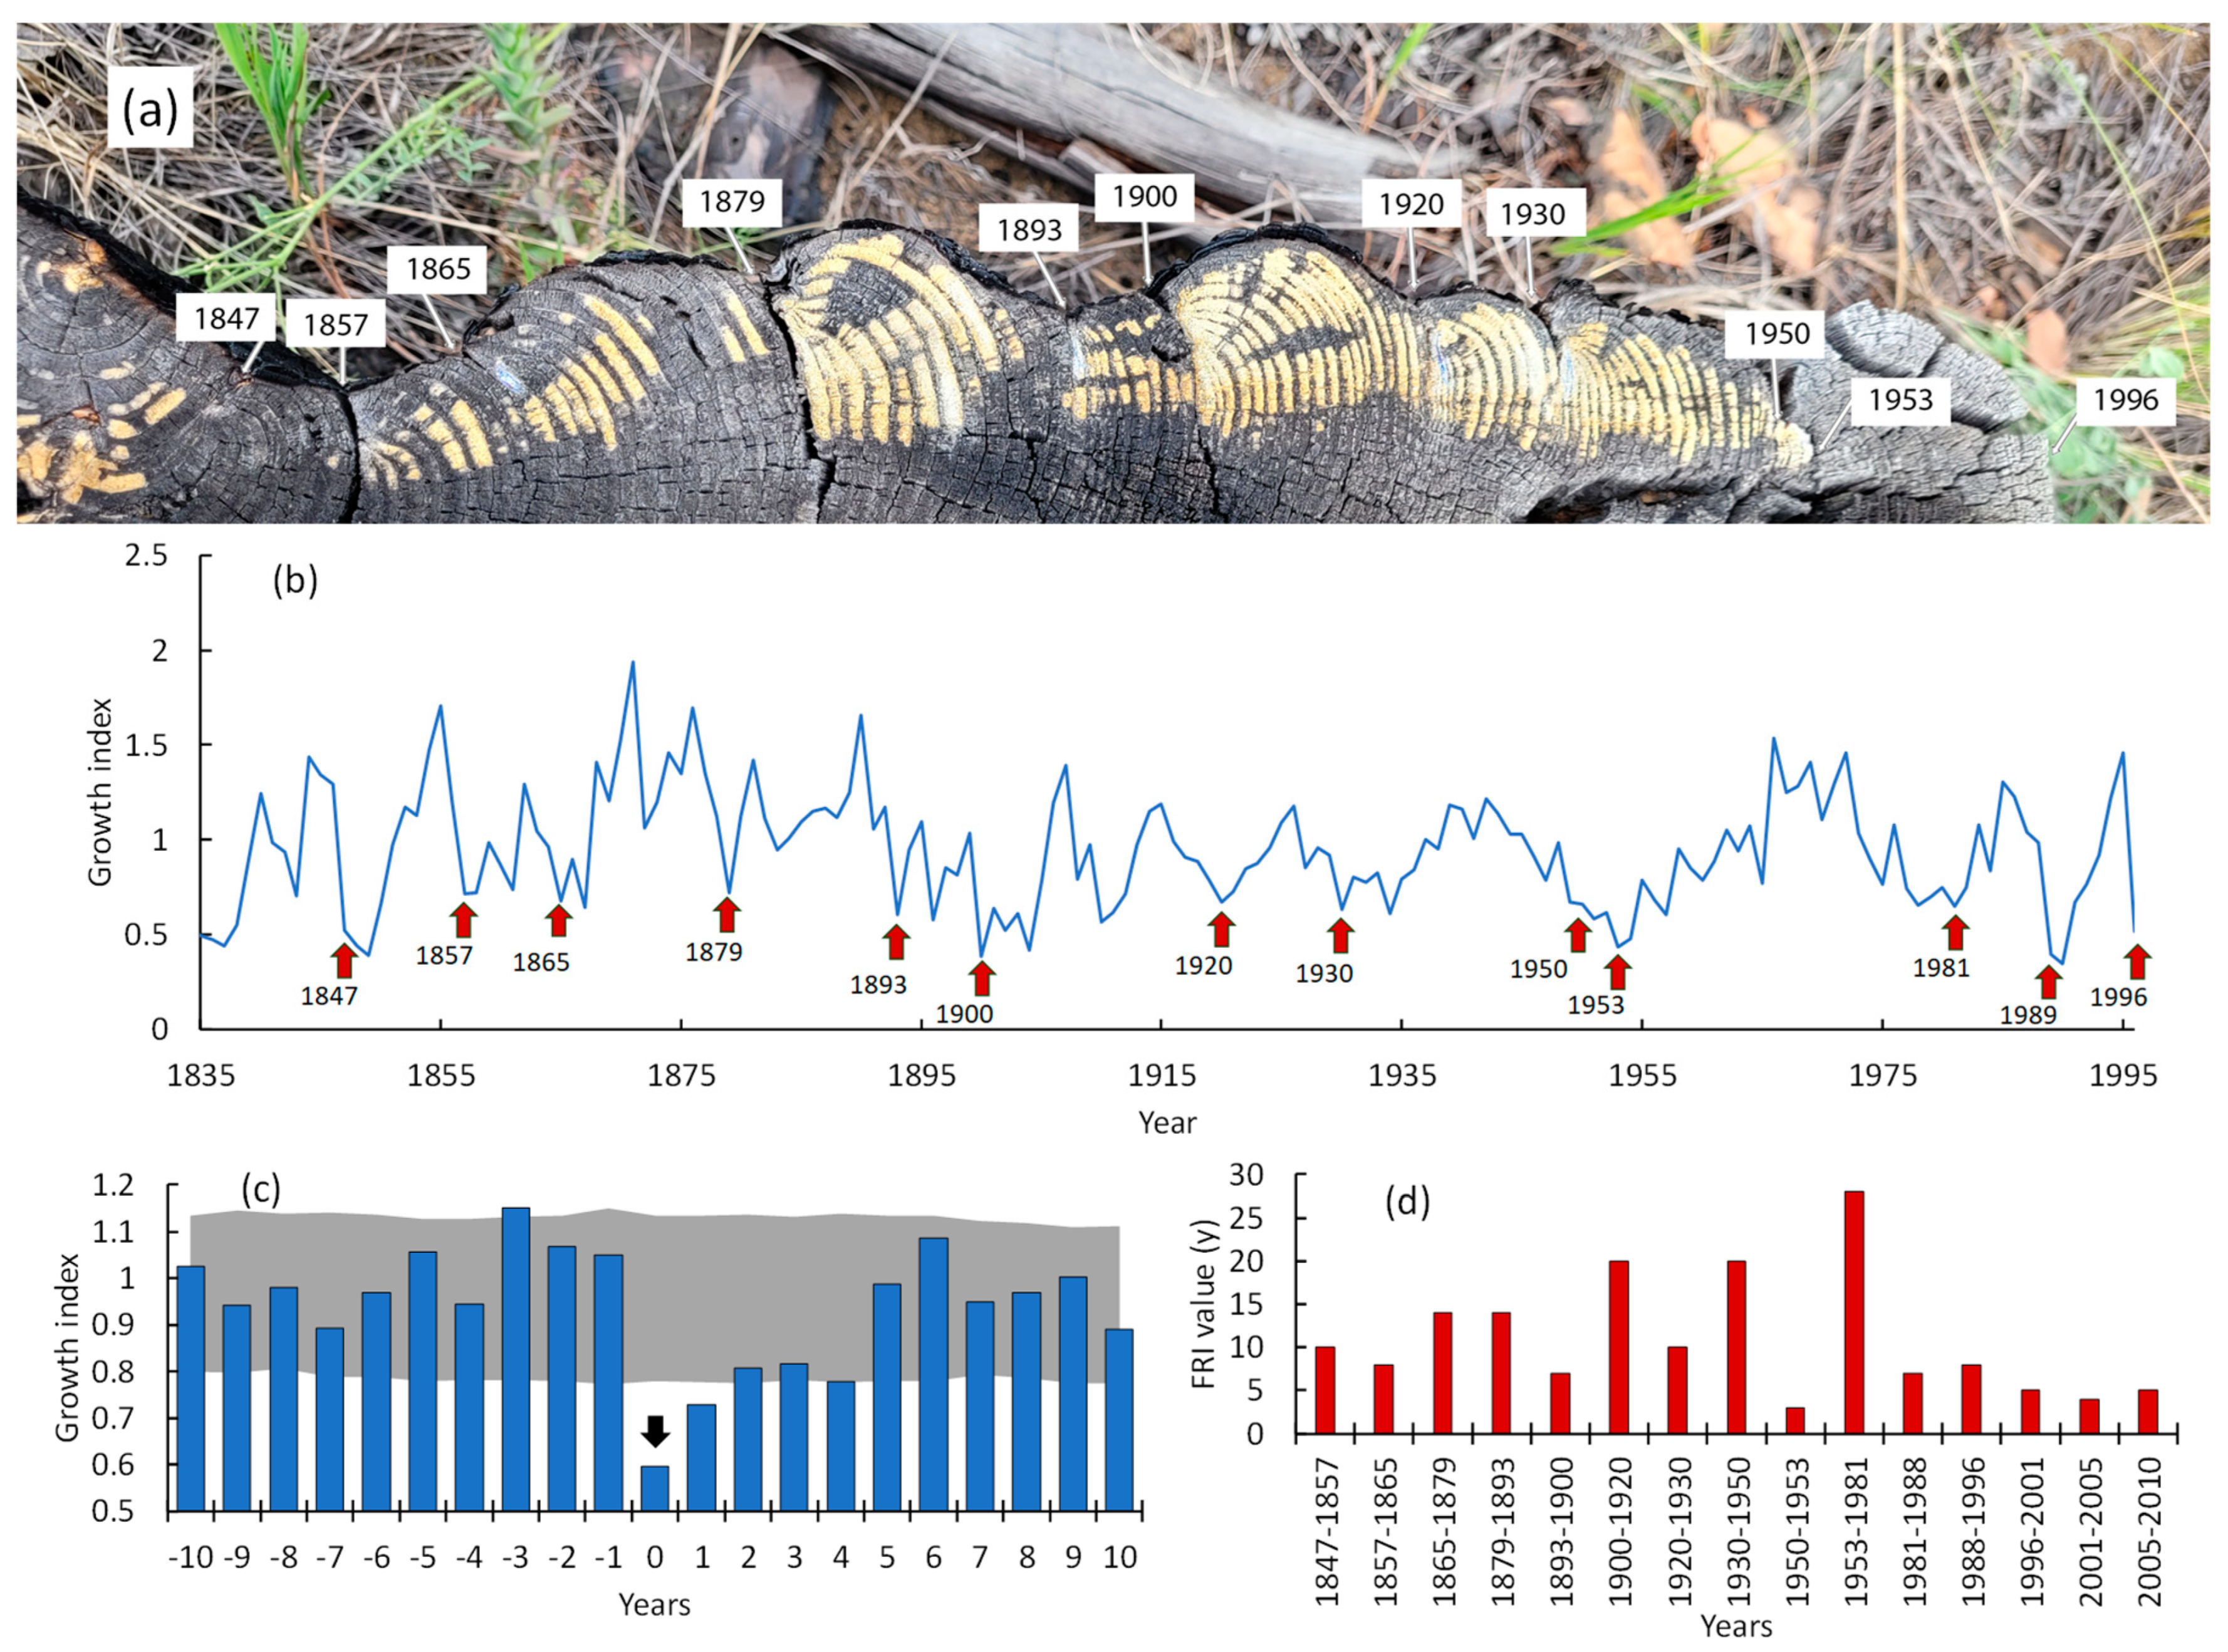
3.2. Chronology of Pine Tree Growth Index

The growth index (GI) chronologies of all sites were synchronized (inter-serial correlation r = 0.66). Therefore, we used a generalized chronology for all sites. The GI increased from the 1940s to the 1960s, followed by a decrease until the beginning of the 1980s. Since the warming onset (ca. 1985), the GI has experienced periods of increase and decrease. The period of the “warming restart” (since ca. 1998–2000) is characterized by an increase in the GI. The maximal GI values (in 2018–2022) exceeded their historical values by about 1.4 times (Figure 4). There are no chronically decreasing trends in the GI, which are predictors of tree decline [36].

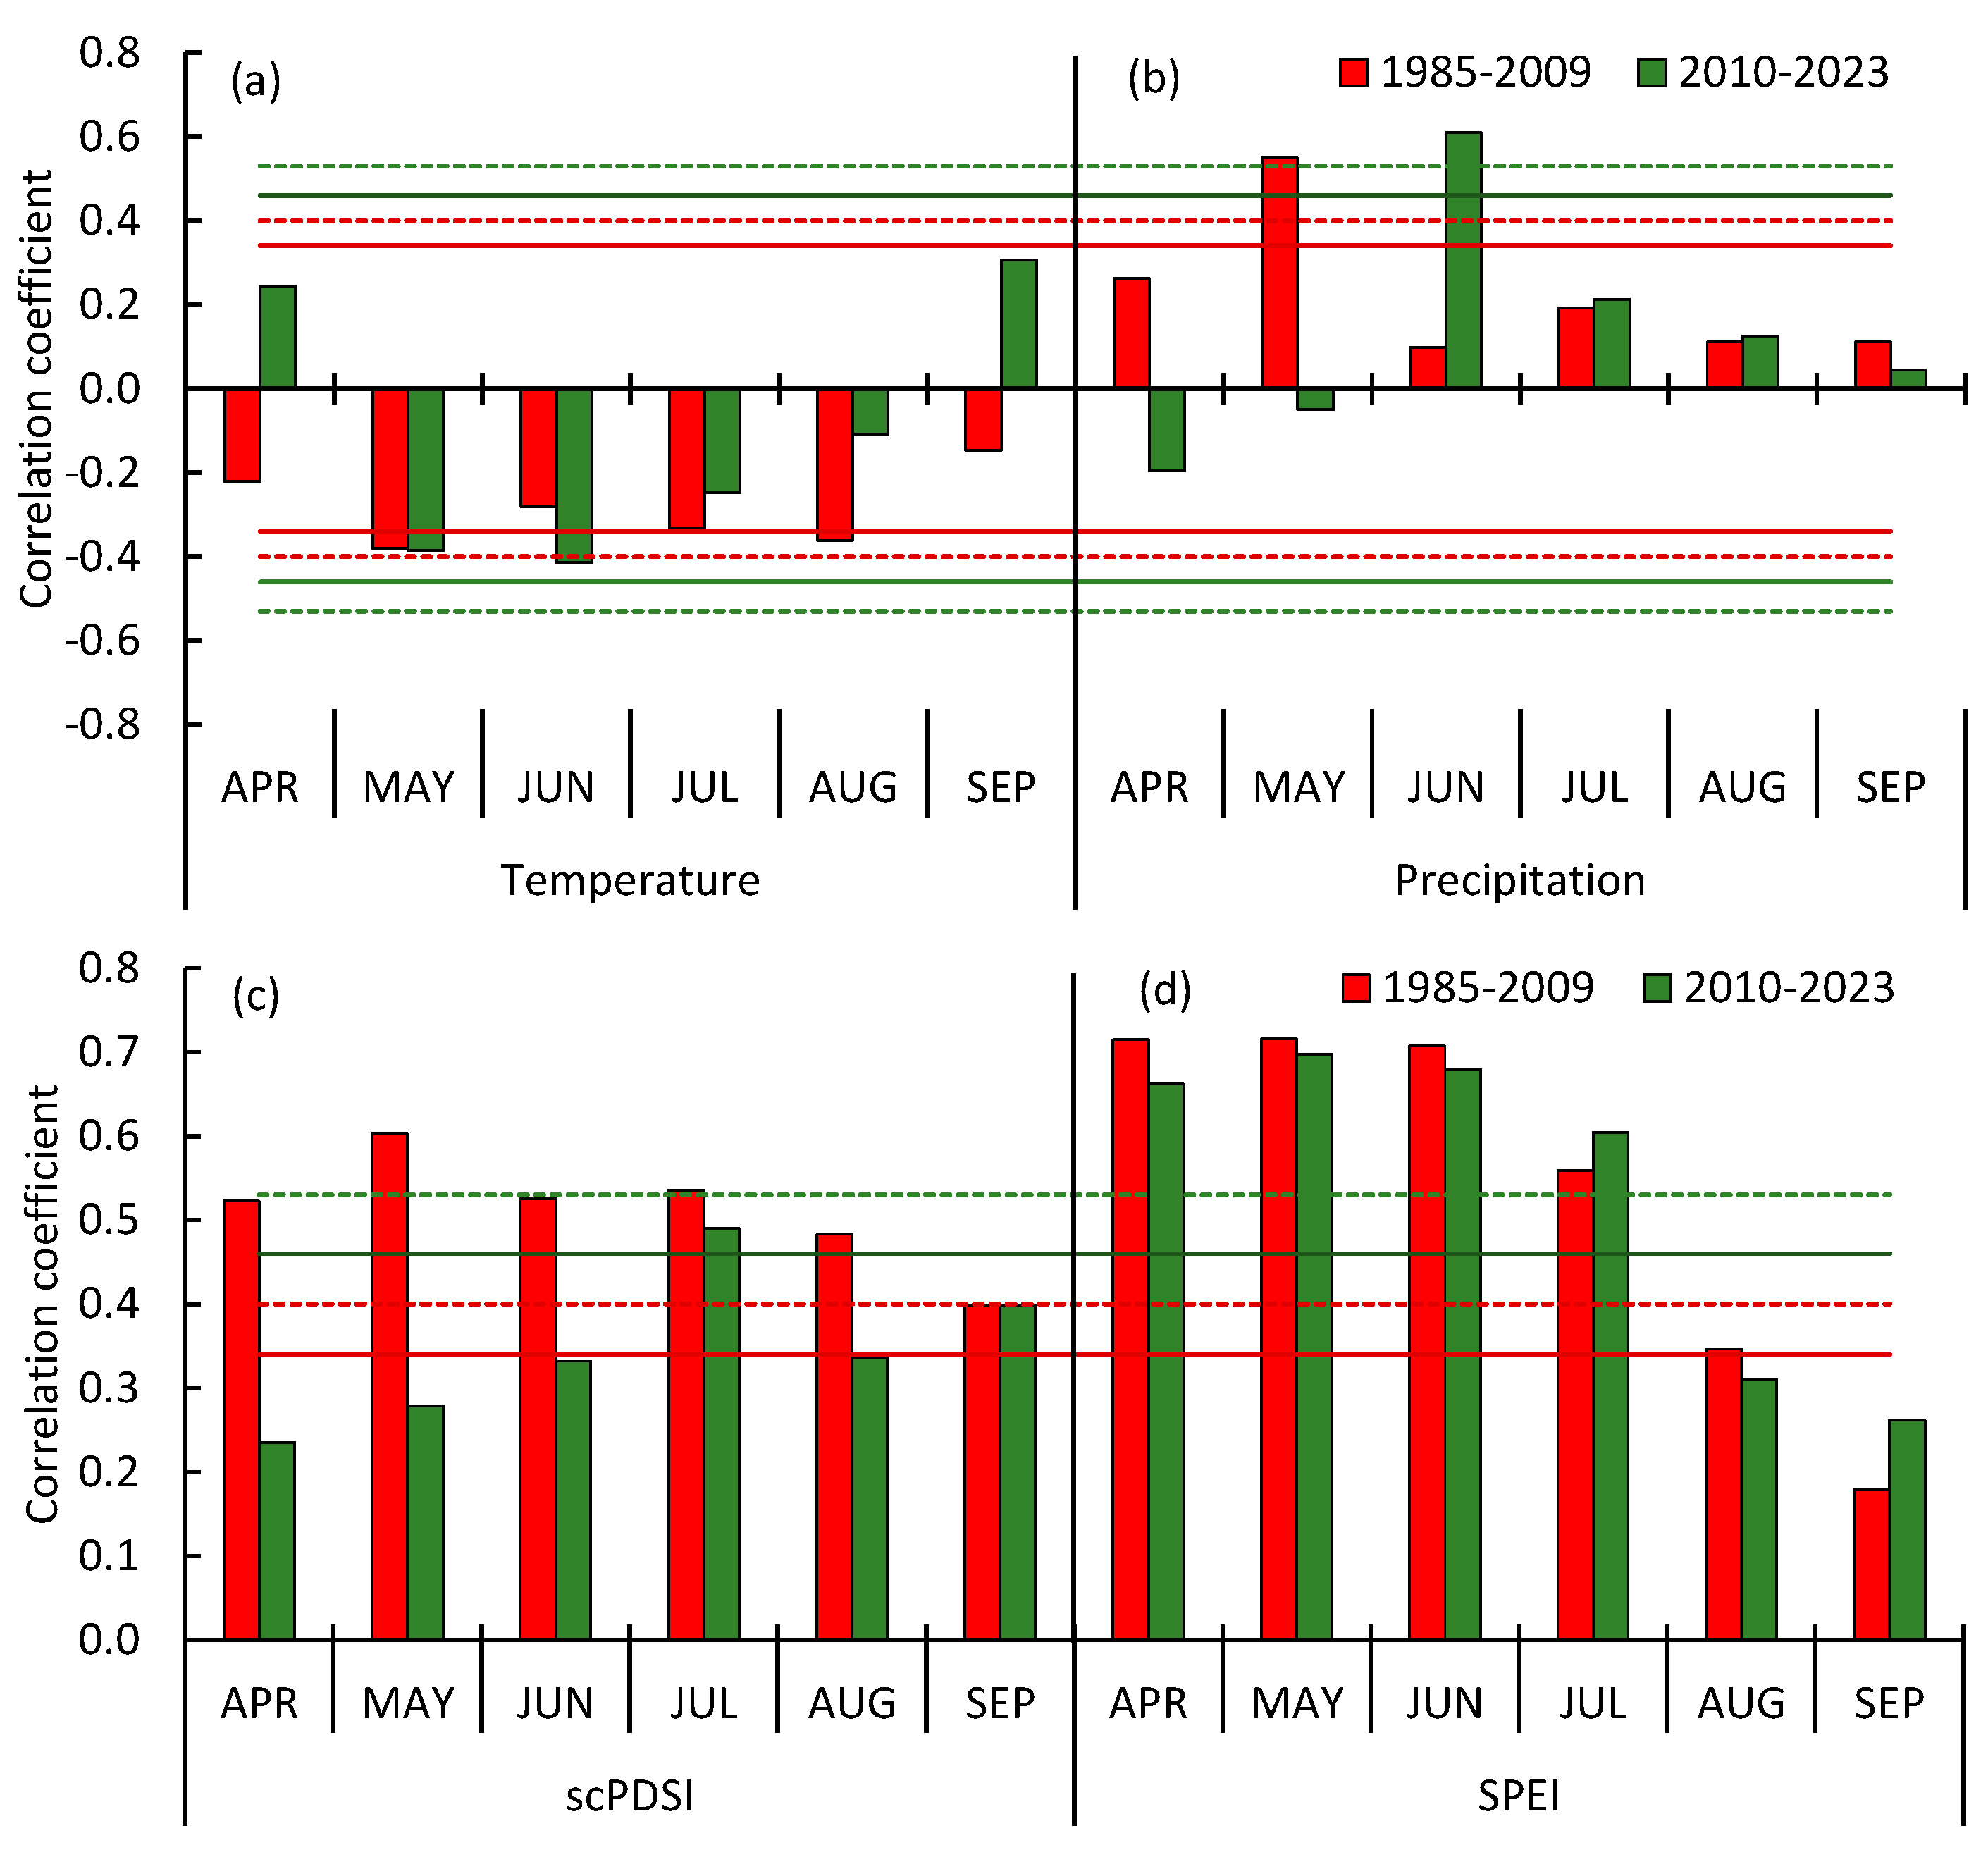
3.3. Pine Tree Growth Index: Relationship with Climate Variables

Correlations Between the Growth Index and Climate Variables

In this paragraph, we compare two periods of tree growth: (1) from the warming-driven summer temperature increase (ca. 1985, Figure 2a) to the beginning of soil drought decrease (2009), and (2) since soil and air drought decrease (2010) until 2024 y (Figure 2c). Red and green bars indicated those periods in Figure 4.
May–June air temperatures negatively influenced tree GI during both analyzed periods. However, during the period of growth increase (2010–2023), the influence of temperature became insignificant in July–August (Figure 5a). Maximal values of the GI dependence on precipitation shifted from May (in 1985–2009) to June (2010–2024), which referred to the precipitation maximum shift to earlier dates (Figure 6).
The precipitation pattern changed during the time interval 2010–2023 compared to 1985–2009. The maximum precipitation shifted to early dates, i.e., precipitation increased in April–July and decreased in August–September. Precipitation during the cold period (October–February) did not change (Figure 6).
The dependence of the GI on the soil moisture (indicated by Palmer’s scPDSI) significantly differed between the analyzed periods. Earlier (1985–2009), the GI was correlated with soil moisture throughout the growth period (with maximal values in May), whereas later (2010–2024) correlations with April–June soil moisture decreased due to both precipitation increase and precipitation shift to the earlier dates (Figure 5c and Figure 6).
The GI correlations with air drought (indicated by SPEI) were similar for both analyzed time intervals (Figure 5d). It is worth noting that the pine GI is sensitive to the soil moisture stored in the previous year (August–September) (Figure 7). Thus, “conserved” moisture stimulates tree growth by smoothing “seasonal drought” in the spring. It is notable that trees were more sensitive to stored water during low precipitation periods compared to increased ones (Figure 7a,b).
Thus, the increase in air temperature as such does not limit but rather promotes the growth of pines in combination with a sufficient moisture supply. This phenomenon has been most pronounced during recent years (2010–2023), when warming has been synchronized with precipitation increase and soil and air drought decrease.

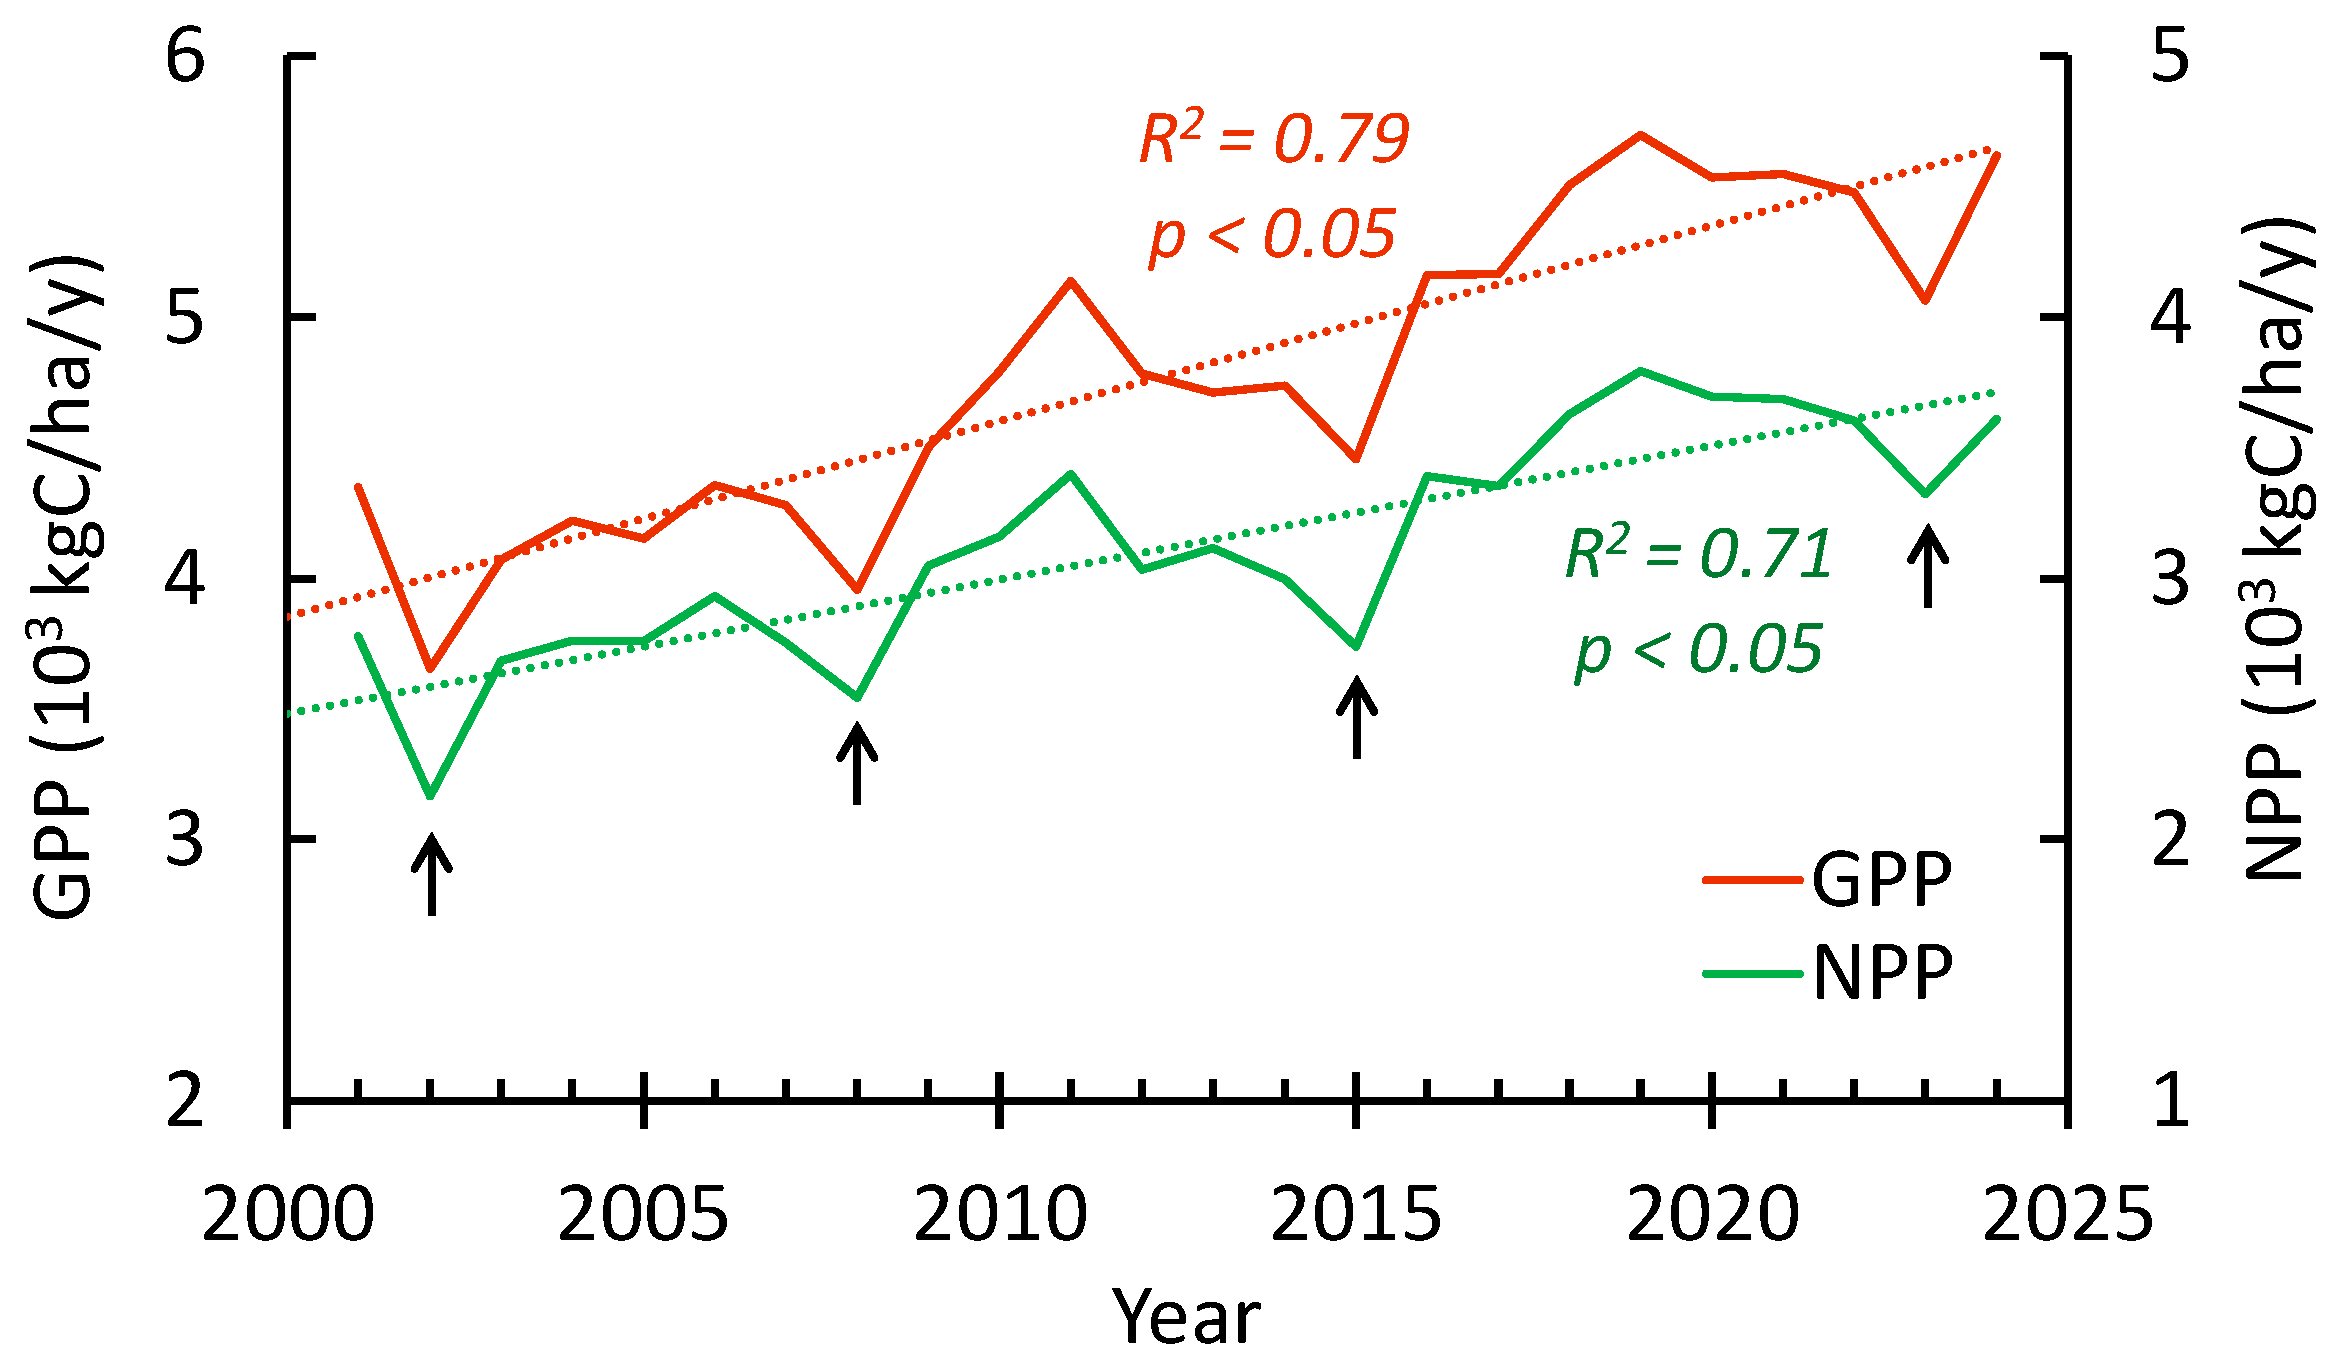
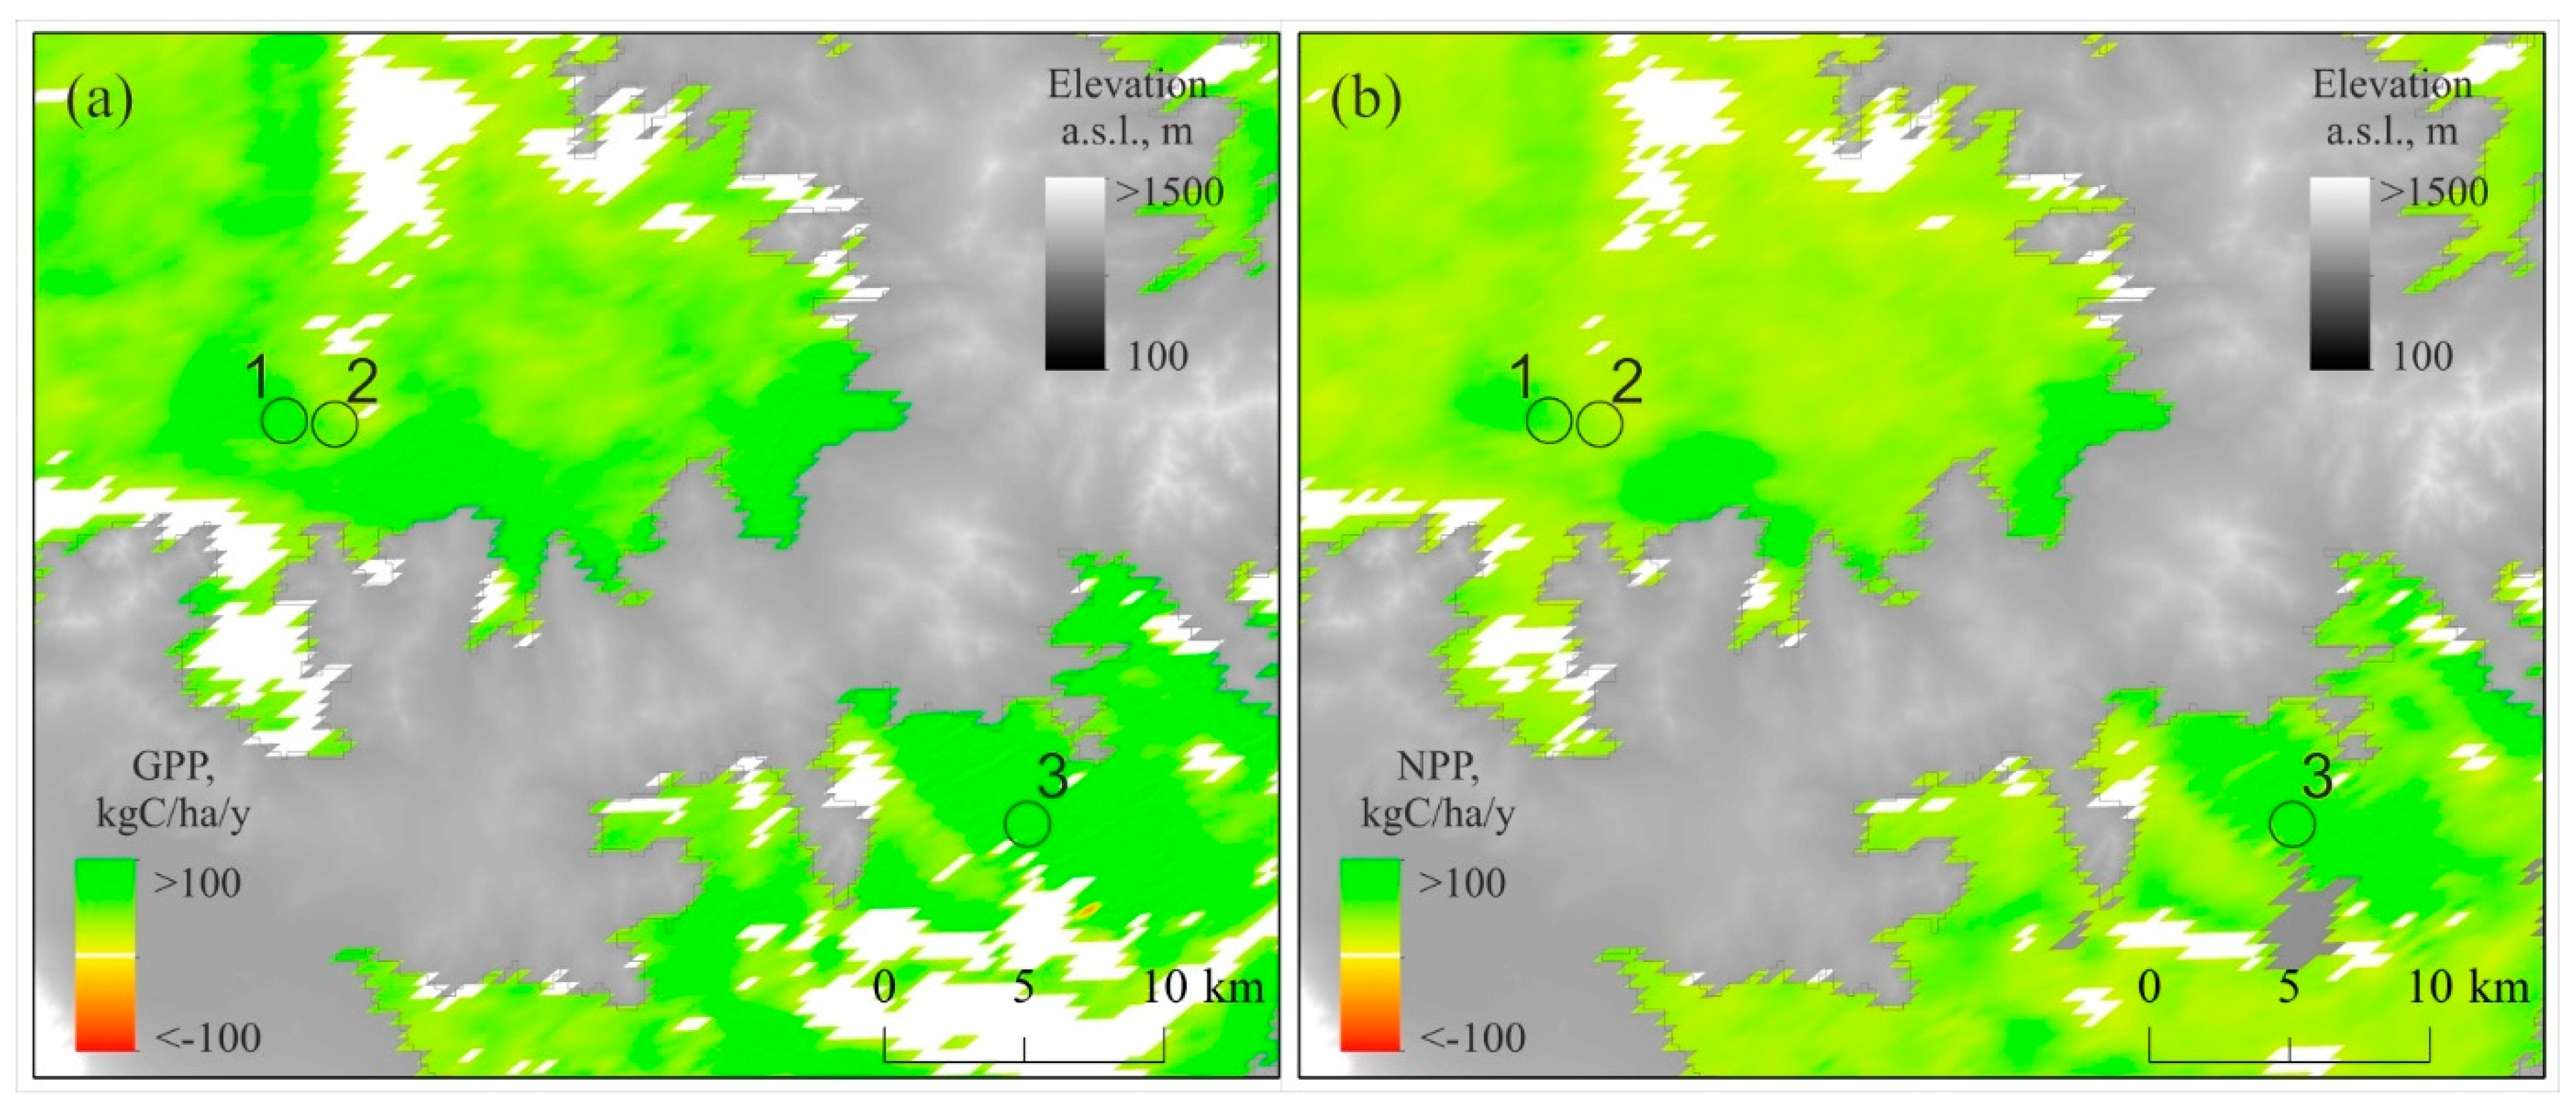
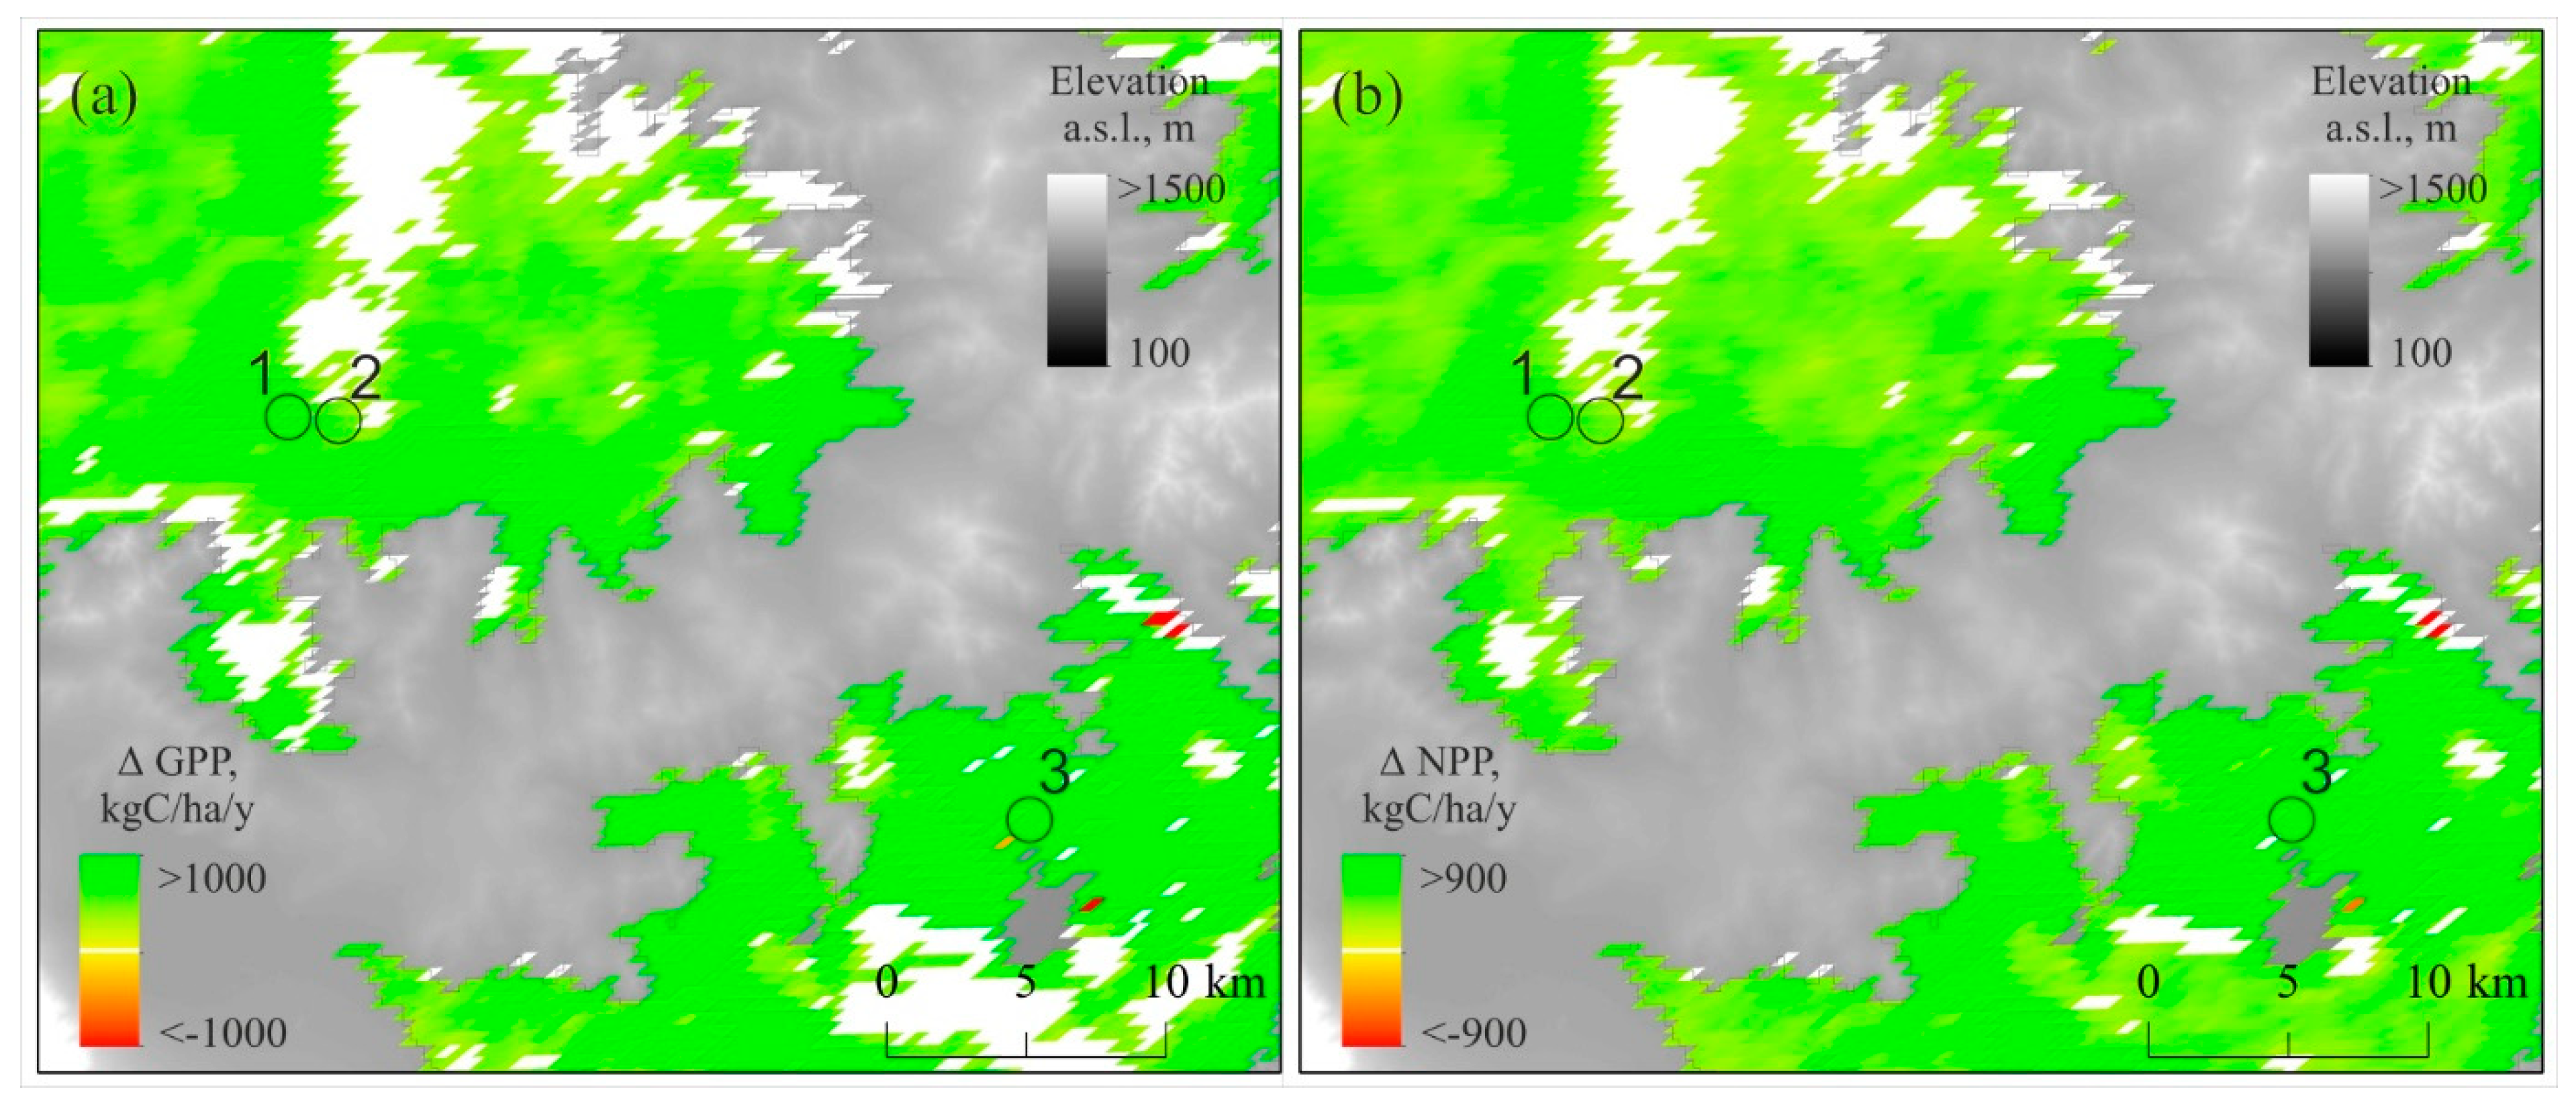
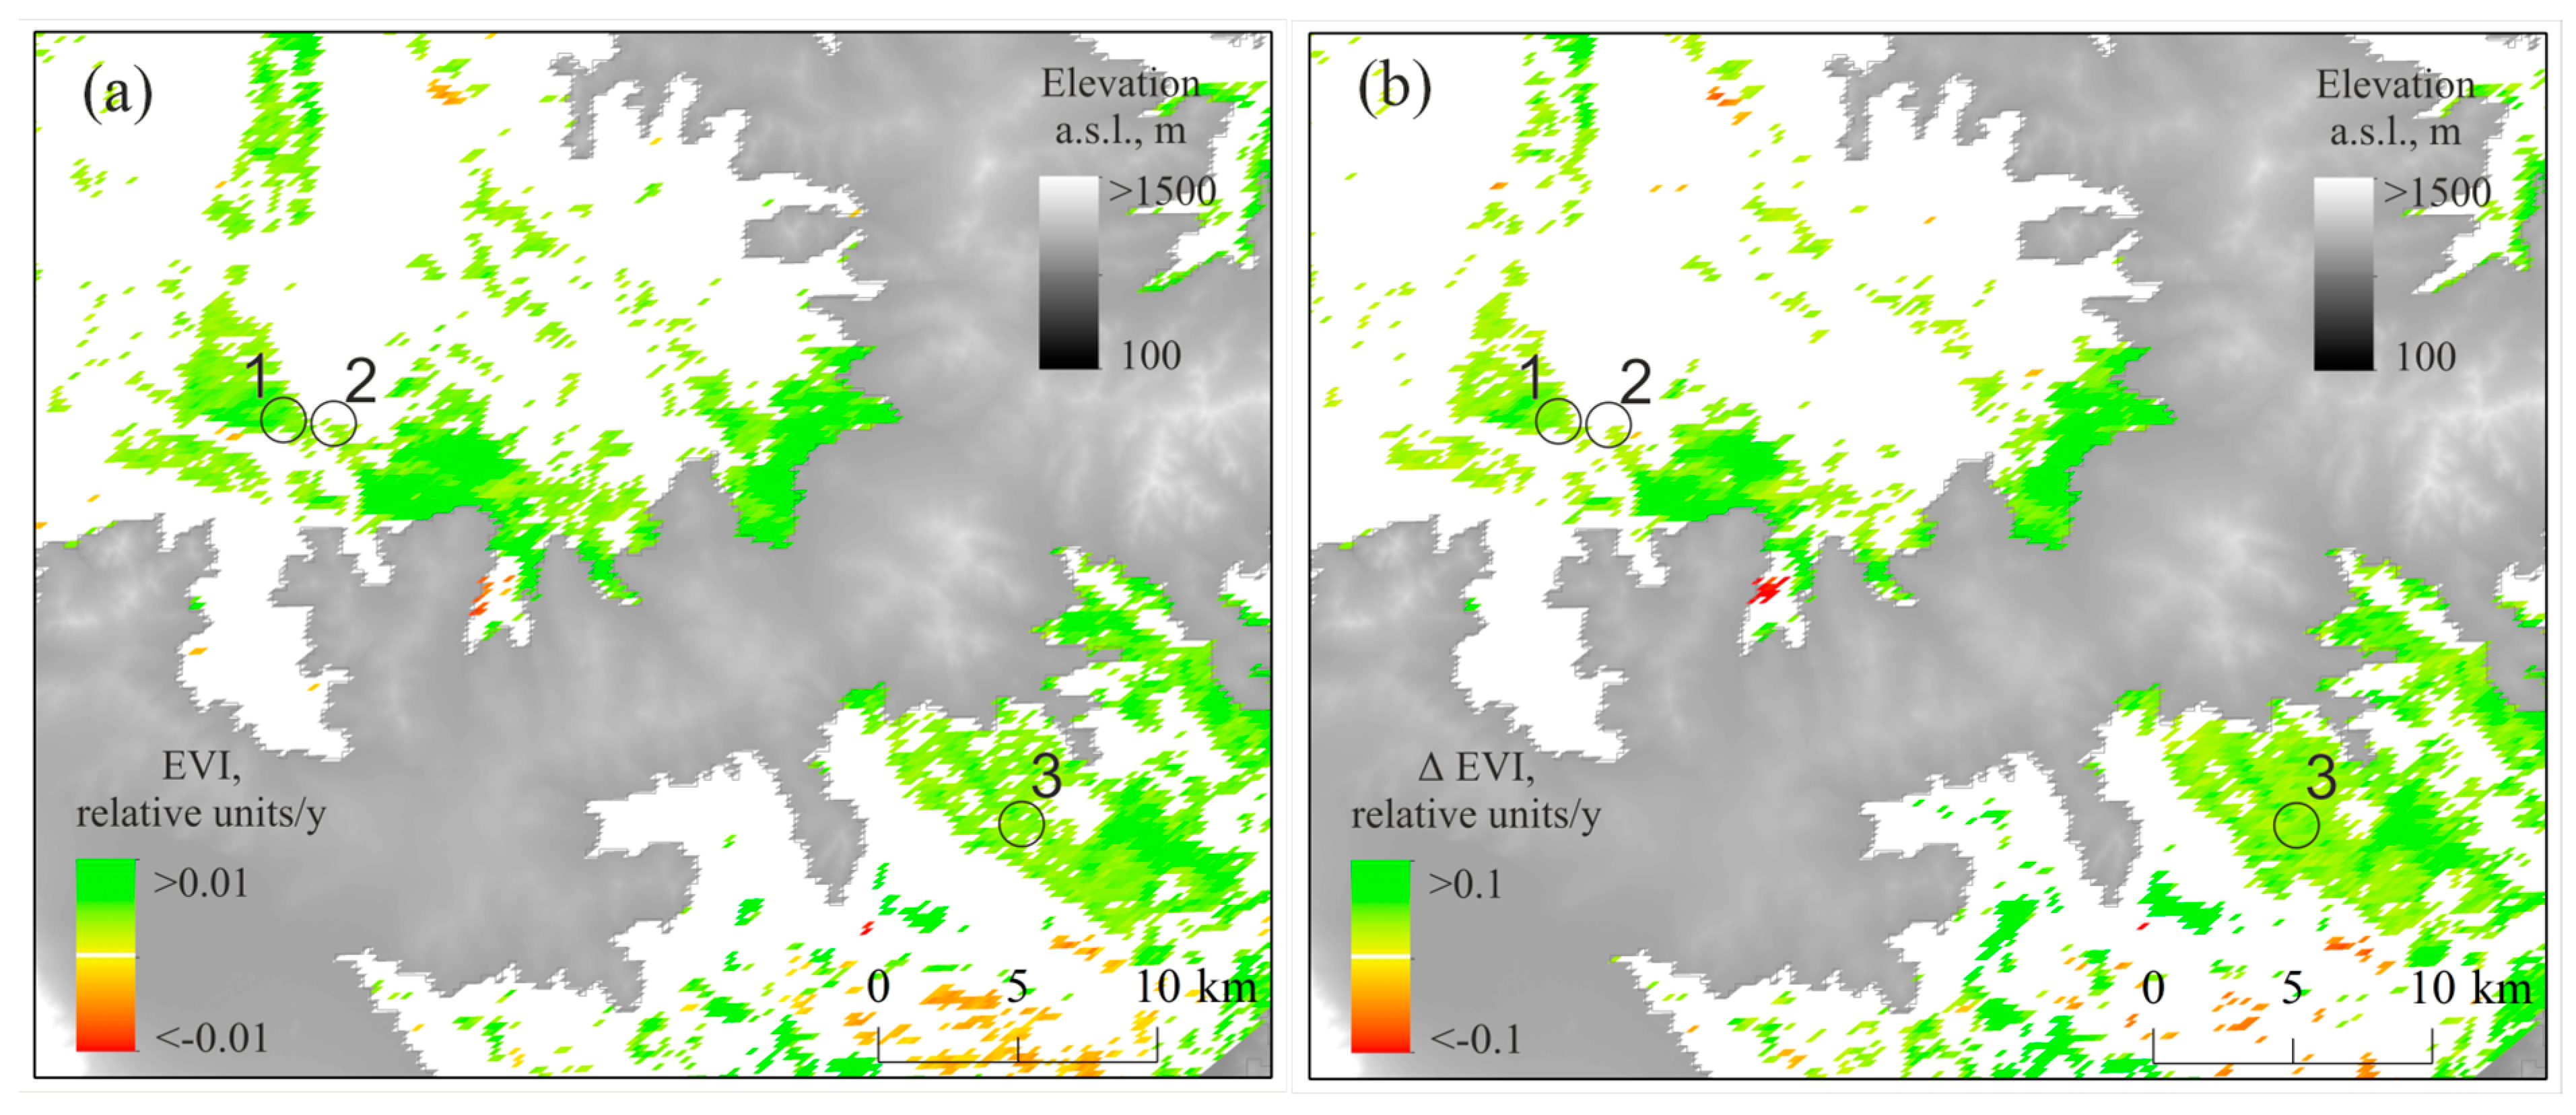
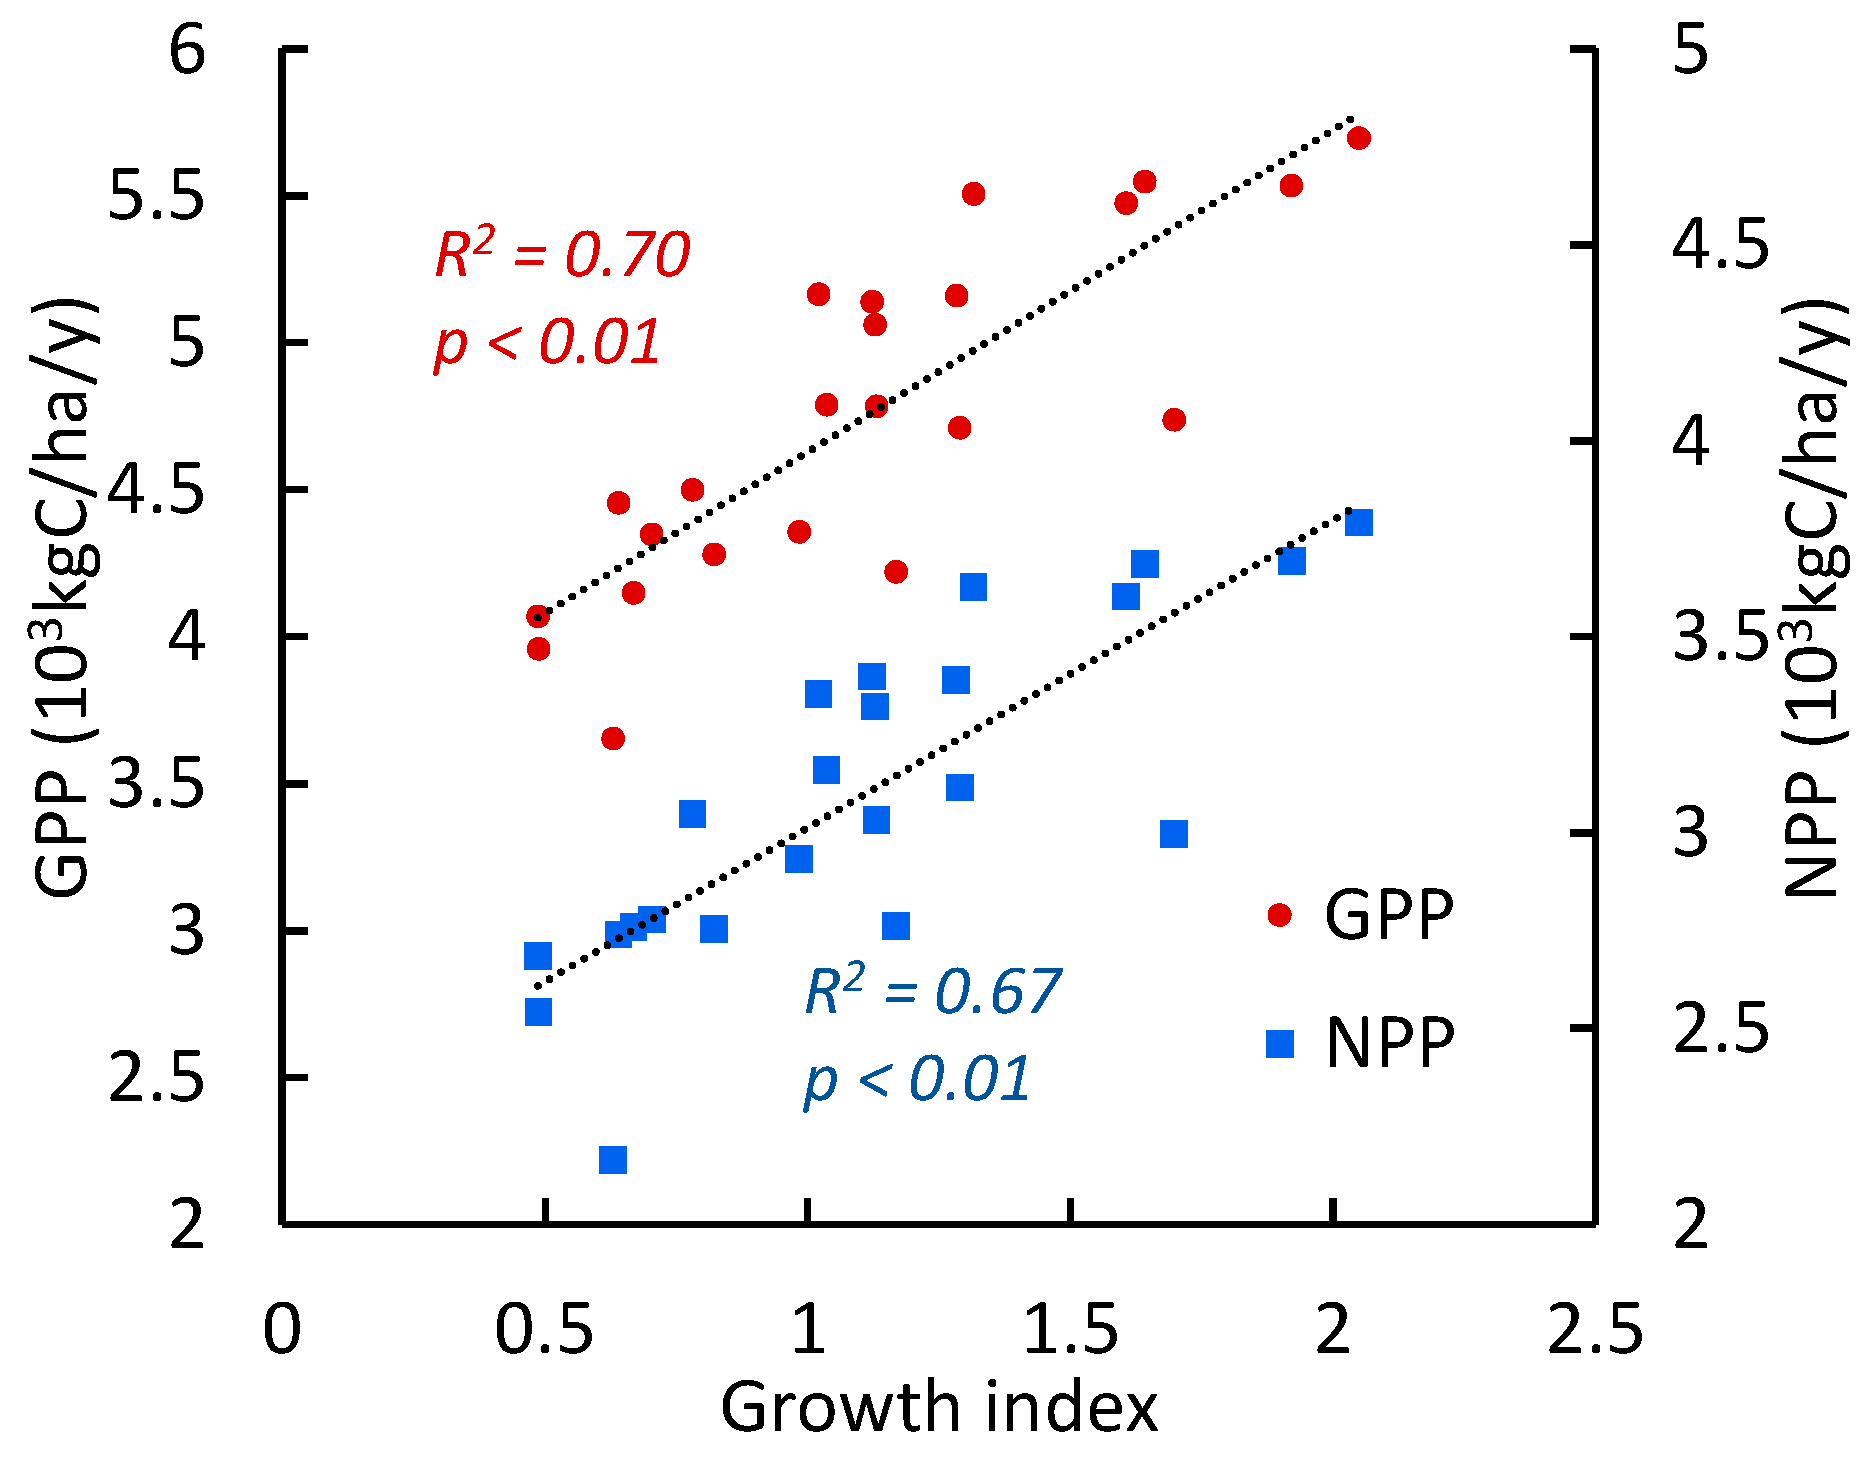
3.4. GPP, NPP, and EVI Trends Within the Study Sites
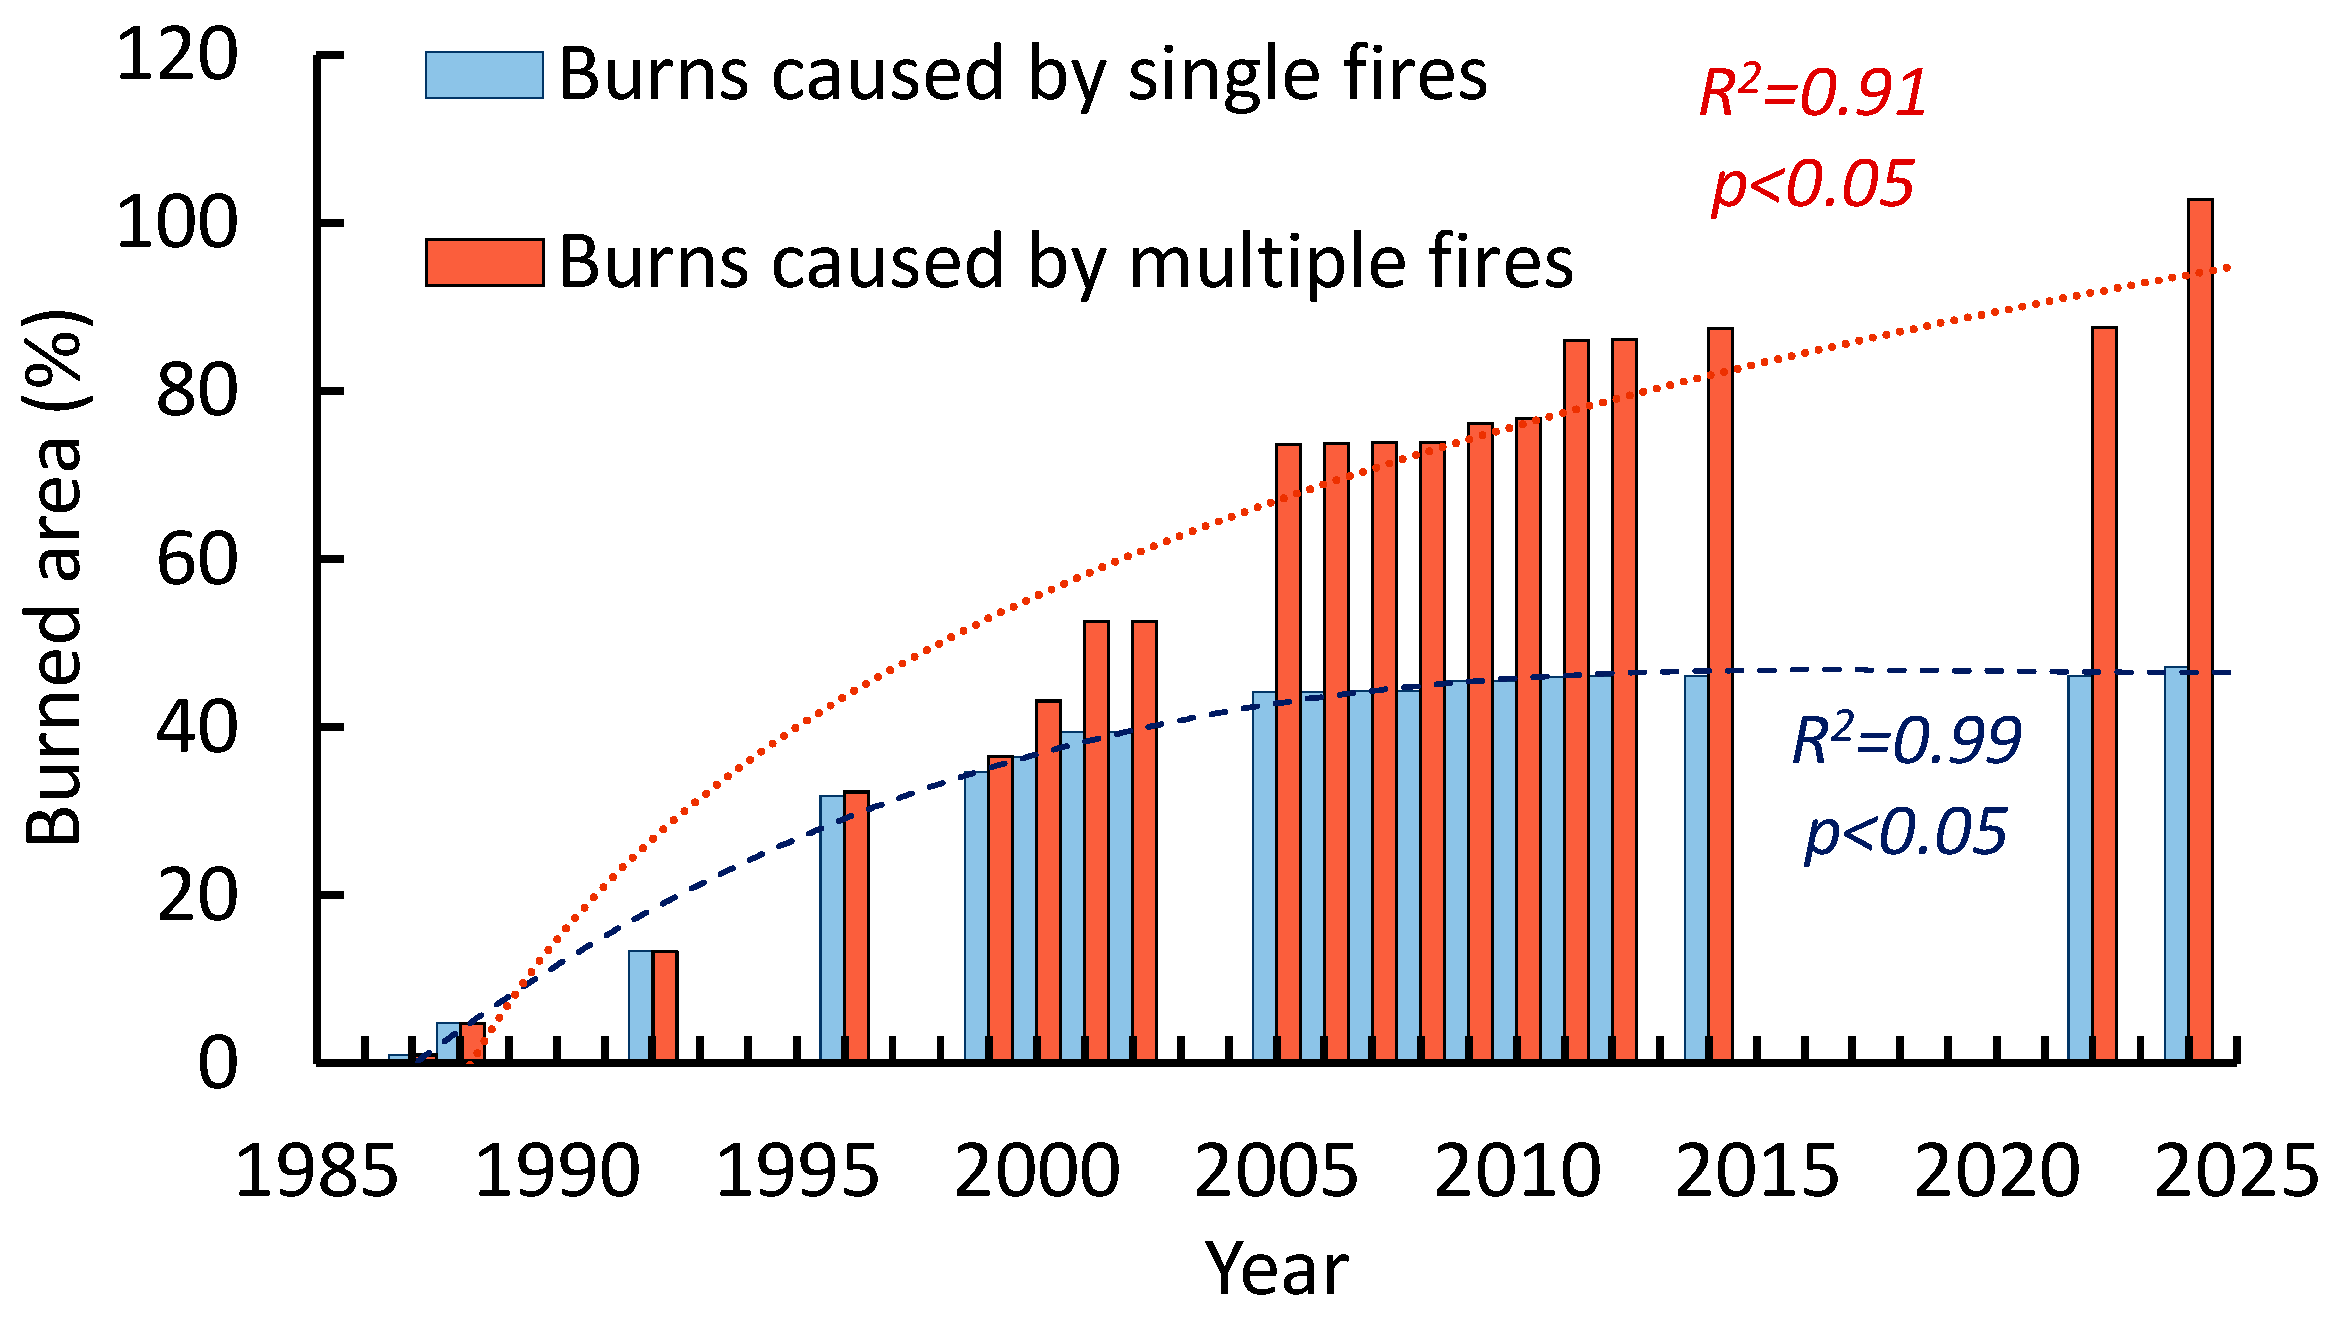
In the 21st century, gross and net primary productivity have been strongly increasing at all study sites. Similar to tree GI, maximal GPP/NPP values occurred in the last decade. Minimal GPP/NPP values correspond to wildfire events. Despite repeated fires, strong increasing GPP/NPP trends have been observed (Figure 8).
Increasing trends of GPP and NPP were also observed throughout the surrounding bush–steppe area. Positive GPP and NPP trends occurred in 81% and 88% of the areas, respectively, whereas negative ones were observed in less than 1% (Figure 9).
A difference between GPP/NPP during the period of increased precipitation (2010–2024) and the earlier period (2001–2009) is given in Figure 10. It is notable that an increase in the GPP and NPP has been observed throughout the entire territory. In particular, in pine stands, both GPP and NPP have increased by about 1.25 times.
Alongside vegetation productivity, vegetation “greening” (indicated by the EVI index) is also increasing. Positive EVI trends occurred in 23% of areas, whereas negative ones occurred only in ca. 1% (p < 0.05) (Figure 11).
Finally, the growth index of trees is strongly correlated with vegetation GPP/NPP values (r = 0.82) (Figure 12).

3.5. Fire Dynamics

The fire-return intervals (FRI) since 1985, reconstructed based on satellite data and based on burn marks on trees (1835–1996), are shown in Figure 13 and Figure 14. After the warming restart, the frequency of fires reached its maximum in the first decade of the 21st century, with a consequent decrease. This “fire lag” can be attributed to the elimination of “fuel load” (i.e., on-ground woody debris) by previous fires. As fuels have accumulated, fires have occurred again in recent years (Figure 13).
The burning-rate increase led to a reduction in FRI. Thus, FRI at the Ulug-Hady site decreased to 5 ± 1 years, i.e., by more than two-fold compared to its historical value (1835–1996; 12 ± 5 years; p < 0.02). The longest FRI (ca. 28 y) coincided with the period of effective fire suppression (1983–1981, Figure 14b). The FRI for the total area of all sites was 3 ± 2 years. Please note that due to forest fragmentation, fire might not spread over the entire area. Similar FRI (2–3 years) was reported for relict pine forests in other parts of the southern pine range, and the East Trans-Baikal region [16]. In the West Trans-Baikal region, the FRI range is 4–45 years [18]. It is worth noting that an increase in the burning rate led to a significant decrease in the pine area in the Balgazyn forestry, specifically from about 20,000 ha in the 1980s to 5900 ha at the beginning of the 2000s [15]. A similar decrease in pine forests was reported in the Trans-Baikal region, where fires eliminated pines over about 16,000 ha, or 2/3 of their former area. Moreover, follow-on surface fires burned post-fire pine regeneration. In the northern part of the pine range (northern Siberia), a reduction in FRI was also reported [37]. Alongside pine, larch (Larix sibirica) forests in the Trans-Baikal region were partly transformed into shrub and steppe communities due to repeated fires [21].

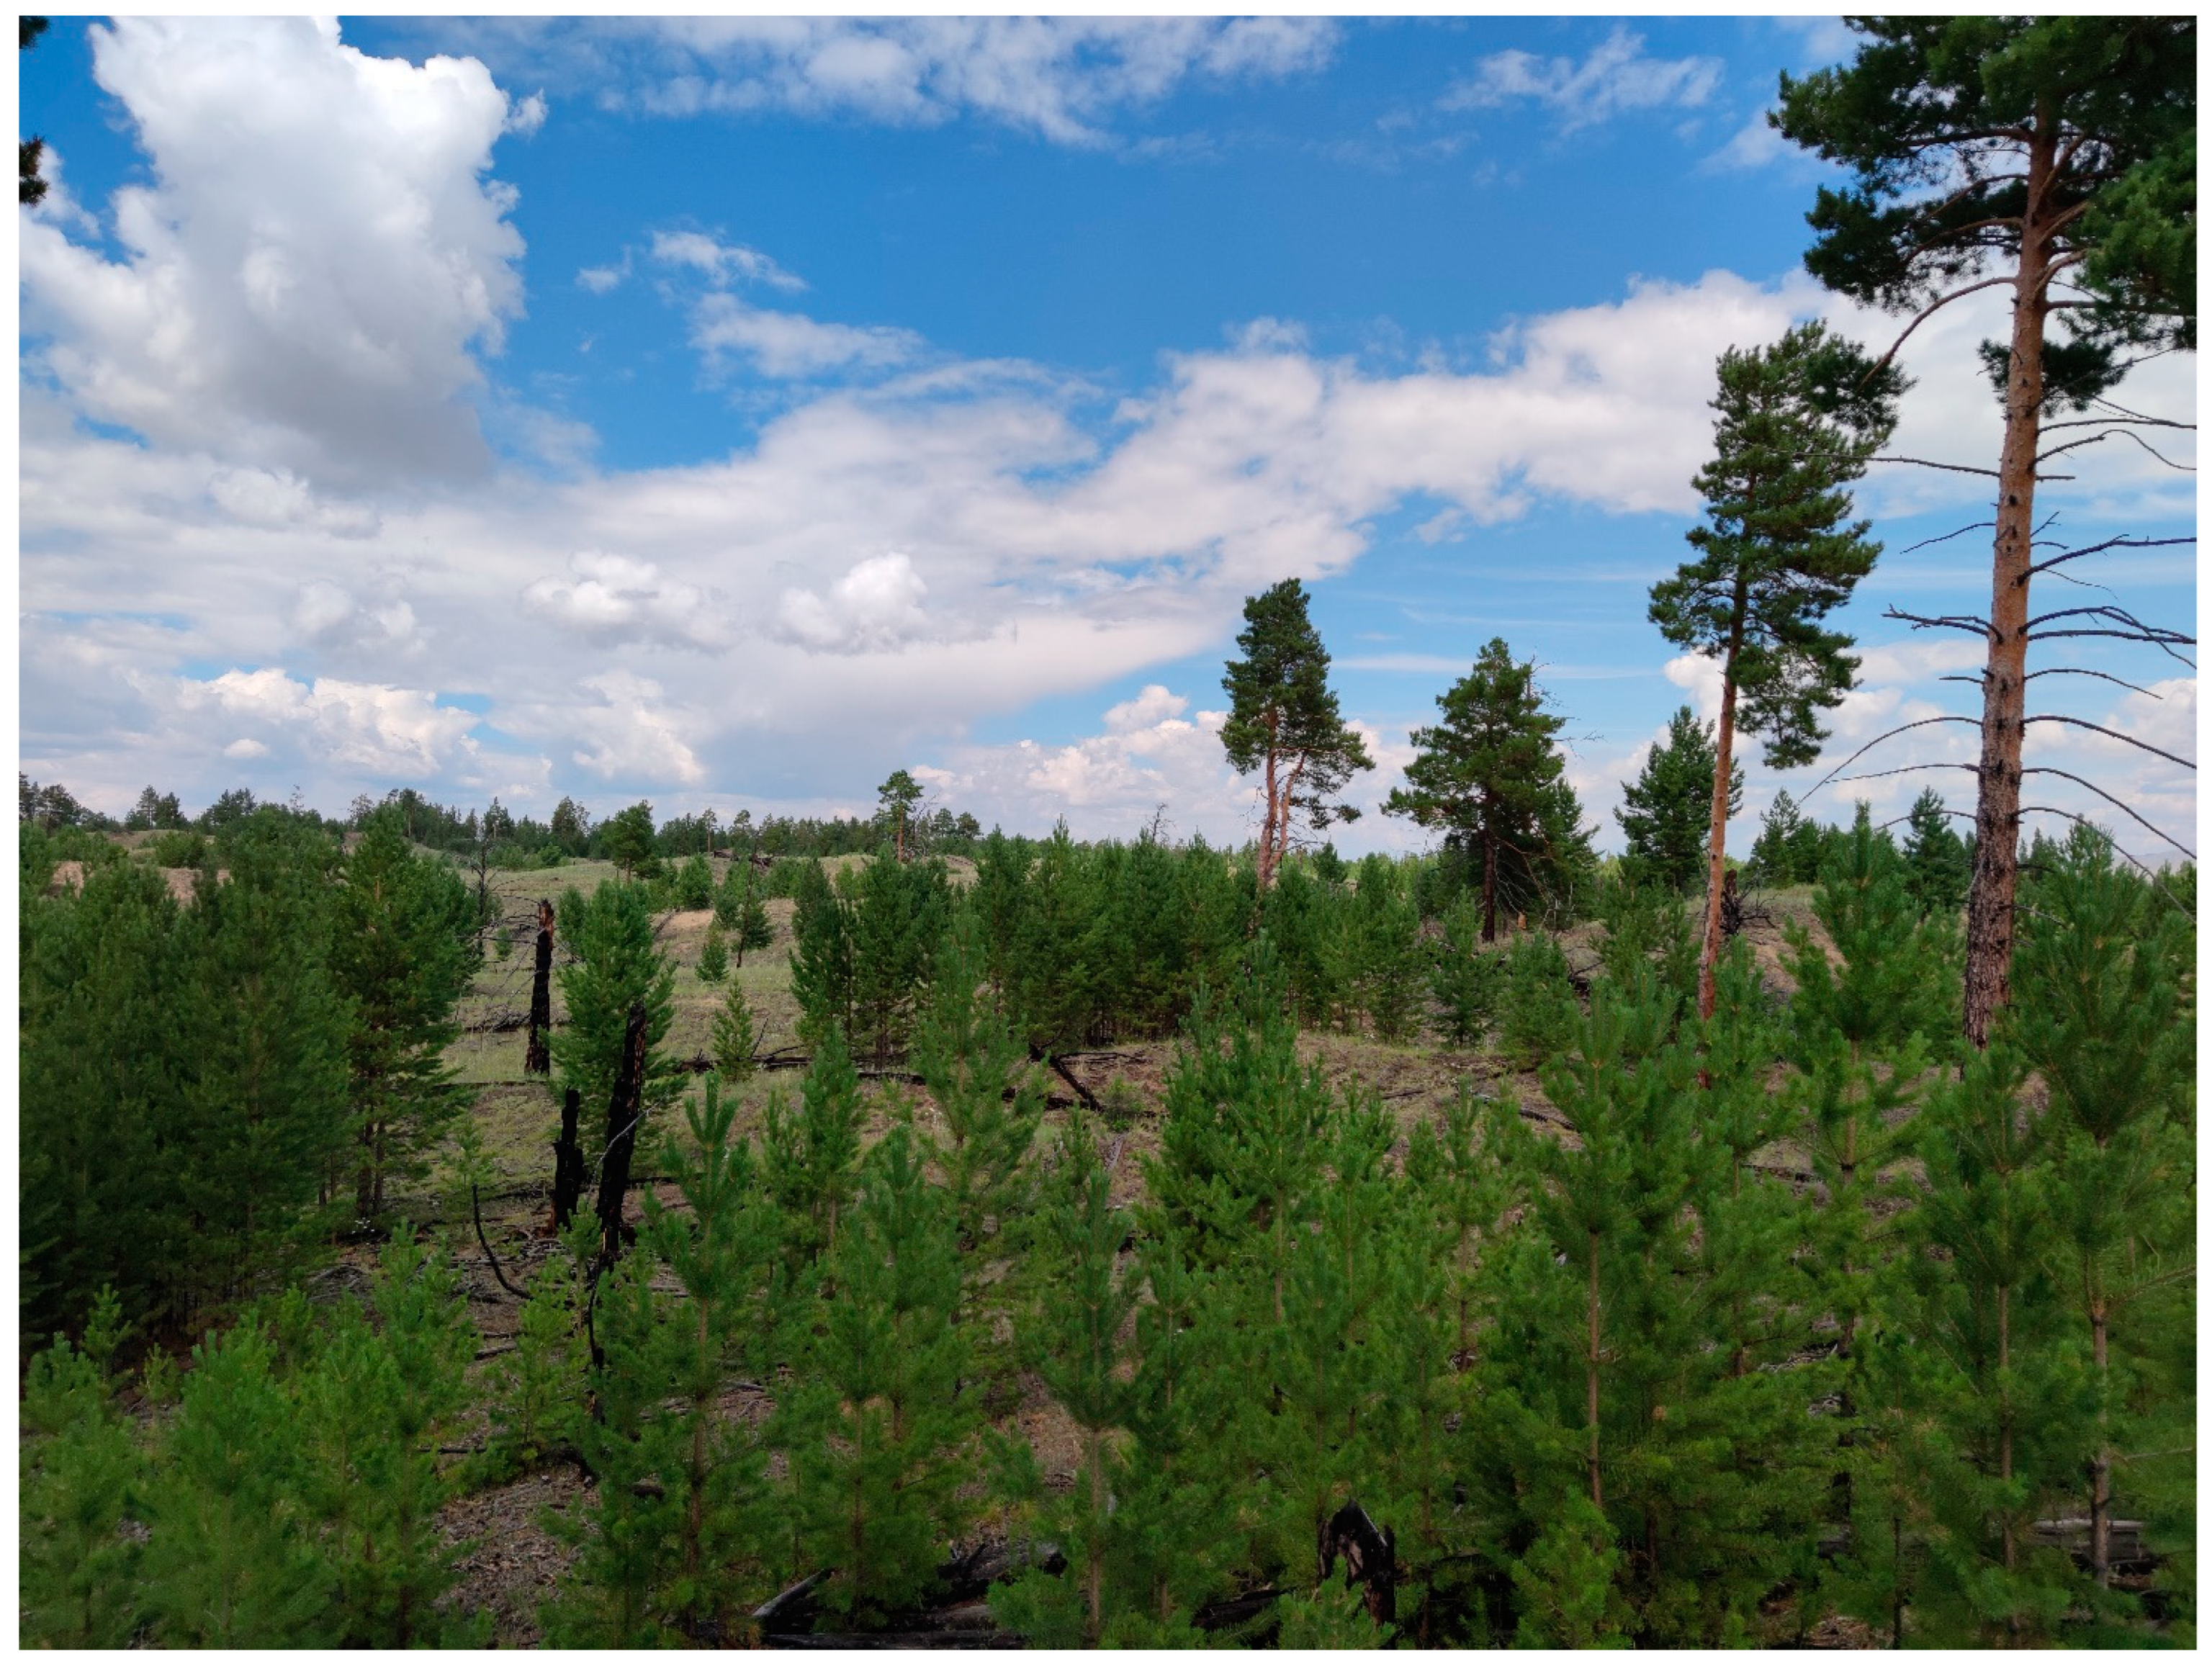
3.6. Post-Fire Regeneration

Pine regeneration is located within depressions and northern-facing slopes as well as under mother tree shadows (Figure A2). Regeneration and vegetation cover are low or absent on south-facing dune slopes. In general, post-fire regeneration is plentiful and viable. The mean seedling density within the Balgazyn, Biche-Hady, and Ulug-Hady sites is about 7000–10,000/ha, reaching up to 85,000/ha within clusters. The majority of seedlings have good vigor (i.e., <5% of declining seedlings) (Figure 15).
Thus, the health and number of seedlings are sufficient for successful pine stand recovery. However, surface fires strongly damage regeneration as well as afforestation, thereby threatening the conservation of relict pine forests.

4. Discussion

Climate warming at the southern edge of the Scots pine range did not lead to a chronic decrease in the GI, which is the predictor of tree decline and mortality [36]. Moreover, since the warming restart, the pine growth index has surpassed its historical values. Maximal GI values occurred from 2010 to 2023, i.e., during the period of decreased soil and air drought (Figure 3). The pine tree growth index strongly correlates with the GPP and NPP in pine stands (r = 0.82) (Figure 8). Moreover, increasing trends of GPP and NPP are observed in the majority (80%–90%) of surrounding bush–steppe communities (Figure 9 and Figure 10). Therefore, warming itself does not suppress tree growth and vegetation productivity. On the contrary, an increase in air temperature stimulates growth when combined with increased moisture supply. That phenomenon has been observed during the past decade, when increased precipitation has entailed soil and air drought decrease. In addition, the shift of precipitation maximum towards the beginning of the growth season reduced seasonal spring drought.
Alongside GPP/NPP, positive EVI trends have prevailed in pine stands and surrounding vegetation communities. An EVI increase has been observed in 23% of the area, with decreases in less than 1% (p < 0.05) (Figure 11). Thereby, gross and net primary productivity increase, together with elevating EVI index values, indicate the “greening” of the Scots pine habitat and forest–steppe communities.
According to climatic models, precipitation in the pine habitat is expected to increase to ca. 560–570 mm by 2100 (scenarios SSP4.5, SSP7.0, and SSP8.5). In addition, air temperatures are expected to rise by +2.7 °C (SSP4.5), +3.6 °C (SSP7.0), and +4.4° C (SSP8.5) [38,39]. Climate aridity, as it is known, is estimated as the difference between precipitation and potential evapotranspiration (PET). We found that elevated temperatures will lead to an increase in PET of 505, 539, and 594 mm by 2100 (according to SSP2-4.5, SSP3-7.0, and SSP5-8.5 scenarios, correspondingly). Presently, the mean annual precipitation and PET were 369 and 533 mm, i.e., the “precipitation deficit” was about 44%. According to all scenarios, that deficit will be between −5% and +5%, i.e., there is expected to be zero deficit of precipitation by the end of the 21st century. Thus, the results obtained for the period of warming restart support the predicted improvement in the Scots pine habitat in its southern range.
Meanwhile, warming leads to an increase in extreme weather events, including periodic severe droughts and severe wildfires that threaten pine forest viability [39]. Scots pine, a pyrophytic species, can survive multiple surface fires and live for hundreds of years (Figure 14a and Figure A1). The studied relict pine forests successfully survived wildfires throughout the Holocene period. A sufficient number of mother-trees, a positive GI, and viable and numerous seedlings in the burns indicate Scots pine resilience to observed warming. However, unprecedented warming is accompanied by an unprecedented increase in burning rate. Thus, since the warming restart, the fire-return interval has been shortened to 3 ± 2 years, which leads to severe damage to pine seedlings and afforestation. That impairs pine forest preservation under the current fire regime. Meanwhile, it has been reported that the burning rate in some parts of Siberian taiga has decreased during the past decade due to an increase in precipitation [21]. That also might occur in the southern Scots pine habitat.
In general, fire regimes, in combination with moisture supply, are major determinants of the southern pine forest preservation. Firefighting is a key factor in pine survival. It is worth noting that during the period of intense fire suppression (1950s–1980s), the FRI in pine stands reached its historical maximum (about 30 y). Presently, a high burning rate, combined with poor fire-suppression management, is a serious threat to the preservation of relict pine forests.

5. Conclusions

We studied the influence of changing hydrothermal and fire regimes on relict Pinus sylvestris forests at the southern limit of their range in Central Siberia. We found that since the warming restart in the 2000s, the growth index of pine trees has exceeded its historical values due to a decrease in soil and air drought. Despite periodic fires, tree growth and seedling density in burned areas (ca. 10,000 per hectare) are potentially sufficient for the post-fire recovery of pine forests. Since the warming restart, the GPP, NPP, and EVI index in pine forests and the surrounding bush–steppe communities have been increasing, indicating the greening of the pine habitat. Thus, the increase in air temperature in synergy with the decrease in soil and air drought has stimulated tree and vegetation growth. Results obtained support the predicted improvement of the vegetation habitat in the Siberian South. However, warming has stimulated an increase in the frequency of wildfires that threaten seedling survival as well as pine stand viability. Therefore, under the current fire regime, the preservation of relict pine forests at its southern edge depends on a combination of moisture supply, fire frequency, and fire suppression.

Author Contributions

Conceptualization, V.I.K. and I.A.P.; methodology, V.I.K. and I.A.P.; validation, V.I.K., I.A.P., S.T.I. and A.S.S.; formal analysis, I.A.P., A.S.S. and S.T.I.; investigation, V.I.K., I.A.P., S.T.I. and A.S.S.; resources, A.S.S., S.T.I. and S.O.O.; data Curation, I.A.P., A.S.S. and S.T.I.; writing—original draft preparation, V.I.K. and I.A.P.; visualization, I.A.P., A.S.S. and S.T.I.; supervision, V.I.K. and I.A.P.; project administration, V.I.K.; funding acquisition, V.I.K. All authors have read and agreed to the published version of the manuscript.

Funding

The research was funded by the Basic Project of the Federal Research Center of the Scientific Center, no. FWES-2024-0023.

Data Availability Statement

The data presented in this study are openly available: climate data in https://cds.climate.copernicus.eu/datasets (accessed on 15 February 2025); MODIS MCD64A1 and MOD17A3HGF in https://search.earthdata.nasa.gov (accessed on 15 February 2025); FIRMS in https://firms.modaps.eosdis.nasa.gov (accessed on 15 February 2025). Landsat data in https://earthexplorer.usgs.gov (accessed on 15 February 2025).

Conflicts of Interest

The authors declare no conflicts of interest.

Abbreviations

The following abbreviations are used in this manuscript:
FRIFire-return interval
GIGrowth index
GPPGross primary production
NPPNet primary production
PETPotential evapotranspiration
SSPShared Socioeconomic Pathway
scPDSISelf-Calibrated Palmer Drought Severity Index
SPEIStandardized Precipitation Evaporation Index
TPTest plot
WMOWorld Meteorological Organization

Appendix A

Figure A1. A wood sampling by use of an increment borer.
Forests 16 00819 g0a1
Figure A2. Pine seedlings are often located within mother tree shadows.
Forests 16 00819 g0a2

References

  1. Anderegg, W.R.L.; Wu, C.; Acil, N.; Carvalhais, N.; Pugh, T.A.M.; Sadler, J.P.; Seidl, R.A. Climate risk analysis of Earth’s forests in the 21st century. Science 2022, 377, 1099–1103. [Google Scholar] [CrossRef] [PubMed]
  2. Boonman, C.C.F.; Serra-Diaz, J.M.; Hoeks, S.; Guo, W.-Y.; Enquist, B.J.; Maitner, B.; Malhi, Y.; Merow, C.; Buitenwerf, R.; Svenning, J.-C. More than 17,000 tree species are at risk from rapid global change. Nat. Commun. 2024, 15, 166. [Google Scholar] [CrossRef] [PubMed]
  3. Millar, C.I.; Stephenson, N.L. Temperate forest health in an era of emerging megadisturbance. Science 2015, 349, 823–826. [Google Scholar] [CrossRef]
  4. Coogan, S.C.P.; Robinne, F.-N.; Jain, P.; Flannigan, M.D. Scientists’ warning on wildfire—A Canadian perspective. Can. J. For. Res. 2019, 49, 1015–1023. [Google Scholar] [CrossRef]
  5. Tymstra, C.; Stocks, B.; Cai, X.; Flannigan, M. Wildfire management in Canada: Review, challenges and opportunities. Prog. Disaster Sci. 2020, 5, 100045. [Google Scholar] [CrossRef]
  6. Neumann, M.; Mues, V.; Moreno, A.; Hasenauer, H.; Seidl, R. Climate variability drives recent tree mortality in Europe. Glob. Change Biol. 2017, 23, 4788–4797. [Google Scholar] [CrossRef]
  7. Goulden, M.L.; Bales, R.C. California forest die-off linked to multi-year deep soil drying in 2012–2015 drought. Nat. Geosci. 2019, 12, 632–637. [Google Scholar] [CrossRef]
  8. Harvey, J.E.; Batllori, E.; Lloret, F.; Aakala, T.; Anderegg, W.R.L.; Aynekulu, E.; Bendixsen, D.P.; Bentouati, A.; Bigler, C.; Burk, C.J.; et al. Forest and woodland replacement patterns following drought-related mortality. Proc. Natl. Acad. Sci. USA 2020, 117, 29720–29729. [Google Scholar]
  9. Davis, F.W.; Parkinson, A.-M.; Moritz, M.A.; Isaac, W.; Park, C.M.; D’Antonio, C.M. Increasing vulnerability of an endemic Mediterranean-climate conifer to changing climate and fire regime. Front. For. Glob. Change 2025, 8, 1516623. [Google Scholar] [CrossRef]
  10. Verhoeven, D.; de Boer, W.F.; Henkens, R.J.H.G.; Sass-Klaassena, U.G.W. Water availability as driver of birch mortality in Hustai National Park, Mongolia. Dendrochronologia 2018, 49, 127–133. [Google Scholar] [CrossRef]
  11. Boyd, M.A.; Berner, L.T.; Doak, P.; Goetz, S.J.; Rogers, B.M.; Wagner, D.; Walker, X.J.; Mack, M.C. Impacts of climate and insect herbivory on productivity and physiology of trembling aspen (Populus tremuloides) in Alaskan boreal forests. Environ. Res. Lett. 2019, 14, 085010. [Google Scholar] [CrossRef]
  12. Kharuk, V.I.; Im, S.T.; Petrov, I.A.; Dvinskaya, M.L.; Shushpanov, A.S.; Golyukov, A.S. Climate-driven conifer mortality in Siberia. Glob. Ecol. Biogeogr. 2021, 30, 543–556. [Google Scholar] [CrossRef]
  13. Dial, R.J.; Maher, C.T.; Hewitt, R.E.; Sullivan, P.F. Sufficient conditions for rapid range expansion of a boreal conifer. Nature 2022, 608, 546–551. [Google Scholar] [CrossRef] [PubMed]
  14. Kharuk, V.I.; Petrov, I.A.; Im, S.T.; Golyukov, A.S.; Dvinskaya, M.L.; Shushpanov, A.S. Tree Clusters Migration into Alpine Tundra, Siberia. J. Mt. Sci. 2022, 19, 3426–3440. [Google Scholar] [CrossRef]
  15. Buryak, L.V.; Sukhinin, A.I.; Kalenskaya, O.P.; Ponomarev, E.I. Effects of fires in ribbon-like pine forests of southern Siberia. Contemp. Probl. Ecol. 2011, 4, 248–253. [Google Scholar] [CrossRef]
  16. Buryak, L.V.; Kalenskaya, O.P.; Kukavskaya, E.A.; Luzganov, A.G. Zonal and Geographical Features of the Impact of Fires on Forest Formation of Light Coniferous Stands in the South of Siberia; Nauka: Novosibirsk, Russia, 2022. (In Russian) [Google Scholar]
  17. Ivanova, G.A.; Ivanov, V.A.; Kukavskaya, E.A. Periodicity of fires in the forests of the Republic of Tuva. Conifers Boreal Zone 2015, XXXIII, 204–209. (In Russian) [Google Scholar]
  18. Wang, Z.; Huang, J.G.; Ryzhkova, N.; Li, J.; Kryshen, A.; Voronin, V.; Li, R.; Bergeron, Y.; Drobyshev, I. 352 years long fire history of a Siberian boreal forest and its primary driving factor. Glob. Planet. Change 2021, 207, 103653. [Google Scholar] [CrossRef]
  19. Mamet, S.D.; Carissa, D.B.; Andrew, J.T.; Colin, P.L. Shifting global Larix distributions: Northern expansion and southern retraction as species respond to changing climate. J. Biogeogr. 2018, 46, 30–44. [Google Scholar] [CrossRef]
  20. Kharuk, V.I.; Ranson, K.J.; Petrov, I.A.; Dvinskaya, M.L.; Im, S.T.; Golyukov, A.S. Larch (Larix dahurica Turcz) Growth Response to Climate Change in the Siberian Permafrost Zone. Reg. Environ. Change 2019, 19, 233–243. [Google Scholar] [CrossRef]
  21. Kharuk, V.I.; Shvetsov, E.G.; Buryak, L.V.; Golyukov, A.S.; Dvinskaya, M.L.; Petrov, I.A. Wildfires in the Larch Range within Permafrost, Siberia. Fire 2023, 6, 301. [Google Scholar] [CrossRef]
  22. NOAA National Centers for Environmental Information. Climate at a Glance: Global Time Series. 2025. Available online: https://www.ncei.noaa.gov/access/monitoring/climate-at-a-glance/global/time-series (accessed on 21 February 2025).
  23. Holmes, R.L. Computer-assisted quality control in tree-ring dating and measurement. Tree-Ring Bull. 1983, 44, 69–75. [Google Scholar]
  24. Rinn, F.; Tsap, V. 3.6 Reference Manual: Computer Program for Tree-Ring Analysis and Presentation; Frank Rinn Distribution: Heidelberg, Germany, 1996. [Google Scholar]
  25. Speer, J.H. Fundamentals of Tree-Ring Research; University of Arizona Press: Tucson, AZ, USA, 2010. [Google Scholar]
  26. Richards, J.A. Remote Sensing Digital Image Analysis, 6th ed.; Springer: Cham, Switzerland, 2022. [Google Scholar]
  27. Running, S.W.; Zhao, M. User’s Guide Daily GPP and Annual NPP (MOD17A2H/A3H) and Year-End Gap-Filled (MOD17A2HGF/A3HGF) Products NASA Earth Observing System MODIS Land Algorithm (For Collection 6.1). 2021. Available online: https://lpdaac.usgs.gov/documents/972/MOD17_User_Guide_V61.pdf (accessed on 21 March 2025).
  28. Didan, K.; Munoz, A.B. MODIS Vegetation Index User’s Guide (MOD13 Series). Version 3.10 (Collection 6.1); Vegetation Index and Phenology Lab; The University of Arizona: Tucson, AZ, USA, 2019. Available online: https://lpdaac.usgs.gov/documents/621/MOD13_User_Guide_V61.pdf (accessed on 20 March 2024).
  29. Conover, W.J. Practical nonparametric statistics. Wiley series in probability and mathematical statistics. In Applied Probability and Statistics; Wiley: Chichester, UK, 1999. [Google Scholar]
  30. Specialized Arrays for Climate Research. All-Russia Research Institute of Hydrometeorological Information—World Data Center. Available online: http://aisori-m.meteo.ru/waisori/index.xhtml?idata=2 (accessed on 21 March 2025). (In Russian).
  31. Liu, Q.; Yang, S.; Li, S.; Zhang, H.; Zhang, J.; Fan, H. The optimal applications of scPDSI and SPEI in characterizing meteorological drought, agricultural drought and terrestrial water availability on a global scale. Sci. Total Environ. 2024, 952, 175933. [Google Scholar] [CrossRef] [PubMed]
  32. Wells, N.; Goddard, S.; Hayes, M.J. A self-calibrating Palmer Drought Severity Index. J. Clim. 2004, 17, 2335–2351. [Google Scholar] [CrossRef]
  33. Muñoz Sabater, J. ERA5-Land Monthly Averaged Data from 1950 to Present. Copernicus Climate Change Service (C3S) Climate Data Store (CDS). 2019. Available online: https://cds.climate.copernicus.eu/datasets/reanalysis-era5-land-monthly-means?tab=overview (accessed on 21 February 2025).
  34. ERA5-Land: Data Documentation. Available online: https://confluence.ecmwf.int/display/CKB/ERA5-Land (accessed on 11 May 2025).
  35. Beguería, S.; Vicente-Serrano, S.M. SPEI: Calculation of the Standardized Precipitation-Evapotranspiration Index. 2023. Available online: https://github.com/sbegueria/SPEI (accessed on 21 March 2025).
  36. Cailleret, M.; Jansen, S.; Robert, E.M.R.; Desoto, L.; Aakala, T.; Antos, J.A.; Beikircher, B.; Bigler, C.; Bugmann, H.; Caccianiga, M.; et al. A synthesis of radial growth patterns preceding tree mortality. Glob. Change Biol. 2017, 23, 1675–1690. [Google Scholar] [CrossRef]
  37. Petrov, I.A.; Shushpanov, A.S.; Golyukov, A.S.; Dvinskaya, M.L.; Kharuk, V.I. Wildfire Dynamics in Pine Forests of Central Siberia in a Changing Climate. Contemp. Probl. Ecol. 2023, 16, 36–46. [Google Scholar] [CrossRef]
  38. Gutiérrez, J.M.; Jones, R.G.; Narisma, G.T.; Alves, L.M.; Amjad, M.; Gorodetskaya, I.V.; Grose, M.; Klutse, N.A.B.; Krakovska, S.; Li, J.; et al. Atlas. In Climate Change 2021: The Physical Science Basis; Masson-Delmotte, V., Zhai, P., Pirani, A., Connors, S.L., Péan, C., Chen, Y., Godfarb, L., Gomis, M.L., Matthews, J.B.R., Berger, S., et al., Eds.; Contribution of Working Group I to the Sixth Assessment Report of the Intergovernmental Panel on Climate Change; Cambridge University Press: Cambridge, UK; New York, NY, USA, 2021; Interactive Atlas; Available online: http://interactive-atlas.ipcc.ch/ (accessed on 21 March 2025).
  39. IPCC. Climate Change 2023: Synthesis Report; Core Writing Team, Lee, H., Romero, J., Eds.; Contribution of Working Groups I, II and III to the Sixth Assessment Report of the Intergovernmental Panel on Climate Change; IPCC: Geneva, Switzerland, 2023; Available online: https://www.ipcc.ch/report/ar6/syr/downloads/report/IPCC_AR6_SYR_FullVolume.pdf (accessed on 21 March 2025).
Figure 1. Studied pine stand location (1—Biche-Hady, 2—Ulug-Hady, 3—Balgazyn).
Forests 16 00819 g001
Figure 2. Dynamics of the annual and summer temperatures (a) and precipitation (b), summer Palmer (scPDSI) (c), and SPEI (d) drought indexes. The beginning of the summer warming (1985, (a)) coincided with soil drought increase (c) (indicated by the arrows). Precipitation increases in 2010–2023 (b) coincided with soil drought decrease (c). The beginning of air drought (SPEI) decrease (d) shifted to the early dates in comparison with soil drought. Note: an increase in the SPEI and scPDSI indicates a decrease in drought, and vice versa.
Forests 16 00819 g002
Figure 3. Felled trees and post-fire regeneration at the Biche-Hady site (indicated by the arrows on (a,b)). (a,b)—satellite scenes taken in 1999 and 2024, (c)—taken in 2024. Severe surface fire occurred in 1999.
Forests 16 00819 g003
Figure 4. The tree-ring chronology of pine trees at all sites. The maximum GI values in 2019 exceeded their historical values by 1.4 times. The red and green lines indicate mean GI values for the years 1985–2009 (0.83 ± 0.11) and 2010–2023 (1.35 ± 0.20), respectively. “Green” and “red” periods are used in further dendroclimatic analysis. The gray bars indicate a confidence level of p < 0.05.
Forests 16 00819 g004
Figure 5. Spearman’s correlations of GI with temperature (a), precipitation (b), scPDSI (c), and SPEI (d). The red and green lines indicate p-levels for 1985–2009 and 2010–2023, respectively. Dashed and solid lines corresponded to p < 0.1 and p < 0.05.
Forests 16 00819 g005
Figure 6. The difference (delta) between precipitations in 2010–2023 and 1985–2009. The maximum precipitation shifted to early dates, i.e., precipitation increased in April–July and decreased in August–September. Precipitation during the cold period (October–February) did not change.
Forests 16 00819 g006
Figure 7. The tree GI positively correlated with the previous year’s (August–September) soil moisture content. That dependence was higher during the period of low precipitation (a) compared to the period with increased precipitation (b).
Forests 16 00819 g007
Figure 8. Averaged GPP/NPP dynamics throughout all sites. Since the warming restart, both GPP and NPP have shown a strong increase. The arrows indicate the impact of severe fires on the GPP/NPP.
Forests 16 00819 g008
Figure 9. Vegetation GPP (a) and NPP (b) trends. Both the GPP and NPP in relict pine forests (1–3) and in bush–steppe are increasing (p < 0.05). Positive GPP and NPP trends were observed in 81% and 88% of the areas, respectively. Negative ones were observed in less than 1% of the area. Period: 2001–2024. Elevations above 1000 m a.s.l. are indicated by gray. Annual GPP and NPP data were extracted from the MODIS MOD17A3HGF product [27]. Trends were estimated using the Theil–Sen algorithm [28]. Sites: 1—Biche-Hady, 2—Ulug-Hady, 3—Balgazyn.
Forests 16 00819 g009
Figure 10. The difference (delta) between vegetation GPP (a) and NPP (b) values during 2001–2009 and 2010–2024. The positive delta of GPP and NPP occurred in 82% and 93% of the area, respectively. Negative ones were observed in <1% of the area (p < 0.05). Elevations above 1000 m are indicated by gray. Annual GPP and NPP data were extracted from the MODIS MOD17A3HGF product [27]. Differences were estimated using the Mann–Whitney U-test. Sites: 1—Biche-Hady, 2—Ulug-Hady, 3—Balgazyn.
Forests 16 00819 g010
Figure 11. (a) Positive EVI trends were observed in pine forests (1–3) and in the surrounding bush–steppe (p < 0.05). Positive and negative trends were observed in 23% and 1% of the area, respectively. (b) The difference (delta) between EVI values during (2001–2009) and (2010–2024). The positive and negative delta occurred in 22% and <1% of the area, respectively. Trends were estimated using the Theil–Sen algorithm [28]. Differences were estimated using the Mann–Whitney U-test. Period: 2001–2024. Elevations > 1000 m a.s.l. are indicated by gray. Annual EVI data were extracted from the MODIS MOD13Q1 product [29].
Forests 16 00819 g011
Figure 12. The growth index (GI) of pine trees regressions vs GPP and NPP (mean values for all sites).
Forests 16 00819 g012
Figure 13. The dynamics of burned areas caused by “single” and “multiple” (i.e., repeated) fires. The frequency of fires was maximal in the first decade of the 21st century, followed by saturation. Data were obtained for all sites.
Forests 16 00819 g013
Figure 14. (a) Scots pine stump with multiple burns, and (b) the GI chronology with fire dates. (c) The pine GI before (negative values) and after (positive values) the fire (date of fire marked by “0” and arrow). (d) The fire-return intervals dynamics (based on the dendrochronology and Landsat data). The presented data referred to a fragment of the Ulug-Hady forest.
Forests 16 00819 g014
Figure 15. A number of viable seedlings (7000–10,000/ha) is potentially sufficient for successful post-fire pine recovery. The photo was taken at the Biche-Hady site.
Forests 16 00819 g015
Table 1. Study pine stands inventory data.
SitesCoordinates Number of Trees, n/haAge, yHeight, mDiameter, cmSeedlings, Thousands/haCrown Closure
Balgazyn51° 02′/95° 09′950106 ± 6143070.6
Ulug-Hady51° 10′/94° 49′150119 ± 25133380.3
Biche-Hady51° 10′/94° 47′15094 ± 71838100.3
Disclaimer/Publisher’s Note: The statements, opinions and data contained in all publications are solely those of the individual author(s) and contributor(s) and not of MDPI and/or the editor(s). MDPI and/or the editor(s) disclaim responsibility for any injury to people or property resulting from any ideas, methods, instructions or products referred to in the content.

