Article

Water Balance in an Atlantic Forest Remnant: Focus on Representative Tree Species

by
Adérito C. Cau
1,
José A. Junqueira Junior
2,
Alejandra B. Vega
1,
Severino J. Macôo
1,
André F. Rodrigues
3,
Marcela C. N. S. Terra
4,
Li Guo
5 and
Carlos R. Mello
1,*
1
Water Resources Department, School of Engineering, Federal University of Lavras, CP 3037, Lavras 37200-900, MG, Brazil
2
Instituto Federal do Sudeste de Minas Gerais, Campus Bom Sucesso, Bom Sucesso 37220-000, MG, Brazil
3
Department of Hydraulics and Water Resources, School of Engineering, Federal University of Minas Gerais, CP 6627, Belo Horizonte 31270-901, MG, Brazil
4
Forest Engineering Department, Federal University of São João del Rei, CP 56, São João Del Rei 35701-970, MG, Brazil
5
State Key Laboratory of Hydraulics and Mountain River Engineering, College of Water Resource and Hydropower, Sichuan University, Chengdu 610065, China
*
Author to whom correspondence should be addressed.
Forests 2025, 16(5), 812; https://doi.org/10.3390/f16050812
Submission received: 29 March 2025 / Revised: 7 May 2025 / Accepted: 9 May 2025 / Published: 13 May 2025
(This article belongs to the Section Forest Hydrology)

Abstract

:
The Atlantic Forest has undergone deforestation and prolonged droughts, affecting ecosystem services. This study assesses the water balance using hydrological observations from representative tree species within a Montane Semideciduous Seasonal Forest (MF) remnant. Gross precipitation (GP), canopy interception (CI), and effective precipitation (EP = Throughfall + Stemflow) were recorded daily, and soil moisture was measured down to 1.80 m every two days during the dry period of the 2023/2024 hydrological year. Additionally, aboveground biomass (AGB), fresh root biomass (BR), and soil hydrological properties in the soil profile were obtained to support the water balance results. The highest EP values were recorded in Miconia willdenowii, while the lowest were in Xylopia brasiliensis. Root zone water storage exhibited a declining trend, with the highest values in Miconia willdenowii. ET remained low, mainly in April, July, and September, with Miconia willdenowii and Copaifera langsdorffii showing the highest values, and AGB correlated with CI and ET. The dynamic of this ecosystem is apparent in the temporal variations (CVt) of soil moisture, influenced by EP and ET. The greatest variability was recorded in the surface layer (0–20 cm), stabilizing with depth, especially below 120 cm. The Temporal Stability Index (TSI) of soil water storage indicated greater stability in Blepharocalyx salicifolius. This study highlights the significance of soil water storage and ET in a tropical forest ecosystem, particularly under drought conditions, suggesting potential species that may be more effective in recovering degraded areas.

1. Introduction

The water balance in forests is essential for understanding the role of vegetation in the soil–vegetation–atmosphere continuum. This dynamic interaction is sustained through a complex, non-static process characterized by elasticity and numerous interactions within this continuum system [1]. Recognizing the importance of water balance is relevant because forest provides various ecosystem services, especially in regulating the hydrological cycle, reducing surface runoff, enhancing percolation and groundwater recharge, and facilitating nutrient cycling [2].
The Atlantic Forest is one of Brazil’s major forest formations and is recognized globally as a biosphere reserve due to its water yield capacity and the diversity of endemic species [3]. This biome is fundamental for maintaining hydrological flows during the dry season and regulating peak flows in river systems during the wet season [4,5]. Since 2014, the Atlantic Forest in southeastern Brazil has experienced prolonged droughts [6], posing a significant threat to the balance of this ecosystem. In this region, the Montane Seasonal Semideciduous Forest (MSSF) predominates, occurring in areas at altitudes exceeding 500 m.
Several studies have examined remnants of the MSSF in Brazil to understand the spatial and temporal behavior of soil moisture [7,8], the influence of vegetation on water inputs through canopy interception [4,9], and evapotranspiration [6,10] under drought conditions. However, these studies have focused on the forest site, failing to differentiate how specific species may affect the water balance. This differentiation is essential for establishing plans to restore degraded areas within the Atlantic Forest ecosystem. Therefore, linking hydrological aspects, particularly soil moisture, with the root concentration of forest species can enhance our understanding of the trees’ role in water ecosystem services in this biome.
Human activities in Southeast Brazil have led to 82% of the endemic species in the Atlantic Forest being threatened with extinction [11]. Deforestation, fragmentation, bushfire, and logging have severely impacted ecosystem services provided by the Atlantic Forest. Understanding how species respond to water balance can potentially help conservation strategies [12,13]. The MSSF hosts a variety of tree species, with up to 50% being deciduous, which helps them survive droughts by absorbing water from deeper soil layers [14]. Therefore, it is fundamental to deepen our understanding of how water storage varies within the soil profile and its relation to root biomass and soil hydrological properties. Additionally, it is important to consider other interrelated variables, such as effective precipitation (EP; rainfall that reaches the forest floor), aboveground biomass (AGB), root biomass (BR), and canopy interception (CI), to comprehend how much water trees lose through evapotranspiration (ET), especially during the one of the hottest dry seasons in the last 120 years. This would enhance our understanding of the connections between soil, water, and tree species under different water availability conditions, helping the adaptability of these species under extreme weather, which is the trending for the next decade in the region studied.
Consequently, the objectives of this study are to (i) determine the water balance of representative species from a remnant of the MSSF during the dry period, considering soil water storage at a depth of 1.80 m, and (ii) assess the temporal variation of soil moisture and the stability of soil water storage considering a 1.80 m soil profile.

2. Materials and Methods

2.1. Location and General Aspects of the Study Area

The study area is in southeastern Brazil, in Minas Gerais state, at coordinates 21°13′40″S and 44°57′50″W, with an average altitude of 925 m [7]. It is a forest remnant classified as a Montane Semideciduous Stationary Forest (MSSF), which is one of the formations of the Atlantic Forest [13]. The remnant covers an area of 6.35 ha and is surrounded by agroforestry and urban areas (Figure 1). The terrain is gently undulating, with slopes ranging from 5 to 15% [7]. The soil, a dystrophic red Latosol, has a granular structure and high porosity, providing high water infiltration capacity [7].
The region’s Köppen climate classification is Cwa, i.e., a subtropical climate with rainfall concentrated in spring and summer (October to March) and two well-defined seasons [7]. The average annual rainfall is 1383.4 mm, with 1186 mm (85.7%) occurring between October and March (rainy season) and 197.4 mm (14.3%) between April and September (dry season). The average annual potential evapotranspiration is 1286.6 mm, ranging from 292.4 mm in January to 9.5 mm in July. The average annual temperature is 20.6 °C, ranging from 15.7 °C in July to 27.5 °C in February, and the average annual air humidity is 71.0% [15]. The MSSF exhibits a semi-deciduous nature, meaning up to 50% of the trees shed their leaves during the dry season [13]. The most recent forest inventory conducted in 2017, reported a tree density of 1021 trees/ha and a basal area of 120.85 m2 ha−1 [4]. The most abundant species are Copaifera langsdorffii (Desf) (Fabaceae) (14.3%), Xylopia brasiliensis (Spreng.) (Annonaceae) (13.7%), and Miconia willdenowii (Klotzsch ex Naudin) (Melastomataceae) (5.5%) [4]. These species exhibit a higher population density in southeastern Brazil, indicating their significance on local and regional scales.
Since 2012, hydrological monitoring has been set at MSSF, focusing on weather conditions above and below the canopy, gross precipitation, throughfall, stemflow, and soil moisture. Two Hobbo weather stations are installed at the site, one below and the other above the canopy on a 22 m high meteorological tower, to monitor precipitation, wind speed and direction, atmospheric pressure, net radiation, and air temperature/relative humidity at hourly intervals.

2.2. Hydrological Monitoring Sets for This Study

Four species were selected from the forest inventory and the existing hydrological sets for this study. The selection criteria included the number of individuals present in the forest (Table 1), average Diameter at Breast Height (DBH), and tree height (H), and their distribution in the forest, specifically those commonly found in this type of ecosystem and canopy structure. Thus, these sites are representative of the studied forest, covering species, vegetative indicators, and canopy structure. Limitations regarding soil moisture monitoring equipment led to some relevant species not being monitored, including replicate samples.
A new monitoring set was Installe” for each tree selected, including a Ville de Paris rain gauge, a stemflow collection apparatus, and soil moisture measurement tube (Figure 1). The rain gauge, with an open area of ~400 cm2, was installed 150 cm above the forest floor to prevent splash-in. The stemflow apparatus, consisting of an open hose spirally nailed to the tree trunk, directs water into a 30 L container. Three root sampling systems were also implemented near the monitored trees (Figure 2).
Precipitation was collected at least four hours after each rainfall event or the next morning for late afternoon events to ensure canopy drying and avoid overlapping events [4]. The effective precipitation (EP, mm) that reaches the soil is calculated from stemflow (SF, mm) and throughfall (TF, mm) in each monitoring plot:
EP = TF + SF
Canopy rainfall interception (CI, mm) was determined as follows:
CI = GP EP
where GP is the gross (external) precipitation (mm), monitored in three locations using the Ville de Paris pluviometer model (Figure 1).

2.3. Soil Moisture, Soil Water Storage, and Water Balance

Soil moisture data (θ) were systematically collected every two days during the dry season (April–September) of the 2023/2024 hydrological year at the depths of 20, 40, 60, 100, 140, and 180 cm. The TECANAT PC access tube was employed for measuring soil moisture using the TRIME-PICO (IMKO GmbH, Ettlingen, Germany) sensor, with readings conducted manually. This approach did not substantially impact the results as measurements were made during the dry season, when soil moisture changes minimally and it is considered insignificant as the evapotranspiration is the most relevant process that affects the soil moisture, being slow in this season of the year. The monitoring depth encompassed most of the effective root zone for water absorption; observations from the root sampling campaign indicated that roots predominantly exist up to 180 cm in the soil profile. Soil water storage (SWS) and its consecutive variation were calculated as follows:
SWS = i = 1 n θ i + θ i + 1 2 h
Δ W = SWS t SWS t 1
where i is the soil moisture monitoring depth, n is the number of depths (i.e., 20, 40, 60, 100, 140, and 180 cm), θ is the soil moisture (cm3·cm−3), h is the thickness of the layer between i and i + 1 (mm), SWS(t) is the storage measured at time t, and SWS(t – 1) is the storage measured at time t – 1.
The water balance for each tree was conducted during the dry season when deep percolation (below 180 cm) and surface runoff were negligible [6]. Thus, the response variable of the water balance is evapotranspiration (ETWB):
ET WB Δ t = EP   Δ W Δ t
The TRIME-PICO sensor was calibrated using field observation [8]. To address missing or atypical SWS values (e.g., <0.1 m3m−3) [8] during the study period, values between consecutive readings were averaged, as SWS decreases slightly due to evapotranspiration in the dry season. Figure 2 shows photos of the instrumentation used in this study.

2.4. Quantification of Root Weight Distribution in the Soil Profile

The monolith sampling method was employed to quantify root weight (RW) [16]. This method is particularly appropriate for regions lacking biomass data, such as native forests, and involves the collection of soil blocks (monoliths). Three monoliths were collected near the hydrological monitoring points (Figure 1). For statistical analysis, we used the average and the number of monoliths (three) as replicates. Each extracted monolith measured 25 cm × 25 cm × 180 cm and was segmented into six geometric profiles (layers): 0–20 cm, 20–40 cm, 40–60 cm, 60–100 cm, 100–140 cm, and 140–180 cm.
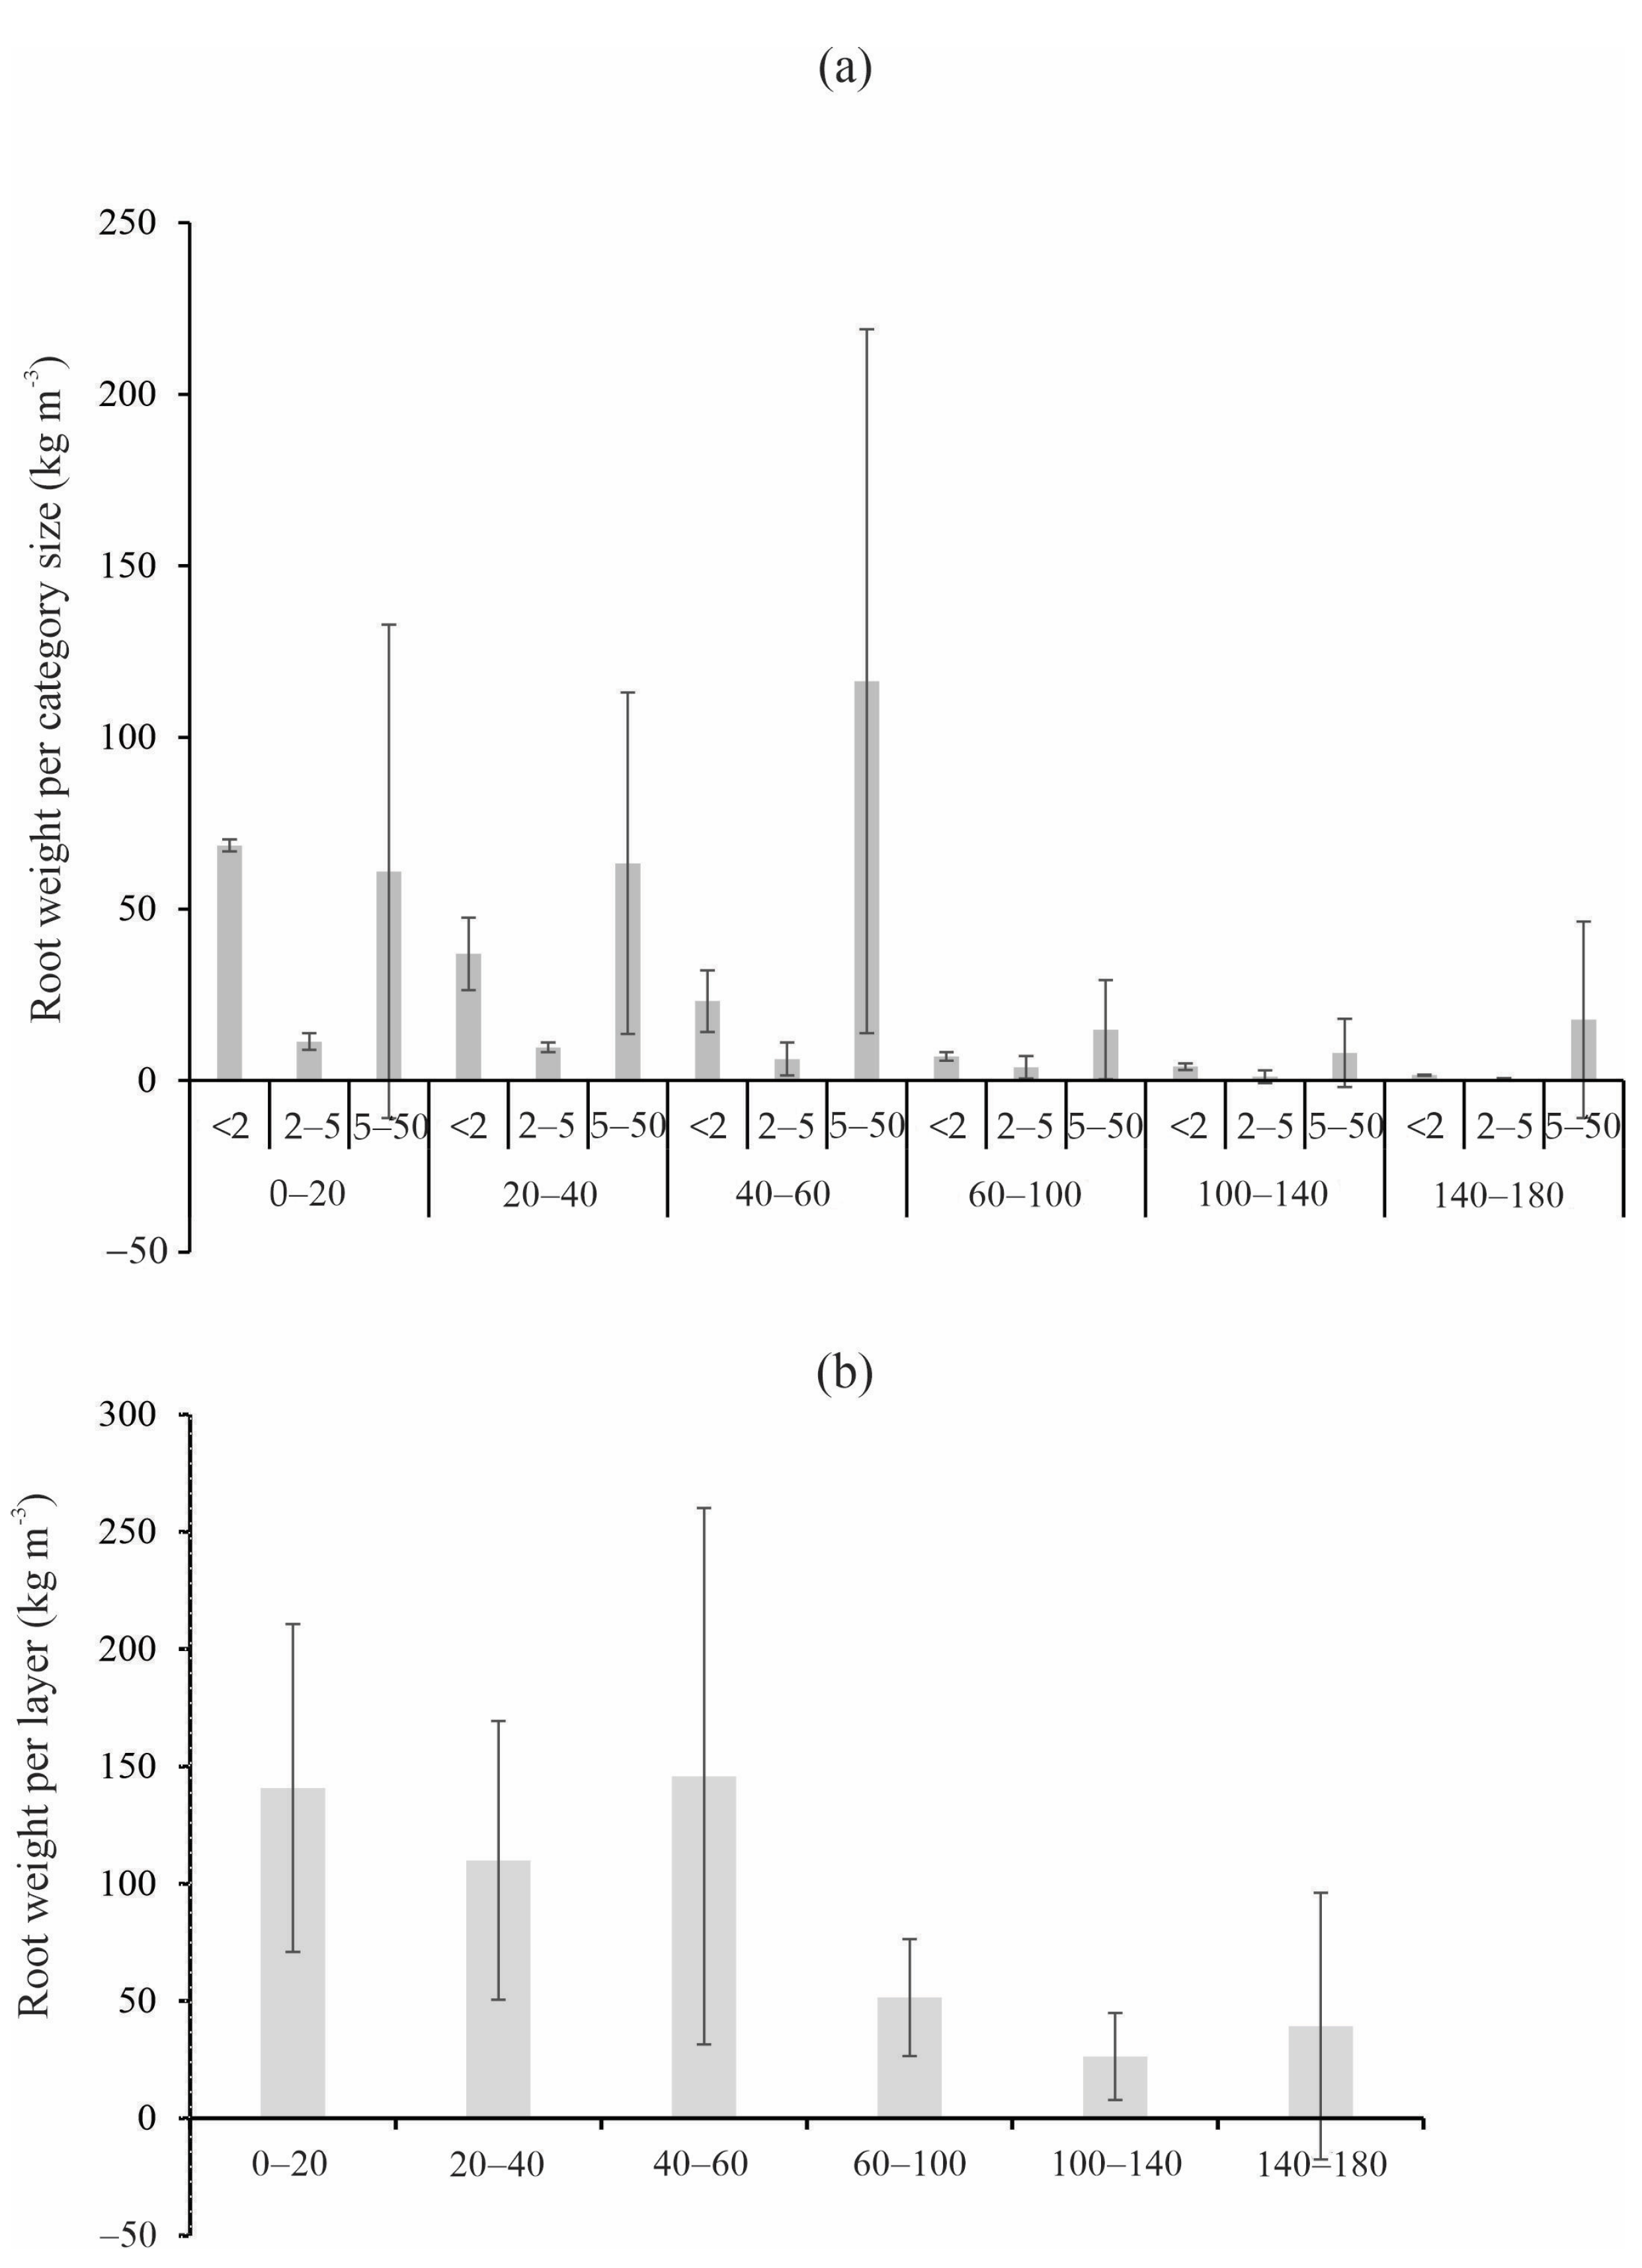
The soil and roots were weighed, with detachable roots separated by hand. Remaining roots were extracted by submerging the soil in water to separate the remaining and less detachable roots, using a set of three overlapping sieves: the top one with a 5 mm mesh, the middle one with 3 mm, and the bottom one with 1 mm [16,17,18]. Four categories were considered to classify the roots by diameter [16]: fine roots (<2 mm), fine intermediate roots (2–5 mm), thick-intermediate roots (5–50 mm), and thick roots (>50 mm) (Figure 3b).

2.5. Estimating Aboveground Biomass

To estimate the aboveground biomass (AGB) of representative trees, a pantropical model [19] was used as it performs better in tropical and subtropical forests and bioclimatic conditions, including the Brazilian Atlantic Forest. Diameter measurements at breast height—DHB (cm) and tree height—H (m) were taken in 2024 to capture variations in volume among trees.
AGB est = 0.0673 · ρ · DBH 2 · H 0.976
where ρ (g cm−3) is the wood density used to convert volume into dry mass, D is the diameter at breast height—DBH (cm), and H is the height of the trees (cm).

2.6. Characterization of the Saturated Soil Hydraulic Conductivity (Ksat)

Soil samples were collected from the same locations as the root samples at depths of 0–20 cm, 20–40 cm, 40–60 cm, 60–100 cm, 100–140 cm, and 140–180 cm. Three replicates were taken and analyzed for saturated soil hydraulic conductivity (Ksat) in laboratory conditions [20].

2.7. Data Analysis

Analysis of variance and Tukey’s test (prob < 0.05) were carried out to compare the root distribution between the soil layers according to their categories. The Randomized Complete Block Design was used in the experimental arrangement of subdivided plots, where the layer was considered the main factor and the root categories as the subfactor.

3. Results and Discussion

3.1. Distribution of the Fresh Root Biomass

Figure 4 illustrates the distribution of roots by diameter category across each soil layer up to a depth of 180 cm. The averages of the monoliths were taken, and the number of monoliths was treated as replicates for statistical analysis. The variance analysis revealed no significant interaction between the root sampling layers and the diameter categories, regarding the difference in diameter categories throughout the layers. This indicates that the concentration of roots per category does not necessarily depend on the soil profile layer. Conversely, significant (p < 0.05) interactions between diameter categories within the same layer were observed. The Tukey test identified a statistical difference between the averages of these categories, suggesting substantial variations in root distribution across different diameters.
The root weight values identified for the first three layers exceed 100 kg m−3, particularly in the 40–60 cm layer (approximately 150 kg m−3), indicating a high concentration of roots down to 60 cm.
There is a clear vertical distribution of root weight, with the highest concentrations in the 0–20 cm and 40–60 cm layers, followed by a decrease with depth. The greatest root concentration is found in the 0–20 cm, 20–40 cm, and 40–60 cm layers, with values exceeding 100 kg m−3. In deeper layers (60–100 cm, 100–140 cm, and 140–180 cm), values are below 30 kg m−3. The distribution of roots in the soil profile reflects the availability of water and nutrients, particularly in the shallow layers [16,21,22]. These values of root weight include the mass of roots, water, and nutrients, meaning they are not dry. This aspect is irrelevant as we seek to understand the water balance and possible connections with root distribution.
By distributing the roots according to diameter category [16], the largest root weights were found in the category of intermediate roots (5–50 mm) across all layers (>57%), except for the 0–20 cm layer, where thin roots (<2 mm) were predominant (48.7%). The fine intermediate roots (2–5 mm) exhibited lower values in all layers. The finest roots (<2 mm) are responsible for absorbing water and cycling carbon and nutrients from litter decomposition [16,21,22], and these roots are generally concentrated in the surface soil layers [23]. Conversely, the thicker roots are responsible for supporting and anchoring the plant to the soil, conducting solutes, and providing stability and expansion of the system; they are typically found in the deeper layers [16,18,24]. Generally, thicker roots contribute less to nutrient cycling and water absorption than fine roots [25]. However, trees of different species, sizes, and ages exhibit varying root distributions. Larger roots are responsible for greater concentration in deeper layers, facilitating water uptake compared to smaller roots that mainly rely on shallow layers [26]. The MSSF heterogeneity and seasonal characteristics partially explain the distribution of roots up to the 160–180 cm layer. The development of fine roots in depth may indicate the adaptation of larger trees to wetting–drying cycles to access water from deeper layers during dry periods, thereby increasing the forest’s resilience to prolonged droughts.

3.2. Water Balance

The series illustrated in Figure 5a, segmented by month, demonstrates the temporal dynamics of the water balance elements (EP, SWS, and CI) and ΔW from April to September 2023 for each tree studied. During the monitoring period, gross precipitation (GP) amounted to 250.7 mm, with the highest values recorded in April and September, ranging from 23.1 mm to 45.3 mm and 36.9 mm to 50.5 mm, respectively, across all the monitored trees. The average accumulated effective rainfall (EP) was approximately 188.2 mm from ten rain events. This average EP is close to that observed by Ref. [4] in the same remnant but using 32 observation plots during the dry periods of the 2012/13 and 2013/14 hydrological years, which were 183 mm and 189 mm, respectively. Canopy interception (CI) mirrored the temporal variability of EP, with an average of approximately 50 mm. This value corresponds to 19.94% of GP, which exceeds the values obtained by Ref. [4] reported for the dry period. The main factors contributing to this discrepancy are the lower rainfall intensity and fewer precipitation events observed during this study.
The highest monthly GP during the studied period (April, August, and September) corresponded with the highest EP and CI (Figure 5a), as well as the most significant variability (Figure 5b). EP varied across the months, ranging from 3.2 to 45.1 mm in April, 5.4 to 23.0 mm in August, and 23.5 to 50.2 mm in September. Following the trend of EP, CI reached 17.6 mm in April (M. willdenowi), 14.4 mm in August (M. willdenowi), and 20.3 mm in September (X. brasilienses). Conversely, May, June, and July recorded the lowest EP due to the corresponding lowest GP (Figure 5a). In June, the average observed EP was 4.08 mm, while for CI, it was 1.3 mm. These results are tied to the intra-annual precipitation variability, as May, June, July, and August are historically the driest months in the study region [6,7,8]. Xylopia brasiliensis exhibited a monthly EP of up to 35.0 mm, and a maximum CI of 20.3 mm, yielding the highest CI/GP ratio during the studied period at 40%. M. willdenowii showed EP values varying from 3.3 mm to 38.8 mm, with a maximum CI of 17.6 mm and a CI/GP ratio of 28%. B. salicifolius and C. langsdorffii exhibited EP values ranging from 3.5 mm to 44.9 mm and 3.6 mm to 38.6 mm, respectively, with maximum CI values of 12.4 mm and 13.4 mm, leading to CI/GP ratios of 20% and 28%, respectively. Overall, the species studied display irregular behavior regarding EP and CI, which can be associated with the canopy’s architecture and the forest’s specific characteristics [27,28,29,30].
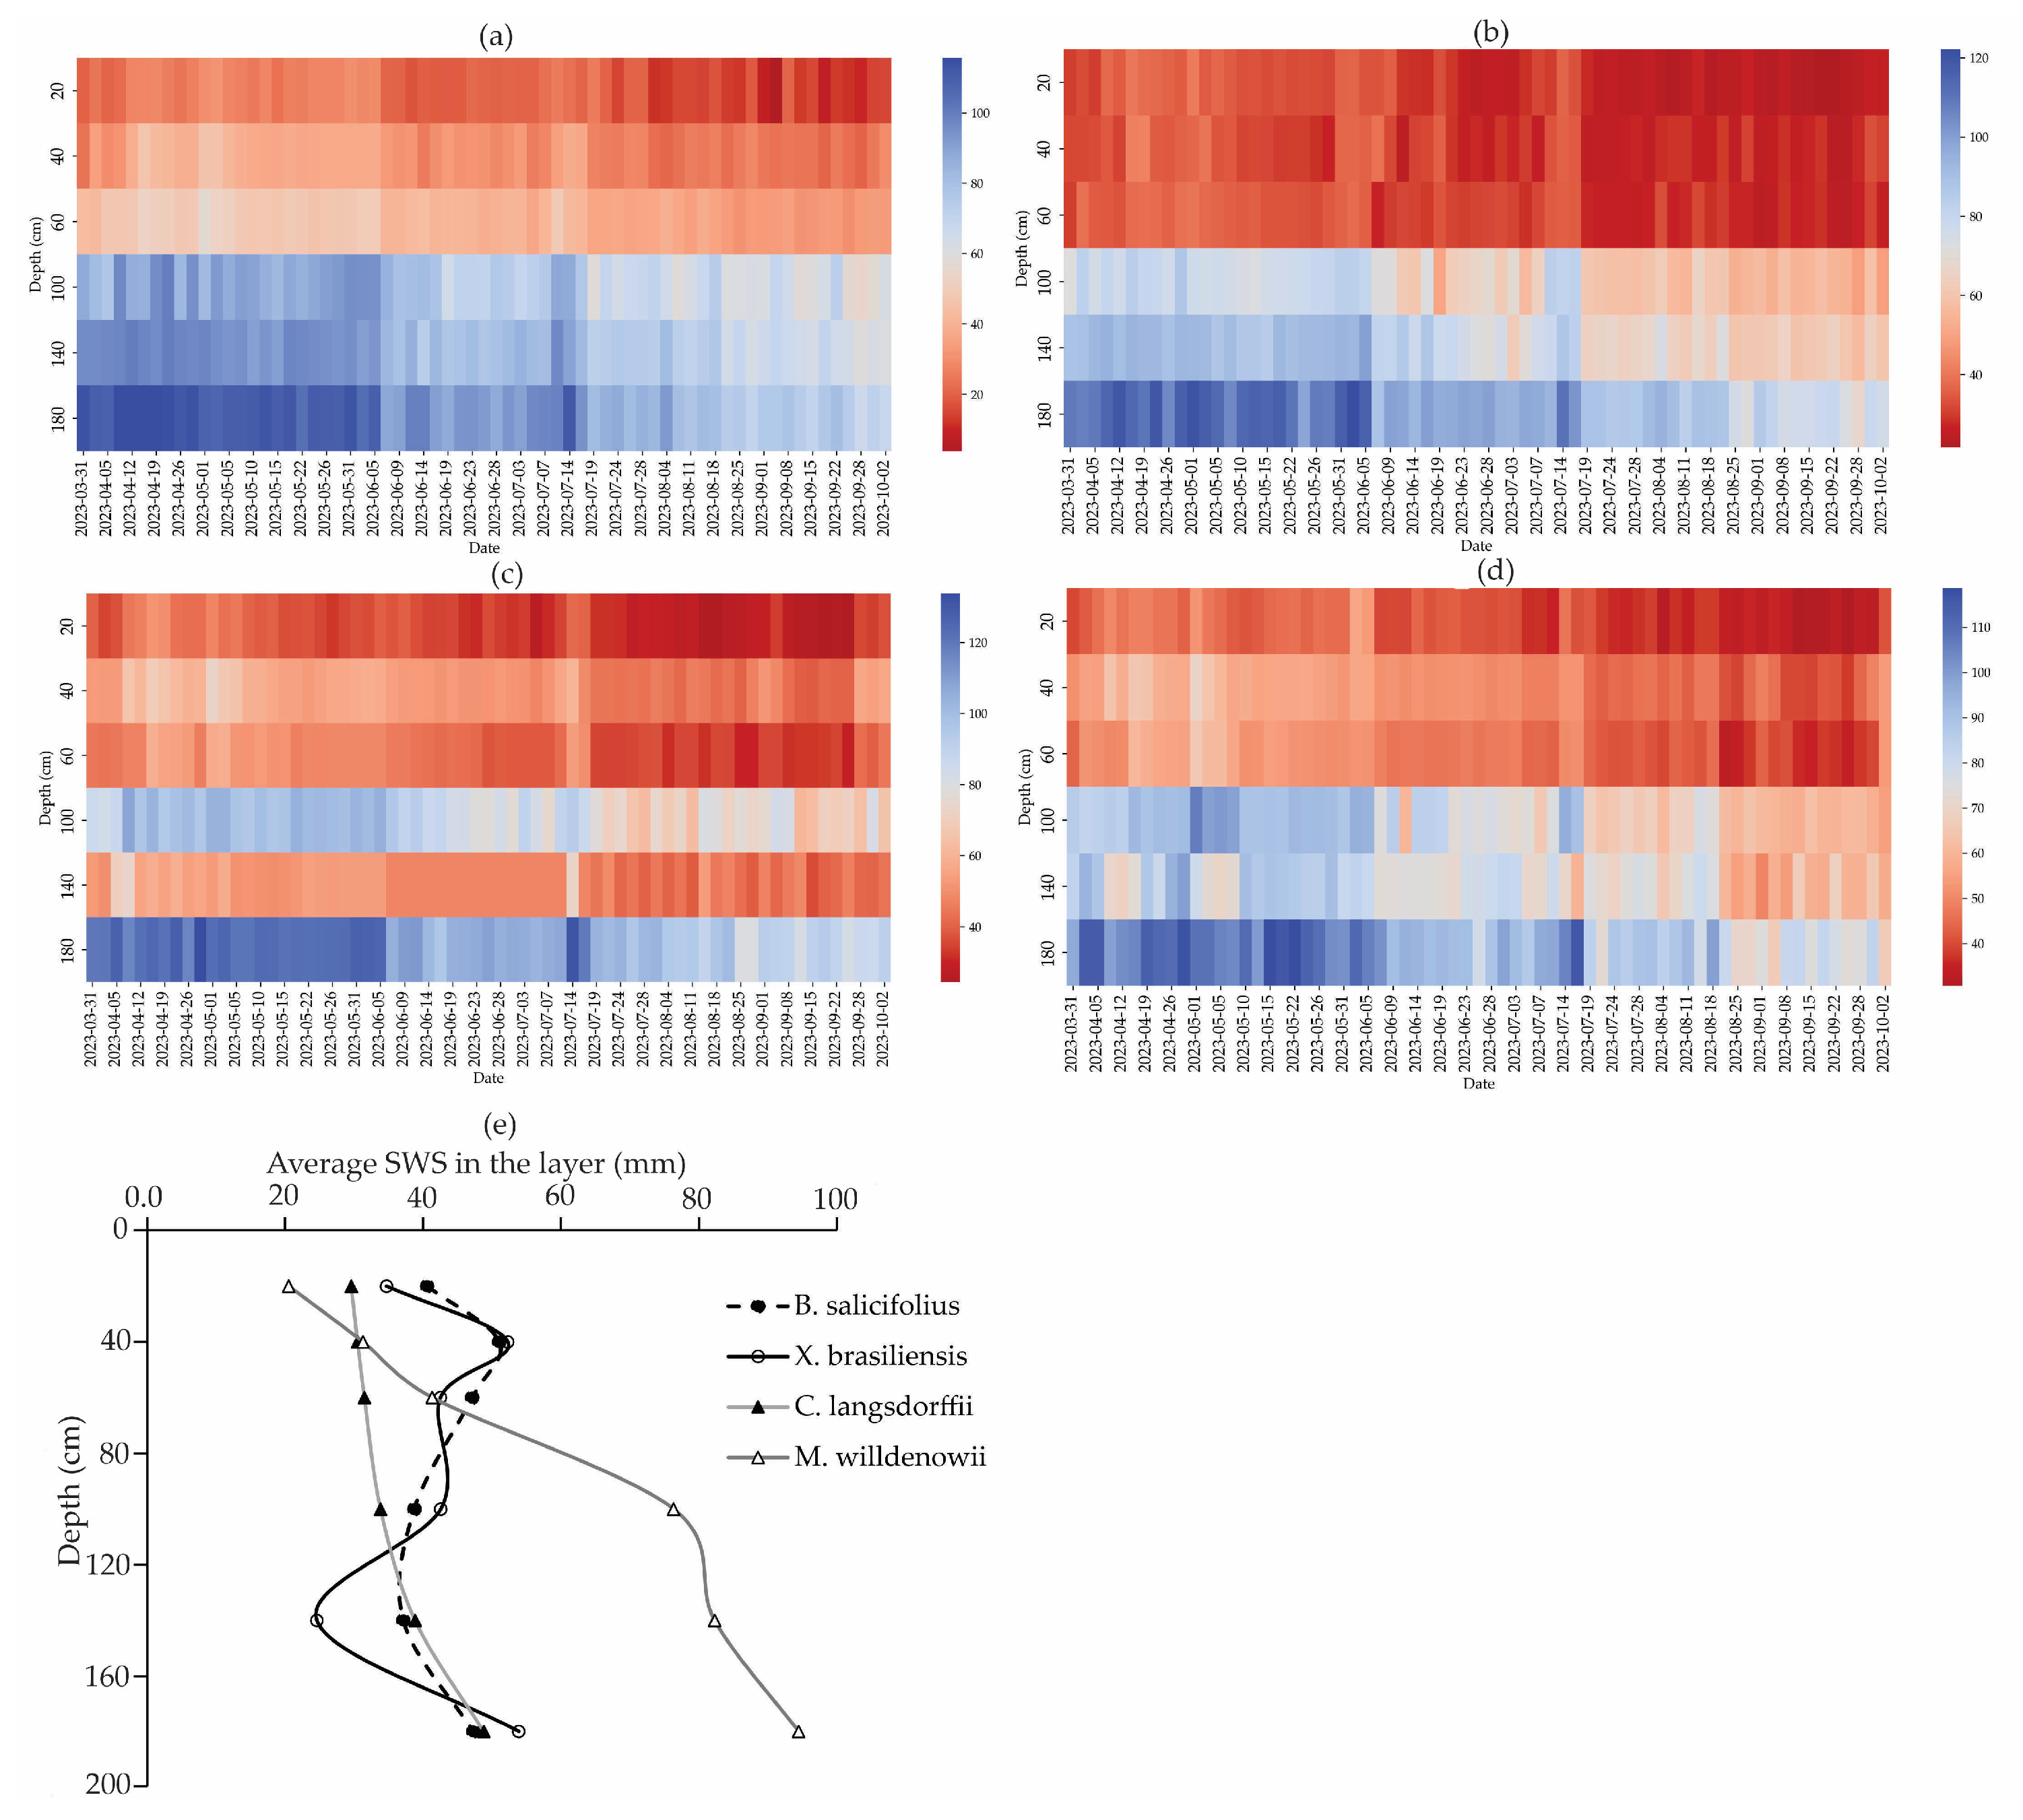
A reduction trend in SWS is observed across all sites throughout the study period, as indicated by the highest density (dark spots) in Figure 6a. The red line in the figure represents the trend of SWS. Initially, in April, SWS values were higher, but there has been a general decline over the evaluation period, with fluctuations being verified during the rainfall events. An important threshold for significant changes in soil water storage was determined to be an event precipitation (EP) of ≥4 mm. However, the SWS time series (measured in mm) shows an overall reduction trend throughout the evaluation period down to a depth of 140 cm (illustrated in Figure 5b) for X. brasiliensis. Notably, higher SWS values were measured at greater depths, indicating that this tree species can uptake water from soil depths up to 140 cm.
July presented the greatest variability in SWS, mainly in C. langsdorffii, M. willdenowii, and X. brasilienses, although no EP was observed in this month (Figure 6a). This behavior is due to infrequent rainfall and the high permeability of dystrophic red Latosol, making changes in soil moisture rapid in surface layers, increasing the variability. In contrast, soil moisture decreases in deeper layers, especially up to 100 cm, reaching small values due to water consumption by the trees. B. salicifolius and X. brasiliensis stand out as the highest values over the period studied, ranging from approximately 300 to 500 mm. The lowest values were observed in C. langsdorffii and M. willdenowii, with variations from 245 mm to 400 mm and 230 mm to 415 mm, respectively (Figure 6e).
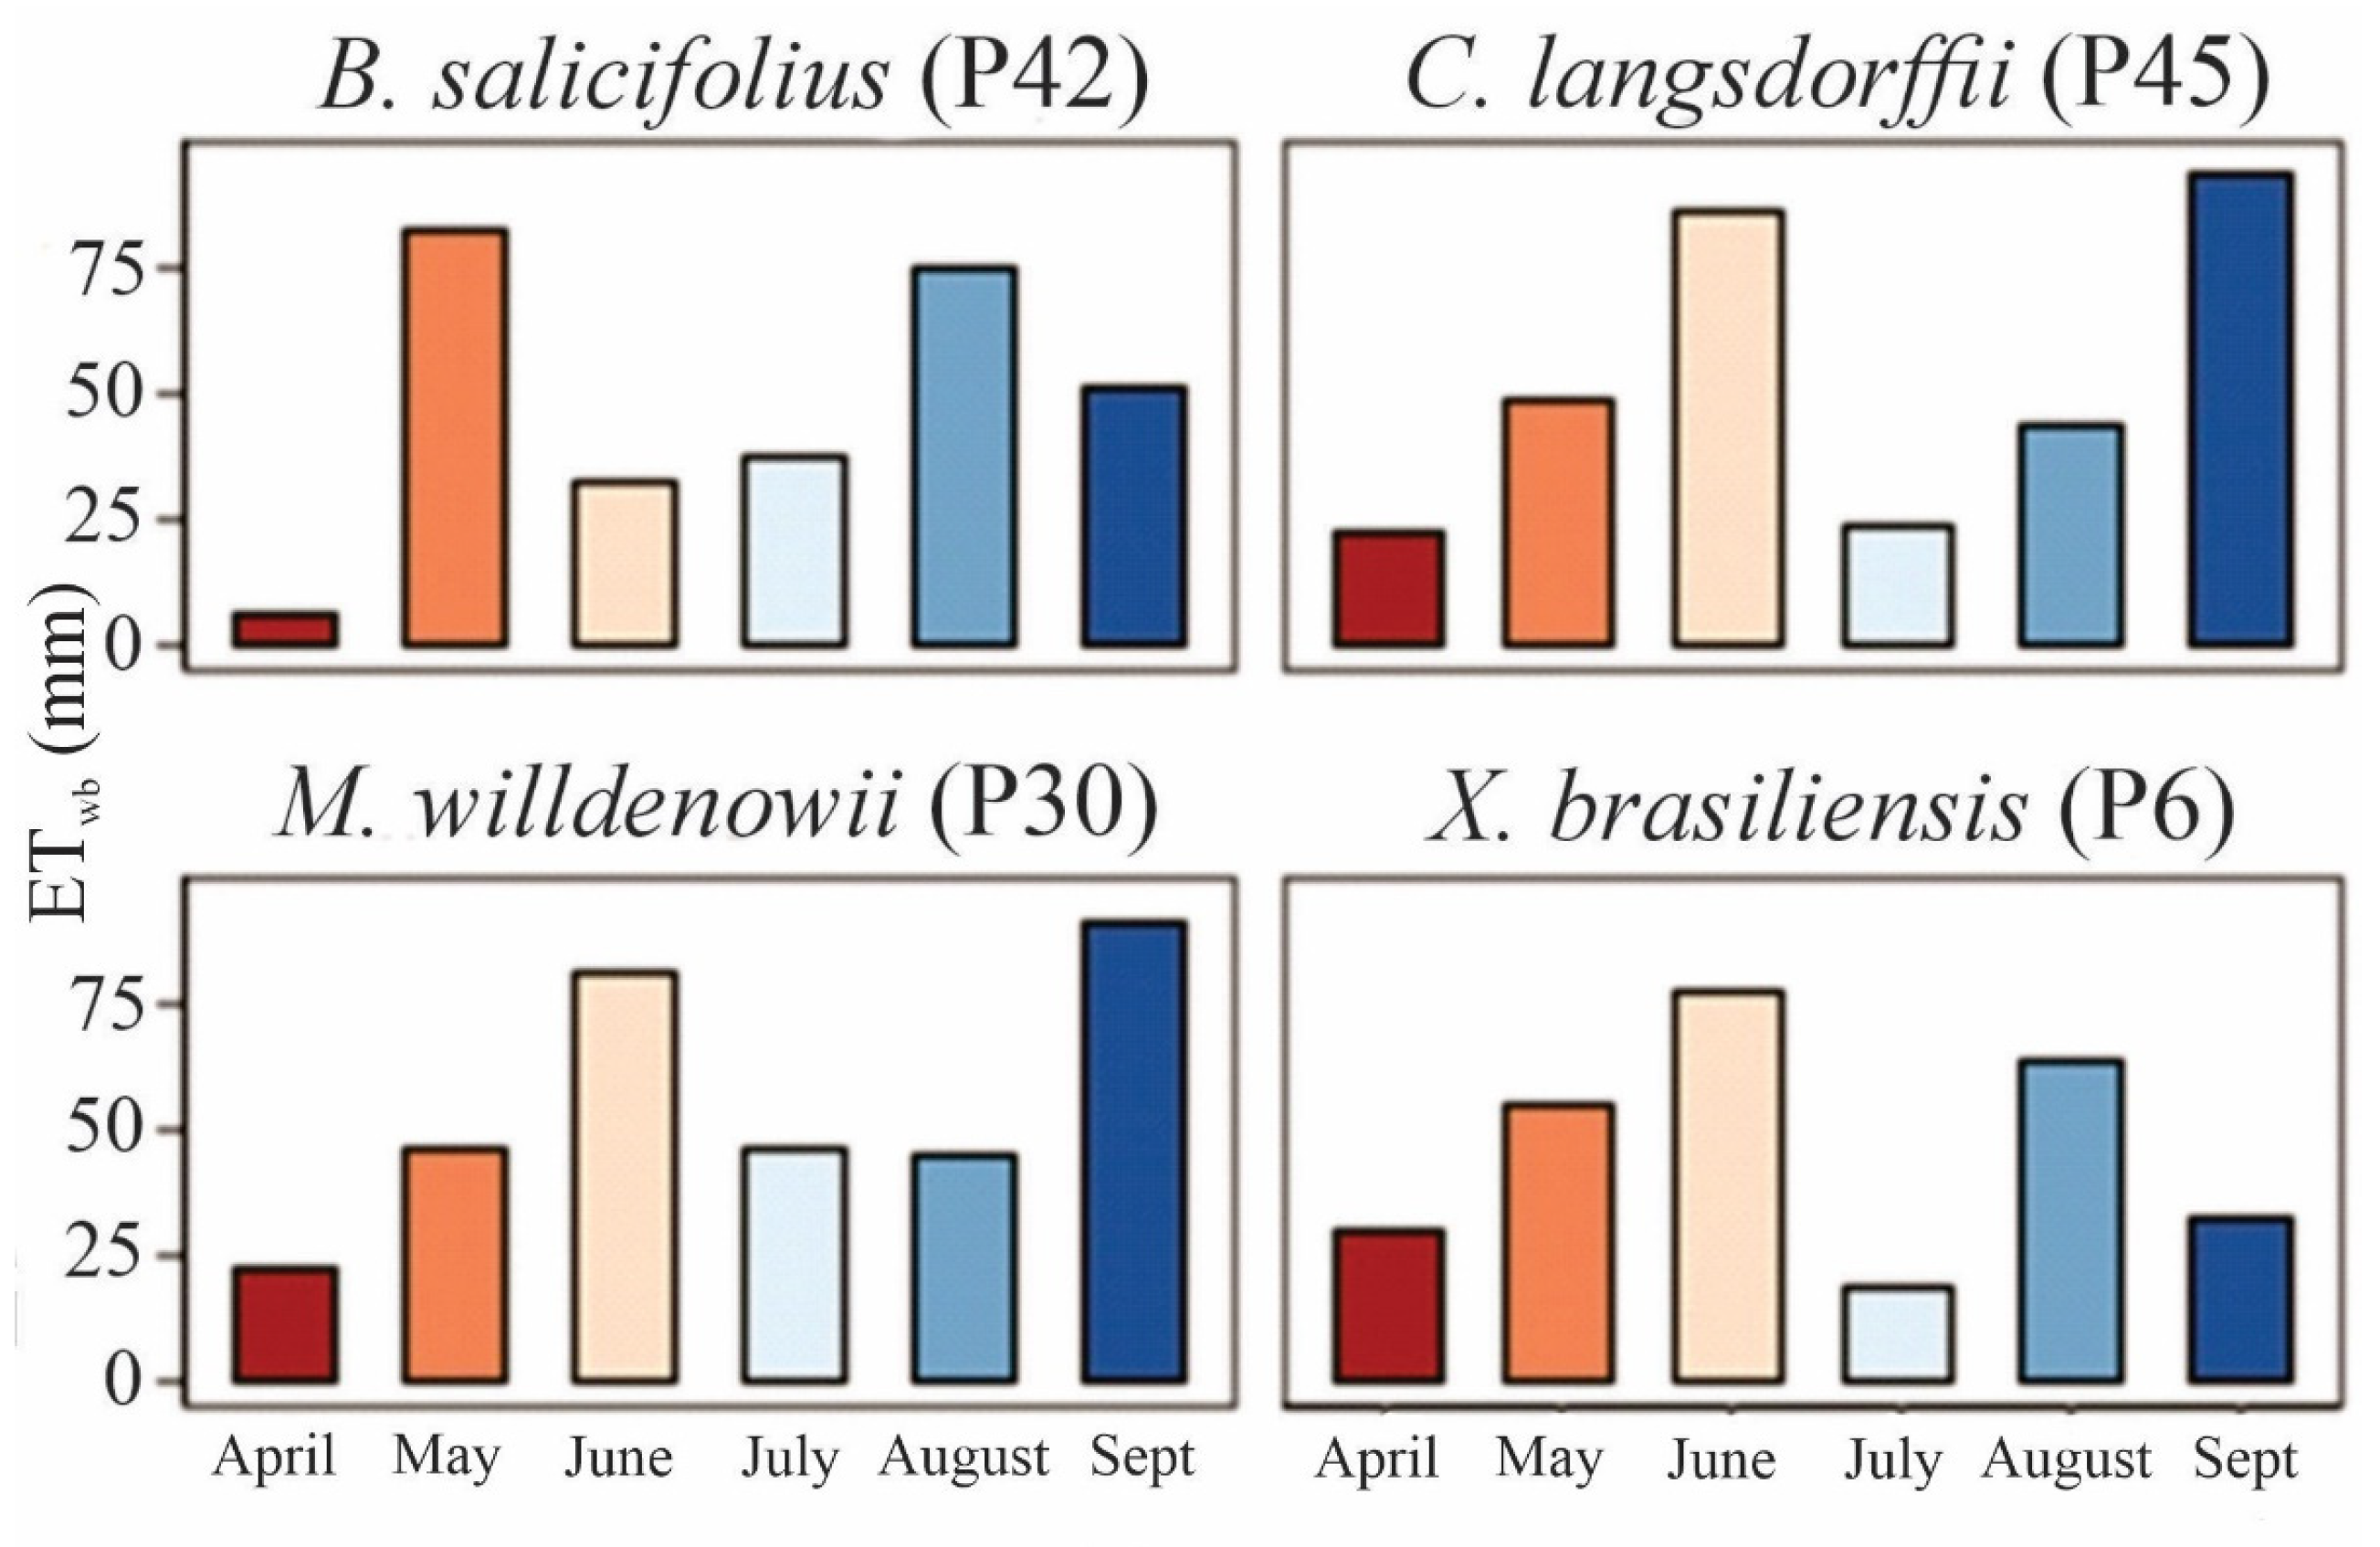
Figure 7 illustrates the monthly behavior of evapotranspiration (ETwb) among the species studied at MSSF. For most tree species, ETwb peaked in June, with values ranging from 78 mm to 82.4 mm. However, B. salicifolius showed a different pattern, recording the lowest monthly ETwb of 6.5 mm in April, reaching a maximum of 82.4 mm in May. Notably, the ETwb for B. salicifolius in May did not surpass those recorded in September for M. willdenowi and C. langsdorffii. The lowest ETwb values were observed in April and July, with X. brasiliensis showing a maximum of 26.5 mm in April, while M. willdenowi had a peak of 48 mm in July. Thus, different patterns for ETwb among the studied species were observed over the dry period. C. langsdorffii and M. willdenowi displayed similar trends, showing a decline from June but experiencing a significant increase in September. Figure 7 indicates that the highest ETwb values were recorded for M. willdenowi and C. langsdorffii, reaching 93.5 mm and 95.0 mm, respectively, in September. The minimum monthly values for these species were approximately 22 mm in April.
The temporal variability of ETwb is influenced by meteorological conditions within and above the forest canopy, dynamics of SWS, and EP pattern observed at each monitoring tree. During the transition from dry to rainy season in September, when the ecosystem is recovering, GP tends to be higher, implying an increase in SWS and solar radiation as winter ends. On the other hand, the conditions of increased cloud cover and reduced solar radiation during autumn (starting at the end of April) lead to a decrease in ETwb in that month. In July, ETwb is notably low due to decreased soil moisture, the absence of EP, and significant reductions in solar radiation and temperature. It is also important to note that half of the MSSF trees lose their leaves during this period, which reduces physiological activities [31] and water uptake [32].
The datasets in Table 2 refer to the AGB, CI, and ETwb accumulated over the monitored period in the plots and respective species.
X. brasiliensis has the highest AGB stock (54.5 kg), surpassing the other trees due to its expansive crown and larger DBH. In contrast, B. salicifolius has a lower AGB stock (14.3 kg) and exhibits a growth pattern characterized by a conical shape. C. langsdorffii has an AGB stock like X. brasiliensis (49.0 kg), while M. willdenowii has an AGB stock of 20.4 kg.
M. willdenowii showed the highest ETwb, with 331.4 mm, averaging 55.2 mm/month. ETwb above 300 mm (50 mm/month) was observed in C. langsdorffii (316.0 mm; 52.7 mm/month), while B. salicifolius (284.27 mm; 47.4 mm/month) and X. brasiliensis (293.42 mm; 48.9 mm/month) displayed the lowest ones.

3.3. Connections Between SWS, Root Distribution, and Ksat

Figure 8a illustrates the SWS behavior in each soil layer and root distribution for the studied trees based on the nearest sampled profile. Inverse relationships between SWS and root distribution in the profiles of M. willdenowii and C. langsdorffii were observed, suggesting that SWS is inversely proportional to root concentration (correlations of −0.886 and −0.742, respectively). In contrast, B. salicifolius and X. brasiliensis exhibited a direct relationship with roots up to 140 cm, although the correlation values were weak (0.375 and 0.212, respectively), and no discernible pattern was detected.
In the surface soil layers, an inverse relationship was observed for C. langsdorffii, where root density decreased, while SWS increased, particularly at 60 cm depth (Figure 8a). The root distribution throughout the soil profile showed a lower concentration of fine roots in deeper layers (Figure 4), accompanied by reduced SWS. However, SWS increased at the 140–180 cm layer, which was noted across all the tree species (Figure 8a). For X. brasiliensis, there was a direct relationship between SWS and root distribution up to 140 cm; specifically, greater root concentration correlated with higher SWS. Figure 8b illustrates the behavior of saturated soil hydraulic conductivity (Ksat) across the soil profile. Overall, SWS was consistently lower in the surface layer (0–20 cm), more variable in the intermediate layers (20–140 cm), and higher in the deeper layers (140–180 cm). The Ksat was higher in the surface layers and decreased with depth. In the profile adjacent to B. salicifolius, Ksat reached its highest value in the 20–40 cm layer (124.45 cm h−1), while the average Ksat for the profile was 52.73 cm h−1, which is higher than that of the other profiles. In the profile located near C. langsdorffii and M. willdenowii, the highest Ksat was found in the 0–20 cm layer (110.46 cm h−1), with an average soil profile Ksat of 33.37 cm h−1, which is lower than Ksat of the other profiles. In the profile near X. brasiliensis, Ksat exhibited its highest value in the 40–60 cm layer (97.02 cm h−1), with an average of 43.27 cm h−1 for the soil profile.

3.4. Brief Discussion of Mechanisms

X. brasiliensis has the highest CI/GP ratio due to its architecture. This tree features long leaves and branches that grow vertically on the trunk, along with a more rugosity bark [30], which enhances its ability to intercept rainfall. This finding is significant because an increase in the population of X. brasiliensis can lead to greater competition for EP among the trees. We have observed in the field that the population of X. brasiliensis is increasing, while the mortality rate of some other species is rising. This competition for water can be the primary cause of that decline.
Regarding changes in SWS over time, X. brasiliensis showed a declining trend in SWS. This reduction can be associated with the effects of canopy interception and transpiration. Specifically, this is reflected in the temporal average behavior of soil moisture, which exhibits a downward trend down to a depth of 140 cm (Figure 5b). In contrast, other species show a continuous increase in SWS starting from a depth of 60 cm, with root water uptake primarily occurring in the shallower layers. These differences can be attributed to the spatial variability of soil properties, particularly those that affect water movement, as well as the species’ characteristics. It is important to note that a higher SWS does not necessarily equate to greater water availability; rather, water retention is influenced by the distribution of pore sizes (macro and micropores). A higher concentration of micropores can inhibit water uptake, prompting trees to search for water deeper in the soil layers [26].
M. willdenowi and C. langsdorffii are species characterized by a dense canopy but lower plant density. During the dry period, C. langsdorffii exhibits significant leaf-shedding rates [31], particularly from the second half of August to the end of October [33], which directly affects the highest ET rates. Moreover, the El Niño phenomenon [34] during the studied period likely increased evapotranspiration in August and September due to higher temperatures and reduced EP, leading to a drier than average period. These species appear to be more sensitive to these conditions compared to others.
In contrast, X. brasiliensis demonstrated distinct behavior, exhibiting the lowest ETwb throughout the observation period, with a notable decrease in September. This tree likely has a more effective root system that enables it to uptake water from deeper layers. X. brasiliensis is characterized by its conical crown, reaching a maximum ETwb of 77.4 mm in June, while its minimum value was 19.2 mm in April. Its leafing and shedding patterns do not follow typical seasonal trends [31]. As the leafing curve indicates reductions during the dry season, most individuals re-leaf throughout the year, with only a few displays total or partial leaf shedding [32]. B. salicifolius displayed different behavior, with an increase in ETwb observed in May, while the other trees experienced increases in June. Therefore, the combined effects of climate, soil moisture, and ecological factors, such as competition for water and light, significantly influenced the lower ETwb, reducing the efficiency of these species.
The highest accumulated CI values were observed at X. brasiliensis, reaching 88.3 mm. Trees with the highest AGB also demonstrated the highest CI values (Table 2), showing a positive relationship between these variables (r = 0.626). In tropical forests, trees with larger canopies tend to have greater volumes, which contributes to higher AGB. Conversely, a negative relationship was found between AGB and ETwb during the dry period (r = −0.822). During this period, trees experienced water stress, along with reduced solar radiation, leading them into deciduous behavior. As a result, there is a period of dormancy for the trees, implying a halt in growth.
Contrasts between SWS and root distribution were observed due to the spatial distribution of soil and roots and the characteristics of the tree species. A decreased root concentration with depth was noted, accompanied by a slight reduction in SWS. However, wetter locations do not necessarily correlate with increased root uptake; this is because water can be tightly bound within the soil due to the capillarity effect in micropores, which increases in depth [26]. SWS in B. salicifolius was higher than in X. brasiliensis, indicating reduction in the soil profile. The weak correlation with AGB suggests that X. brasiliensis has lower water demand, and the water availability in shallow layers has been sufficient to sustain the tree’s transpiration during the dry season, given the root accumulation in these layers, primarily in the 40–60 cm layer. In contrast, trees with higher AGB, such as C. langsdorffii, may face challenges in water uptake as their physiological needs require more, leading to reduction in SWS in shallow layers (Figure 8a) [26]. This trend was observed in locations where inverse relationships occurred, enabling C. langsdorffii to shift water uptake to deeper layers during dry conditions [32].
Certain aspects of the relationship between soil moisture and Ksat are significant. Generally, soil moisture typically tends to increase with depth, while Ksat typically decreases, particularly at depths exceeding 60 cm, which limits water movement within the soil profile. As a result, elevated soil moisture and root presence are often found at intermediate depths (40–60 cm) (Figure 8a).
The behavior of Ksat throughout the soil profile is closely linked to the distribution of roots and changes in soil structure that occur with depth. These changes are influenced by the decomposition of organic matter derived from litter. The concentration of Ksat can vary depending on the species. Organic matter enhances the aggregation and cohesion of soil particles, particularly in the upper layers, reducing soil bulk density and increasing infiltration [7,8].

3.5. Temporal Variability of Soil Moisture in the Soil Profile at MSSF

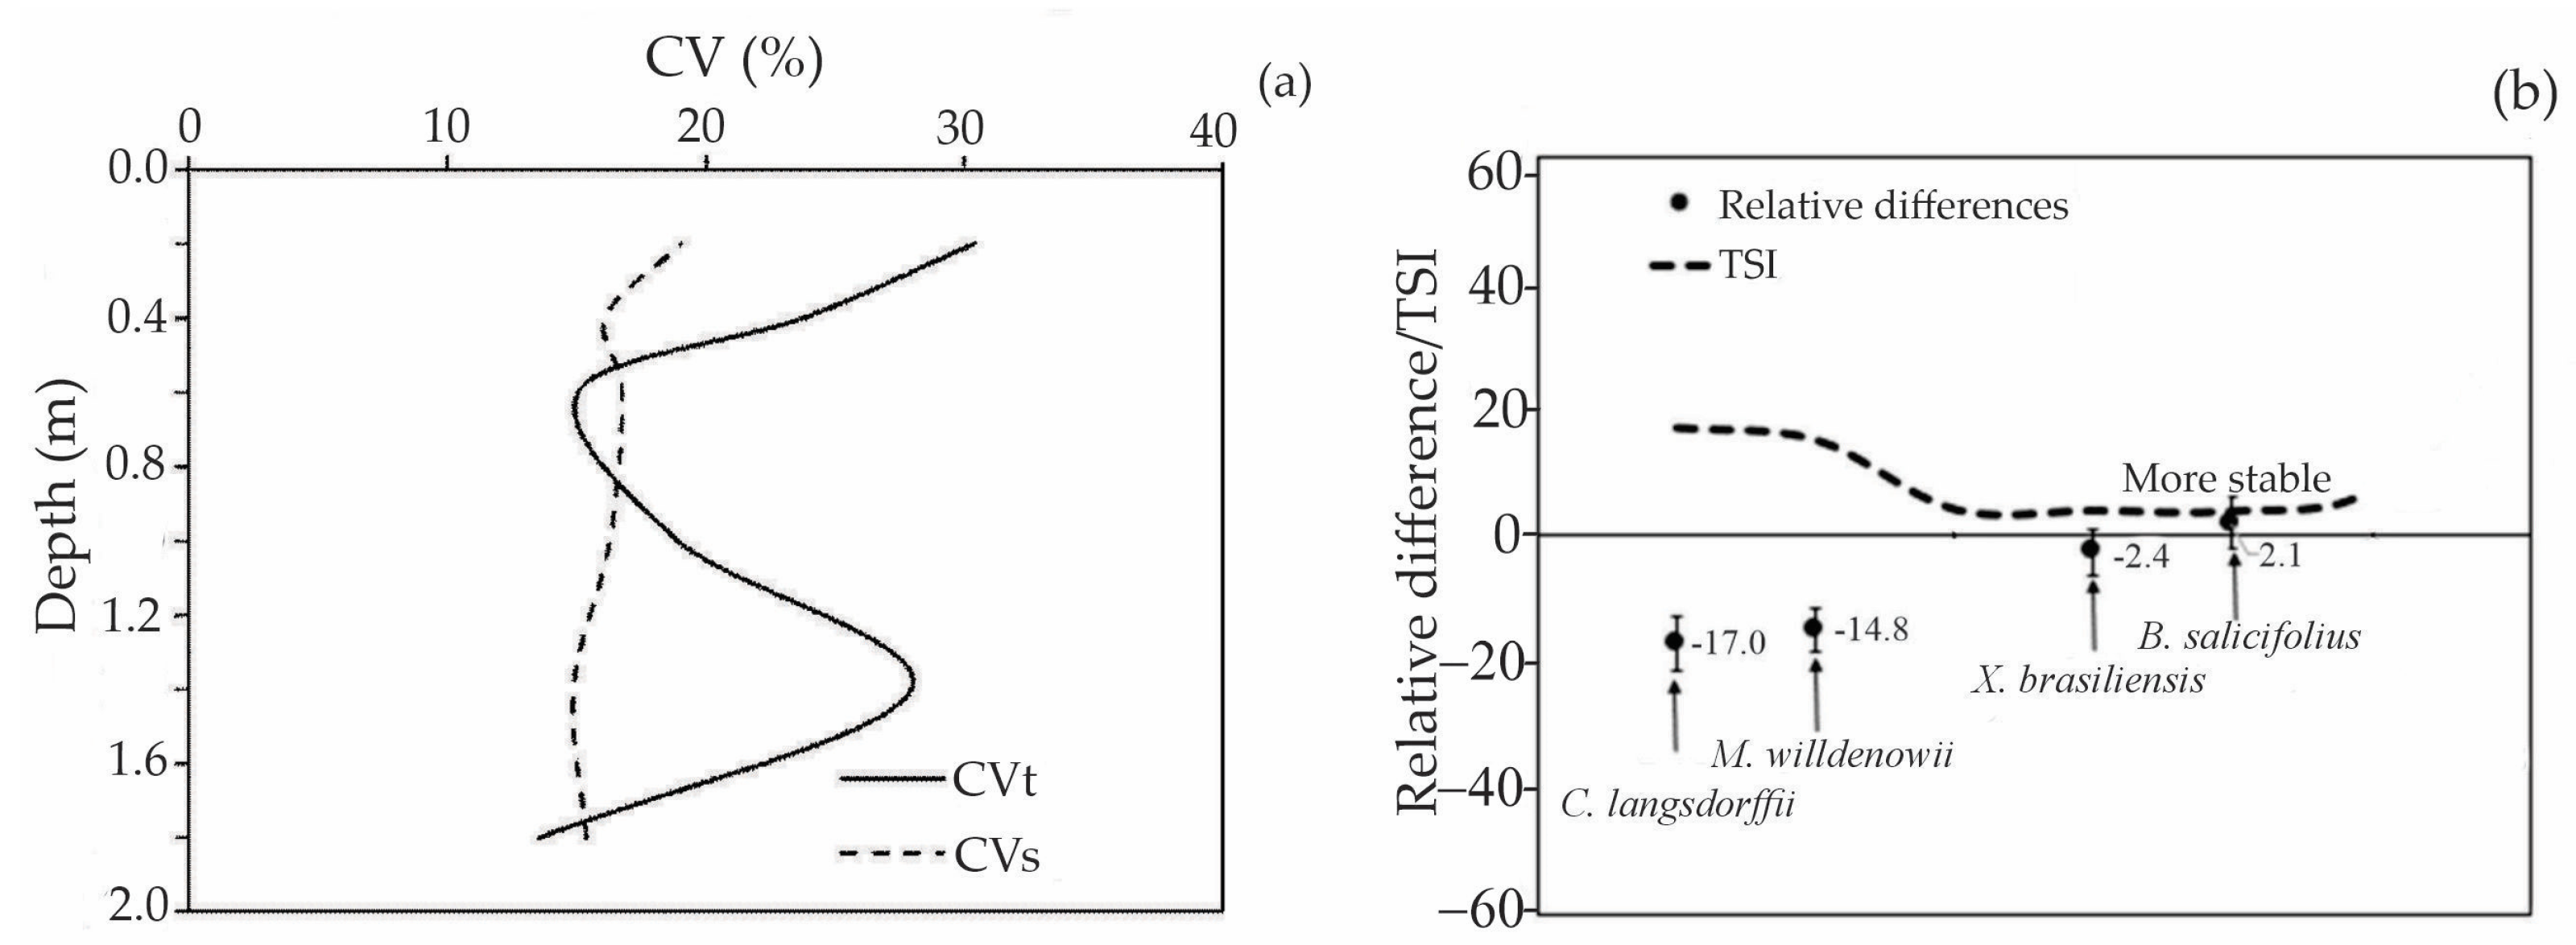
The coefficient of variation (CV) was examined to analyze the behavior of average soil moisture over time (CVt) and within the soil profile (CVs) (Figure 9a). CVt exhibited higher variation at depths of 20, 40, and 140 cm, with percentages of 30.4%, 23.8%, and 27.9%. The variation in depth (CVs) showed to be moderate across depths, which tends to stabilize with increasing depth, ranging from 14.9% to 19.0%, with the highest percentage observed at a depth of 20 cm.
The greatest time variability in soil moisture, particularly at depths of 20 cm and 40 cm, is attributed to root concentration. Fine roots are crucial in water uptake and enhance infiltration in the surface layers due to litter decomposition, which creates optimal conditions for water infiltration. Ref. [7] observed significant changes in soil moisture stability up to a depth of 40 cm in the MSSF. They linked these increased dynamics to the direct influences of vegetation and climate, specifically EP and ET, which impact the shallower layers more significantly.
The replenishment–consumption–replenishment cycle can also lead to substantial changes [35], especially if rainfall occurs during the dry season. At a depth of 140 cm, certain soil characteristics, particularly bulk density, act as the key drivers of soil moisture variation. This upward trend in bulk density with increasing depth was noted by Reference [7] in the same study area. Conversely, deeper soil layers exhibit lower root concentrations than shallower layers. Refs. [36,37,38] indicated that preferential flows created by biological activity, such as the thick roots of dead plants or animals, also contribute to soil moisture variability in deeper layers [39,40]. This finding aligns with the difficulties in water uptake from shallow layers, which have lower moisture, demonstrating an inverse relationship with root distribution.
The Temporal Stability Index (TSI) for B. salicifolius and X. brasiliensis displayed the highest stability, indicating less variability in soil moisture during the dry period (Figure 8b). In contrast, C. langsdorffii and M. willdenowii showed the lowest stability, with significant fluctuations in soil moisture during the dry season. For locations near B. salicifolius and X. brasiliensis, we did not observe a consistent relationship between soil moisture and root distribution in the soil profile, along with one of the lowest ETwb (Figure 7), which helps explain this greater temporal stability. Based on hydrological behavior, overall, B. salicifolius and X. brasiliensis are better adapted to the MSSF environment under dry conditions.
Our findings emphasize the importance of evapotranspiration and soil moisture and their relationships with tree characteristics (root distribution and AGB). We identified relevant relationships between soil moisture and evapotranspiration linked to root distribution and AGB. Additionally, soil moisture exhibited an inverse relationship with Ksat, further clarifying SWS within the soil profile. Our study is the first to investigate the conditions of the Atlantic Forest by focusing on each predominant species separately, along with root distribution and SWS up to 180 cm. Despite this novel approach, the study has limitations, such as monitoring only one dry season; however, the year 2023 was the hottest recorded in the last 120 years for the region, which enhances the relevance of our results.

4. Conclusions

In this study, the individual water balance for representative species of the Atlantic Forest was carried out, covering four species: Blefarocálice salicifolius (Kunth), Miconia willdenowii DC, Xylopia brasiliensis Spreng., and Copaifera langsdorffii Desf. The following conclusions were reached:
  • The rainfall pattern influenced the ET, EP, and CI in the monitored species during the dry period of 2023. This fact is associated with the canopy architecture, canopy density, and morphological characteristics of the species.
  • We observed that the higher the AGB, the higher the CI; this relationship is inverse between AGB and ET in the trees assessed.
  • X. brasiliensis and M. willdenowii showed greater variation in EP and lower values of SWS, with M. willdenowii presenting the highest SWS values.
  • The species’ roots are mainly concentrated in the surface layers (<60 cm), associated with the availability of nutrients and water, with a non-uniform distribution in the soil profile.
  • The root concentration throughout the soil profile contributes to soil moisture variability, especially in the first layers; we observed an inverse relationship between SWS and root concentration in M. willdenowii and C. langsdorffii, indicating that higher root concentration results in lower soil moisture in layers < 100 cm.
  • Blefarocalice salicifolius and Xylopia brasiliensis are the trees more adapted to MSSF under drier conditions; such information can be used to establish recovery planning for degraded areas originally covered by the Atlantic Forest in Dark Red Oxisol.

Supplementary Materials

The following supporting information can be downloaded at: https://www.mdpi.com/article/10.3390/f16050812/s1, raw datasets.xls.

Author Contributions

Conceptualization, C.R.M. and J.A.J.J.; methodology, C.R.M., J.A.J.J. and A.C.C.; software, A.C.C., A.B.V. and S.J.M.; validation, J.A.J.J. and A.C.C.; formal analysis, A.C.C., A.F.R. and J.A.J.J.; investigation, A.C.C.; resources, C.R.M.; data curation, C.R.M. and A.F.R.; writing—original draft preparation, C.R.M., L.G., M.C.N.S.T. and A.F.R.; visualization, A.C.C.; supervision, C.R.M.; project administration, C.R.M.; funding acquisition, C.R.M. All authors have read and agreed to the published version of the manuscript.

Funding

This study was sponsored by the “Coordenação de Aperfeiçoamento de Pessoal de Nível Superior—Brasil” (CAPES–Código de Financiamento 001) and “Conselho Nacional de Pesquisa e Desenvolvimento” (CNPq—402066/2023-5 and 302483/2022-5).

Data Availability Statement

The datasets of this study are in Supplementary Materials.

Conflicts of Interest

The authors declare no conflicts of interest.

References

  1. Han, Q.; Sun, K.; Wang, H.; Pei, Z.; Chen, H.; Yang, J.; Sun, X. Water Balance Characteristics of the Salix Shelterbelt in the Kubuqi Desert. Forests 2024, 15, 278. [Google Scholar] [CrossRef]
  2. Pizarro, R.; Valdés-Pineda, R.; Garcia-Chevesich, P.A.; Ibáñez, A.; Pino, J.; Scott, D.F.; Ubilla, P. The large-scale effect of forest cover on long-term streamflow variations in mediterranean catchments of central Chile. Sustainability 2022, 14, 4443. [Google Scholar] [CrossRef]
  3. Joly, C.A.; Metzger, J.P.; Tabarelli, M. Experiences from the Brazilian Atlantic Forest: Ecological findings and conservation initiatives. New Phytol. 2014, 204, 459–473. [Google Scholar] [CrossRef]
  4. Junqueira Junior, J.A.; Mello, C.R.; Mello, J.M.; Scolforo, H.F.; Beskow, S.; McCarter, J. Rainfall partitioning measurement and rainfall interception modelling in a tropical semi-deciduous Atlantic forest remnant. Agric. For. Meteorol. 2019, 275, 170–183. [Google Scholar] [CrossRef]
  5. Salemi, L.F.; Groppo, J.D.; Trevisan, R.; de Moraes, J.M.; Ferraz, S.F.d.B.; Villani, J.P.; Duarte-Neto, P.J.; Martinelli, L.A. Land-use change in the Atlantic rainforest region: Consequences for the hydrology of small catchments. J. Hydrol. 2013, 499, 100–109. [Google Scholar] [CrossRef]
  6. Guauque-Mellado, D.; Rodrigues, A.; Terra, M.; Mantovani, V.; Yanagi, S.; Diotto, A.; Mello, C.R. Evapotranspiration under Drought Conditions: The Case Study of a Seasonally Dry Atlantic Forest. Atmosphere 2022, 13, 871. [Google Scholar] [CrossRef]
  7. Junqueira Junior, J.J.; Mello, C.R.; Owens, P.R.; Mello, J.M.; Curi, N.; Alves, G.J. Time-stability of soil water content (SWC) in an Atlantic Forest-Latosol site. Geoderma 2017, 288, 64–78. [Google Scholar] [CrossRef]
  8. Oliveira, V.A.; Rodrigues, A.F.; Morais, M.A.V.; Terra, M.D.C.N.S.; Guo, L.; Mello, C.R. Spatiotemporal modelling of soil moisture in an Atlantic Forest through machine learning algorithms. Eur. J. Soil Sci. 2021, 72, 1969–1987. [Google Scholar] [CrossRef]
  9. Macinnis-ng, C.M.O.; Flores, E.E.; Müller, H.; Schwendenmann, L. Throughfall and stemflow vary seasonally in different land-use types in a lower montane tropical region of Panama. Hydrol. Process. 2014, 28, 2174–2184. [Google Scholar] [CrossRef]
  10. Helman, D.; Lensky, I.M.; Yakir, D.; Osem, Y. Forests growing under dry conditions have higher hydrological resilience to drought than do more humid forests. Glob. Change Biol. 2017, 23, 2801–2817. [Google Scholar] [CrossRef]
  11. Lima, J.D.S.; Villela, D.M.; Calderano Filho, B.; Pérez, D.V. Biomassa radicular fina em fragmentos da Mata Atlântica fluminense. Floresta 2011, 41, 27–38. [Google Scholar] [CrossRef]
  12. Choat, B.; Brodribb, T.J.; Brodersen, C.R.; Duursma, R.A.; Lopez, R.; Medlyn, B.E. Triggers of tree mortality under drought. Nature 2018, 558, 531–539. [Google Scholar] [CrossRef]
  13. Oliveira-Filho, A.T.; Mello, J.M. Effects of past disturbance and edges on tree community structure and dynamics within a fragment of tropical semideciduous forest in south-eastern Brazil over a five-year period (1987–1992). Plant Ecol. 1997, 131, 45–66. [Google Scholar] [CrossRef]
  14. Oliveira-Filho, A.T.; Fontes, M.A.L. Patterns of floristic differentiation among Atlantic Forests in Southeastern Brazil and the influence of climate. Biotropica 2000, 32, 793–810. [Google Scholar] [CrossRef]
  15. INMET-Instituto Nacional de Meteorologia. Normais Climatológicas do Brasil 1991–2020. 2020. Available online: https://portal.inmet.gov.br/normais (accessed on 24 July 2024).
  16. Ratuchne, L.C.; Koehler, H.S.; Watzlawick, L.F.; Sanquetta, C.R.; Schamne, P.A. Estado da arte na quantificação de biomassa em raízes de formações florestais. FLORAM 2016, 23, 450–462. [Google Scholar] [CrossRef]
  17. Ramos, H.M.N.; Vasconcelos, S.S.; Kato, O.R.; Castellani, D.C. Above-and belowground carbon stocks of two organic, agroforestry-based oil palm production systems in eastern Amazonia. Agrofor. Syst. 2018, 92, 221–237. [Google Scholar] [CrossRef]
  18. Ribeiro, J.A.H.; de Almeida, L.H.D.; de Souza, T.G.; Lima, P.L.S.; de Sousa Cardoso, S.; de Souza, P.H.P.; Lacerda, F.D.C.B. Importância ecossistêmica das raízes: Uma revisão de literatura. Res. Soc. Dev. 2024, 13, e0313345177. [Google Scholar] [CrossRef]
  19. Chave, J.; Réjou-Méchain, M.; Búrquez, A.; Chidumayo, E.; Colgan, M.S.; Delitti, W.B.; Vieilledent, G. Improved allometric models to estimate the aboveground biomass of tropical trees. Glob. Change Biol. 2014, 20, 3177–3190. [Google Scholar] [CrossRef]
  20. Reynolds, W.D.; Elrick, D.E.; Youngs, E.G.; Booltink, H.W.G.; Bouma, J. Laboratory Methods. In Methods of Soil Analysis, Part 1, 2nd ed.; Klute, A., Ed.; SSSA Book Series; SSSA Publications: Madison, WI, USA, 1986; pp. 802–816. [Google Scholar]
  21. Basílio, J.J.N.; Campoe, O.C.; Queiroz, T.B.; de Souza, C.R.; Carneiro, R.L.; Alvares, C.A.; Figura, M.A. Fine Root Density Dynamics and Carbon Stock of Eucalyptus spp.: Interplay of Age, Genotype, and Edaphoclimatic Conditions. Plants 2024, 13, 1503. [Google Scholar] [CrossRef]
  22. Leonova, A.; Heger, A.; Vásconez Navas, L.K.; Jensen, K.; Reisdorff, C. Fine root mortality under severe drought reflects different root distribution of Quercus robur and Ulmus laevis trees in hardwood floodplain forests. Trees 2022, 36, 1105–1115. [Google Scholar] [CrossRef]
  23. Kulmann, M.S.D.S.; Dick, G.; Eufrade Junior, H.J.; Guerra, S.P.S.; Schumacher, M.V. Soil physical-chemical aspects influence the fine roots parameters of Pinus elliottii Engelm. stands in southern Brazil. Sci. For. 2022, 50, e3839. [Google Scholar] [CrossRef]
  24. Morais, V.A.; Santos, C.A.; Mello, J.M.; Dadid, H.C.; Araújo, E.J.G.; Scolforo, J.R.S. Spatial and vertical distribution of litter and belowground carbon in a Brazilian Cerrado vegetation. Cerne 2017, 23, 43–52. [Google Scholar] [CrossRef]
  25. King, J.R.; Köry, J.; Ptashnyk, M. Multiscale analysis of nutrient uptake by plant roots with sparse distribution of root hairs: Nonstandard scaling. SIAM J. Appl. Math. 2021, 81, 1361–1388. [Google Scholar] [CrossRef]
  26. Demir, G.; Guswa, A.J.; Filipzik, J.; Metzger, J.C.; Römermann, C.; Hildebrandt, A. Root water uptake patterns are controlled by tree species interactions and soil water variability. Hydrol. Earth Syst. Sci. 2024, 28, 1441–1461. [Google Scholar] [CrossRef]
  27. Lian, X.; Zhao, W.; Gentine, P. Recent global decline in rainfall interception loss due to altered rainfall regimes. Nat. Commun. 2022, 13, 7642. [Google Scholar] [CrossRef]
  28. Mello, C.R.; Guo, L.; Yuan, C.; Rodrigues, A.F.; Lima, R.R.; Terra, M.C. Deciphering global patterns of forest canopy rainfall interception (FCRI): A synthesis of geographical, forest species, and methodological influences. J. Environ. Manag. 2024, 358, 120879. [Google Scholar] [CrossRef]
  29. Oliveira, S.; Cunha, J.; Nóbrega, R.L.; Gash, J.H.; Valente, F. Enhancing global rainfall interception loss estimation through vegetation structure modeling. J. Hydrol. 2024, 631, 130672. [Google Scholar] [CrossRef]
  30. Terra, M.D.C.N.; Mello, C.R.; de Mello, J.M.; de Oliveira, V.A.; Nunes, M.H.; Silva, V.O.; Alves, G.J. Stemflow in a neotropical forest remnant: Vegetative determinants, spatial distribution and correlation with soil moisture. Trees 2018, 32, 323–335. [Google Scholar] [CrossRef]
  31. Oliveira-Filho, A.T.; Scolforo, J.R.S.; Mello, J.M. Composição florística e estrutura comunitária de um remanescente de floresta semidecídua montana em Lavras, MG. Braz. J. Bot. 1994, 17, 167–182. [Google Scholar]
  32. Agee, E.; He, L.; Bisht, G.; Couvreur, V.; Shahbaz, F.M.; Gough, C.M.; Matheny, A.M.; Bohrer, G.; Ivanov, V. Root lateral interactions drive water uptake patterns under water limitation. Adv. Water Resour. 2021, 151, 103896. [Google Scholar] [CrossRef]
  33. Pedroni, F.; Sanchez, M.; Santos, F.A. Fenologia da copaíba (Copaifera langsdorffii Desf. Leguminosae, Caesalpinioideae) em uma floresta semidecídua no sudeste do Brasil. Braz. J. Bot. 2002, 25, 183–194. [Google Scholar] [CrossRef]
  34. INPE Painel El Niño 2023-2024 BOLETIM MENSAL, No. 05 2024. Available online: https://dataserver.cptec.inpe.br/dataserver_diptc/web/Painel-Elnino/2023-2024/painel_el_nino_boletim_mensal_no_05.pdf (accessed on 10 July 2024).
  35. Barbosa, R.A.; de Faria, R.S.; da Silveira, L.J.; Dias, H.C.T.; Pimenta, L.V.A.; de Souza, C.M.; Ferreira, A.C.S. Variação Temporal Da Umidade Do Solo Sob Diferentes Coberturas Vegetais. Rev. Ifes Ci. 2019, 5, 11–23. [Google Scholar]
  36. Xiao, L.; Xue, S.; Liu, G.B.; Zhang, C. Soil moisture variability under different land uses in the Zhifanggou catchment of the Loess Plateau, China. Arid Land Res. Manag. 2014, 28, 274–290. [Google Scholar] [CrossRef]
  37. Carranza, C.; Nolet, C.; Pezij, M.; van der Ploeg, M. Root zone soil moisture estimation with Random Forest. J. Hydrol. 2021, 593, 125840. [Google Scholar] [CrossRef]
  38. Liu, D.; She, D. The effect of fracture properties on preferential flow in carbonate-derived laterite from karst moun tainous agroforestry lands. Soil Till Res. 2020, 203, 104670. [Google Scholar] [CrossRef]
  39. Luo, Z.; Niu, J.; Xie, B.; Zhang, L.; Chen, X.; Berndtsson, R.; Du, J.; Ao, J.; Yang, L.; Zhu, S. Influence of root distribution on preferential flow in deciduous and coniferous Forest soils. Forests 2019, 10, 986. [Google Scholar] [CrossRef]
  40. Lin, H.; Zhou, X. Evidence of subsurface preferential flow using soil hydrologic monitoring in the Shale Hills catchment. Eur. J. Soil Sci. 2008, 59, 34–49. [Google Scholar] [CrossRef]
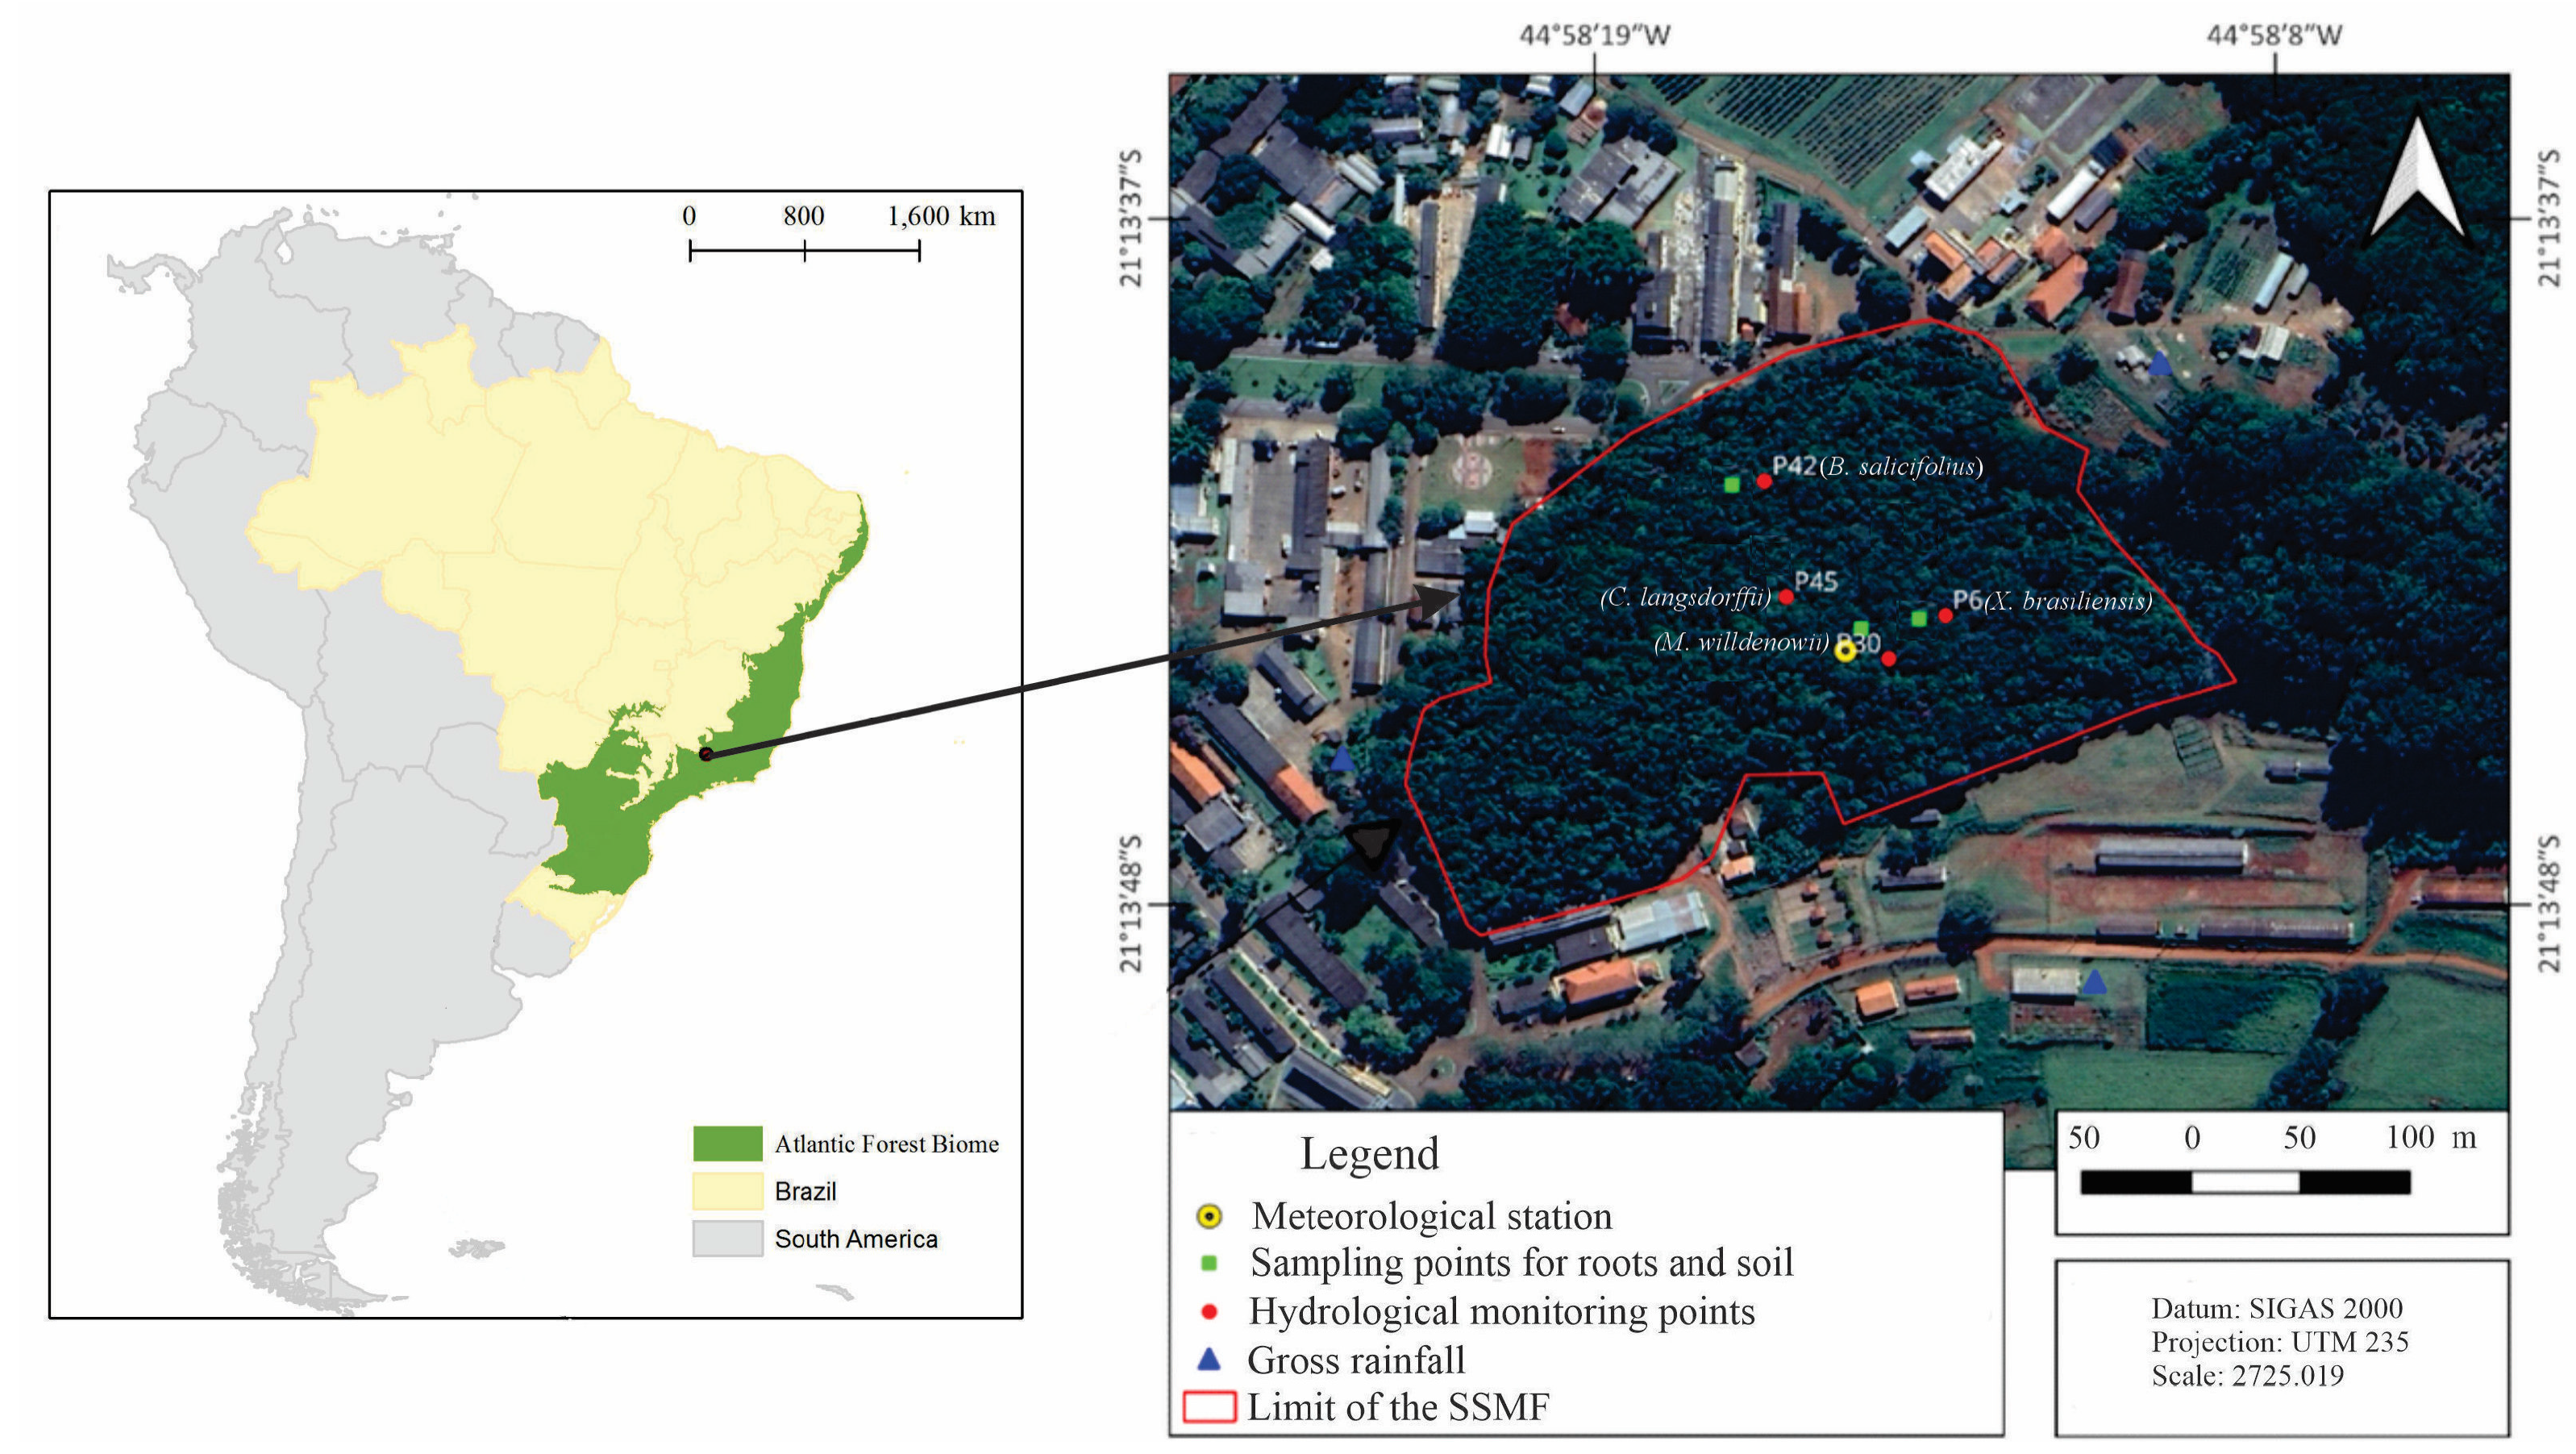
Figure 1. Geographical location of the MSSF, meteorological station (tower), and monitoring trees for gross rainfall (GP), throughfall (TF), stemflow (SF), soil moisture, and soil sampling for root characterization.
Forests 16 00812 g001
Figure 2. Photos of instrumentation used: pluviometer, stemflow, and soil moisture sensor (clockwise).
Forests 16 00812 g002
Figure 3. Root sampling by monoliths inside the MSSF (a) and root diameter categories (b).
Forests 16 00812 g003
Figure 4. Average and standard deviation of the root weight (kg m−3) in each diameter category (mm) (a) and total root weight (kg m−3) at each soil layer obtained for the MSSF (average from the three sampled monoliths) (b).
Forests 16 00812 g004
Figure 5. Monthly time series of water balance elements (a) and violin graphics of the variables (effective precipitation—EP, soil water storage—SWS, canopy interception—CI, and variation in soil water storage—ΔW) (b) in each studied tree of the SSMF during the period from April to September 2023.
Forests 16 00812 g005
Figure 6. Heatmaps of SWS (mm) in M. willdenowii (a), C. langsdorfii (b), X. brasiliensis (c), and B. salicifolius (d) and the average SWS distribution in depth (e) for the trees studied during the study period in MSSF.
Forests 16 00812 g006
Figure 7. Monthly ETwb for the species evaluated in MSSF.
Forests 16 00812 g007
Figure 8. Root distribution and SWS for each studied tree (a) and Ksat distribution in the soil profile in MSSF (b).
Forests 16 00812 g008
Figure 9. CVt and CVs (temporal and in-depth soil moisture variability) and stability indicators of soil moisture in depth (a) and average relative difference and Temporal Stability Index (TSI) (b) considering the trees studied in MSSF between April and September/2023.
Forests 16 00812 g009
Table 1. Characteristics of the studied forest species.
Scientific NamePopular Name in BrazilHeight-H (m)DBH (cm)
Blepharocalyx salicifolius (Kunth)Murta12.019.50
Copaifera langsdorffii (Desf.)Copaíba16.432.10
Miconia willdenowii (Klotzsch ex Naudin)Miconia prateada12.523.10
Xylopia brasiliensis (Spreng.)Pindaíba15.435.00
Table 2. AGB values and CI and ETwb accumulated by the studied trees.
SpeciesAGB (kg)CI (mm)ETwb (mm)
Blepharocalyx salicifolius (Kunth)14.3144.98284.27
Copaifera langsdorffii (Desf.)48.9658.84316.04
Miconia willdenowii (Klotzsch ex Naudin)20.4158.84331.43
Xylopia brasiliensis (Spreng.)54.5288.35278.96
Disclaimer/Publisher’s Note: The statements, opinions and data contained in all publications are solely those of the individual author(s) and contributor(s) and not of MDPI and/or the editor(s). MDPI and/or the editor(s) disclaim responsibility for any injury to people or property resulting from any ideas, methods, instructions or products referred to in the content.