Article

Forest Resilience and Vegetation Dynamics in Southwest Nigeria: Spatiotemporal Analysis and Assessment of Influencing Factors Using Geographical Detectors and Trend Models

Chongqing Engineering Research Center for Remote Sensing Big Data Application, Chongqing Jinfo Mountain National Field Scientific Observation and Research Station for Karst Ecosystem, School of Geographical Sciences, Southwest University, Chongqing 400715, China
*
Author to whom correspondence should be addressed.
Forests 2025, 16(5), 811; https://doi.org/10.3390/f16050811
Submission received: 9 April 2025 / Revised: 7 May 2025 / Accepted: 9 May 2025 / Published: 13 May 2025
(This article belongs to the Section Forest Inventory, Modeling and Remote Sensing)

Abstract

:
The Southwest Region (SWR) is one of Nigeria’s six geo-political zones and comprises six distinct states. It holds considerable significance due to its unique geographical features, economic vibrancy, pastoral heritage, and fragile natural ecosystems. These ecosystems are becoming increasingly susceptible to human activities and the adverse impacts of climate change. This study analyzed the temporal and spatial variations of the Normalized Difference Vegetation Index (NDVI) in relation to key influencing factors in the SWR from 2001 to 2020. The analytical methods included Sen’s slope estimator, the Mann–Kendall trend test, and the Geographical Detector Model (GDM). The analysis revealed significant spatial variability in vegetation cover, with dense vegetation concentrated in the eastern part of the region and low vegetation coverage overall, reflected by an average NDVI value of 0.45, indicating persistent vegetation stress. Human activities, particularly land use and land cover (LULC) changes, were identified as major drivers of vegetation loss in some states such as Ekiti, Lagos, Ogun, and Ondo. Conversely, Osun and Oyo exhibited signs of vegetation recovery, suggesting the potential for restoration. The study found that topographic factors, including slope and elevation, as well as climatic variables like precipitation, influenced vegetation patterns. However, the impact of these factors was secondary to LULC dynamics. The interaction detection analysis further highlighted the cumulative effect of combined anthropogenic and environmental factors on vegetation distribution, with the interaction between LULC and topography being particularly significant. These findings provide essential insights into the biological condition of the SWR and contribute to advancing the understanding of vegetation patterns with critical implications for the sustainable management and conservation of tropical forest ecosystems.

1. Introduction

Plant life is essential to terrestrial ecosystems as they link different ecological components such as the atmosphere, soil, and water. Its presence is crucial for maintaining the balance among these components, highlighting the interdependence of our environment. This interconnection is vital for regulating regional climates, supporting human communities, capturing carbon, producing oxygen, conserving biodiversity, and delivering other crucial ecological services. Consequently, vegetation creates a solid basis for both natural ecosystems and the well-being of humans [1,2]. Observing and evaluating extensive, long-lasting shifts in vegetation are essential for improving ecological conservation initiatives and comprehending global changes. By concentrating on these elements, we can strengthen our research efforts and better safeguard our environment for generations to come [3].
The NDVI is an important tool for assessing alterations in vegetation coverage across extensive regions and can signify the presence and growth of surface vegetation [4]. Additionally, it allows for the monitoring of shifts in vegetation and understanding how weather and climate events affect human communities [5,6,7]. Among the most widely used and accessible NDVI data are the NDVI data from the Advanced Very High-Resolution Radiometer (AVHRR), MODIS, and SPOT-VGT [8,9]. Although using different NDVI products can result in some differences in the results, they are nevertheless very useful for studying large-scale changes in vegetation cover and the factors that generate them, as well as for classifying land cover [10]. Globally, there has been a discernible increase in vegetative activity [11].
Linear regression analysis is an important approach in this field [12,13], along with correlation analysis [14] and trend analysis, which combines Sen’s slope estimator with the Mann–Kendall significance test for a thorough evaluation of data trends [15]. Numerous factors influence the distribution and variations in vegetation cover over time and area, making trend analysis more challenging. The trend analysis approach that uses the Mann–Kendall significance test in conjunction with Sen’s slope estimator is resilient to shifts in the distribution of data and the impact of outliers, demonstrating its capacity to assess trends quantitatively over extended periods of time. This method has been utilized in various studies concerning climate change, vegetation changes, and environmental monitoring, among other areas [16,17]. The SWR serves Nigeria’s main economic center and an essential ecological barrier [18]. This region is crucial for Nigeria’s sustainable development, impacting its economic growth and ecological balance. Strategies have been implemented to tackle the issues of rapid urbanization, industrial growth, and environmental preservation, which align with national development plans. The SWR’s agricultural productivity and industrial centers highlight the region’s importance to Nigeria’s progress and ecological resilience [19]. Recent initiatives have highlighted the importance of promoting green infrastructure, minimizing land degradation, and creating economic opportunities to strengthen the region’s position as a catalyst for national growth and environmental protection.
Variability in vegetation is influenced by both natural and human forces. Regression analysis and partial correlation have been successfully used in numerous studies to examine the factors influencing changes in vegetation coverage [20]. These techniques offer a helpful perspective by suggesting a linear relationship between vegetation and other environmental conditions. The elements that influence vegetation growth in the environment are intricate, and a straightforward linear relationship might not exist. The geographical detector (Geo-detector) can be used to identify the main elements influencing spatial variations and to look at how the different factors interact with one another [21,22,23]. The geographical detector method can effectively identify the key determinants influencing vegetation dynamics in the SWR to offer valuable insights into the factors shaping its distribution and variability.
A multitude of studies have been undertaken by researchers to analyze the temporal variations in vegetation dynamics by employing NDVI time series as a key methodology. Their research has made a substantial contribution to our comprehension of vegetation dynamics [24,25,26,27]. Previous studies found that the key climatic components influencing the response of the NDVI vary depending on the area, vegetation structure, composition, and the research methods used [28,29]. An examination of Africa’s NDVI anomalies revealed notable declines in biomass production in the eastern, western, and southern areas, while the center half showed an increase in vegetation activities from 1981 to 1999 [30,31]. It has been demonstrated that Africa has experienced the fastest rate of vegetation change, with many areas already impacted by a variety of ecological problems [32,33,34]. Like other tropical regions of Africa, Nigeria’s natural vegetation is being threatened by global environmental change [35,36]. Temperature and rainfall are vital in influencing vegetation growth and are key elements that greatly affect the development of plants [37,38,39]. A spatiotemporal NDVI analysis in Nigeria showed that the savanna region, which is largely dependent on seasonal rainfall, has experienced substantial vegetation decline due to prolonged periods of drought and increasing temperatures [40].
In the SWR, studies like the one conducted in Oyo town have primarily investigated the impact of urban expansion on the NDVI and land surface temperature, which emphasized the role of built-up areas in vegetation cover changes [41]. Similarly, research in Osogbo and Akure has focused on urban vegetation cover and its influence on land surface temperature, without delving into the combined effects of climate and topography on the NDVI [42]. Studies such as the one conducted in Ibadan have primarily examined the influence of climate and land use dynamics on NDVI variability, with a particular focus on how elevation and slope shape vegetation distribution in the southwest region of Nigeria [43]. These studies provide valuable insights; however, they often lack a comprehensive approach that considers the interplay between climatic factors (temperature and precipitation) and topographic features (elevation, slope, and aspect) across the entire SWR.
This gap emphasizes the necessity for a region-wide, integrative analysis. Therefore, the current research aimed to fill this gap by employing a multi-method framework that combines Sen’s slope, the Mann–Kendall trend test, and the GDM to analyze the spatiotemporal patterns of the NDVI and assess how both climatic and topographic factors influence vegetation dynamics across the entire SWR. This study is unique in its spatial breadth, spanning all six states of the region, and in its analytical depth, integrating interaction detection to reveal the compounded effects of human activities, topography, and climate on vegetation. Unlike prior studies that treat influencing factors in isolation or within limited locales, this research offers a holistic view, which is crucial for generating actionable knowledge for ecosystem conservation, land management policies, and sustainable development planning in the face of ongoing environmental change.

2. Materials and Methods
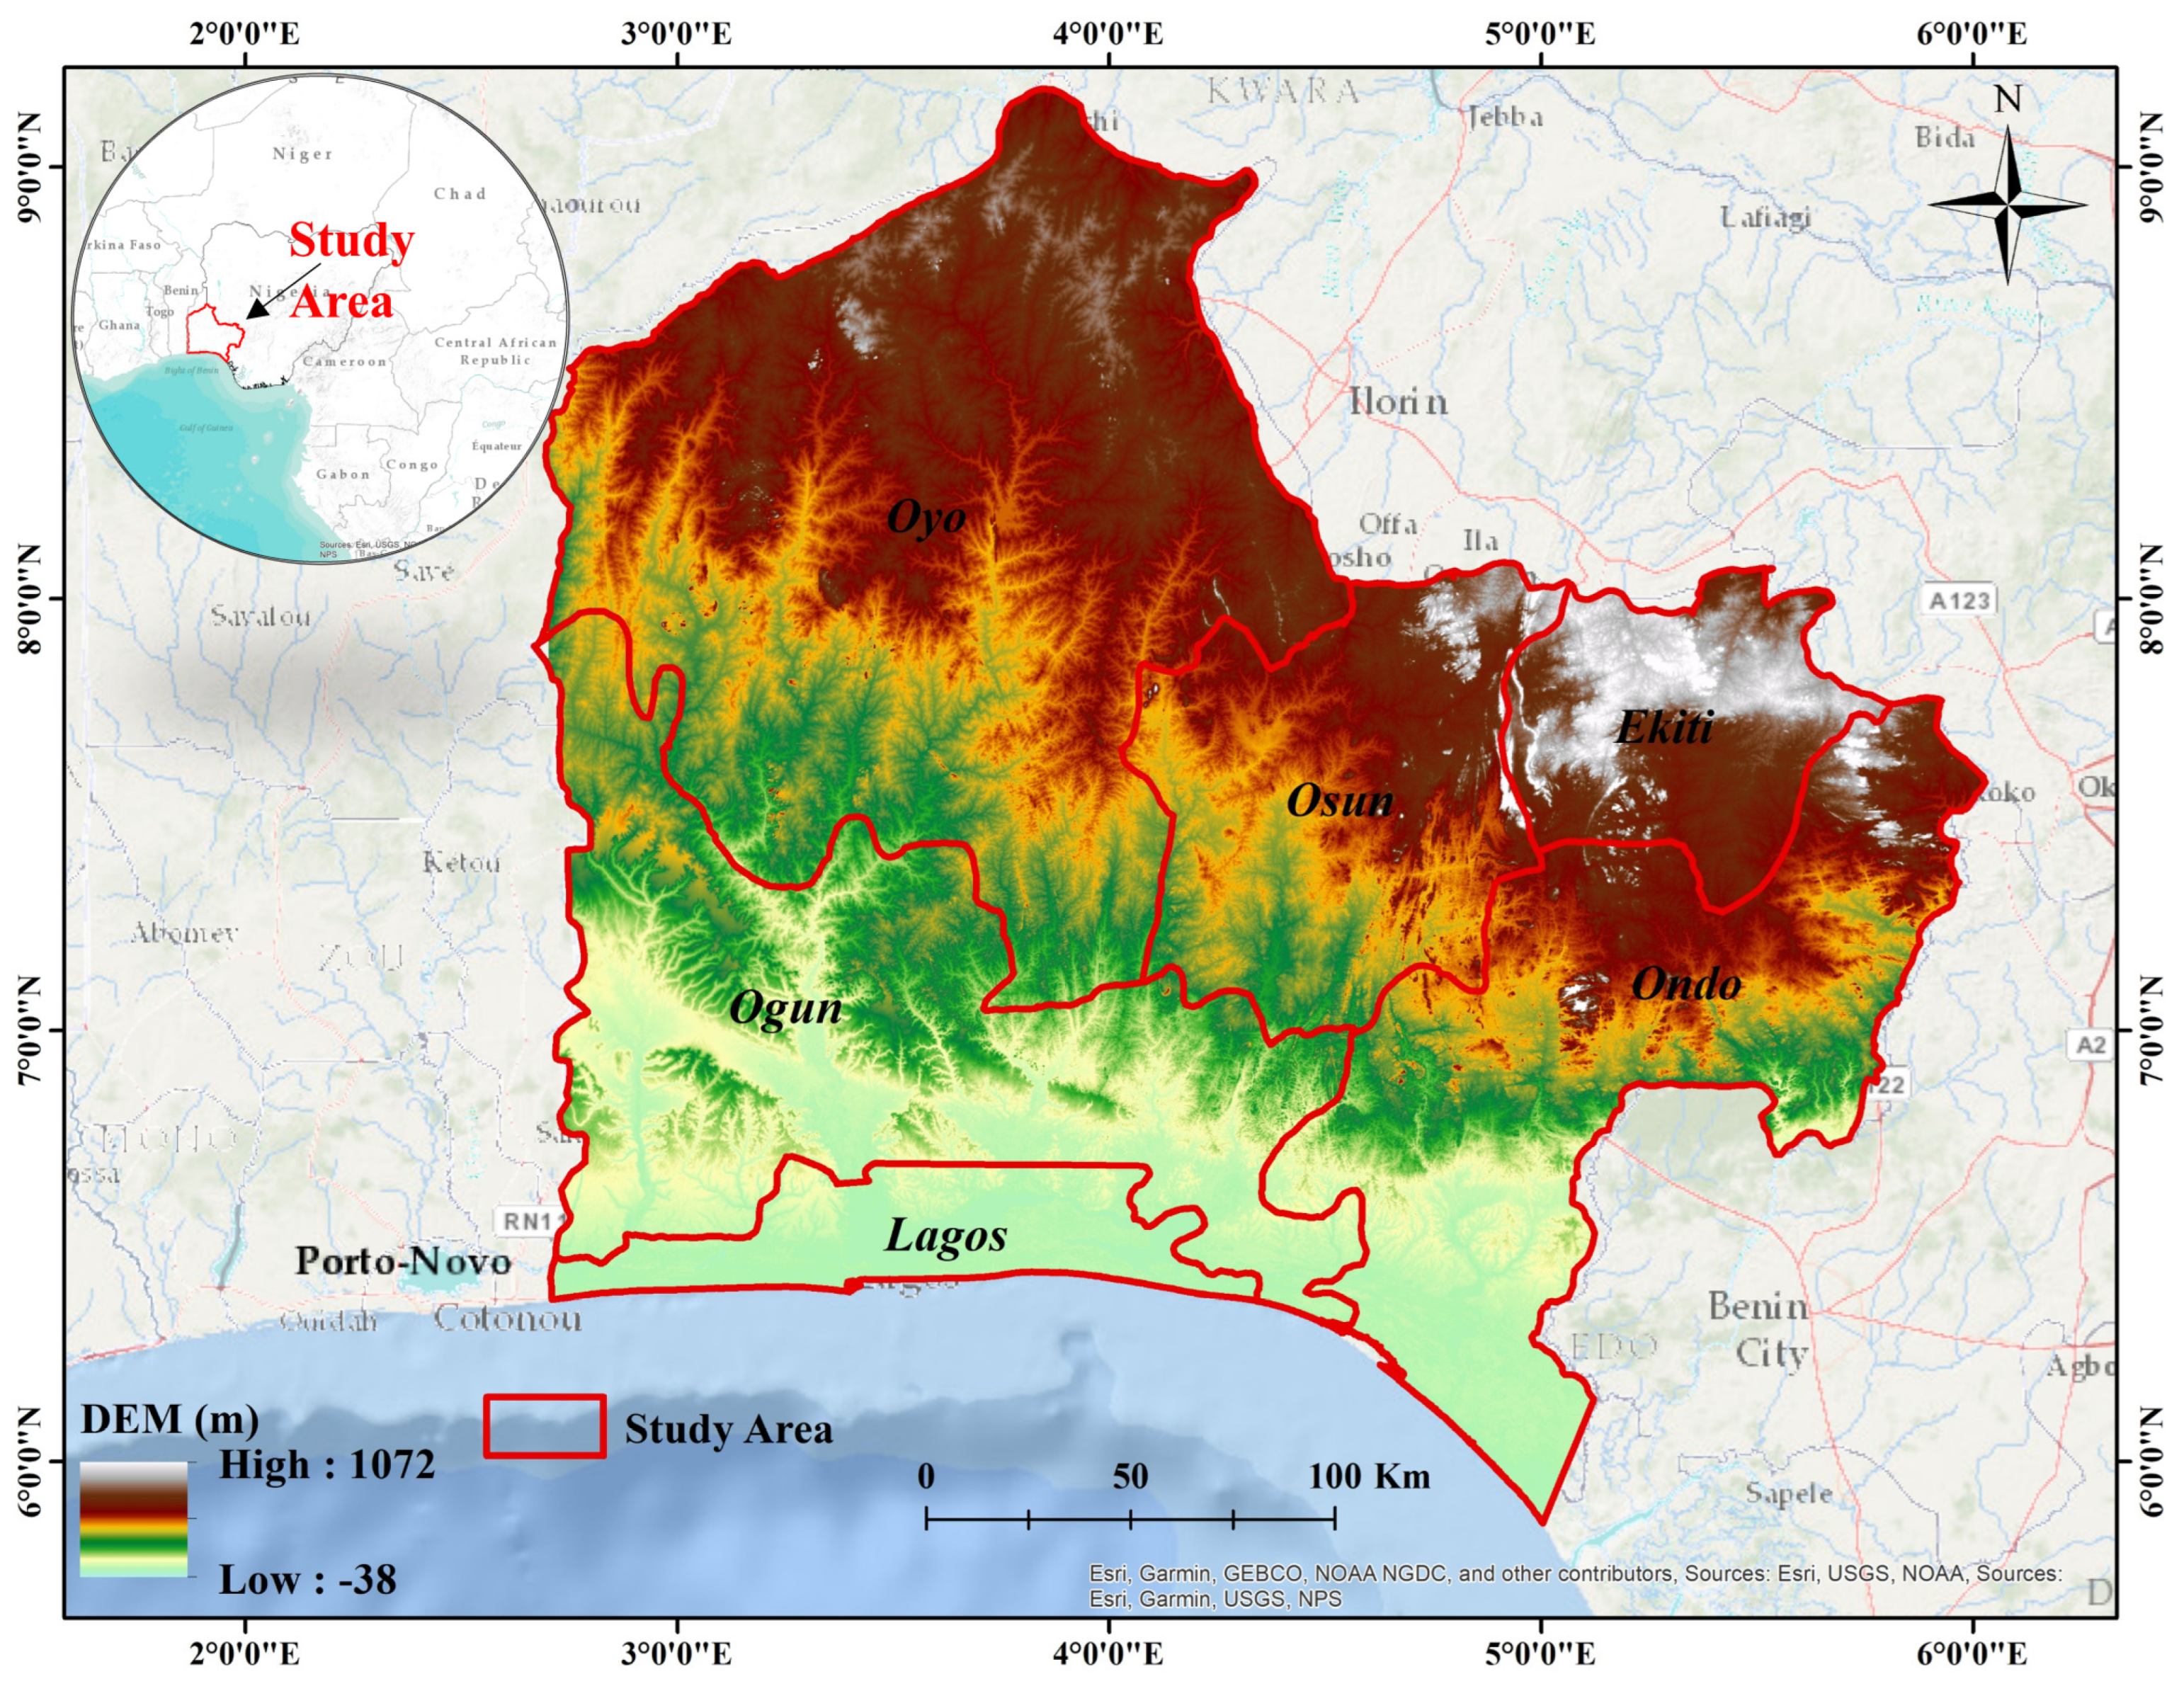
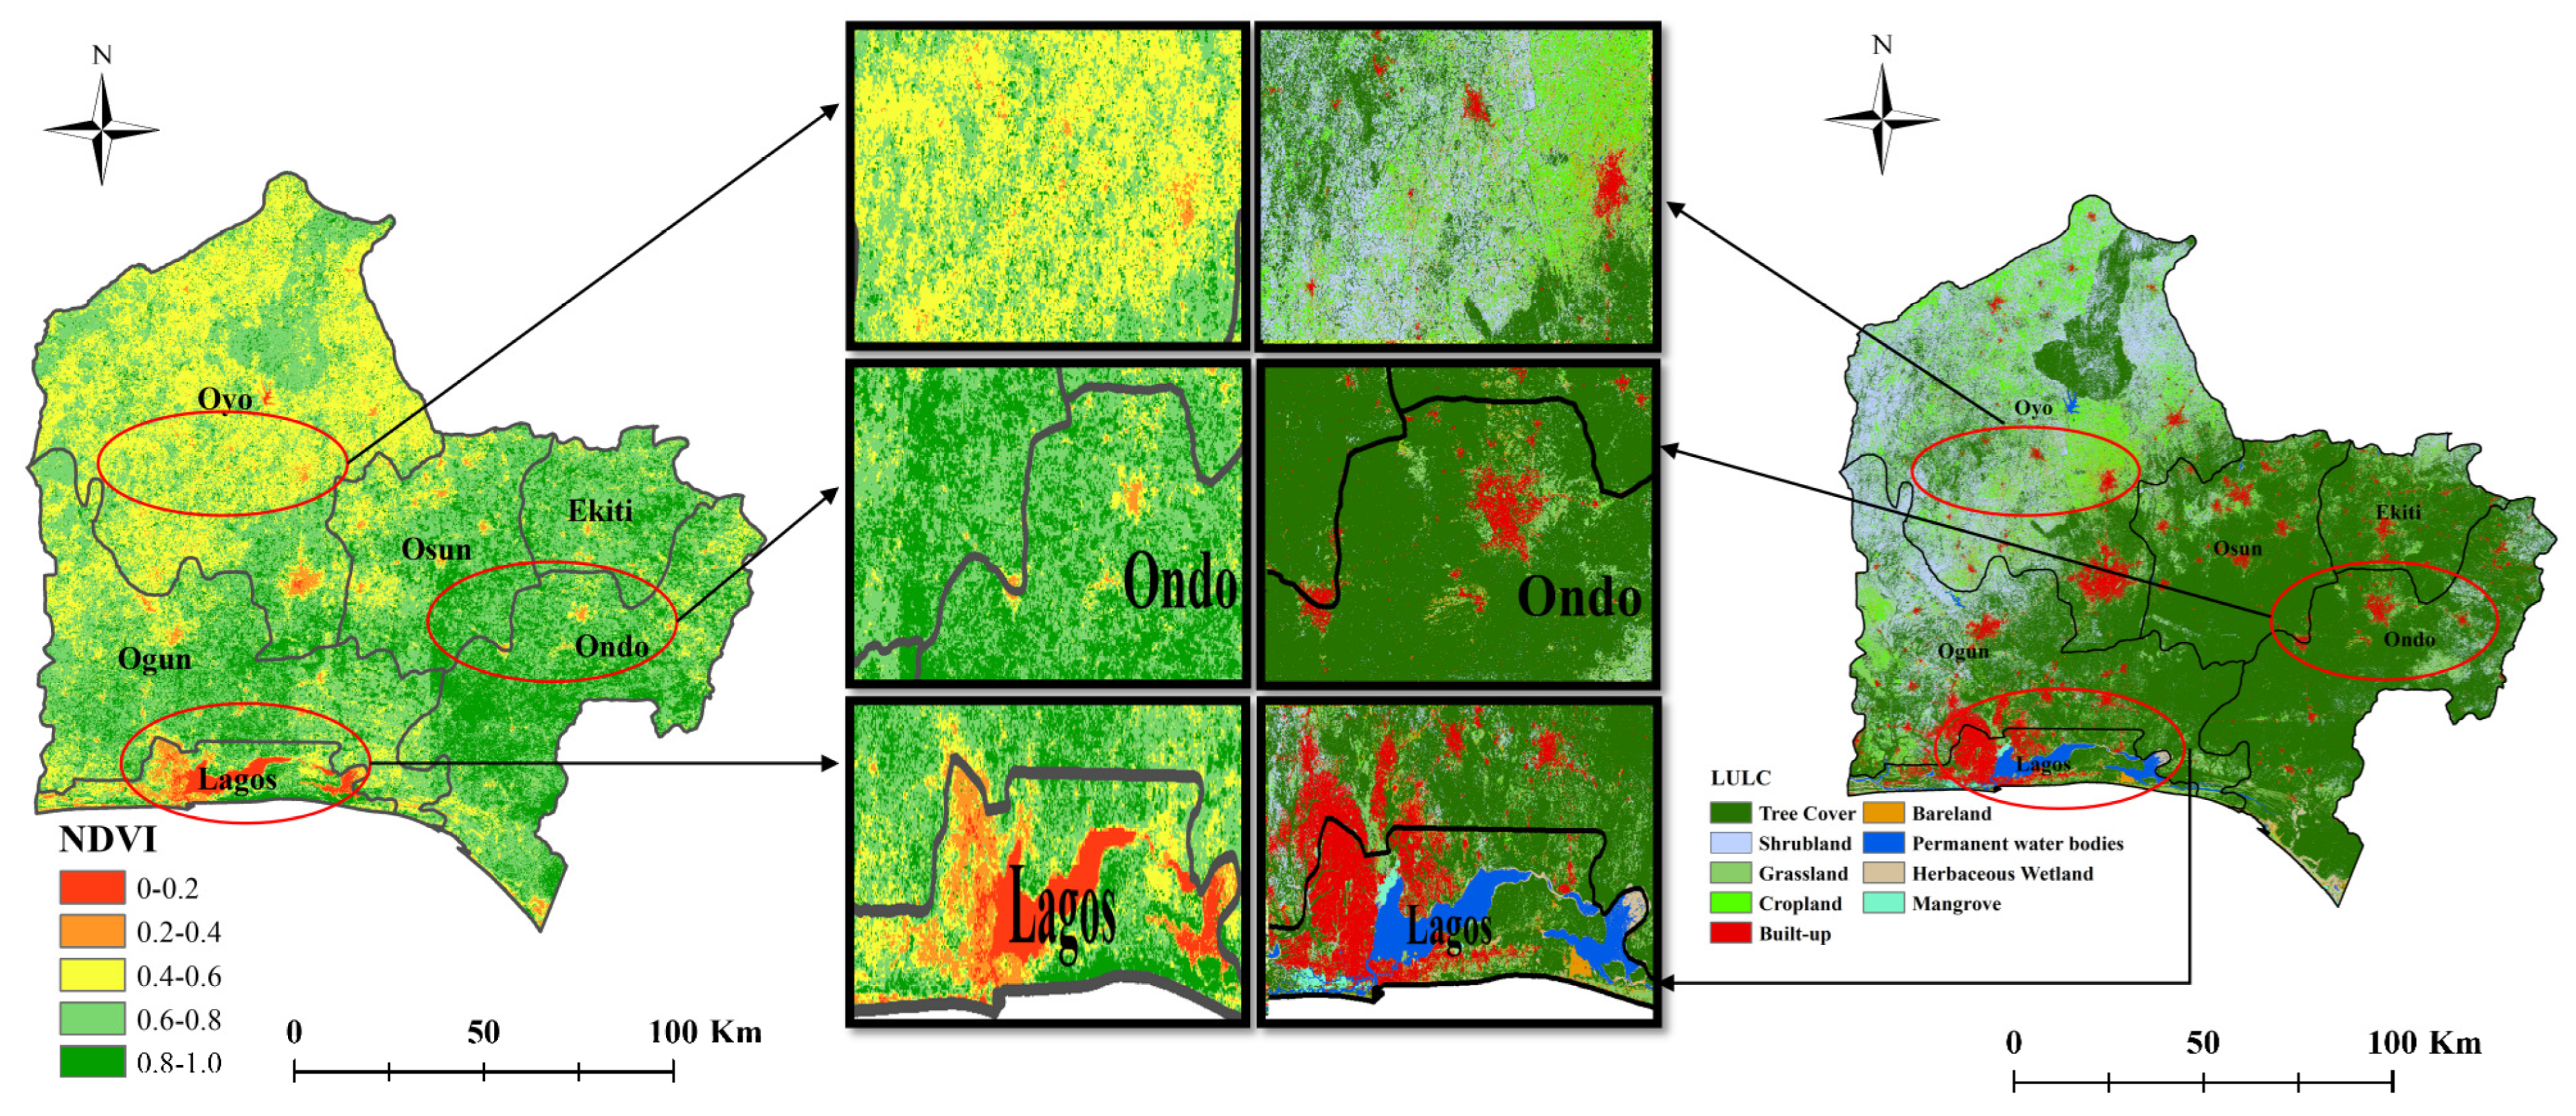
2.1. Study Area

The SWR is one of six geopolitical zones in Nigeria [44]. Lagos, Ogun, Oyo, Ekiti, Osun, and Ondo are its six constituent states and it spans approximately 191,843 square kilometers [45] (Figure 1). Its geographic boundaries are the Gulf of Guinea to the south, the Republic of Benin to the west, Delta and Edo states to the east, and Kwara and Kogi states to the north. The region is located between 3° E and 7° E longitude and 4° N and 9° N latitude Akure [46]. The SWR hosts a diverse range of industries, including manufacturing, finance, telecommunications, and services [47]. Urban centers like Lagos, which serves as a commercial and financial hub, dominate the region, alongside other rapidly urbanizing cities such as Ibadan, Abeokuta, and Akure [48]. With distinct wet and dry seasons controlled by the movement of the intertropical convergence zone (ITCZ), the area has a humid tropical climate. The southern coastline experiences 2500 mm of rainfall annually, while the northern regions receive 1200 mm. The typical temperature is between 25 °C and 35 °C [49]. The vegetation primarily consists of tropical rainforest in the southern areas and transitioning to derived savanna in the north, providing a rich biodiversity and serving as a critical resource for agriculture, timber, and non-timber products [50].

2.2. Datasets

This study employed MODIS NDVI data, the Digital Elevation Model (DEM), annual mean temperature data, precipitation datasets, LULC data, and administrative boundary data. All datasets were resampled to a uniform spatial resolution of 250 m using the nearest neighbor interpolation approach to establish consistency across the raster layers (Table 1; Figure 2). Below is a detailed explanation of the data sources and their specific characteristics.
It is commonly acknowledged that the NDVI is a crucial measure of the amount of vegetation in terrestrial ecosystems [51]. The NASA LAADS DAAC portal provided the MOD13Q1 NDVI data used in this investigation. The dataset, featuring a spatial resolution of 250 m and a time span of January 2001 to December 2020, is ideal for examining vegetation dynamics over time. Three key preprocessing steps were applied to the NDVI data using GIS and remote sensing techniques. These included data reprojection and reformatting, correction of negative NDVI values, and the generation of monthly NDVI composites. Further details on these processes are provided in Section 2.3.1 and Equation (A1) in Appendix A.
Weather greatly impacts vegetation dynamics, especially when it comes to temperature and precipitation variations, which are crucial for vegetative development and phenological patterns. This study examined 20 years of data obtained from 21 meteorological stations operated by the Nigeria Meteorological Agency (NIMET). Monthly records of rainfall and temperature were analyzed using ArcGIS 10.8; the data were converted into shapefiles (.shp) for spatial analysis. Both ordinary kriging and cokriging were utilized to interpolate the average precipitation and estimate the temperature throughout the study area. Altitude was incorporated as a covariate in the cokriging model given its recognized impact on temperature gradients. These geostatistical methods have been extensively employed in climate studies for the spatial interpolation of meteorological variables [52,53]. This methodology enabled a detailed analysis of the spatiotemporal variations in precipitation and temperature while accounting for elevation differences between the monitoring stations. The generated interpolation maps provided insights into the function of various climatic variables in vegetation dynamics by showing their spatial distribution throughout the research region.
The DEM is an essential resource for generating precise representations of the Earth’s surface, effectively capturing topographical and terrain features. It facilitates the derivation of various topographic attributes, morphometric characteristics, and geomorphometric parameters [54]. This investigation utilized DEM data obtained from the Shuttle Radar Topography Mission (SRTM). The dataset covers the entirety of Nigeria at a spatial resolution of 30 m. These DEM data are produced by the SRTM initiative and are provided as individual tiles [55,56], ensuring high-resolution elevation information for comprehensive spatial analyses.
LULC is strongly correlated with NDVI values, as diverse land use categories significantly influence the ecological conditions that govern vegetation growth. This study utilized LULC data from the ESA World Cover 10 m v100 dataset for the year 2020. The dataset was preprocessed and accessed via the Google Earth Engine (GEE) platform; it classifies land cover into 11 distinct categories: tree cover, shrubland, grassland, cropland, urban areas, bare or sparsely vegetated land, snow and ice, permanent water bodies, herbaceous wetlands, mangroves, and moss and lichen. This classification provides detailed insights into land cover types, highlighting their role in shaping human activities and influencing vegetation patterns.
The boundary specifications for the SWR were obtained from the Nigerian National Space Research and Development Agency (NASRDA). This dataset plays a crucial role in defining the geographical boundaries and understanding the spatial context of the study area, enabling accurate spatial analysis and interpretation of regional dynamics.

2.3. Methodology

The research methodology employed a structured framework, as outlined in Figure 3. This method enabled a systematic analysis of the data, ensuring consistency in merging the various datasets and in using the analytical techniques.

2.3.1. MVC Technique and Annual Variation for NDVI Enhancement

The MVC method was employed to determine the highest NDVI value for each pixel over a specified period [57]. This technique effectively reduces the impact of persistent cloud cover, residual mist, cloud shadows, and terrain shadows. The process was implemented using the Layer Stacking and Band Math tools available in ENVI 5.3 software [58]. For each pixel, the highest NDVI value for each month was chosen, which was used to create a monthly NDVI dataset. The dataset was then extracted using the Batch Extraction module in ENVI 5.3 using a vector map of the study area [58]. Data consistency was ensured by reprojection using the Projections and Transformation module within ArcGIS 10.3.
The amount of vegetation cover change over time is influenced by the yearly variation in the NDVI [59]. An average annual NDVI time series was used for the regional and temporal analyses, and further relationships between vegetation changes and climatic parameters were explored. Full details of the statistical formulas used in this analysis are available in Appendix A.

2.3.2. Sen’s Slope and Mann–Kendall Test

Sen’s slope is a well-established statistical method that estimates the median rate of change within a time series. It effectively quantifies both the magnitude and direction of trends, making it a robust tool for identifying gradual changes in datasets. This method effectively minimizes the impact of outliers and anomalies, ensuring reliable results despite variations in data quality. It has found extensive application across various fields, including vegetation science, meteorology, hydrology, and ecology, owing to its robustness and simplicity. Sen’s slope approach is frequently combined with the Mann–Kendall significance test to further improve the dependability of the trend analysis. One non-parametric method for determining whether a trend in a dataset has statistical significance is the Mann–Kendall test. It is extremely flexible because it does not require any assumptions on the distribution of the data. By examining the sequence of data points, it identifies temporal patterns and accurately confirms the existence of trends. When used together, these methods create a comprehensive framework for evaluating long-term trends in time series data. Using Sen’s slope in combination with the Mann–Kendall test offers several benefits: it effectively manages data irregularities, withstands outliers, and does not rely on any assumptions regarding the data distribution. These characteristics render this combined approach essential for accurately analyzing trends in complex datasets in long-term environmental studies [60,61]. This approach offers a useful framework for examining the temporal and spatial fluctuations of the NDVI over a long period [12,62]. This assessment was based on published research findings and highlights the spatiotemporal changes in vegetation over the analyzed timeframe [60,63]. The detailed statistical equations and computation steps used in this analysis are provided in Appendix A.
Sen’s slope estimator and the Mann–Kendall test were used in the trend analysis to ascertain the NDVI trends’ magnitude and significance, as shown in Table 2.

2.3.3. Geographic Detector

The geographic detector is an advanced statistical tool that analyzes spatial heterogeneity [64]. Its core approach involves dividing the study area into subregions based on various explanatory variables and then analyzing the spatial variance both within and between these subregions. This comparison determines the significance of the factors that drive the observed spatial patterns. The methodology is made up of four fundamental components: factor detection, risk detection, interaction detection, and ecological detection. Factor detection is essential since it determines the relative influence of numerous geographic factors, providing vital insights into their implications on total spatial analysis. In this work, factor and interaction detection were used to determine the spatial factors impacting vegetation changes in the SWR. Factor detection assessed the impact of several driving factors on NDVI spatial heterogeneity. The statistical formula used in this analysis is provided in Appendix A.
The interaction detector determines the relative contributions of the two drivers, X 1 and X 2 , to the NDVI by comparing their q-values to the q-value of their interaction. This comparison allows for the investigation of the interaction types between the drivers. The evaluation of these interactions is based on the intervals outlined in Table 3, which provide a framework for understanding the strength and significance of each interaction in influencing the spatial patterns of the NDVI. This process helps in identifying whether the drivers act independently or exhibit combined effects on the vegetation dynamics.
In this study, the main factors of vegetation cover were found to be elevation, aspect, slope, average annual precipitation, average annual temperature, and human effects such as LULC. These factors were designated as X 1 to X 6 , with vegetation coverage represented as Y . Both X and Y were utilized as inputs for the geographic detector, with data standardized to a uniform spatial resolution of 250 m. Since the geographic detector requires classified data for the analysis and the factors were continuous variables, the discretization method proposed in [65] was employed. The Optimal Parameters-based Geographic Detector (OPGD) algorithm optimizes discretization parameters within the R programming environment. The purpose of the ‘category’ column in Table 4 is to clarify the classification methodology applied to each influencing factor. The choice of methods was based on the properties of each dataset and the analytical needs of the research. Natural breaks were used for elevation to identify clusters within the continuous data. Slope, aspect, and LULC were manually classified, allowing for adjustments to thresholds based on terrain characteristics and local land use. Temperature and precipitation were classified using equal intervals to ensure uniform category ranges for spatial comparisons. Table 4 summarizes the categories for each factor, and Figure 4 displays the resulting discretized influencing factors (X1 to X6). A fishnet grid was created using the “Create Fishnet” tool in ArcGIS, with each cell measuring 250 m × 250 m to align with the spatial resolution of the NDVI, temperature, and precipitation datasets. LULC data were available at a finer resolution of 10 m; it was aggregated to a resolution of 250 m using a majority rule to maintain the dominant land cover characteristics within each grid cell. This resolution was chosen to prevent resampling of coarser datasets and to ensure consistency across all layers. The Spatial Analyst “Sample” tool was then employed to extract variable values at the centroid of each grid cell. The compiled dataset was subsequently utilized in the Geographic Detector model to analyze the spatial heterogeneity and the influence of various factors throughout the study area.
The factors affecting vegetation distribution including temperature, precipitation, elevation, slope, aspect, and LULC were divided into specific categories based on established literature benchmarks and the statistical distribution of the values within the study region (Figure 4). This division improves the understanding of spatial trends and facilitates multi-factor spatial analysis by converting continuous variables into comparable thematic layers. The classification process was informed by ecological thresholds and remote sensing standards pertinent to vegetation response modeling. These categorized layers create a strong foundation for overlay analysis, regression modeling, and suitability evaluations in GIS-based environmental research.
Addressing the various uncertainties, data quality, and discretization techniques is essential in factor analysis using geographic detectors. Systematically reducing these uncertainties improves the precision and dependability of the analysis, resulting in more reliable and valid results.

3. Results

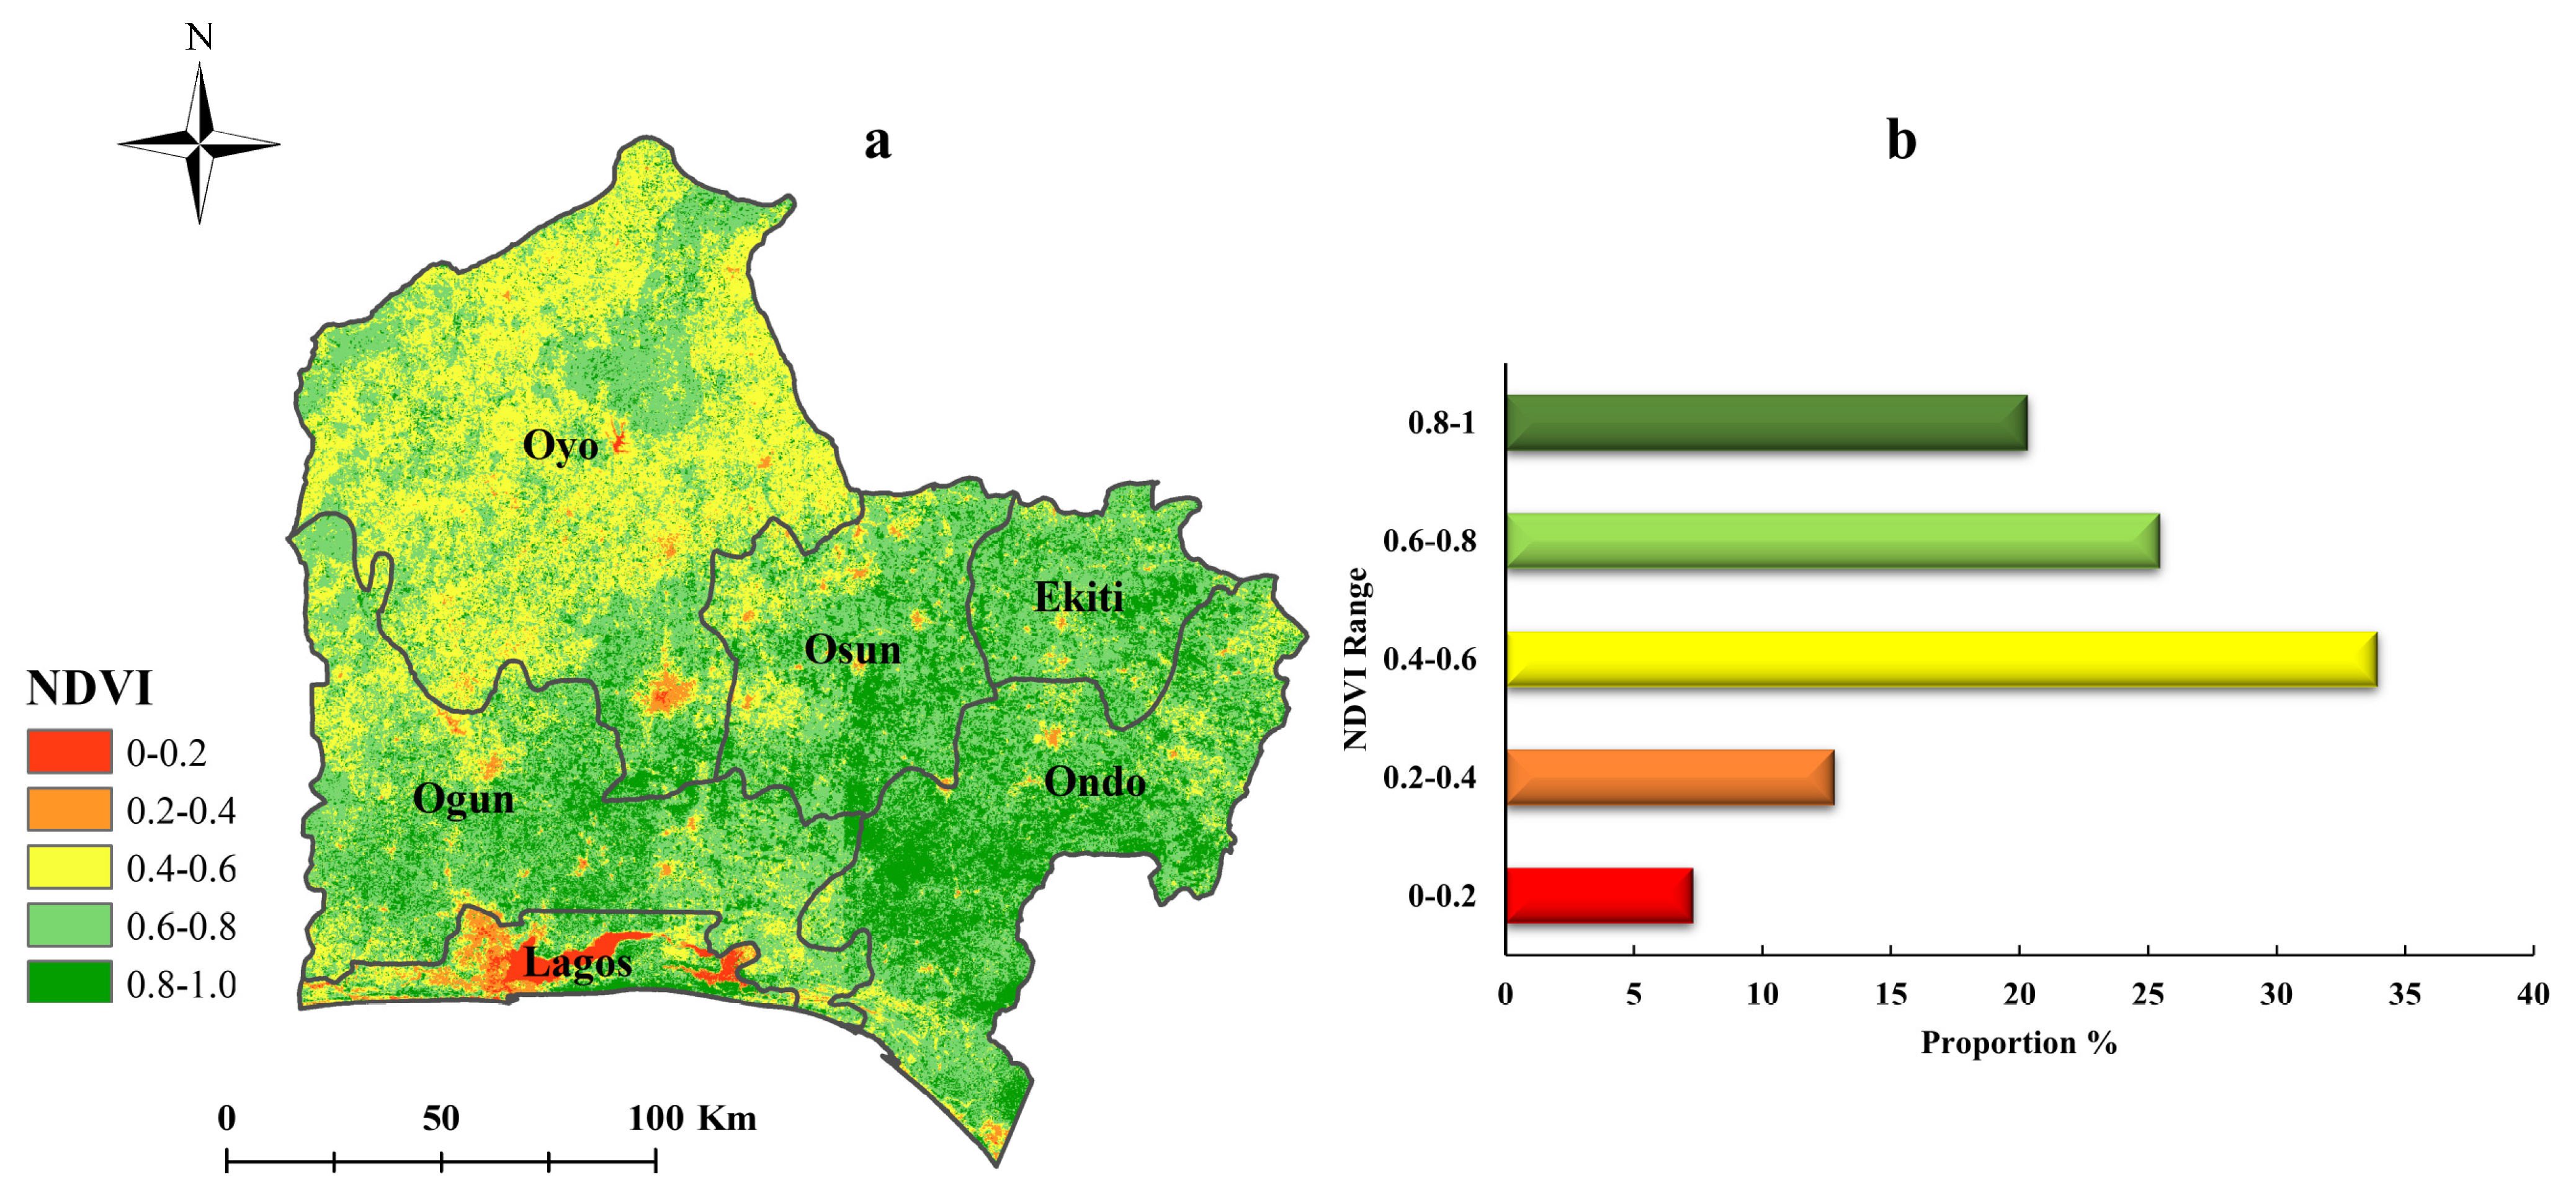
3.1. Temporal and Spatial Variation in NDVI

The SWR is distinguished by its rich forest resources and expansive agricultural landscapes. Using spatial analysis visualization tools, a distribution map was generated to depict the average NDVI across the region from 2001 to 2020 (Figure 5a). According to the NDVI map, the vegetation density decreased from the southeast toward the north and southwest of the study area.
According to the graph (Figure 5b), the proportions of low vegetation coverage (0–0.2), relatively low vegetation coverage (0.2–0.4), medium vegetation coverage (0.4–0.6), relatively high vegetation coverage (0.6–0.8), and high vegetation coverage (0.8–1) in the SWR were 7.3%, 12.8%, 33.93%, 25.45%, and 20.32%. The results revealed notable spatial heterogeneity in the NDVI distribution, with higher vegetation coverage concentrated in the eastern parts of the region while the southern and northern areas displayed relatively lower coverage. The average NDVI of the SWR was 0.45, indicating low vegetation coverage across the region. This result is consistent with earlier studies on the geographic variability in vegetation cover [66,67,68].
The LULC data analysis showed that there were regions with scant vegetation in central Lagos and most parts of Oyo State. These regions feature significant land use in the form of permanent water bodies, urban development, and agricultural activities. Regions with considerable vegetation cover mainly occurred in the southeastern parts of Osun, the western areas of Ondo, and the eastern sections of Ekiti, where forest cover was the major land use type.
A review of the interannual NDVI variation, shown in Figure 6, revealed a moderate vegetation cover across the study area between 2001 and 2020, with considerable year-to-year fluctuations. The peak NDVI values appeared in 2002 and 2019, reaching 0.45. The lowest value occurred in 2020 at 0.40. Notably, widespread decreases in NDVI values appeared from 2019 to 2020, indicating unique low inflection points and highlighting the dynamic changes in vegetation cover over the study period.
Several studies identify human activities and extreme weather events as key drivers of changes in vegetation cover in the SWR [42,69]. The observed low inflection points in NDVI values can be linked to the effects of these occurrences on vegetative growth and ecological stability. Deforestation, urban expansion, and agricultural intensification significantly reduced vegetation cover by converting natural landscapes into non-porous surfaces, leading to long-term declines in NDVI values. These human-induced pressures accelerated vegetation loss, disrupted ecosystem integrity and functioning, and intensified the cumulative impacts of natural disasters and extreme weather events on the environment. This interplay between natural and anthropogenic factors emphasizes the dynamic and complex nature of vegetation cover changes in the SWR, highlighting the need for integrated approaches to monitor and mitigate these influences [68,70,71].
In 2005, a notable decline in vegetation growth occurred, as shown in the analysis of critical events throughout the research period (Figure 6). The reduction in vegetation cover around 2005 can be attributed to rapid urbanization and land use changes, especially in Oyo State. During this period, the increased population, infrastructure development, and expansion of residential and commercial areas led to the conversion of vegetated land into built-up zones. This shift replaced natural green cover with impervious surfaces, reducing the photosynthetic capacity of the landscape and causing a decline in NDVI values. The change highlights the growing impact of human activities on vegetation and the sensitivity of ecosystems to land cover alterations [42]. The deforestation events of early 2012, as highlighted by Fasona (2018) [72], were primarily driven by illegal logging, agricultural expansion, and urban development. Regions such as Ondo and Ekiti, known for their substantial forest reserves, experienced significant declines in vegetation growth rates. This reduction largely stemmed from unsustainable timber extraction and the conversion of forested areas into agricultural lands. Consequently, vast tracts of cropland were adversely affected, leading to reduced agricultural productivity and a notable decrease in overall vegetation cover across the SWR. These findings emphasized the interconnected impacts of human-induced activities on forest ecosystems, agricultural systems, and regional vegetation dynamics [72]. The decline in vegetation cover observed in the SWR during 2016 was largely driven by rapid urbanization and extensive infrastructure development, with the Lagos and Ogun states experiencing the most substantial impacts. Although there was a notable reduction in the vegetation growth rate, the demand for residential, commercial, and industrial land increased considerably. The increasing need for urban infrastructure and housing resulted in the widespread conversion of green spaces and agricultural lands into urbanized regions, resulting in significant ecosystem fragmentation and a decrease in vegetation cover. The reduction in NDVI values observed during 2016–2017 and in 2020 showed the cumulative effects of these urban transformations. Such successive shifts highlight the challenges posed by unplanned urban expansion, which often accelerate ecological degradation and disrupt natural landscapes. To mitigate the adverse impacts of urbanization on the region’s vegetation and ecosystem health, sustainable land-use planning and conservation measures must have been put into place [73,74]. Our evaluation suggests that after a brief decrease, the NDVI values in the research area rapidly rebounded. This resurgence can be largely attributed to an afforestation program, along with other anthropogenic interventions. Additionally, previous studies indicated that enhanced management strategies and improved agricultural practices may further elevate NDVI values [75]. The states within the SWR focus heavily on agricultural production, significantly shaping the vegetation patterns through anthropogenic agricultural practices. This has led to notable modifications and enhancements of vegetation across the area, which is visible in the landscape.

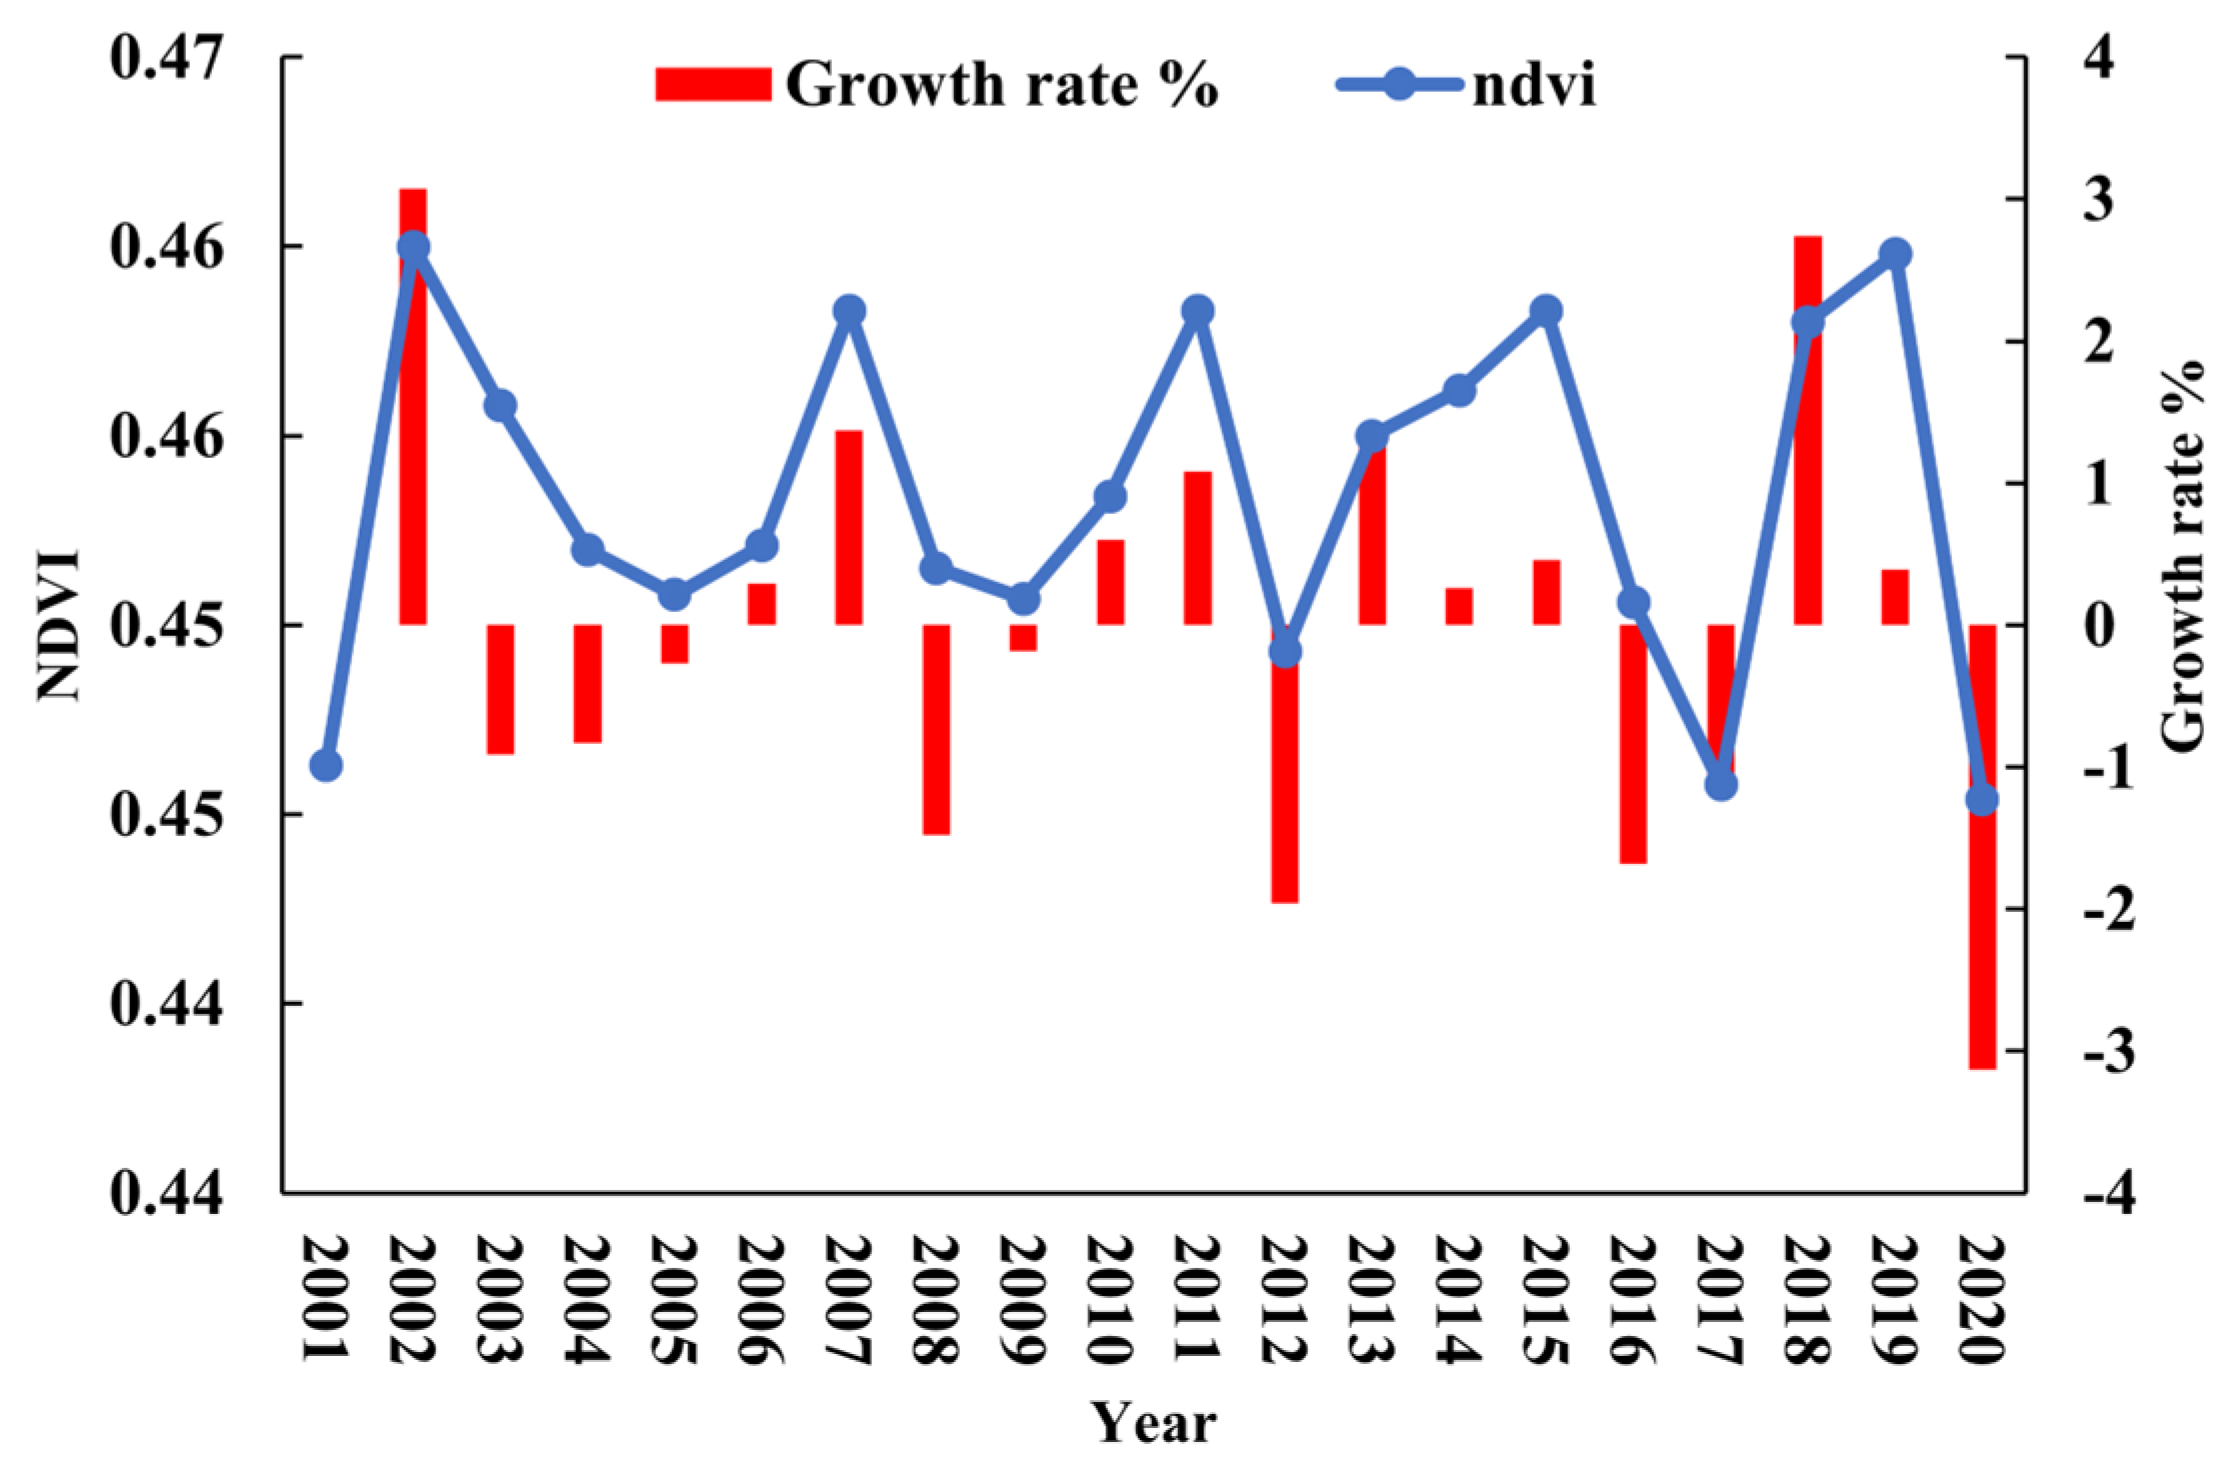
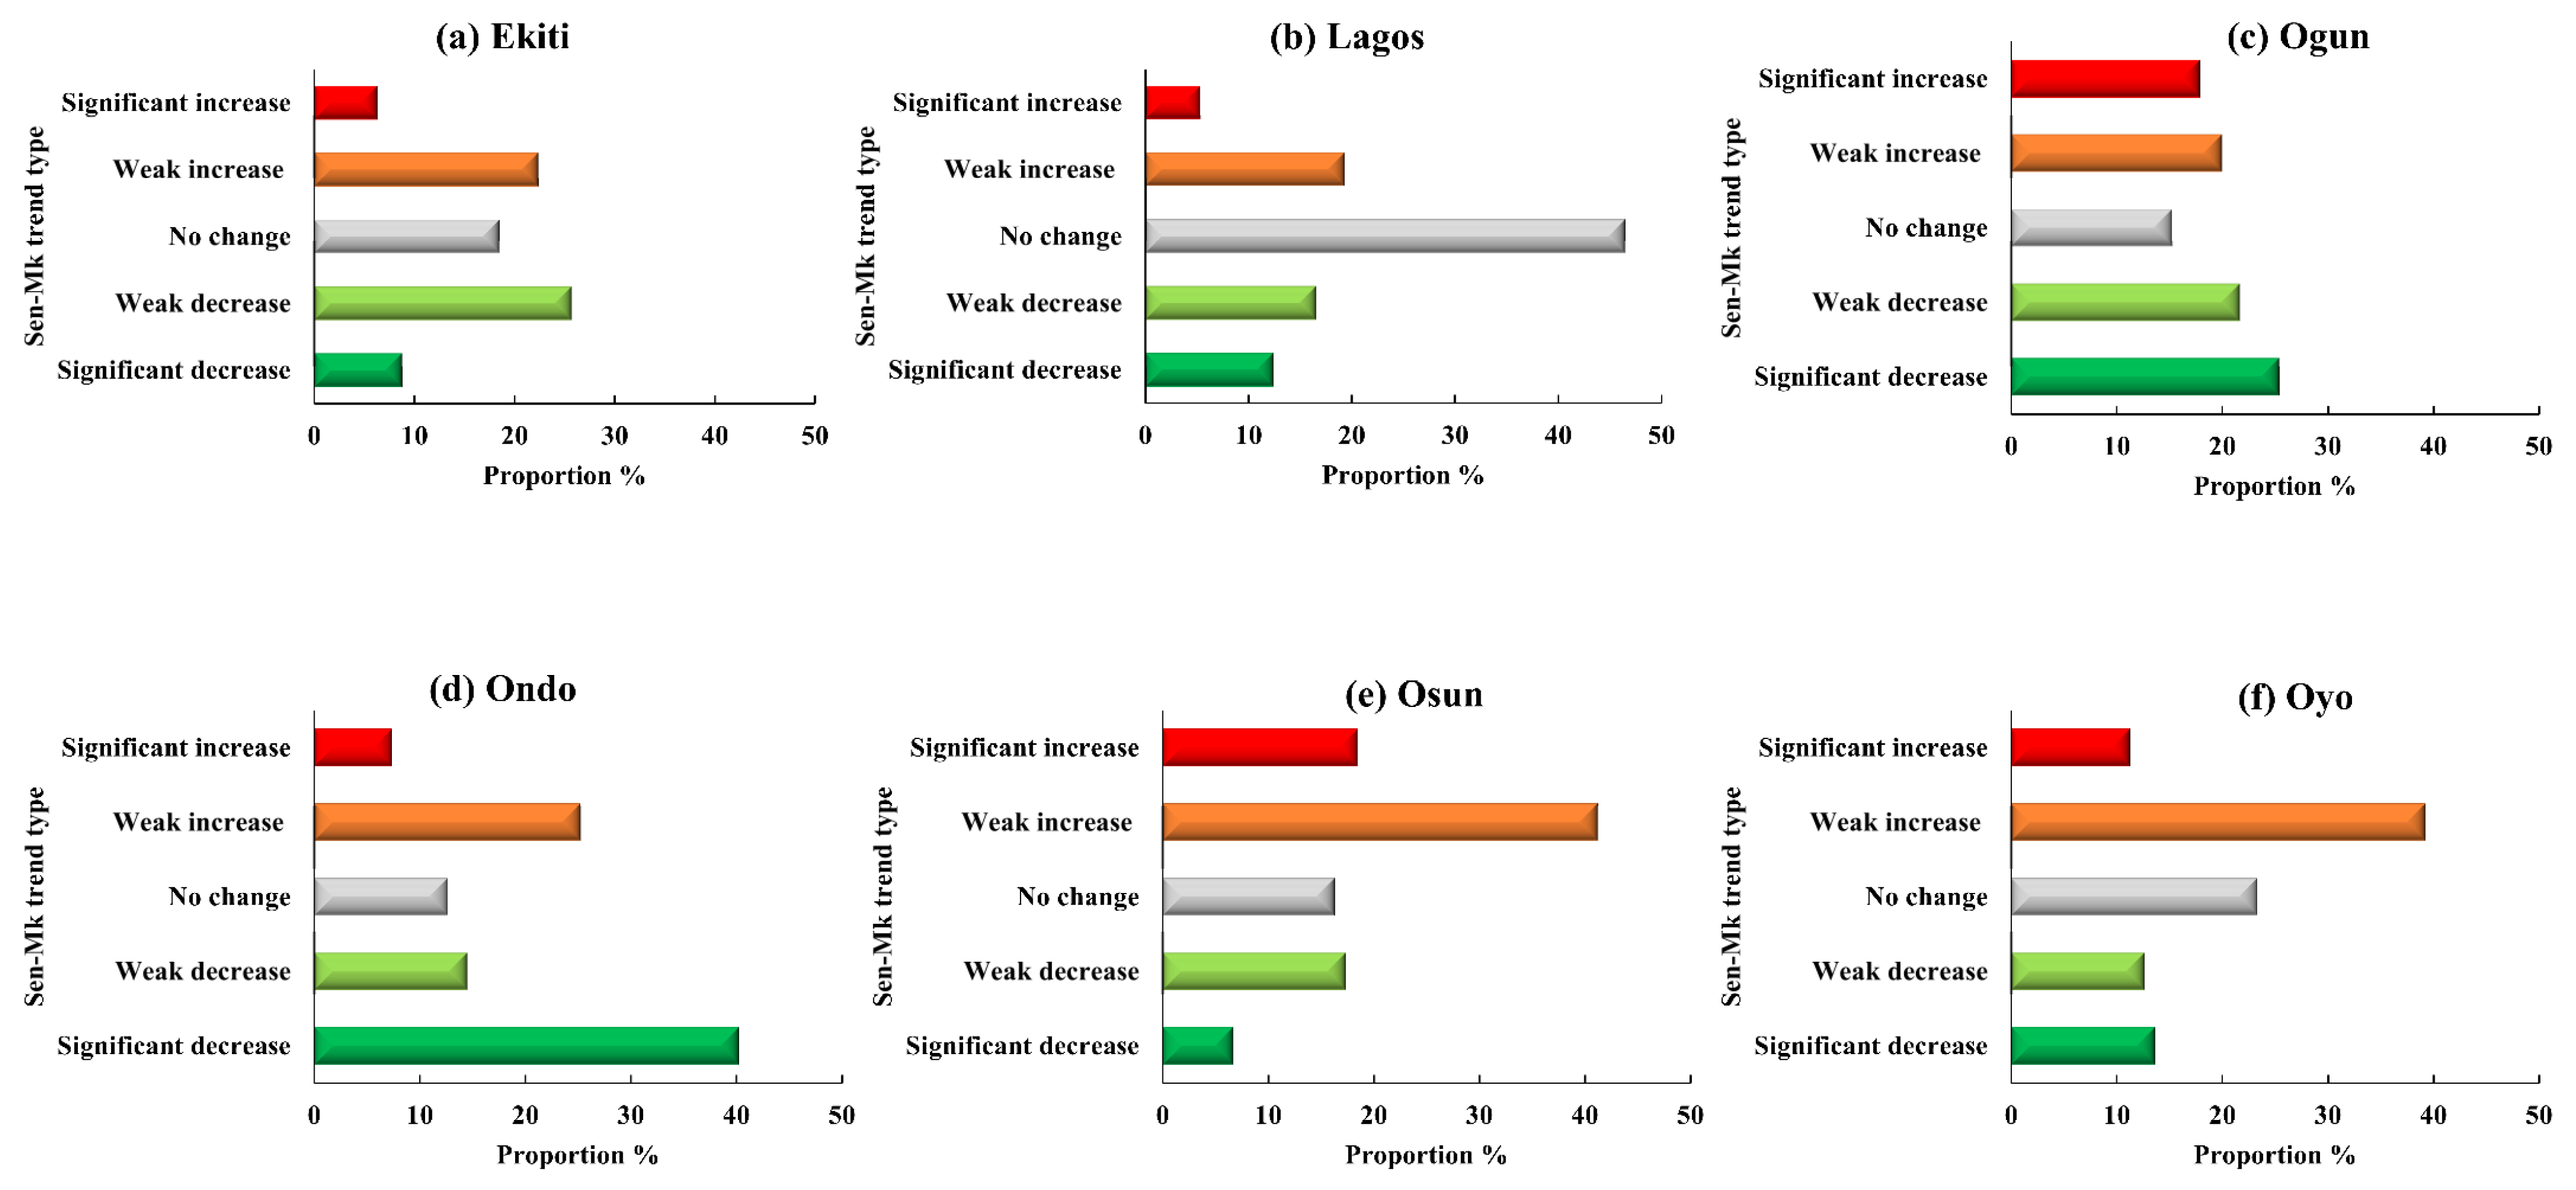
3.2. Variation Trends of NDVI

The quantitative and qualitative assessments of the vegetation coverage patterns in the SWR from 2001 to 2020 benefited from the combination of Sen’s slope estimator and the Mann–Kendall test. This combined methodology provided a comprehensive framework for analyzing long-term vegetation dynamics, ensuring both statistical rigor and clarity for the trend direction, thereby facilitating deeper insights into the regional vegetation patterns (Figure 7). Figure 7a presents the results of the Sen’s slope analysis and Figure 7b displays the outcomes of the Mann–Kendall test. In Figure 7c, the NDVI variations were classified into five trend categories (significant increase, weak increase, no change, weak decrease, and significant decrease) based on the pixel-level analysis. The percentages shown across the three figures were calculated from pixel counts obtained from raster attribute tables in ArcGIS. Since each pixel represents a uniform ground area, these percentages indicate the relative spatial extent of each trend category. The analysis revealed that 33.23% of the evaluated regions experienced a reduction in vegetation coverage, while 29.22% showed an increase. The areas experiencing degradation were primarily located in the southern part of Oyo, the southwestern part of Ondo, the southern part of Ogun, and the central part of Ekiti. Notably, the extent of degradation substantially outweighed the improvement in the other regions, indicating an overall negative trend in vegetation health. This implied that during the study period, there was a considerable disturbance of the vegetation throughout the SWR.
The significance testing results revealed a notable shift in vegetation coverage across 72.19% of the study area. Regions experiencing significant increases in vegetation coverage accounted for only 10.91% of the total area, representing the smallest trend category. These improvements were predominantly concentrated in the southwestern section of Ondo, suggesting localized gains amid a broader trend of decline or stability in the vegetation dynamics. On the other hand, regions with a weak increase in vegetation coverage made up 18.31% of the research area and were distributed fairly evenly throughout the territory. Zones showing no change in vegetation constituted 37.55%, making it the most common trend type, with a fairly even distribution. The most widespread trend, a weak decrease in vegetation coverage, affected 12.02% of the study area, with Oyo, Ondo, Ekiti, and Ogun states most notably impacted. Furthermore, a notable reduction in vegetation occurred across 21.21% of the region, primarily in the states of Ondo, Lagos, Oyo, and Ogun. Overall, the data analysis from the past two decades indicated a prevailing trend of vegetation loss within the SWR, highlighting critical areas for further ecological assessment and potential intervention.
Our analysis revealed a significant correlation between NDVI distribution and LULC dynamics [76]. Figure 8 illustrates that regions with higher vegetation indices were predominantly located in forested areas, while intermediate NDVI values were associated with agricultural lands. Conversely, lower NDVI values were primarily found in urbanized zones and permanent water bodies. The integration of the Sen-MK test trends with the LULC data highlighted notable improvements in vegetation within agricultural areas, suggesting that certain agricultural practices may have contributed positively to landscape greening. However, urbanized areas displayed varying degrees of vegetative degradation, indicating that urbanization and economic development, driven by anthropogenic activities, may have adversely affected the vegetation cover [77,78].

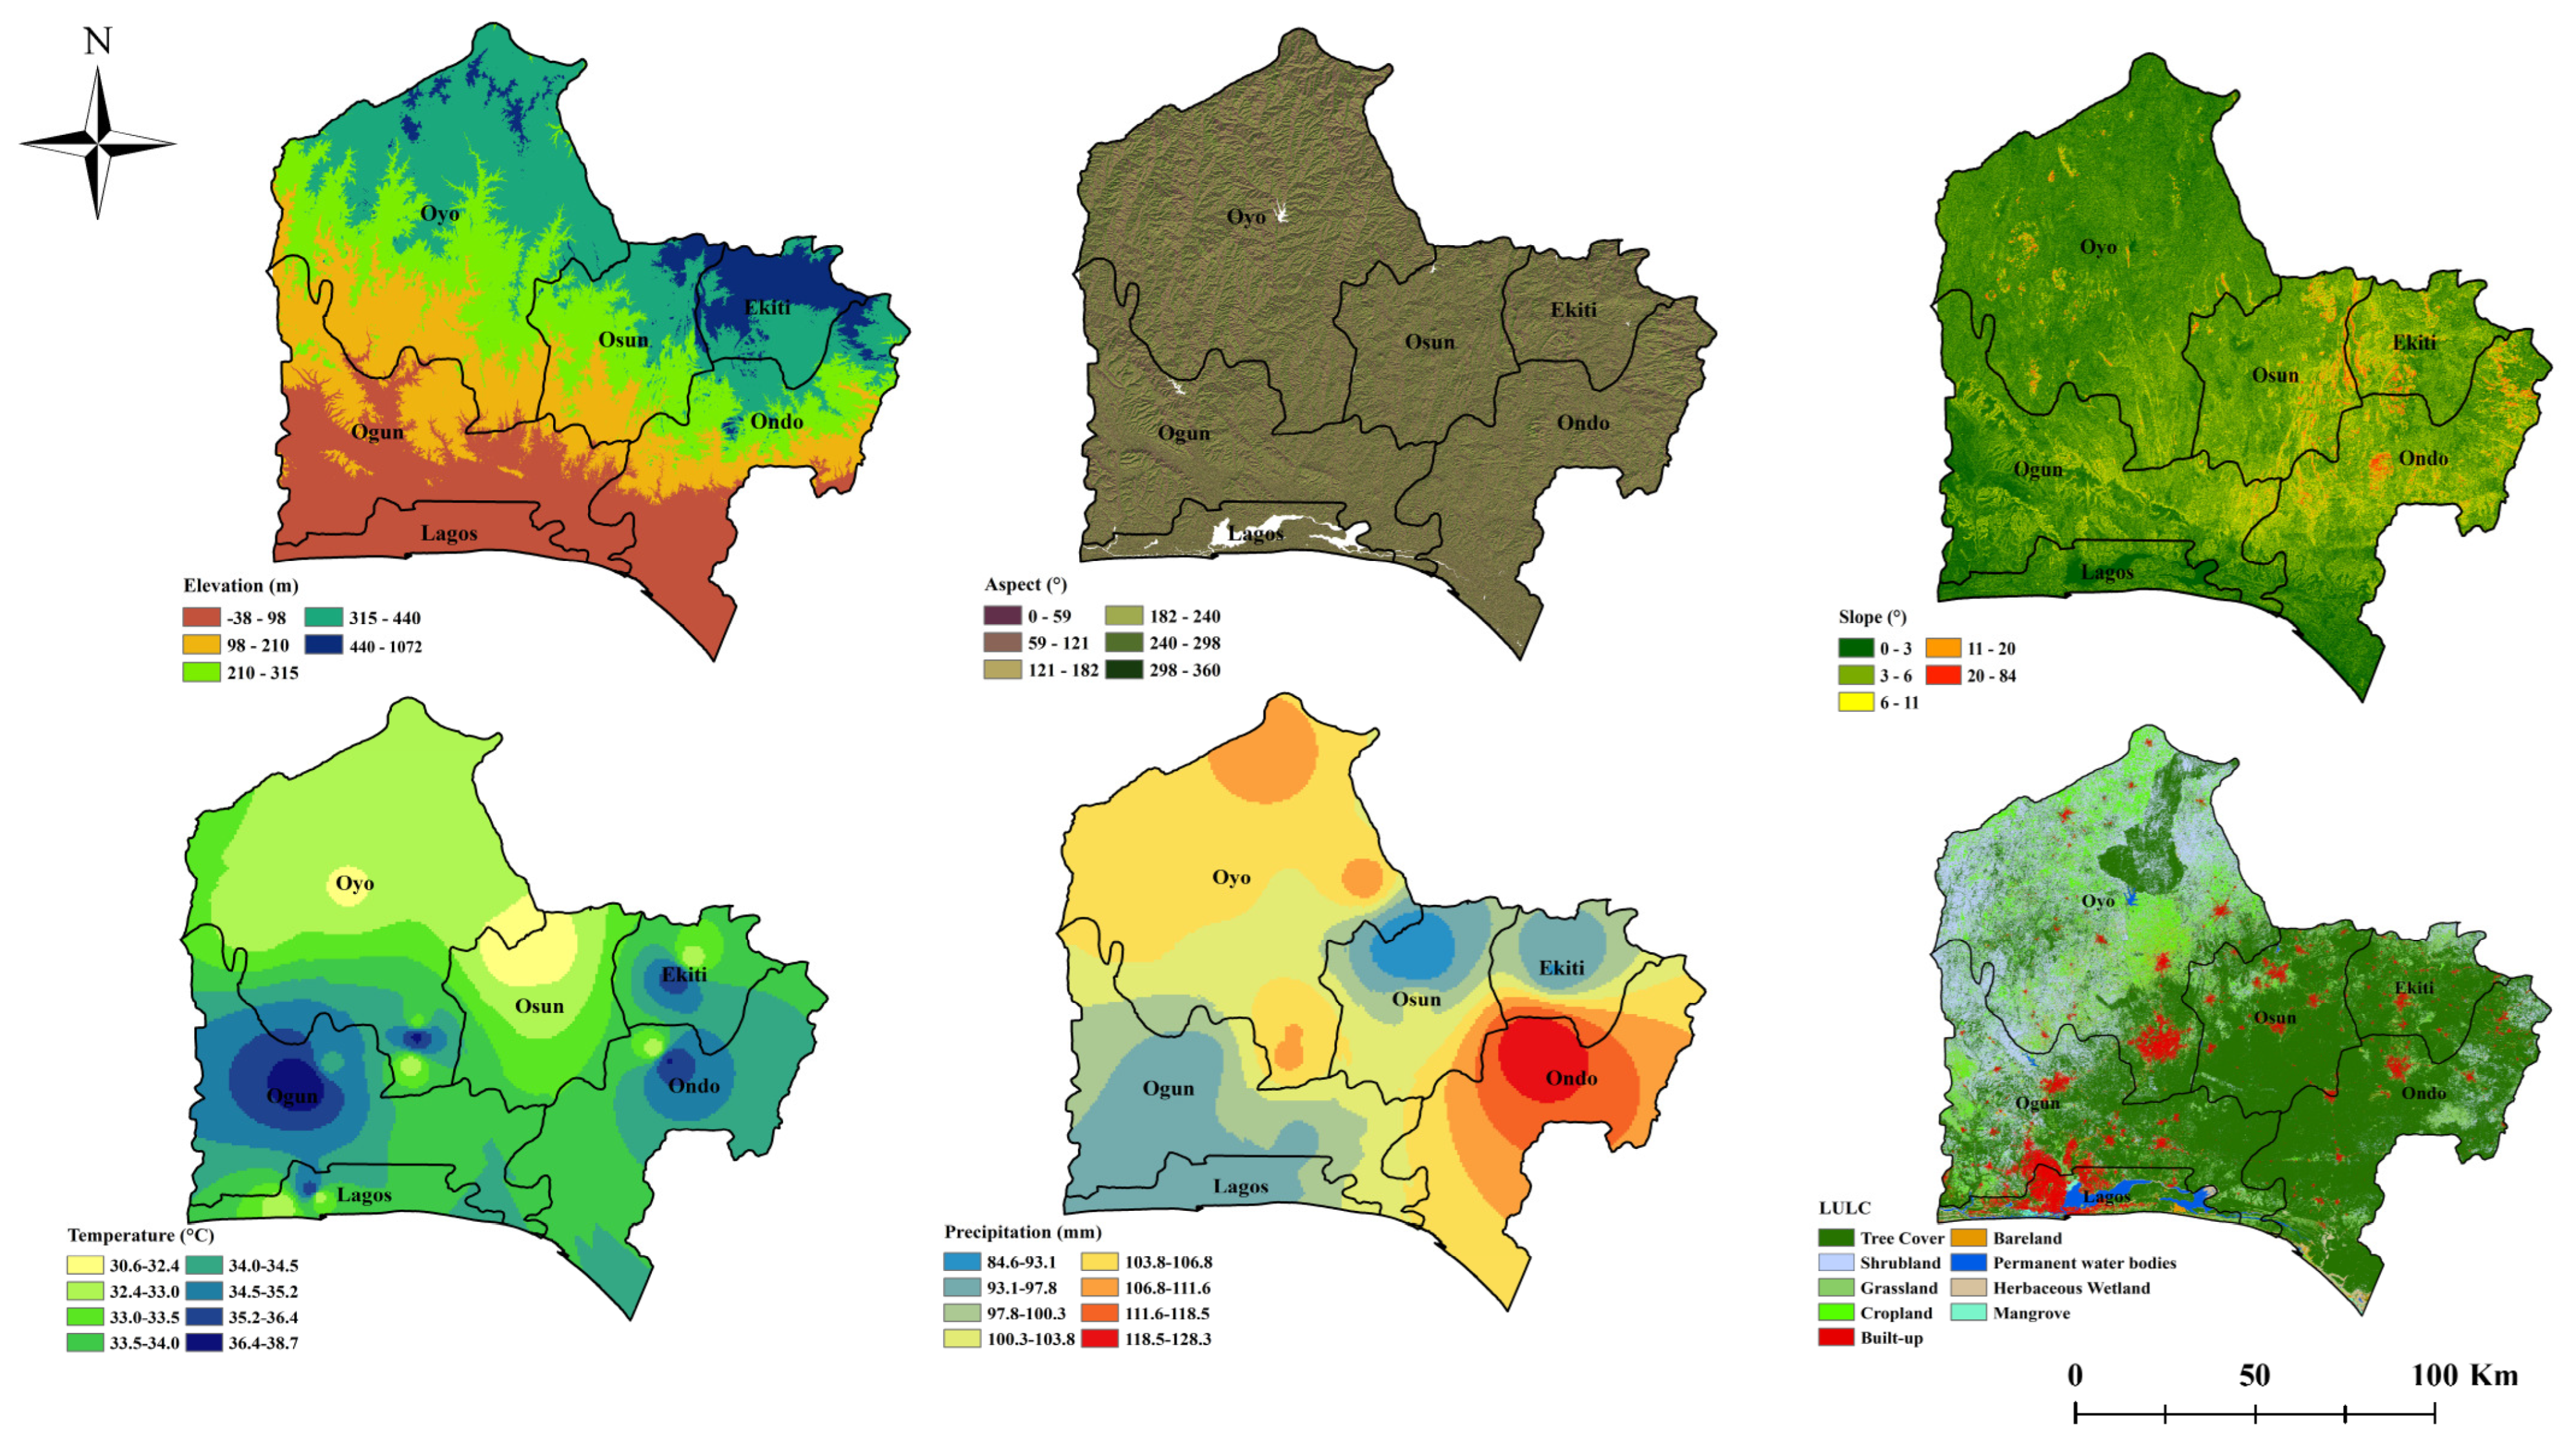
3.3. NDVI Influencing Factors

To examine the factors influencing the vegetation density in the SWR, factor detection was employed in combination with interactive detectors, as detailed in Table 5 and Table 6. All p-values for the identified influencing factors were 0, indicating a high level of statistical significance. Notably, the LULC q-value reached a maximum of 0.4428, highlighting land use type as the most important factor influencing vegetation density. This was attributed to the diverse impacts of the various land-use categories; for instance, areas designated for tree cover supported greater plant diversity and density. Additionally, the issue was closely linked to infrastructure development within the SWR. The rapid economic growth in the SWR of Nigeria had driven numerous infrastructure projects, such as road networks and urban developments, which required extensive land alterations [69]. As a result, these developments negatively impacted the vegetation cover, as substantial areas of natural vegetation were cleared or disrupted. There was also less vegetation cover throughout the region due to the ongoing conversion of wetlands into croplands to meet the rising agricultural demands.
The correlation values for slope, elevation, and precipitation were 0.3413, 0.2743, and 0.2141, respectively, indicating a significantly influence on vegetation coverage, with LULC having the most considerable effect. Topographic factors, particularly slope and elevation, substantially impact the microclimatic conditions, soil stability, and hydrological dynamics, thereby influencing vegetation patterns [79,80]. The correlation coefficient (q value) for the mean annual temperature was lower, at 0.1467, while the aspect had the smallest effect, reflected by a q value of 0.0321. The SWR experienced seasonal climatic fluctuations, including temperature variations, increased humidity, and changes in precipitation; however, the overall climate remained relatively stable, supporting a consistent vegetation cover, except during extreme climatic events that severely impacted plant health. In response to these challenges, several environmental conservation strategies were implemented in the SWR, minimizing some of the detrimental effects of human activity on the vegetation cover [81]. First, the majority of the research area displayed a rainforest biome, indicating that the climatic type had a substantial impact on NDVI values, whereas the northeastern regions, including Ekiti and Osun, were characterized by a tropical savanna climate. As a result, the overall impact of the climatic type on NDVI values across the larger study area was relatively limited.
The findings from the interaction detection analysis showed that the combination of any two factors had a greater impact on NDVI variation than each factor alone. The q-statistic values displayed in Table 6 illustrate the explanatory power of the individual variables as well as their pairwise interactions, as determined by the Geographic Detector model. Notably, the interaction between each element and LULC had the most significant impact, highlighting LULC’s dominant role in shaping vegetation coverage within the SWR. In addition to anthropogenic influences, the vegetation coverage was significantly affected by topographic features such as slope and elevation. These findings align with the results from the factor detection analysis, indicating that the intricate interplay between natural and human-made forces primarily drove the spatial variability of NDVI values in the SWR [80].

4. Discussion

4.1. Variation Trend Analysis

To analyze the trends in NDVI variability across the SWR, this study examined the specific patterns in each state, utilizing pixel counts extracted from Figure 7c. The evaluation of vegetation coverage changes from 2001 to 2020 (Figure 9a–f) revealed distinct yet comparable trends across the six states.
Ekiti State experienced a notable loss of vegetation, with 34.43% of the area declining and only 28.67% gaining vegetation, primarily in the southeastern region. The significant increase of 6.32% was the smallest among the five vegetation trend classes, indicating a minimal overall improvement in vegetation health (Figure 9a).
Similarly, Lagos showed a decline in vegetation, where the decrease in coverage (28.94%) slightly outweighed the gains (24.61%). The majority of the landscape (46.45%) exhibited no significant change, highlighting limited vegetation recovery amidst ongoing urbanization pressures (Figure 9b).
Ogun State demonstrated an even more pronounced negative trend, with 46.99% of the area experiencing vegetation loss compared to 37.79% with gains. Although the significant increase of 17.84% was relatively notable compared to other states, the overall pattern still reflected widespread vegetation degradation (Figure 9c).
In Ondo, the extent of vegetation degradation was even greater, with more than half of the landscape (54.73%) showing decline, while only 32.63% recorded gains. The substantial percentage with a significant decrease (40.29%) indicated extensive land cover alterations, likely resulting from agricultural expansion and deforestation activities (Figure 9d).
In contrast, Osun exhibited a predominantly positive trend, with approximately 59.73% of the state experiencing vegetation gains, while only 24% faced losses. The high proportion of both weak and significant increases suggested a broad regrowth and improvement in vegetation health over the study period (Figure 9e).
Likewise, Oyo displayed a positive trend, with 50.45% of its area reflecting vegetation increases compared to 26.24% that showed declines. The relatively high ratio of weak and significant increases implied recovery efforts or reduced degradation compared to other states (Figure 9f).
Overall, the findings highlighted two contrasting regional patterns: while Ondo, Ogun, Ekiti, and Lagos predominantly experienced vegetation declines, Osun and Oyo exhibited significant recovery trends, highlighting the varying impacts of anthropogenic and environmental factors across the SWR.

4.2. Analysis of Influencing Factors

The study revealed the important elements that influence vegetation dynamics by using a geographic detector technique to determine the drivers of vegetation cover in the SWR. LULC emerged as the primary determinant across all six states, consistent with the existing literature emphasizing the role of land use in vegetation patterns [82,83]. Forested and grassland areas showed higher NDVI values, indicating denser vegetation, while urban and water regions had lower values. The effects of topographic elements, including elevation, slope, and aspect, varied geographically and also affected vegetation. In Ekiti, Ogun, and Ondo, topography ranked second after LULC, affecting water retention, soil fertility, and microclimates, thus influencing vegetation growth. Climatic factors, especially precipitation, were significant in Lagos, where the humid climate and high rainfall led to substantial seasonal and spatial variations in soil moisture and fertility, affecting vegetation health. LULC was the dominant driver across the SWR while the influence of topography and climate varied by state. These results highlight how land use changes, human activities, and environmental factors interact to shape the region’s vegetation patterns.

5. Conclusions

To evaluate the vegetation changes throughout the six states in the SWR, this study examined MODIS NDVI data from 2001 to 2020, specifically considering the temporal and geographical differences in NDVI values. It aimed to identify the trends in vegetation changes and the factors driving these fluctuations and provide insights into the evolution of vegetation cover.
The analysis of the NDVI distribution across the SWR from 2001 to 2020 found considerable spatial variability in the vegetation cover. Areas of dense vegetation were concentrated in the eastern part of the region and a large portion of the landscape was characterized by low vegetation coverage, reflected by the average NDVI value of 0.45. This pattern suggests persistent vegetation stress and uneven ecological health across the region, likely influenced by land use pressures such as agriculture and urban expansion.
The vegetation trends across the study region varied significantly between states, with areas like Ekiti, Lagos, Ogun, and Ondo experiencing substantial vegetation loss due to human activities, such as urbanization and agriculture. In contrast, Osun and Oyo displayed signs of recovery, reflecting the potential for vegetation restoration when pressures are reduced.
The vegetation density in the SWR is predominantly shaped by human activities, particularly LULC change. Rapid infrastructure development and agricultural expansion have emerged as major drivers of vegetation loss, highlighting the environmental costs of economic growth in the region. Topographic factors like slope and elevation, as well as climatic variables such as precipitation, also influence vegetation patterns but their impact is secondary to land use dynamics.
The findings of the interaction detection analysis showed that any two elements working together had a greater cumulative effect than when they act independently. This highlights the complex nature of the vegetation dynamics in the SWR, where the combined influence of anthropogenic and environmental factors such as land use changes, topography, and climatic variables exert a stronger impact on vegetation patterns than any individual factor. Specifically, the interaction between land use type and topographic features, such as slope and elevation, played a crucial role in shaping the region’s vegetation distribution.
Human activities have largely contributed to the negative trends in vegetation dynamics throughout the SWR, with unsustainable land use practices and rapid urbanization playing significant roles in vegetation degradation. To reverse these trends, a focused approach to ecological restoration is essential. This should prioritize areas with high vegetation cover for conservation efforts, ensuring the long-term stability of the ecosystems. Degraded regions must receive support through comprehensive restoration programs that address both ecological and socio-economic factors. State-specific environmental constraints must also be considered when formulating restoration strategies. These constraints may include climatic factors, such as varying rainfall patterns or temperature extremes, economic factors related to the pressure from agriculture and urban development, and land tenure issues that influence land use and conservation efforts in different regions. Strategies to combat vegetation loss should include the implementation of sustainable land management practices, reforestation initiatives, and land-use policies that effectively balance development with environmental protection. Additionally, enhancing resilience to climate change through adaptive management is crucial for mitigating the adverse effects of extreme environmental events. Collaboration among the six states within the SWR is vital for ensuring cohesive and coordinated actions, aligning policies across jurisdictions to facilitate more effective vegetation protection and restoration efforts. Finally, refining methods for calculating the NDVI and conducting trend analysis that are tailored to the region’s unique biophysical and socio-economic conditions will improve the monitoring accuracy and better inform future conservation strategies.

Author Contributions

I.A. and L.W. worked together to draft the manuscript, and all authors took part in the rigorous review and editing of the manuscript. All authors have read and agreed to the published version of the manuscript.

Funding

This research was supported by the Fundamental Research Funds for the Central Universities (grant number SWU021003).

Data Availability Statement

The article contains references to several data sources.

Acknowledgments

Data support was provided by the Chongqing Engineering Research Center for Remote Sensing Big Data Application, the Chongqing Jinfo Mountain National Field Scientific Observation and Research Station for Karst Ecosystem, and the Nigeria Meteorological Agency (NIMET) (https://nimet.gov.ng/; accessed on 2 August 2023).

Conflicts of Interest

The authors declare that there are no conflicts of interest.

Appendix A

The process was implemented using the Layer Stacking and Band Math tools available in ENVI 5.3 software. The following formula illustrates this approach:
N D V I i = M a x N D V I i j
The N D V I i   variable represents the NDVI value for specific month i and N D V I i j indicates the NDVI value for the j t h   period (16 days) within the month i. A maximum NDVI time series selects the highest NDVI value for each pixel for each month.
The average annual NDVI ( N D V I a ¯ ) can be computed using the following equation:
N D V I a ¯ = i = 1 12 N D V I i 12 , i = 1,2 , 3,4 , 5,6 12
The average annual NDVI is represented by N D V I a ¯ , and the most significant NDVI composite for a specific month “i”, where “i” is a number between 1 and 12, is denoted as N D V I i .
The median of the slopes obtained using Sen’s slope is determined by n ( n 1 ) 2 potential combinations of data points. The formula for the calculation is expressed as
S N D V I = m e d i a n N D V I j   N D V I i j i       2001 i < j 2020
where N D V I i and N D V I j are the NDVI values for years i and j , respectively, and S N D V I is the trend in the NDVI fluctuations. Both S N D V I > 0 and S N D V I < 0 indicate an increasing and decreasing trend in NDVI values, respectively, over the study period.
The range −0.0005 and 0.0005 was established as the boundary for classifying S N D V I values as stable or unchanged. An S N D V I value ≥ 0.0005 or S N D V I < −0.0005 were classified as increasing or decreasing regions, respectively. A suitable formula was used to determine the importance of these trends and their calculation:
Set N D V I i ,   i = 2001 ,   2002 , 2020 .
Z =           S 1 v a r S ( S > 0 )         0                       S = 0           S + 1 v a r S ( S < 0 )
S = i = 1 n 1 j = j + 1 n s g n ( N D V I i N D V I J )
s g n N D V I i N D V I j = 1 N D V I i N D V I j > 0 0 ( N D V I i N D V I j ) = 0 1 N D V I i N D V I j < 0      
v a r S = n n 1 2 n + 5 i = 1 m t i   ( t i 1 ) ( 2 t i + 5 ) 18 ,
The NDVI values at various periods i   a n d   j   are represented by the variables N D V I i and N D V I j , where n is the time series’ length. The symbolic function sgn defines the sign of the difference between these values, t indicates the repeated data values in the ith group, and m is the number of repeated datasets in the time series data. The significance of the NDVI trends was tested using the Z statistic, which ranges from +∞ to −∞. A significant shift in the NDVI trend at the α level is indicated if Z >   Z 1 α 2 for a certain significance level α. To evaluate the NDVI trends at a 95% confidence level, a significance level of α = 0.05 was chosen for this investigation, which corresponds to a critical Z-value of 1.960. A significant change was identified when |Z| ≥ 1.96, while |Z| < 1.96 indicated an insignificant change.
The q-value derived using this method quantifies the level of influence each component has on the spatial distribution of the data.
q = 1 h = 1 L N h σ h 2 N σ 2
In this context, q represents the explanatory power of the geographical component X, while L denotes the categorization of the geographical factor X or the dependent variable (NDVI). The variable h corresponds to the partition index h = 1, …, L, with Nh and σ h 2   representing the sample size and variance of subregion h, respectively.

References

  1. Kong, D.; Zhang, Q.; Singh, V.P.; Shi, P. Seasonal vegetation response to climate change in the Northern Hemisphere (1982–2013). Glob. Planet. Change 2017, 148, 1–8. [Google Scholar] [CrossRef]
  2. Liang, L.; Huang, T.; Di, L.; Geng, D.; Yan, J.; Wang, S.; Wang, L.; Li, L.; Chen, B.; Kang, J. Influence of different bandwidths on LAI estimation using vegetation indices. IEEE J. Sel. Top. Appl. Earth Obs. Remote Sens. 2020, 13, 1494–1502. [Google Scholar] [CrossRef]
  3. Chen, Y.; Yang, J.; Yu, W.; Ren, J.; Xiao, X.; Xia, J.C. Relationship between urban spatial form and seasonal land surface temperature under different grid scales. Sustain. Cities Soc. 2023, 89, 104374. [Google Scholar] [CrossRef]
  4. Zhang, Y.; Zhu, Z.; Liu, Z.; Zeng, Z.; Ciais, P.; Huang, M.; Liu, Y.; Piao, S. Seasonal and interannual changes in vegetation activity of tropical forests in Southeast Asia. Agric. For. Meteorol. 2016, 224, 1–10. [Google Scholar] [CrossRef]
  5. Wang, Y.-F.; Jing, J.-L. Spatial-temporal variations of vegetation cover and its response to climate factors in Guangxi over the past 15 years. Res. Argric. Mod. 2017, 38, 1086–1096. [Google Scholar]
  6. Chen, T.; Xia, J.; Zou, L.; Hong, S. Quantifying the influences of natural factors and human activities on NDVI changes in the Hanjiang River Basin, China. Remote Sens. 2020, 12, 3780. [Google Scholar] [CrossRef]
  7. Xu, Z.; Cao, L.; Zhong, S.; Liu, G.; Yang, Y.; Zhu, S.; Luo, X.; Di, L. Trends in global vegetative drought from long-term satellite remote sensing data. IEEE J. Sel. Top. Appl. Earth Obs. Remote Sens. 2020, 13, 815–826. [Google Scholar] [CrossRef]
  8. Jin, K.; Wang, F.; Li, P. Responses of vegetation cover to environmental change in large cities of China. Sustainability 2018, 10, 270. [Google Scholar] [CrossRef]
  9. Cheng, F.; Liu, S.; Yin, Y.; Lü, Y.; An, N.; Liu, X. The dynamics and main driving factors of coastal vegetation in Guangxi based on MODIS NDVI. Acta Ecol. Sin. 2017, 37, 788–797. [Google Scholar]
  10. Jin, K.; Wang, F.; Han, J.; Shi, S.; Ding, W. Contribution of climatic change and human activities to vegetation NDVI change over China during 1982–2015. Acta Geogr. Sin 2020, 75, 961–974. [Google Scholar]
  11. Prăvălie, R.; Sîrodoev, I.; Nita, I.-A.; Patriche, C.; Dumitraşcu, M.; Roşca, B.; Tişcovschi, A.; Bandoc, G.; Săvulescu, I.; Mănoiu, V. NDVI-based ecological dynamics of forest vegetation and its relationship to climate change in Romania during 1987–2018. Ecol. Indic. 2022, 136, 108629. [Google Scholar] [CrossRef]
  12. Li, M.; Yin, L.; Zhang, Y.; Su, X.; Liu, G.; Wang, X.; Au, Y.; Wu, X. Spatio-temporal dynamics of fractional vegetation coverage based on MODIS-EVI and its driving factors in Southwest China. Acta Ecol. Sin 2021, 41, 1138–1147. [Google Scholar] [CrossRef]
  13. He, C.; Yan, F.; Wang, Y.; Lu, Q. Spatiotemporal Variation in Vegetation Growth Status and Its Response to Climate in the Three-River Headwaters Region, China. Remote Sens. 2022, 14, 5041. [Google Scholar] [CrossRef]
  14. Gao, X.; Zhao, D. Impacts of climate change on vegetation phenology over the Great Lakes Region of Central Asia from 1982 to 2014. Sci. Total Environ. 2022, 845, 157227. [Google Scholar] [CrossRef]
  15. Hu, W.; Wu, X.; Zhang, K. Spatiotemporal change of beneficiary area from wind erosion prevention service in the Ulan Buh Desert in 2008 and 2018. Geogr. Sustain. 2022, 3, 119–128. [Google Scholar] [CrossRef]
  16. Chen, P.; Pan, H.; Xu, Y.; He, W.; Yao, H. Spatial-Temporal Evolution Characteristics and Driving Force Analysis of NDVI in Hubei Province, China, from 2000 to 2022. Forests 2024, 15, 719. [Google Scholar] [CrossRef]
  17. Feng, X.; Tian, J.; Wang, Y.; Wu, J.; Liu, J.; Ya, Q.; Li, Z. Spatio-temporal variation and climatic driving factors of vegetation coverage in the Yellow River Basin from 2001 to 2020 based on kNDVI. Forests 2023, 14, 620. [Google Scholar] [CrossRef]
  18. Merem, E.; Twumasi, Y.; Wesley, J.; Isokpehi, P.; Fageir, S.; Crisler, M.; Romorno, C.; Hines, A.; Ochai, G.; Leggett, S. Analyzing emerging environmental issues in major areas: The case of Lagos in South West Nigeria. Archit. Res. 2018, 8, 19–38. [Google Scholar] [CrossRef]
  19. Adesina, J.A.; Liu, Y.; Tang, X.; Ren, Y. Assessing the Impact of Geospatial Susceptibility on the Rural Agricultural Landscapes of Village Settlements in Southwestern Nigeria. Land 2024, 13, 1719. [Google Scholar] [CrossRef]
  20. Wang, H.; Kang, C.; Tian, Z.; Zhang, A.; Cao, Y. Vegetation periodic changes and relationships with climate in Inner Mongolia Based on the VMD method. Ecol. Indic. 2023, 146, 109764. [Google Scholar] [CrossRef]
  21. Li, M.; Yan, Q.; Li, G.; Yi, M.; Li, J. Spatio-temporal changes of vegetation cover and its influencing factors in northeast China from 2000 to 2021. Remote Sens. 2022, 14, 5720. [Google Scholar] [CrossRef]
  22. Jia, Z.; Lei, R.; Liu, Y.; Liu, P.; Wang, Z.; Chang, Y.; Wei, W. Spatial–temporal variations and the driving factors of vegetation coverage in the Loess Hilly and Gully Region of China. Forests 2023, 14, 1238. [Google Scholar] [CrossRef]
  23. Jin, J.; Liu, S.; Wang, L.; Wu, S.; Zhao, W. Fractional Vegetation Cover and Spatiotemporal Variations of PM2.5 Concentrations in the Beijing-Tianjin-Hebei Region of China. Atmosphere 2022, 13, 1850. [Google Scholar] [CrossRef]
  24. Li, S.; Xu, L.; Jing, Y.; Yin, H.; Li, X.; Guan, X. High-quality vegetation index product generation: A review of NDVI time series reconstruction techniques. Int. J. Appl. Earth Obs. Geoinf. 2021, 105, 102640. [Google Scholar] [CrossRef]
  25. Reddy, D.S.; Prasad, P.R.C. Prediction of vegetation dynamics using NDVI time series data and LSTM. Model. Earth Syst. Environ. 2018, 4, 409–419. [Google Scholar] [CrossRef]
  26. Eckert, S.; Hüsler, F.; Liniger, H.; Hodel, E. Trend analysis of MODIS NDVI time series for detecting land degradation and regeneration in Mongolia. J. Arid Environ. 2015, 113, 16–28. [Google Scholar] [CrossRef]
  27. Detsch, F.; Otte, I.; Appelhans, T.; Hemp, A.; Nauss, T. Seasonal and long-term vegetation dynamics from 1-km GIMMS-based NDVI time series at Mt. Kilimanjaro, Tanzania. Remote Sens. Environ. 2016, 178, 70–83. [Google Scholar] [CrossRef]
  28. Ning, T.; Liu, W.; Lin, W.; Song, X. NDVI variation and its responses to climate change on the northern Loess Plateau of China from 1998 to 2012. Adv. Meteorol. 2015, 2015, 725427. [Google Scholar] [CrossRef]
  29. Usman, U.; Yelwa, S.; Gulumbe, S.; Danbaba, A.; Nir, R. Modelling relationship between NDVI and climatic variables using geographically weighted regression. J. Math. Sci. Appl. 2013, 1, 24–28. [Google Scholar]
  30. Aweda, E.; Adeyewa, Z. Inter annual variation of vegetation anomaly over Nigeria using satellite-derived index. Adv. Appl. Sci. Res. 2011, 2, 468–475. [Google Scholar]
  31. Schlesinger, W.H.; Jasechko, S. Transpiration in the global water cycle. Agric. For. Meteorol. 2014, 189, 115–117. [Google Scholar] [CrossRef]
  32. Freeman, A.A.B.; Mensah, I.; Antwi, K.B. Smiling vs. Frowning Faces: Community Participation for Sustainable Tourism in Ghanaian Communities. In Prospects and Challenges of Community-Based Tourism and Changing Demographics; IGI Global: Hershey, PA, USA, 2022; pp. 83–106. [Google Scholar]
  33. Pendrill, F.; Gardner, T.A.; Meyfroidt, P.; Persson, U.M.; Adams, J.; Azevedo, T.; Bastos Lima, M.G.; Baumann, M.; Curtis, P.G.; De Sy, V. Disentangling the numbers behind agriculture-driven tropical deforestation. Science 2022, 377, eabm9267. [Google Scholar] [CrossRef] [PubMed]
  34. Tahiru, A.A.; Doke, D.A.; Baatuuwie, B.N. Effect of land use and land cover changes on water quality in the Nawuni Catchment of the White Volta Basin, Northern Region, Ghana. Appl. Water Sci. 2020, 10, 198. [Google Scholar] [CrossRef]
  35. Ikhuoso, O.A.; Adegbeye, M.; Elghandour, M.; Mellado, M.; Al-Dobaib, S.; Salem, A. Climate change and agriculture: The competition for limited resources amidst crop farmers-livestock herding conflict in Nigeria-A review. J. Clean. Prod. 2020, 272, 123104. [Google Scholar] [CrossRef]
  36. Teshome, D.T.; Zharare, G.E.; Naidoo, S. The threat of the combined effect of biotic and abiotic stress factors in forestry under a changing climate. Front. Plant Sci. 2020, 11, 601009. [Google Scholar] [CrossRef]
  37. Fayech, D.; Tarhouni, J. Climate variability and its effect on normalized difference vegetation index (NDVI) using remote sensing in semi-arid area. Model. Earth Syst. Environ. 2021, 7, 1667–1682. [Google Scholar] [CrossRef]
  38. Hao, J.; Xu, G.; Luo, L.; Zhang, Z.; Yang, H.; Li, H. Quantifying the relative contribution of natural and human factors to vegetation coverage variation in coastal wetlands in China. Catena 2020, 188, 104429. [Google Scholar] [CrossRef]
  39. Lin, Q.; Wu, Z.; Singh, V.P.; Sadeghi, S.; He, H.; Lu, G. Correlation between hydrological drought, climatic factors, reservoir operation, and vegetation cover in the Xijiang Basin, South China. J. Hydrol. 2017, 549, 512–524. [Google Scholar] [CrossRef]
  40. Yelwa, S.A.; Sanda, A.B.; Usman, U. Spatio-Temporal Assessment of Vegetation Resource Dynamics in Nigeria from SPOT Satellite Imageries. Am. J. Clim. Change 2019, 8, 502. [Google Scholar] [CrossRef]
  41. Salam, R.D.; Oluwatimilehin, I.A.; Ayanlade, A. Spatial analysis of urban expansion, land-use dynamics and its effects on land surface temperature in Oyo town, Southwestern Nigeria. City Built Environ. 2023, 1, 15. [Google Scholar] [CrossRef]
  42. Agbelade, A.D. Analyzing the influence of urban vegetation cover on land surface temperature in Southwestern Nigeria. Discov. Environ. 2025, 3, 10. [Google Scholar] [CrossRef]
  43. Fashae, O.A.; Adagbasa, E.G.; Olusola, A.O.; Obateru, R.O. Land use/land cover change and land surface temperature of Ibadan and environs, Nigeria. Environ. Monit. Assess. 2020, 192, 109. [Google Scholar] [CrossRef] [PubMed]
  44. Adedotun, A.F.; Adesina, O.S.; Taiwo, A.I.; Odekina, O.G.; Adedotun, O.A.; Adoghe, V.O. A Non-Parametric Analysis of the Effect of COVID-19 Pandemic on Nigerians’well-Being Based on Geopolitical Zones. JP J. Biostat. 2024, 24, 177–196. [Google Scholar] [CrossRef]
  45. Olukanni, D.; Aremu, D. Provisional evaluation of composting as priority option for sustainable waste management in South-West Nigeria. Pollution 2017, 3, 417–428. [Google Scholar]
  46. Oyebode, L.A.; Akinbile, L.A. Processors’ Acquisition of Productive Assets Under National Fadama Development Project III in Southwest, Nigeria. J. Agric. Ext. 2023, 28, 37–45. [Google Scholar] [CrossRef]
  47. Nwoko, K.C.; Osiki, O.M. From the Hub of Lagos: Horizontal integration for the Southwest region of Nigeria, a developmental imperative. Afr. Zamani 2016, 24, 111–128. [Google Scholar]
  48. Ejaro, S.P.; Abubakar, A. The challenges of rapid urbanization on sustainable development of Nyanya, Federal Capital Territory, Abuja, Nigeria. J. Appl. Sci. Environ. Manag. 2013, 17, 299–313. [Google Scholar] [CrossRef]
  49. Zabbey, N.; Giadom, F.D.; Babatunde, B.B. Nigerian coastal environments. In World Seas: An Environmental Evaluation; Elsevier: Amsterdam, The Netherlands, 2019; pp. 835–854. [Google Scholar]
  50. Aghimien, E.; Akinkuoroye, O.; Fakolade, A. Assessment of Waste Associated with Timber Flitching in Bodija Plank Market, Ibadan, Nigeria. In Climate Smart Agriculture and Agribusiness Development in Nigeria; The Alex Ekwueme Federal University Ndufu-Alike: Abakaliki, Nigeria, 2021; Volume 113. [Google Scholar]
  51. Bajgain, R.; Xiao, X.; Wagle, P.; Basara, J.; Zhou, Y. Sensitivity analysis of vegetation indices to drought over two tallgrass prairie sites. ISPRS J. Photogramm. Remote Sens. 2015, 108, 151–160. [Google Scholar] [CrossRef]
  52. Goovaerts, P. Geostatistical approaches for incorporating elevation into the spatial interpolation of rainfall. J. Hydrol. 2000, 228, 113–129. [Google Scholar] [CrossRef]
  53. Lloyd, C. Assessing the effect of integrating elevation data into the estimation of monthly precipitation in Great Britain. J. Hydrol. 2005, 308, 128–150. [Google Scholar] [CrossRef]
  54. Prasannakumar, V.; Shiny, R.; Geetha, N.; Vijith, H. Applicability of SRTM data for landform characterisation and geomorphometry: A comparison with contour-derived parameters. Int. J. Digit. Earth 2011, 4, 387–401. [Google Scholar] [CrossRef]
  55. Yue, L.; Shen, H.; Zhang, L.; Zheng, X.; Zhang, F.; Yuan, Q. High-quality seamless DEM generation blending SRTM-1, ASTER GDEM v2 and ICESat/GLAS observations. ISPRS J. Photogramm. Remote Sens. 2017, 123, 20–34. [Google Scholar] [CrossRef]
  56. Yang, L.; Meng, X.; Zhang, X. SRTM DEM and its application advances. Int. J. Remote Sens. 2011, 32, 3875–3896. [Google Scholar] [CrossRef]
  57. Fan, X.; Liu, Y.; Wu, G.; Zhao, X. Compositing the minimum NDVI for daily water surface mapping. Remote Sens. 2020, 12, 700. [Google Scholar] [CrossRef]
  58. Nfornkah, B.N.; Rene, K.; Martin, T.; Louis, Z.; Cedric, C.; Armand, T. Assessing the spatial distribution of bamboo species using remote sensing in Cameroon. J. Ecol. Nat. Environ. 2020, 12, 172–183. [Google Scholar]
  59. Wen, Z.; Wu, S.; Chen, J.; Lü, M. NDVI indicated long-term interannual changes in vegetation activities and their responses to climatic and anthropogenic factors in the Three Gorges Reservoir Region, China. Sci. Total Environ. 2017, 574, 947–959. [Google Scholar] [CrossRef]
  60. Zhong, X.; Li, J.; Wang, J.; Zhang, J.; Liu, L.; Ma, J. Linear and nonlinear characteristics of long-term NDVI using trend analysis: A case study of Lancang-Mekong River Basin. Remote Sens. 2022, 14, 6271. [Google Scholar] [CrossRef]
  61. Liu, H.; Zheng, H.; Wu, L.; Deng, Y.; Chen, J.; Zhang, J. Spatiotemporal Evolution in the Thermal Environment and Impact Analysis of Drivers in the Beijing–Tianjin–Hebei Urban Agglomeration of China from 2000 to 2020. Remote Sens. 2024, 16, 2601. [Google Scholar] [CrossRef]
  62. Geng, S.; Zhang, H.; Xie, F.; Li, L.; Yang, L. Vegetation Dynamics Under Rapid Urbanization in the Guangdong–Hong Kong–Macao Greater Bay Area Urban Agglomeration During the Past Two Decades. Remote Sens. 2022, 14, 3993. [Google Scholar] [CrossRef]
  63. Zhang, Y.; Zhao, Z.; Fu, B.; Ma, R.; Yang, Y.; Lü, Y.; Wu, X. Identifying ecological security patterns based on the supply, demand and sensitivity of ecosystem service: A case study in the Yellow River Basin, China. J. Environ. Manag. 2022, 315, 115158. [Google Scholar] [CrossRef]
  64. Song, Y.; Wang, J.; Ge, Y.; Xu, C. An optimal parameters-based geographical detector model enhances geographic characteristics of explanatory variables for spatial heterogeneity analysis: Cases with different types of spatial data. GIScience Remote Sens. 2020, 57, 593–610. [Google Scholar] [CrossRef]
  65. Wang, W.; Yang, Y. Spatial-temporal differentiation characteristics and driving factors of China’s energy eco-efficiency based on geographical detector model. J. Clean. Prod. 2024, 434, 140153. [Google Scholar] [CrossRef]
  66. Onilude, O.O.; Vaz, E. Data analysis of land use change and urban and rural impacts in Lagos state, Nigeria. Data 2020, 5, 72. [Google Scholar] [CrossRef]
  67. Obiefuna, J.N.; Okolie, C.J.; Atagbaza, A.O.; Nwilo, P.C.; Akindeju, F.O. Spatio-temporal land cover dynamics and emerging landscape patterns in western part of Lagos State, Nigeria. Environ. Socio-Econ. Stud. 2021, 9, 53–69. [Google Scholar] [CrossRef]
  68. Fasona, M.J.; Akintuyi, A.O.; Adeonipekun, P.A.; Akoso, T.M.; Udofia, S.K.; Agboola, O.O.; Ogunsanwo, G.E.; Ariori, A.N.; Omojola, A.S.; Soneye, A.S. Recent trends in land-use and cover change and deforestation in south–west Nigeria. GeoJournal 2022, 87, 1411–1437. [Google Scholar] [CrossRef]
  69. Ologunde, O.H.; Kelani, M.O.; Biru, M.K.; Olayemi, A.B.; Nunes, M.R. Land Use and Land Cover Changes: A Case Study in Nigeria. Land 2025, 14, 389. [Google Scholar] [CrossRef]
  70. Akintuyi, A.O.; Fasona, M.J.; Ayeni, A.O.; Soneye, A.S. Land use/land cover and climate change interaction in the derived savannah region of Nigeria. Environ. Monit. Assess. 2021, 193, 848. [Google Scholar] [CrossRef]
  71. Usman, M.; Nichol, J.E. Changes in agricultural and grazing land, and insights for mitigating farmer-herder conflict in West Africa. Landsc. Urban Plan. 2022, 222, 104383. [Google Scholar] [CrossRef]
  72. Fasona, M.; Akintuyi, A.; Udofia, S.; Akoso, T.; Ariori, N.; Adeonipekun, P.; Agboola, O.; Ogundipe, O.; Soneye, A.; Omojola, A. Deforestation and Land-Cover Changes in the Forest Reserves of Southwest Nigeria; Department of Geography, Univesrity of Lagos: Lagos, Nigeria, 2018. [Google Scholar]
  73. Akinbobola, A.; Fafure, T. Assessing the Impact of Urbanization on Outdoor Thermal Comfort in Selected Local Government Areas in Ogun State, Nigeria. Niger. J. Environ. Sci. Technol. (NIJEST) 2021, 5, 120–139. [Google Scholar] [CrossRef]
  74. Abiodun, O.; Salami, T. Land Use Dynamics of Urban Change in the Lagos-Ogun Urban Fringe, Southwest Nigeria. Urban Reg. Plan. Rev. 2023, 9, 78–88. [Google Scholar]
  75. Potapov, P.; Tyukavina, A.; Turubanova, S.; Talero, Y.; Hernandez-Serna, A.; Hansen, M.; Saah, D.; Tenneson, K.; Poortinga, A.; Aekakkararungroj, A. Annual continuous fields of woody vegetation structure in the Lower Mekong region from 2000–2017 Landsat time-series. Remote Sens. Environ. 2019, 232, 111278. [Google Scholar] [CrossRef]
  76. Cai, Y.; Zhang, F.; Duan, P.; Jim, C.Y.; Chan, N.W.; Shi, J.; Liu, C.; Wang, J.; Bahtebay, J.; Ma, X. Vegetation cover changes in China induced by ecological restoration-protection projects and land-use changes from 2000 to 2020. Catena 2022, 217, 106530. [Google Scholar] [CrossRef]
  77. Kemarau, R.A.; Eboy, O.V. Land Cover Change Detection in Kuching, Malaysia Using Satellite Imagery. Borneo J. Sci. Technol. 2021, 3, 61–65. [Google Scholar]
  78. Yang, S.; Song, S.; Li, F.; Yu, M.; Yu, G.; Zhang, Q.; Cui, H.; Wang, R.; Wu, Y. Vegetation coverage changes driven by a combination of climate change and human activities in Ethiopia, 2003–2018. Ecol. Inform. 2022, 71, 101776. [Google Scholar] [CrossRef]
  79. Fornacca, D.; Ren, G.; Xiao, W. Performance of three MODIS fire products (MCD45A1, MCD64A1, MCD14ML), and ESA Fire_CCI in a mountainous area of Northwest Yunnan, China, characterized by frequent small fires. Remote Sens. 2017, 9, 1131. [Google Scholar] [CrossRef]
  80. Zhang, H.; Zha, T.; Yu, Y.; Zhang, Z.; Zhang, X.; Zhang, H.; Ji, X. Functional vegetation community responses to soil and topographic factors in the Loess Plateau of China. Land Degrad. Dev. 2023, 34, 5355–5372. [Google Scholar] [CrossRef]
  81. Afuye, G.; Kalumba, A.; Orimoloye, I. Characterisation of Vegetation Response to Climate Change: A Review. Sustainability 2021, 13, 7265. [Google Scholar] [CrossRef]
  82. Olorunfemi, I.E.; Fasinmirin, J.T.; Olufayo, A.A.; Komolafe, A.A. GIS and remote sensing-based analysis of the impacts of land use/land cover change (LULCC) on the environmental sustainability of Ekiti State, southwestern Nigeria. Environ. Dev. Sustain. 2020, 22, 661–692. [Google Scholar] [CrossRef]
  83. Anthony, T.; Shohan, A.A.A.; Oludare, A.; Alsulamy, S.; Kafy, A.-A.; Khedher, K.M. Spatial analysis of land cover changes for detecting environmental degradation and promoting sustainability. Kuwait J. Sci. 2024, 51, 100197. [Google Scholar] [CrossRef]
Figure 1. The Southwest Region of Nigeria.
Forests 16 00811 g001
Figure 2. Spatial distribution of NDVI driving factors.
Forests 16 00811 g002
Figure 3. The research flowchart.
Forests 16 00811 g003
Figure 4. The discretization of the influencing factors.
Forests 16 00811 g004
Figure 5. Showing (a) the spatial distribution and (b) the graphical representation of the average annual NDVI from 2001 to 2020.
Forests 16 00811 g005
Figure 6. Average annual NDVI variation between 2001 and 2020.
Forests 16 00811 g006
Figure 7. Showing (a) the Sen’s slope, (b) the Mann–Kendall test, and (c) the combined Sen-MK trend analysis of NDVI in SWR from 2001 to 2020.
Forests 16 00811 g007
Figure 8. NDVI and LULC distribution in SWR.
Forests 16 00811 g008
Figure 9. The trend of NDVI variations in the six states of the SWR from 2001 to 2020: (a) Ekiti; (b) Lagos; (c) Ogun; (d) Ondo; (e) Osun; and (f) Oyo.
Forests 16 00811 g009
Table 1. The environmental factors utilized in the analysis.
Factor CategoryFactorResolutionOrigin/URL
Vegetation IndexNDVI250 mGoogle Earth Engine (https://earthengine.google.com/)
USGS (https://lpdaac.usgs.gov/products/)
TopographyElevation90 mGoogle Earth Engine (https://earthengine.google.com/)
NASA (https://opentopography.org/)
Slope90 m
Aspect90 m
ClimateTemperature250 mNIMET (https://nimet.gov.ng/)
Precipitation250 m
Human variableLULC10 mGoogle Earth Engine (https://earthengine.google.com/)
ESA (https://esa-worldcover.org/en)
Administrative division 1:1,000,000http://www.nasrda.gov.ng/ (accessed on 26 May 2024)
Table 2. Division based on Sen-MK trend types.
S N D V I Z ValueSen-MK Type
Decrease   region   ( S N D V I < 0.0005)Significant (Z < −1.96)Significant decrease
Decrease   region   ( S N D V I < 0.0005)Insignificant (−1.96 < Z < 1.96)Weak decrease
No   change   region   ( 0.0005   <   S N D V I < 0.0005)Insignificant (−1.96 < Z < 1.96)No change
Increase   region   ( S N D V I 0.0005)Insignificant (−1.96 < Z < 1.96)Weak increase
Increase   region   ( S N D V I 0.0005)Significant (Z ≥ 1.96)Significant increase
Table 3. Types of interactions between the drivers.
DescriptionConnection
q ( X 1   X 2 )   <   Min   [ q ( X 1 ) ,   q ( X 2 )]Nonlinearity attenuation
Min   [ q ( X 1 ) ,   q ( X 2 ) ]   <   q ( X 1   X 2 )   <   Max   [ q ( X 1 ) ,   q ( X 2 )]The single-factor nonlinearity decreases
q ( X 1   X 2 )   >   Min   [ q ( X 1 ) ,   q ( X 2 )]Two-factor enhancement
q ( X 1   X 2 ) = q   ( X 1 )   +   q   ( X 2 )Independent
q ( X 1   X 2 )   >   q   ( X 1 )   +   q   ( X 2 )Nonlinear enhancement
Table 4. Methods for factor discretization and classifications of geographic detectors.
FactorSymbolMethodCategory
NDVI Y -
Elevation X 1 Natural break5
Slope X 2 Manual5
Aspect X 3 Manual6
Temperature X 4 Equal interval8
Precipitation X 5 Equal interval8
LULC X 6 Manual9
Table 5. The q values of the SWR and its constituent states.
StateInitiativeInfluencing Factors
ElevationSlopeAspectTemperaturePrecipitationLULC
SWRq value0.27430.34130.03210.14670.21410.4428
Ekiti0.30080.33210.02460.03210.14320.4211
Lagos0.14320.36730.00510.12530.32420.5234
Ogun0.32250.39600.00510.09240.26410.4832
Ondo0.36790.32170.03310.10260.10800.4641
Osun0.24580.30720.02471.23510.12630.3735
Oyo0.26920.24100.02281.64810.02410.4692
Table 6. Influencing factors that affected NDVI detection results.
ElevationSlopeAspectTemperaturePrecipitationLULC
Elevation0.2341
Slope0.31450.2562
Aspect0.23410.26320.0321
Temperature0.23510.27790.18420.1432
Precipitation0.33410.31220.1560.2430.1325
LULC0.45310.47620.40130.44320.47210.4231
Disclaimer/Publisher’s Note: The statements, opinions and data contained in all publications are solely those of the individual author(s) and contributor(s) and not of MDPI and/or the editor(s). MDPI and/or the editor(s) disclaim responsibility for any injury to people or property resulting from any ideas, methods, instructions or products referred to in the content.

