Article

Nitrogen Addition Promotes Soil Carbon Sequestration and Alters Carbon Pool Stability by Affecting Particulate Organic Carbon in a Karst Plantation

1
College of Eco-Environmental Engineering, Guizhou Minzu University, Guiyang 550025, China
2
The Karst Environmental Geological Hazard Prevention Laboratory of State Ethnic Affairs Commission, Guizhou Minzu University, Guiyang 550025, China
*
Author to whom correspondence should be addressed.
Forests 2025, 16(5), 730; https://doi.org/10.3390/f16050730
Submission received: 11 March 2025 / Revised: 8 April 2025 / Accepted: 23 April 2025 / Published: 24 April 2025
(This article belongs to the Section Forest Soil)

Abstract

:
Increased global atmospheric nitrogen deposition can affect the accumulation and stability of forest soil organic carbon; however, the pathways and underlying mechanisms are largely unclear. In this study, we sampled soils from a karst plantation with four different nitrogen addition levels (0, 150, 300, and 600 kg N ha−2 yr−1), and we measured the soil organic carbon and chemical properties. We separated the soil organic carbon fractions and calculated the carbon pool lability on the basis of chemical and physical grouping. The results revealed that nitrogen addition significantly increased soil organic carbon and carbon pool lability on the basis of physical grouping, but it significantly decreased carbon pool lability based on chemical grouping. Particulate organic carbon was significantly correlated with the soil organic carbon and carbon pool lability, so it explained a high degree of the variance. In addition, nitrate nitrogen and easily oxidized carbon had significant impacts on soil organic carbon and carbon pool lability, respectively, on the basis of chemical grouping. Therefore, nitrogen addition promotes the soil carbon sequestration capacity and alters carbon pool stability by affecting particulate organic carbon. These findings deepen our understanding of the mechanism of forest soil carbon sequestration and stability in the context of future nitrogen deposition.

1. Introduction

Global atmospheric nitrogen (N) has increased 3- to 5-fold due to human activities and industrialization over the past few decades and is expected to increase to 195 Tg·a−1 by 2050 [1,2]. N is the main nutrient element limiting plant growth and soil microbial activities. However, owing to the close coupling of carbon (C) and N in terrestrial ecosystems, excessive N input can have a considerable negative impact on the C cycle while affecting the N cycle [3]. Forest soil is the largest soil organic carbon (SOC) pool in terrestrial ecosystems, storing approximately 383 ± 30 Gt of C [4]. There is increasing evidence that N addition disrupts the dynamic balance of soil C input and output processes and strongly affects forest SOC [5]. Owing to the inconsistency of various factors, such as N addition experimental design, terrain characteristics, forest type, and soil properties [6,7], the effects are manifested mainly as promotion, inhibition, or no significant change [7,8]. Moreover, there is considerable controversy regarding the driving factors of forest SOC in response to N addition, with pH, the microbial community, enzyme activity, etc., serving as the potential main influencing factors [9,10]. Therefore, the mechanisms of forest SOC change still need to be further studied in the context of increasing global atmospheric N deposition.
SOC is an important indicator used to characterize soil quality and C sequestration capacity. However, owing to the complexity of its source and composition, the SOC concentration cannot fully reflect the rich attributes of the SOC pools [11]. Therefore, it has been separated into multiple fractions on the basis of stability and turnover rates [12], including stable (SOCP) and labile organic C (LOCP) pools [13]. LOCP, also known as the active SOC pool, is derived mainly from plant residue decomposition, root exudates, soil microbial residues, and metabolites [14], and it is usually considered a sensitive index that reflects early changes in SOC due to its direct participation in soil nutrient cycling and its sensitive response to external factors. LOCP is usually represented by dissolved organic carbon (DOC), microbial biomass carbon (MBC), and easily oxidized organic carbon (EOC) [15]. Blair et al. [16] distinguished SOCP from LOCP via the KMnO4 oxidation method and calculated the C pool lability (L). However, since the extractants used in chemical fractionation are destructive to the in situ structure of organic matter, some studies start with the stabilization process of SOC and separate it into two physical fractions according to particle size, i.e., particulate organic carbon (POC) and mineral-associated organic carbon (MAOC) [17,18]. POC is derived mainly from plants and has a faster turnover rate than MAOC because of its easy accessibility to decomposers; furthermore, POC has been classified as an LOCP by some researchers [19]. On the other hand, MAOC is derived mainly from microorganisms and binds to soil minerals to avoid decomposition [20,21].
Given the differences in their physicochemical properties, individual SOC fractions respond to N addition via different mechanisms. Under N addition, increases in DOC and MBC may be related to the increase in total dissolved N to provide sufficient nutrients for microbial activities [22]. In addition, DOC is also affected by leaching, and MBC is also affected by changes in soil chemistry, enzyme activity, and the microbial community [23]. Under N addition, the turnover of EOC is related to the microbial decomposition of SOC [8], whereas the increase in recalcitrant organic carbon (ROC) may be related to the utilization of the substrate by microorganisms and the promotion of humus colloid agglomeration by soil acidification [24]. Under N addition, the change in POC may be related to aboveground litter input and the microbial decomposition process [25], whereas the change in MAOC is usually influenced by mineral–C interactions [6]. Therefore, the effects of N addition on forest SOC fractions still require further investigation. Importantly, most previous studies have used one grouping or a C pool [26,27], which is not conducive to our systematic and comprehensive understanding of the mechanism by which forest SOC pools respond to N addition.
Plantations have made considerable contributions to improving ecological and economic benefits, and their area in China has ranked first in the world in recent years [28]. The expansion of China’s plantation area contributes more than 50% to the increase in C storage, which is essential for increasing forest C sinks and mitigating climate change [29]. As one of the main afforestation tree species in the subtropical region of China, Cryptomeria japonica var. sinensis is characterized by rapid growth and excellent wood texture, demonstrating exceptional adaptability to large-scale silvicultural programs. To explore the mechanism by which N addition affects the SOC pools, soil samples were collected from a subtropical Cryptomeria japonica var. sinensis plantation subjected to N addition for 2 years. Our objectives were to (1) determine how SOC and its fractions, L, and soil chemical properties respond to N deposition and (2) determine the main influencing factors that regulate SOC and L under N addition. To accomplish these objectives, we separated SOC fractions via physical and chemical fractionations and explored the driving factors of SOC and L via multiple statistical analyses. The subtropical region of China is one of the regions with the highest N deposition in the world and is generally considered as not limited by N [30,31]. We hypothesized that (1) N addition increased SOC and decreased L, which was due to the decrease in microbial activity caused by soil acidification, which inhibited the decomposition of SOC, and (2) MBC was the key factor driving SOC and L under N addition due to its characterization of microbial activity and its sensitive response to external factors.

2. Materials and Methods

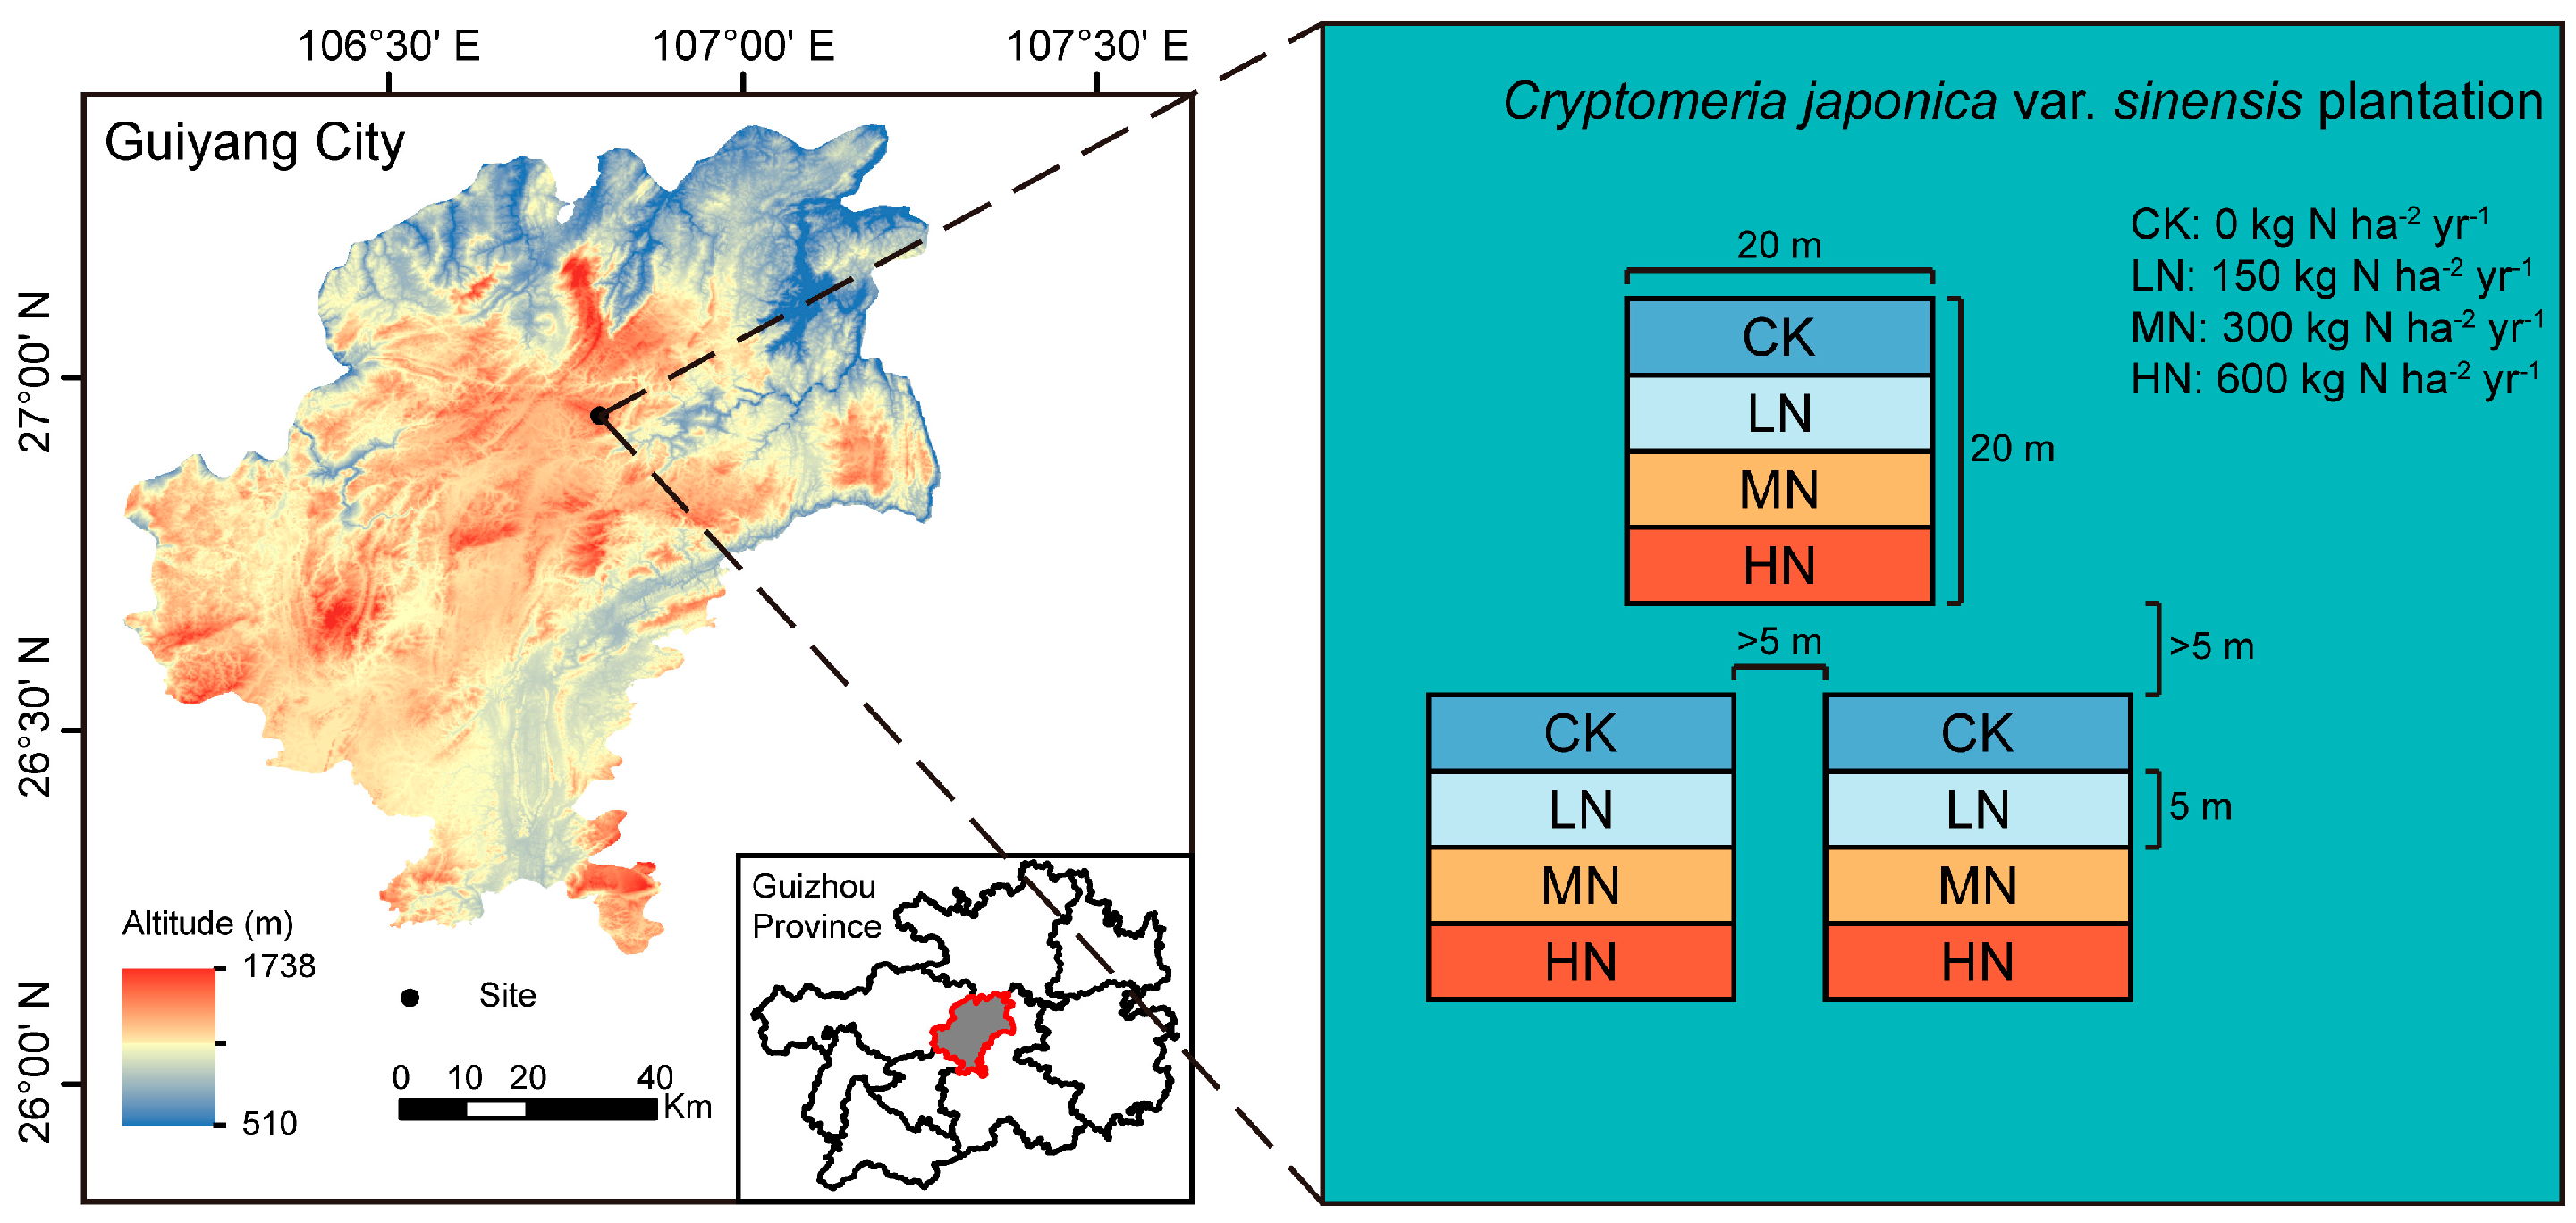
2.1. Overview of the Study Area

The study area is located in the Liutun branch of the Zhazuo Forest Farm, Guizhou Province, China (106°80′~106°81′ E, 26°95′~26°96′ N; 1200–1607 m a.s.l.). This area has a subtropical monsoon climate, where the mean annual temperature, annual precipitation, and relative humidity are 13.6 °C, 1200–1350 mm, and 85%, respectively. Underforest tending was implemented in 2011 in this area, as the vegetation type is relatively simple, with Cryptomeria japonica var. sinensis as the main artificial vegetation. The dominant understory species are Pyracantha fortuneana, Sabia japonica, Oplismenus compositus, etc. The area is dominated by Alisols (yellow soil) [32]. The basic soil properties in the upper surface (0–20 cm) were reported in our previous study [33]. The plots contained 3.25 g·kg−1 total phosphorus (TP) before N addition. The plots contained 111.71~194.08 μS·cm−1 electric conductivity (EC), 2.84~3.16 g·kg−1 total N (TN), 3.49~4.07 g·kg−1 TP, 5.04~5.41 g·kg−1 total potassium (TK), 1.58~2.45 mg·kg−1 available phosphorus (AP), and 82.04~89.88 mg·kg−1 available potassium (AK) after two years of N addition.

2.2. Experimental Design

In a 15-year-old Cryptomeria japonica var. sinensis plantation, three 20 × 20 m repeated fixed plots were set up, with plots spaced more than 5 m apart, and four 20 × 5 m fixed quadrats were set up in each plot. On the basis of the local ambient atmospheric N deposition rate (<150 kg N ha−2 yr−1) in Guizhou, the N addition levels for each plot were as follows: 0 (control check, CK), 150 (low nitrogen, LN), 300 (medium nitrogen, MN), and 600 (high nitrogen, HN) kg N ha−2 yr−1. Urea (CO(NH2)2) was used as the additional N source (Figure 1). N was applied to the plots starting in early March 2021 and every 3 months. Urea was dissolved in 10 L of deionized water and sprayed evenly in each square. The CK square was sprayed with the same volume of water.

2.3. Sample Collection and Processing

The soil samples were collected at the end of April 2023, and the organic material from horizon O (litter) of the sampling points were removed before sampling. In accordance with the five-point sampling method, we collected soil (0~20 cm) from each quadrat via a soil sampler (diameter of 5 cm). The soil samples from each quadrat were homogenized to obtain 12 representative samples (4 N-addition levels × 3 plots), which were subsequently placed in a 4 °C ice box to be taken back to the laboratory. After impurities such as animal and plant residues and small stones were removed, the samples were passed through a 2 mm sieve. A portion of each soil sample was stored in a refrigerator at 4 °C to determine the DOC, MBC, ammonium N (NH4+-N), and nitrate N (NO3-N) contents, and the other portion was naturally air-dried at room temperature to determine the pH and other SOC fractions. Three replicates were conducted for each representative sample.

2.4. Determination of Sample Indices

The soil chemical properties were determined following the procedures of Lu [34]. Briefly, the soil pH was determined with a pH meter in a 1:2.5 (weight/volume) mixture of soil and deionized H2O. NH4+-N was extracted with a 2 M KCl solution and determined via colorimetry and a spectrophotometer. NO3-N was extracted with a saturated CaSO4 solution and determined via colorimetry and a spectrophotometer. EC was determined with a conductivity meter in a 1:5 (weight/volume) mixture of soil and deionized H2O. TN was determined via the Kjeldahl method. TP and AP were determined via the molybdenum antimony antispectrophotometry. TK and AK were determined via a flame photometer [34].
The SOC and DOC contents were determined via H2SO4-K2Cr2O7 oxidation [34]. Before the determination of DOC, the samples were mixed with ultrapure water (soil-to-water ratio of 1:5) and then passed through a 0.45 μm filter membrane. MBC and MBN were determined via chloroform fumigation extraction, with reduction coefficients of 0.45 and 0.54, respectively [35]. The EOC was determined by oxidation with KMnO4 [16]. POC was determined via the wet sieving method [36].
The ROC and MAOC were calculated following the methods of Yuan et al. [37] and Zhang et al. [38], respectively, as follows:
ROC = SOC − EOC
MAOC = SOC − POC

2.5. Carbon Pool Lability Calculation

L refers to the concentration of the LOCP fraction divided by the concentration of the SOCP fraction and can reflect the soil C pool stability. L was calculated on the basis of the descriptions of Blair et al. [16] and Peng et al. [39], as follows:
LChem = EOC/ROC
LPhy = POC/MAOC
where LChem and LPhy represent L based on chemical and physical grouping, respectively.

2.6. Sensitivity Index Calculation

The sensitivity index (SI, %) represents the range of SOC fractions relative to the reference soil under different N additions. The CK soil was set as the reference soil. The SI was calculated with the methods of Sheng et al. [40] as follows:
SI = (CN − CCK)/CCK × 100
where CN and CCK represent the concentrations of the SOC fractions in the N-added and CK quadrats, respectively.

2.7. Statistical Analysis

Data processing, statistical analysis, and visualization were performed via R-4.4.1 software. All the data were analyzed with the Shapiro–Wilk and Levene tests. One-way analysis of variance (ANOVA) and least significant difference (LSD) tests were used to analyze the differences in each variable under different levels of N addition. Redundancy analysis (RDA) was used to analyze the relationships between the soil chemical properties and SOC fractions with the “vegan” package. Pearson’s correlation analysis was performed with the “Hmisc” package. The random forest (RF) algorithm was used to analyze significant variables to predict the importance of explanatory variables to SOC and L via the “randomForest” package.
Partial least squares structural equation modeling (PLS-SEM) was used to analyze significant variables to predict the effects of explanatory variables on SOC and L via the “plspm” package. It is assumed that N-addition measures regulate SOC fractions by affecting soil chemical properties, thereby affecting SOC and L. N-addition measures are characterized by the amount of N added and are included in the PLS-SEM as numerical variables. The significant indices with SOC and L were selected as observational variables. The observation variables that did not meet the modeling conditions were eliminated so that their loads with latent variables were greater than 0.7 and that there was no stronger relationship with other latent variables. Finally, the fitting quality of PLS-SEM was evaluated via the goodness of fit (GoF). The images in this paper were plotted via the “ggplot2” and “corrplot” packages. All the data are expressed as the means ± standard errors.

3. Results

3.1. Soil Organic Carbon

The SOC concentration significantly increased as the level of N addition increased; furthermore, the SOC concentration increased by 31.9%~41.2% under N addition compared with that in the CK group (Figure 2).

3.2. Soil Organic Carbon Fraction

N addition significantly increased the concentrations of the SOC fractions. DOC, MBC, and EOC significantly decreased under N addition, whereas ROC, POC, and MAOC significantly increased (Figure 3). Compared with that in the CK group, DOC was significantly lower by 39.3% in the LN group, and MBC was significantly lower by 80.2% in the MN group and 79.1% in the HN group (Figure 3a). EOC was significantly lower by 23.5% in the LN group and 29.2% in the MN group, whereas ROC was significantly greater by 39.2%~49.5%, reaching a maximum in the HN group (Figure 3b). POC and MAOC significantly increased by 46.2%~124.0% and 25.1%~29.1%, respectively, and reached a maximum in the HN group and LN group, respectively (Figure 3c).
N addition significantly increased the distribution ratios of the SOC fractions. In addition to significant increases in ROC/SOC and POC/SOC, the distribution ratios of the SOC fractions significantly decreased under N addition (Figure 3). Compared with those in the CK group, the DOC/SOC and MBC/SOC ratios significantly decreased by 41.3%~54.1% and 21.1%~85.2%, respectively (Figure 3d). The EOC/SOC ratio significantly decreased by 42.3%~47.0%, whereas the ROC/SOC ratio significantly increased by 5.6%~6.2% (Figure 3e). The POC/SOC ratio significantly increased by 29.6% in the MN group and 58.8% in the HN group, and the MAOC/SOC ratio significantly decreased by 5.8% in the MN group and 11.5% in the HN group (Figure 3f).
The SI of MBC, POC, and ROC was greater than that of SOC under N addition, indicating that they were more sensitive to N addition than SOC was (Table 1).

3.3. Soil Carbon Pool Lability

N addition had significant effects on L. LChem decreased significantly and reached a minimum in the MN group under N addition, whereas LPhy increased significantly and increased with increasing N addition level (Figure 4). Compared with that in the CK group, the LChem significantly decreased by 45.9%~50.6% (Figure 4a), whereas the LPhy significantly increased by 37.8% in the MN group and by 79.5% in the HN group (Figure 4b).

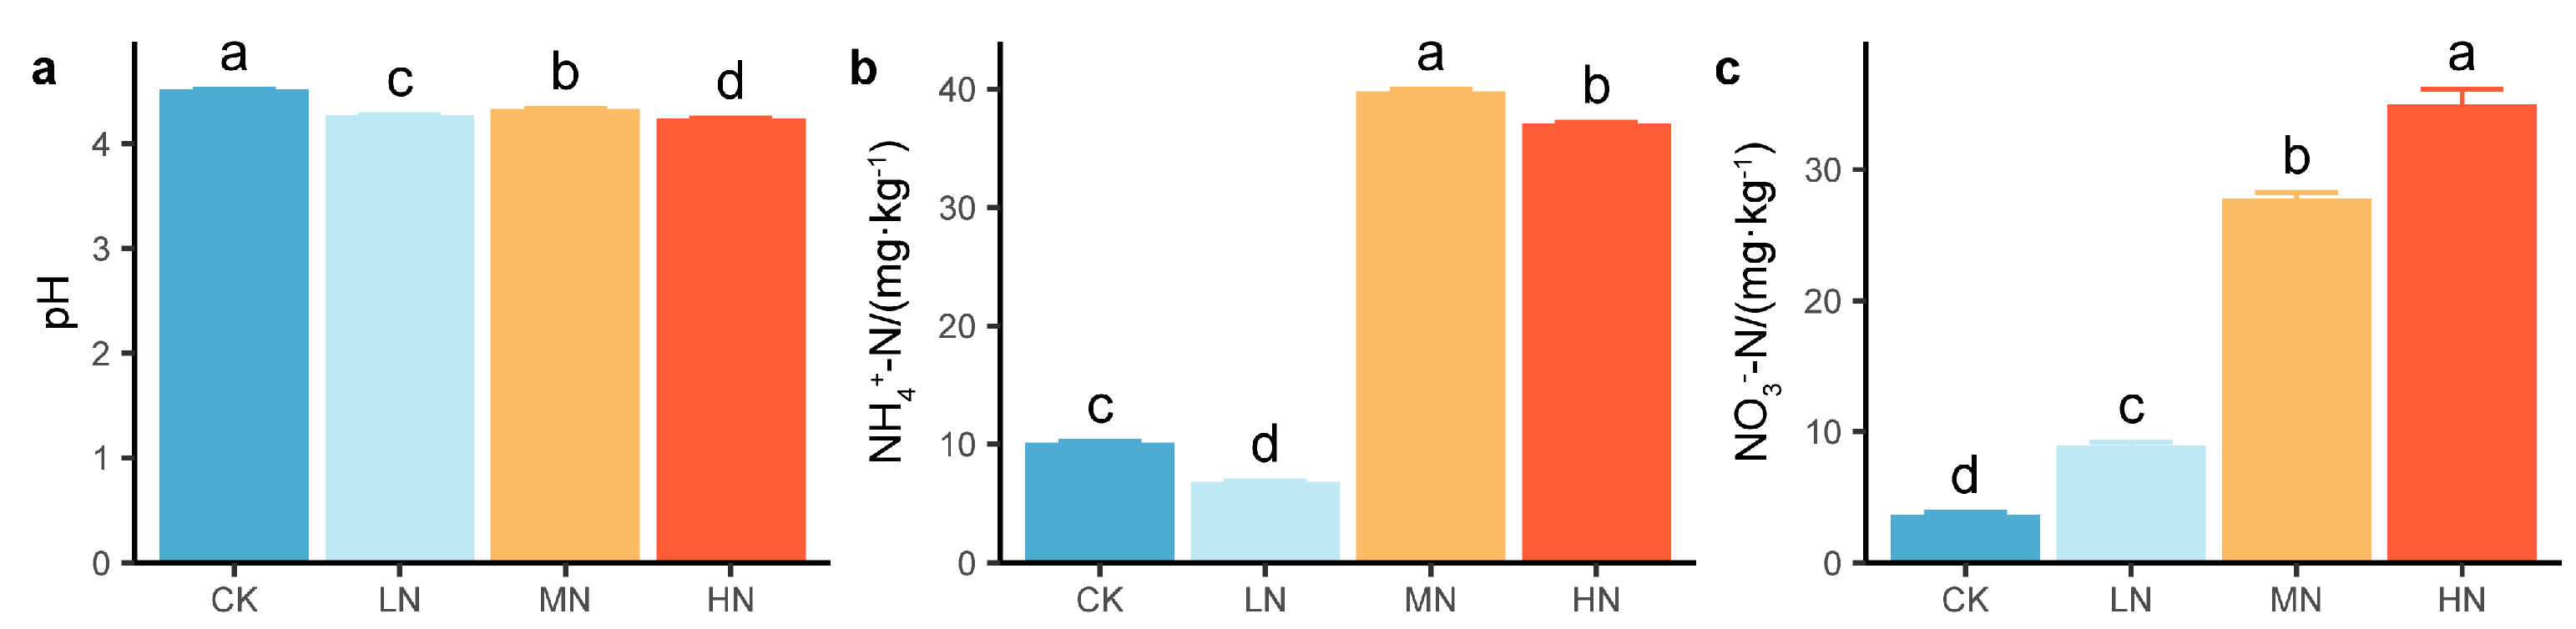
3.4. Soil Chemical Properties

N addition had significant effects on the soil chemical properties (Figure 5). Compared with that in the CK group, the pH significantly decreased by 4.1%~6.1% under N addition (Figure 5a); NH4+-N significantly decreased by 32.7% in the LN group but significantly increased by 292.4% in the MN group and 265.2% in the HN group (Figure 5b). NO3-N significantly increased by 145.7%~860.9% under N addition (Figure 5c).

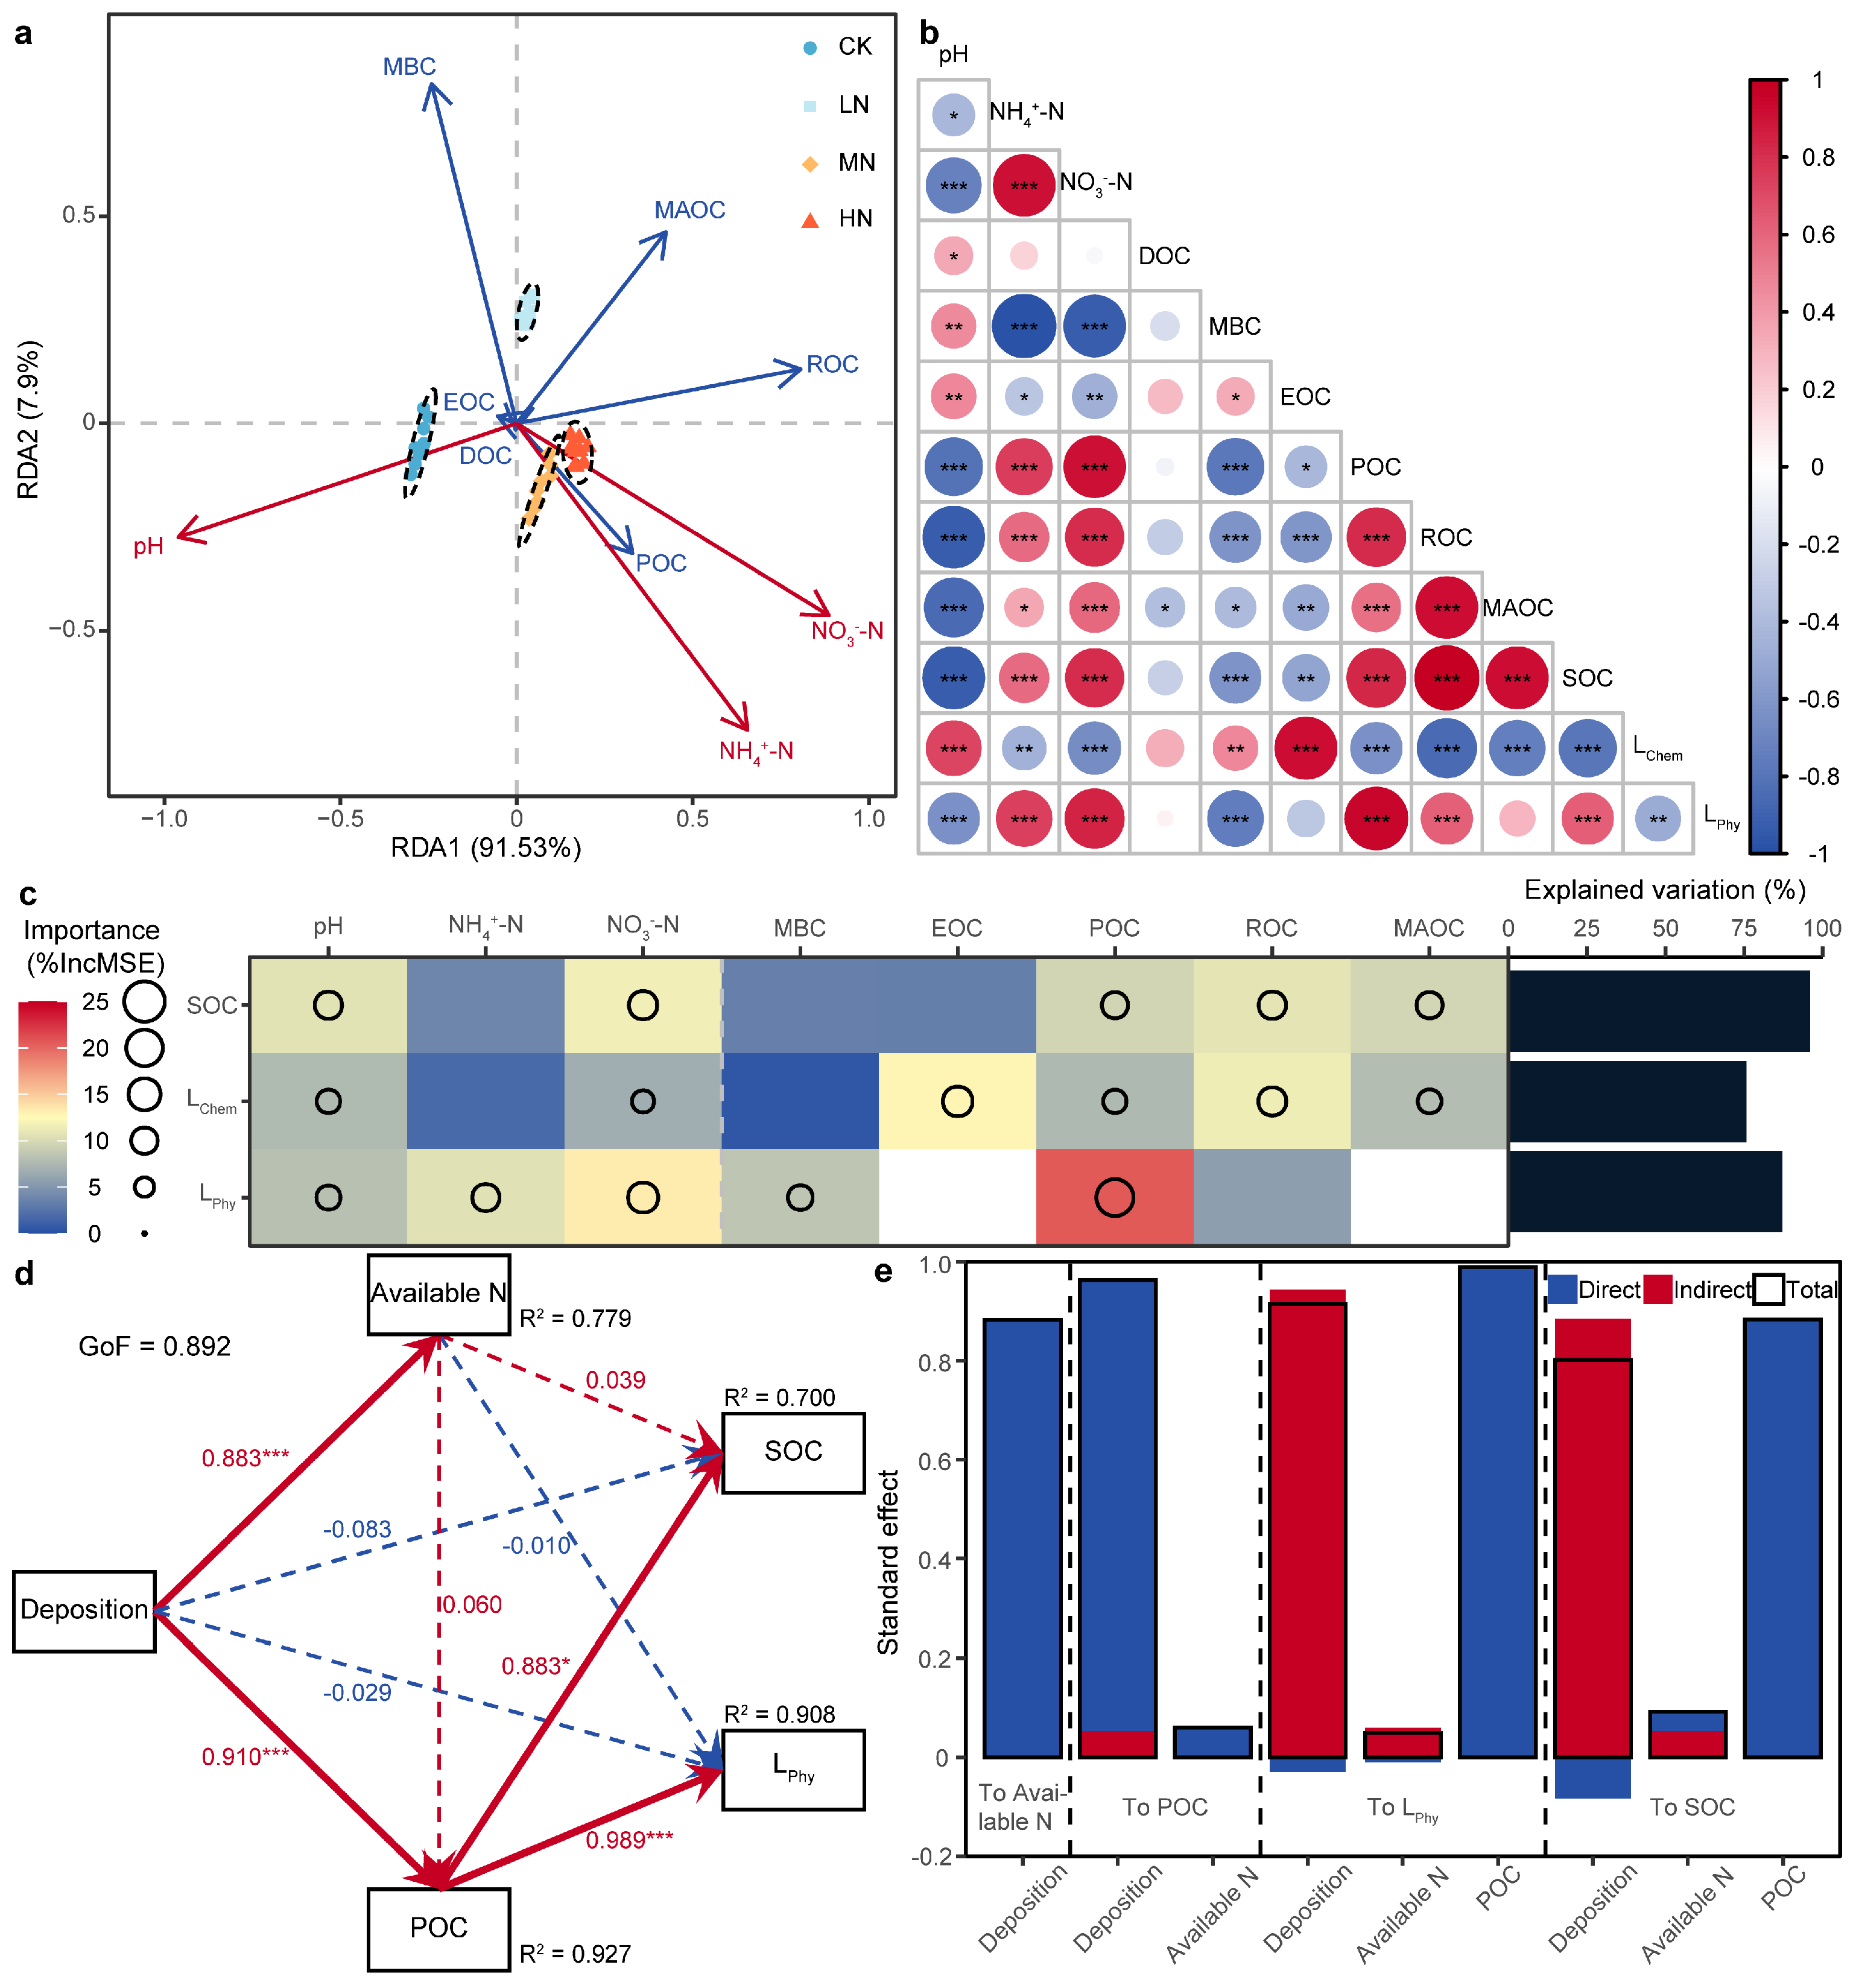
3.5. Driving Factors of Soil Organic Carbon and Carbon Pool Lability

To clarify the relationships between the soil chemical properties and concentrations of the SOC fractions, RDA was performed (Figure 6a). RDA revealed that the sample distribution varied significantly among the N addition treatments; the first two constraint axes of the soil chemical properties explained 99.43% of the total variance in the concentrations of the SOC fractions, and the difference in the concentrations of the SOC fractions was well explained by pH, NH4+-N, and NO3-N. pH was significantly positively correlated with DOC and EOC. NH4+-N, NO3-N, and POC were significantly positively correlated with one another, and all of these parameters were significantly negatively correlated with MBC.
The Pearson correlation coefficients not only confirmed the above results but also revealed additional correlations between SOC, L, and the impact factors (Figure 6b). SOC was highly significantly positively correlated with LPhy, NH4+-N, NO3-N, POC, ROC, and MAOC and highly significantly negatively correlated with LChem, pH, MBC, and EOC. Furthermore, LChem was highly significantly negatively correlated with LPhy.
To clarify the main factors influencing SOC and L, the RF algorithm was used to examine both the SOC and L, as well as their influencing factors (Figure 6c). The RF results revealed that the indices explained 95.88%, 75.74%, and 87.16% of the variance in SOC, LChem, and LPhy, respectively. NO3-N, EOC, and POC had the strongest effects on SOC, LChem, and LPhy, respectively. In addition, pH, NO3-N, and POC had significant effects on SOC, LChem, and LPhy.
To further clarify the driving mechanism of N addition on SOC and L, PLS-SEM was performed (Figure 6d). PLS-SEM fit the driving mechanism of SOC and L well (GoF = 0.892). N addition was found to directly or indirectly affect SOC and L by changing the soil chemical properties and SOC fractions, thus explaining the changes in both parameters (R2 > 0.89). The standardized total effect order of SOC and L was POC > deposition > available N, and POC was more directly affected by N addition (Figure 6e). These results indicated that POC was the main driving factor of SOC and L under N addition.

4. Discussion

4.1. Effects of Nitrogen Addition on Soil Organic Carbon

In this study, the SOC concentration increased significantly under N addition (Figure 2), thus supporting Hypothesis 1. This result shows that N addition promotes soil C sequestration in karst plantations, which is consistent with the findings of previous studies [41]. SOC concentrations depend on the balance between the C accumulation processes dominated by vegetation productivity and the C release processes dominated by soil microbial decomposition [42]. Studies conducted at the same plots revealed that N addition promoted SOC accumulation in roots, promoted the litter decomposition rate, and inhibited the mineral soil respiration rate [43,44]. Therefore, N addition could simultaneously affect the soil C input and output processes. In this study, the soil N:P ratio was <14 before and after N addition, indicating that the plots were highly N limited. On the basis of the N saturation hypothesis [45], adding N to an N-limited ecosystem may promote net primary productivity [46], increase litter yield and quality (thus reducing the C:N ratio of the matrix), and reduce the decomposition-resistant compounds contained in the litter, whereas increased MBC in the LN group may promote litter decomposition and decay [47,48]. Optimal C allocation theory [49] suggests that at relatively high levels of N addition, plants reduce their underground resource allocation by reducing root growth and instead invest more C in aboveground growth [50]. Moreover, the MBC decreased significantly (Figure 3a), and soil microbial activity was inhibited [51], which in turn reduced the litter decomposition rate, organic matter mineralization rate and SOC turnover [52].

4.2. Effects of Nitrogen Addition on Soil Organic Carbon Fractions and Carbon Pool Lability

Under N addition, the concentrations and distribution ratios of DOC, MBC, and EOC significantly decreased, and the concentrations and distribution ratios of POC significantly increased, whereas the concentrations and distribution ratios of ROC and the concentrations of MAOC significantly increased (Figure 3). These results are consistent with those of previous studies [7,48], likely because N addition promotes the conversion of the LOCP and SOCP fractions [53]. This result was explained by our finding that the SI of the ROC was greater than that of the SOC (Table 1), which indicated that the EOC supplemented the ROC.
Increased N availability may promote plant growth, increase the input of litter and root exudates to the soil, and provide a rich source of EOC and POC [54]. However, the changes in these two parameters did not trend in the same direction with the increase in N addition (Figure 3b,c). Soil nutrients have a significant effect on SOC fractions [55]. There was a significant correlation between the soil chemical properties and the SOC fractions (Figure 6b). On the one hand, increased N availability may accelerate the condensation reaction between SOC and phenolic compounds or lignin, thereby forming stable SOC that is more difficult to decompose [56] and thus enhancing the chemical stability of soil organic matter [57]. On the other hand, soil acidification inhibits extracellular enzyme activity and reduces the utilization of refractory organic matter by microorganisms, thus contributing to the accumulation of stable SOC [58]. The increase in ROC is generally believed to be related to the change in the composition of complex and stable macromolecular organic compounds formed by microbial action [59], and the increase in MAOC is related to the changes in CUE mediated by the microbial community and the chemical bonding of mineral–organic complexes caused by soil acidification [60]. Therefore, understanding the response of soil microbial communities to N addition is crucial for exploring the mechanisms underlying changes in SOC, which need to be further researched.
LChem decreased significantly and LPhy increased significantly under N addition (Figure 4), indicating that N addition increased soil chemical stability and decreased soil physical stability. There was a significant correlation between the L and SOC fractions (Figure 6b), and the different response directions of the SOC fractions to N addition explained the change in L (Figure 3). Most studies have shown that LOCP fractions are relatively sensitive to N addition and are important factors in regulating C pool stability [61,62]. This finding was the same as our result that EOC and POC were the main influencing factors for LChem and LPhy, respectively (Figure 6c).

4.3. Factors Affecting Soil Organic Carbon and Carbon Pool Lability Under Nitrogen Addition

In this study, N deposition significantly decreased the pH and significantly increased NO3-N (Figure 5a,c). Since the low soil pH (4.52) in the plot may decrease soil inorganic C buffering, plant–soil N cycling processes may play an important role in soil acidification [63]. In addition, pH and NO3-N were highly significantly correlated with SOC and L (Figure 6b; p < 0.001) and were the main factors influencing SOC and L (Figure 6c). Therefore, N addition increases soil acidification and N availability, thus affecting SOC and L [9]. The PLS-SEM results revealed that N availability had a greater indirect effect than direct effect on SOC and L. It is possible that the change in soil chemical properties caused by N addition was inhibited. On the one hand, increased soil H+ promotes the activation of Al3+, thus aggravating the “aluminum toxicity” effect [45,51]. On the other hand, large N inputs can alter the osmotic potential of the soil solution [64], thus introducing additional ions. Both increased soil H+ and large N inputs inhibit microbial biomass [48], thereby reducing soil C losses [65]. This was explained by our finding that MBC was significantly positively correlated with pH and significantly negatively correlated with NO3-N (Figure 6b; p < 0.01).
POC was the main influencing factor and an important driving factor of SOC and L under N addition (Figure 6c–e), which does not support Hypothesis 2. This may be because the accumulation of POC is greater than the decrease in MBC under N addition. This was explained by our finding that the SI of POC was significantly greater than that of MBC in the LN and HN groups (Table 1). Nevertheless, we cannot ignore the effects of MBC on SOC and L because significantly decreased microbial biomass leads to the slow decomposition of partial POC [51,66]. Litter yield and quality improvement caused by N addition cause microorganisms to preferentially decompose high-quality litter, whereas low-quality litter (with a relatively high C:N ratio or structural C concentration) is more easily retained in particulate organic matter [67]. Similarly, root litter, which is rich in stable compounds (lignin, lipids, cellulose, tannins, etc.), is not easily decomposed and absorbed by microorganisms and forms POC through in vitro modification [68]. Therefore, N addition may increase POC by affecting litter decomposition and nutrient return, subsequently altering SOC and L.

5. Conclusions

In this study, we used different N addition levels to investigate the effects of N addition on SOC and L in a karst plantation. We found that N addition promoted soil carbon sequestration and altered carbon pool stability mainly by affecting POC. In addition, N addition can affect soil carbon sequestration and carbon pool stability to a certain extent by increasing soil acidification and N availability. Further exploration of the mechanism by which POC affects soil C sequestration and C pool stability under N addition by combining forest plants and soil microorganisms should be the subject of future research. Nevertheless, this study highlights the important role of POC in mediating the impacts of N addition on forest soil carbon sequestration and carbon pool stability, and it provides a theoretical basis for the study of forest soil C dynamics in the context of N deposition.

Author Contributions

Conceptualization, T.Z. and G.X.; methodology, T.Z., G.X. and Y.Y.; software, T.Z.; validation, T.Z., G.X., Y.Y., Q.L., X.J., C.H. and W.Z.; formal analysis, T.Z. and G.X.; investigation, T.Z., Q.L. and X.J.; resources, G.X., Y.Y., C.H. and W.Z.; data curation, T.Z. and G.X.; writing—original draft preparation, T.Z.; writing—review and editing, T.Z. and G.X.; visualization, T.Z.; supervision, G.X.; project administration, T.Z. and G.X.; funding acquisition, G.X. and Y.Y. All authors have read and agreed to the published version of the manuscript.

Funding

This research was funded by the Guizhou Provincial Science and Technology Project (No. [2020]1Y071) and the Science and Technology Foundation of Guizhou Province, China (No. MS [2025]213).

Data Availability Statement

The raw data supporting the conclusions of this article will be made available by the authors upon request.

Conflicts of Interest

The authors declare no conflicts of interest.

References

  1. Galloway, J.N.; Townsend, A.R.; Erisman, J.W.; Bekunda, M.; Cai, Z.C.; Freney, J.R.; Martinelli, L.A.; Seitzinger, S.P.; Sutton, M.A. Transformation of the nitrogen cycle: Recent trends, questions, and potential solutions. Science 2008, 320, 889–892. [Google Scholar] [CrossRef] [PubMed]
  2. Galloway, J.N.; Cowling, E.B.; Seitzinger, S.P.; Socolow, R.H. Reactive nitrogen: Too much of a good thing? AMBIO J. Hum. Environ. 2002, 31, 60–63. [Google Scholar] [CrossRef] [PubMed]
  3. Guenet, B.; Gabrielle, B.; Chenu, C.; Arrouays, D.; Balesdent, J.; Bernoux, M.; Bruni, E.; Caliman, J.-P.; Cardinael, R.; Chen, S.C.; et al. Can N2O emissions offset the benefits from soil organic carbon storage? Glob. Change Biol. 2020, 27, 237–256. [Google Scholar] [CrossRef] [PubMed]
  4. Pan, Y.D.; Birdsey, R.A.; Fang, J.Y.; Houghton, R.; Kauppi, P.E.; Kurz, W.A.; Phillips, O.L.; Shvidenko, A.; Lewis, S.L.; Canadell, J.G.; et al. A large and persistent carbon sink in the world’s forests. Science 2011, 333, 988–993. [Google Scholar] [CrossRef]
  5. Eastman, B.A.; Adams, M.B.; Brzostek, E.R.; Burnham, M.B.; Carrara, J.E.; Kelly, C.; McNeil, B.E.; Walter, C.A.; Peterjohn, W.T. Altered plant carbon partitioning enhanced forest ecosystem carbon storage after 25 years of nitrogen additions. New Phytol. 2021, 230, 1435–1448. [Google Scholar] [CrossRef]
  6. Chen, Z.J.; Geng, S.C.; Zhou, X.Y.; Gui, H.R.; Zhang, L.L.; Huang, Z.Q.; Wang, M.H.; Zhang, J.H.; Han, S.J. Nitrogen addition decreases soil aggregation but enhances soil organic carbon stability in a temperate forest. Geoderma 2022, 426, 116112. [Google Scholar] [CrossRef]
  7. Yu, M.X.; Wang, Y.P.; Baldock, J.A.; Jiang, J.; Mo, J.M.; Zhou, G.Y.; Yan, J.H. Divergent responses of soil organic carbon accumulation to 14 years of nitrogen addition in two typical subtropical forests. Sci. Total Environ. 2020, 707, 136104. [Google Scholar] [CrossRef]
  8. Lu, X.F.; Ren, W.D.; Hou, E.Q.; Zhang, L.L.; Wen, D.Z.; Liu, Z.F.; Lin, Y.B.; Wang, J.; Kuang, Y.W. Negative effects of canopy N addition on soil organic carbon in wet season are primarily detected in uppermost soils of a subtropical forest. Glob. Ecol. Conserv. 2019, 17, e00543. [Google Scholar] [CrossRef]
  9. Ma, T.Y.; Liu, X.Y.; Xu, S.Q.; Guo, H.R.; Huang, H.; Hu, C.C.; Wu, D.; Sun, Z.C.; Chen, C.J.; Song, W. Levels and variations of soil organic carbon and total nitrogen among forests in a hotspot region of high nitrogen deposition. Sci. Total Environ. 2020, 713, 136620. [Google Scholar] [CrossRef]
  10. Xie, J.Y.; Chen, M.Y.; Zhang, X.; Wang, S.L.; Fang, X.M.; Xie, M.Y.; Zhang, L. Understory vegetation altered soil CO2 and N2O emissions and the correlation with plant and soil stoichiometry following N and P addition in Chinese fir plantations. Plant Soil 2023, 501, 155–170. [Google Scholar] [CrossRef]
  11. Tang, B.; Rocci, K.S.; Lehmann, A.; Rillig, M.C. Nitrogen increases soil organic carbon accrual and alters its functionality. Glob. Change Biol. 2023, 29, 1971–1983. [Google Scholar] [CrossRef] [PubMed]
  12. Kaiser, M.; Piegholdt, C.; Andruschkewitsch, R.; Linsler, D.; Koch, H.J.; Ludwig, B. Impact of tillage intensity on carbon and nitrogen pools in surface and sub-surface soils of three long-term field experiments. Eur. J. Soil Sci. 2014, 65, 499–509. [Google Scholar] [CrossRef]
  13. Kumar, S.; Singh, A.K.; Ghosh, P. Distribution of soil organic carbon and glomalin related soil protein in reclaimed coal mine-land chronosequence under tropical condition. Sci. Total Environ. 2018, 625, 1341–1350. [Google Scholar] [CrossRef]
  14. He, H.; Peng, M.W.; Lu, W.D.; Ru, S.B.; Hou, Z.N.; Li, J.H. Organic fertilizer substitution promotes soil organic carbon sequestration by regulating permanganate oxidizable carbon fractions transformation in oasis wheat fields. Catena 2023, 221, 106784. [Google Scholar] [CrossRef]
  15. Yang, X.; Meng, J.; Lan, Y.; Chen, W.F.; Yang, T.X.; Yuan, J.; Liu, S.N.; Han, J. Effects of maize stover and its biochar on soil CO2 emissions and labile organic carbon fractions in Northeast China. Agric. Ecosyst. Environ. 2017, 240, 24–31. [Google Scholar] [CrossRef]
  16. Blair, G.; Lefroy, R.; Lisle, L. Soil carbon fractions based on their degree of oxidation, and the development of a carbon management index for agricultural systems. Aust. J. Agric. Res. 1995, 46, 1459. [Google Scholar] [CrossRef]
  17. Cotrufo, M.F.; Ranalli, M.G.; Haddix, M.L.; Six, J.; Lugato, E. Soil carbon storage informed by particulate and mineral-associated organic matter. Nat. Geosci. 2019, 12, 989–994. [Google Scholar] [CrossRef]
  18. Samson, M.-E.; Chantigny, M.H.; Vanasse, A.; Menasseri-Aubry, S.; Royer, I.; Angers, D.A. Management practices differently affect particulate and mineral-associated organic matter and their precursors in arable soils. Soil Biol. Biochem. 2020, 148, 107867. [Google Scholar] [CrossRef]
  19. Li, Y.; Li, Z.; Cui, S.; Liang, G.P.; Zhang, Q.P. Microbial-derived carbon components are critical for enhancing soil organic carbon in no-tillage croplands: A global perspective. Soil Tillage Res. 2021, 205, 104758. [Google Scholar] [CrossRef]
  20. Lavallee, J.M.; Soong, J.L.; Cotrufo, M.F. Conceptualizing soil organic matter into particulate and mineral-associated forms to address global change in the 21st century. Glob. Change Biol. 2019, 26, 261–273. [Google Scholar] [CrossRef]
  21. Lugato, E.; Lavallee, J.M.; Haddix, M.L.; Panagos, P.; Cotrufo, M.F. Different climate sensitivity of particulate and mineral-associated soil organic matter. Nat. Geosci. 2021, 14, 295–300. [Google Scholar] [CrossRef]
  22. Fu, R.X.; Yu, Y.C.; He, Y.; Xu, X.N.; Sun, X.; Yang, J.; Tao, X. The impacts of nitrogen addition on the active carbon pools in forest soils along an urban–rural gradient. Catena 2024, 236, 107769. [Google Scholar] [CrossRef]
  23. Zhong, X.L.; Li, J.T.; Li, X.J.; Ye, Y.C.; Liu, S.S.; Hallett, P.D.; Ogden, M.R.; Naveed, M. Physical protection by soil aggregates stabilizes soil organic carbon under simulated N deposition in a subtropical forest of China. Geoderma 2017, 285, 323–332. [Google Scholar] [CrossRef]
  24. Chen, X.M.; Li, Y.L.; Mo, J.M.; Otieno, D.; Tenhunen, J.; Yan, J.H.; Liu, J.X.; Zhang, D.Q. Effects of nitrogen deposition on soil organic carbon fractions in the subtropical forest ecosystems of S China. J. Plant Nutr. Soil Sci. 2012, 175, 947–953. [Google Scholar] [CrossRef]
  25. Chen, J.Q.; Zhang, Q.F.; Dai, H.; Feng, J.G.; Zeng, Q.X.; Sun, X.Q.; Peng, Y.Z.; Chen, W.W.; Zhu, B.; Chen, Y. Nitrogen addition promotes the accumulation of soil particulate organic carbon in a subtropical forest. Forests 2024, 15, 619. [Google Scholar] [CrossRef]
  26. Li, Y.D.; Wang, B.; Dou, S.; Shen, H.Y.; Mei, L.Y.; Zhang, Y.; Zeng, X.M.; Zhang, Y.Y.; Pei, Y.M.; Ren, H.Y.; et al. Divergent responses of soil carbon and nitrogen pools to short-term nitrogen addition between two plantations in Northeast China. Int. J. Agric. Biol. Eng. 2019, 12, 82–90. [Google Scholar] [CrossRef]
  27. Zhang, J.F.; Zhou, J.G.; Sayer, E.J.; Lambers, H.; Liu, Z.F.; Lu, X.K.; Li, Y.W.; Li, Y.X.; Li, H.; Wang, F.M. Nitrogen deposition enhances soil organic carbon and microbial residual carbon in a tropical forest. Plant Soil 2022, 484, 217–235. [Google Scholar] [CrossRef]
  28. Liu, X.M.; Wang, C.; Gao, J.X.; Yuan, J.F.; Huang, Y.; Wang, B.; Peng, Y. Approaches to carbon sequestration enhancement in China’s plantation ecosystem for carbon peaking and carbon neutrality goals. Acta Ecol. Sin. 2023, 43, 5662–5673. [Google Scholar]
  29. Cheng, K.; Yang, H.T.; Tao, S.L.; Su, Y.J.; Guan, H.C.; Ren, Y.; Hu, T.Y.; Li, W.K.; Xu, G.C.; Chen, M.X.; et al. Carbon Storage through China’s Planted Forest Expansion. Nat. Commun. 2024, 15, 4106. [Google Scholar] [CrossRef]
  30. Du, E.Z.; Terrer, C.; Pellegrini, A.F.A.; Ahlström, A.; van Lissa, C.J.; Zhao, X.; Xia, N.; Wu, X.H.; Jackson, R.B. Global patterns of terrestrial nitrogen and phosphorus limitation. Nat. Geosci. 2020, 13, 221–226. [Google Scholar] [CrossRef]
  31. Liu, X.J.; Zhang, Y.; Han, W.X.; Tang, A.H.; Shen, J.L.; Cui, Z.L.; Vitousek, P.; Erisman, J.W.; Goulding, K.; Christie, P.; et al. Enhanced nitrogen deposition over China. Nature 2013, 494, 459–462. [Google Scholar] [CrossRef] [PubMed]
  32. IUSS Working Group WRB. World Reference Base for Soil Resources. International Soil Classification System for Naming Soils and Creating Legends for Soil Maps, 4th ed.; International Union of Soil Sciences (IUSS): Vienna, Austria, 2022. [Google Scholar]
  33. Yuan, Y.S.; Gu, D.P.; Huang, Z.X.; Zhang, J.L.; Xia, G.W.; Chen, L.J. Plant roots and associated mycelia enhance soil N transformation through different mechanisms in a karst plantation. J. Soils Sediments 2023, 23, 1687–1697. [Google Scholar] [CrossRef]
  34. Lu, R.K. Analysis Methods of Soil Agricultural Chemistry; China Agricultural Science and Technology Press: Beijing, China, 2000. [Google Scholar]
  35. Wu, J.; Joergensen, R.G.; Pommerening, B.; Chaussod, R.; Brookes, P.C. Measurement of soil microbial biomass C by fumigation-extraction—An automated procedure. Soil Biol. Biochem. 1990, 22, 1167–1169. [Google Scholar] [CrossRef]
  36. Six, J.; Conant, R.T.; Paul, E.A.; Paustian, K. Stabilization mechanisms of soil organic matter: Implications for C-saturation of soils. Plant Soil 2002, 241, 155–176. [Google Scholar] [CrossRef]
  37. Yuan, G.Y.; Huan, W.W.; Song, H.; Lu, D.J.; Chen, X.Q.; Wang, H.Y.; Zhou, J.M. Effects of straw incorporation and potassium fertilizer on crop yields, soil organic carbon, and active carbon in the rice–wheat system. Soil Tillage Res. 2021, 209, 104958. [Google Scholar] [CrossRef]
  38. Zhang, Y.X.; Tang, Z.X.; You, Y.M.; Guo, X.W.; Wu, C.J.; Liu, S.R.; Sun, O.J. Differential effects of forest-floor litter and roots on soil organic carbon formation in a temperate oak forest. Soil Biol. Biochem. 2023, 180, 109017. [Google Scholar] [CrossRef]
  39. Peng, X.Y.; Huang, Y.; Duan, X.W.; Yang, H.; Liu, J.X. Particulate and mineral-associated organic carbon fractions reveal the roles of soil aggregates under different land-use types in a karst faulted basin of China. Catena 2023, 220, 106721. [Google Scholar] [CrossRef]
  40. Sheng, H.; Zhou, P.; Zhang, Y.Z.; Kuzyakov, Y.; Zhou, Q.; Ge, T.D.; Wang, C.H. Loss of labile organic carbon from subsoil due to land-use changes in subtropical China. Soil Biol. Biochem. 2015, 88, 148–157. [Google Scholar] [CrossRef]
  41. Hu, Y.L.; Deng, Q.; Kätterer, T.; Olesen, J.E.; Ying, S.C.; Ochoa-Hueso, R.; Mueller, C.W.; Weintraub, M.N.; Chen, J. Depth-dependent responses of soil organic carbon under nitrogen deposition. Glob. Change Biol. 2024, 30, e17247. [Google Scholar] [CrossRef]
  42. Rahman, M.M.; Bárcena, T.G.; Vesterdal, L. Tree species and time since afforestation drive soil C and N mineralization on former cropland. Geoderma 2017, 305, 153–161. [Google Scholar] [CrossRef]
  43. Xia, G.W.; Wang, D.F.; Zhu, T.; Jiang, X.H.; Chen, G.P.; Huang, C.L. Effects of nitrogen addition and litter removal on soil respiration of Cryptomeria fortunei plantation in Karst Area of central Guizhou Province. Acta Ecol. Sin. 2023, 43, 8587–8597. [Google Scholar]
  44. Yuan, Y.S.; Yin, Y.C.; Adamczyk, B.; Liang, D.; Gu, D.P.; Xia, G.W.; Zhang, J.L.; Zhang, Z.L. Nitrogen addition alters the relative importance of roots and mycorrhizal hyphae in regulating soil organic carbon accumulation in a karst forest. Soil Biol. Biochem. 2024, 195, 109471. [Google Scholar] [CrossRef]
  45. Aber, J.; McDowell, W.; Nadelhoffer, K.; Magill, A.; Berntson, G.; Kamakea, M.; McNulty, S.; Currie, W.; Rustad, L.; Fernandez, I. Nitrogen saturation in temperate forest ecosystems: Hypotheses revisited. Bioscience 1998, 48, 921–934. [Google Scholar] [CrossRef]
  46. Fatemi, F.R.; Fernandez, I.J.; Simon, K.S.; Dail, D.B. Nitrogen and phosphorus regulation of soil enzyme activities in acid forest soils. Soil Biol. Biochem. 2016, 98, 171–179. [Google Scholar] [CrossRef]
  47. Barantal, S.; Schimann, H.; Fromin, N.; Hättenschwiler, S. C, N and P fertilization in an amazonian rainforest supports stoichiometric dissimilarity as a driver of litter diversity effects on decomposition. Proc. R. Soc. B Biol. Sci. 2014, 281, 20141682. [Google Scholar] [CrossRef]
  48. Zhang, T.; Chen, H.Y.H.; Ruan, H.H. Global negative effects of nitrogen deposition on soil microbes. ISME J. 2018, 12, 1817–1825. [Google Scholar] [CrossRef]
  49. Chapin, F.S., III; Bloom, A.J.; Field, C.B.; Waring, R.H. Plant responses to multiple environmental factors: Physiological ecology provides tools for studying how interacting environmental resources control plant growth. Bioscience 1987, 37, 49–57. [Google Scholar] [CrossRef]
  50. Mo, J.M.; Zhang, W.; Zhu, W.X.; Gundersen, P.; Fang, Y.T.; Li, D.J.; Wang, H. Nitrogen addition reduces soil respiration in a mature tropical forest in southern China. Glob. Change Biol. 2007, 14, 403–412. [Google Scholar] [CrossRef]
  51. Chen, J.G.; Xiao, W.; Zheng, C.Y.; Zhu, B. Nitrogen addition has contrasting effects on particulate and mineral-associated soil organic carbon in a subtropical forest. Soil Biol. Biochem. 2020, 142, 107708. [Google Scholar] [CrossRef]
  52. Wang, Q.K.; Wang, S.L.; He, T.X.; Liu, L.; Wu, J.B. Response of organic carbon mineralization and microbial community to leaf litter and nutrient additions in subtropical forest soils. Soil Biol. Biochem. 2014, 71, 13–20. [Google Scholar] [CrossRef]
  53. Du, Y.H.; Guo, P.; Liu, J.Q.; Wang, C.Y.; Yang, N.; Jiao, Z.X. Different types of nitrogen deposition show variable effects on the soil carbon cycle process of temperate forests. Glob. Change Biol. 2014, 20, 3222–3228. [Google Scholar] [CrossRef] [PubMed]
  54. Guo, J.Y.; Wang, Y.X.; Li, J.L. Effects of nitrogen addition on plant-soil carbon dynamics in terrestrial ecosystems of China. Acta Ecol. Sin. 2022, 42, 4823–4833. [Google Scholar]
  55. Deng, W.B.; Wang, X.; Hu, H.B.; Zhu, M.D.; Chen, J.Y.; Zhang, S.; Cheng, C.; Zhu, Z.Y.; Wu, C.M.; Zhu, L. Variation characteristics of soil organic carbon storage and fractions with stand age in north subtropical Quercus acutissima Carruth. forest in China. Forests 2022, 13, 1649. [Google Scholar] [CrossRef]
  56. Liu, J.; Wu, N.N.; Wang, H.; Sun, J.F.; Peng, B.; Jiang, P.; Bai, E. Nitrogen addition affects chemical compositions of plant tissues, litter and soil organic matter. Ecology 2016, 97, 1796–1806. [Google Scholar] [CrossRef]
  57. Janssens, I.A.; Dieleman, W.; Luyssaert, S.; Subke, J.-A.; Reichstein, M.; Ceulemans, R.; Ciais, P.; Dolman, A.J.; Grace, J.; Matteucci, G.; et al. Reduction of forest soil respiration in response to nitrogen deposition. Nat. Geosci. 2010, 3, 315–322. [Google Scholar] [CrossRef]
  58. Treseder, K.K. Nitrogen additions and microbial biomass: A meta-analysis of ecosystem studies. Ecol. Lett. 2008, 11, 1111–1120. [Google Scholar] [CrossRef]
  59. Hu, X.B.; Ji, F.Y.; Li, S.; Zhou, G.M.; Yu, D.N.; Tan, X.M.; Yang, D.C.; Yu, B. Study of vibrational spectra of humic substance in soils from the Three Gorges Reservoir Area. Spectrosc. Spectr. Anal. 2010, 30, 1376–1380. [Google Scholar]
  60. Meng, D.Y.; Cheng, H.X.; Shao, Y.; Luo, M.; Xu, D.D.; Liu, Z.M.; Ma, L.L. Progress on the effect of nitrogen on transformation of soil organic carbon. Processes 2022, 10, 2425. [Google Scholar] [CrossRef]
  61. Chen, Y.; Liu, X.; Hou, Y.H.; Zhou, S.R.; Zhu, B. Particulate organic carbon is more vulnerable to nitrogen addition than mineral-associated organic carbon in soil of an alpine meadow. Plant Soil 2019, 458, 93–103. [Google Scholar] [CrossRef]
  62. Wang, M.H.; Li, F.C.; Dong, L.L.; Wang, X.; Han, L.B.; Olesen, J.E. Effects of exogenous organic/inorganic nitrogen addition on carbon pool distribution and transformation in grassland soil. Sci. Total Environ. 2023, 858, 159919. [Google Scholar] [CrossRef]
  63. Hong, S.B.; Gan, P.; Chen, A.P. Environmental controls on soil pH in planted forest and its response to nitrogen deposition. Environ. Res. 2019, 172, 159–165. [Google Scholar] [CrossRef] [PubMed]
  64. Broadbent, F.E. Effect of fertilizer nitrogen on the release of soil nitrogen. Soil Sci. Soc. Am. J. 1965, 29, 692–696. [Google Scholar] [CrossRef]
  65. Lu, X.F.; Gilliam, F.S.; Guo, J.Y.; Hou, E.Q.; Kuang, Y.W. Decrease in soil pH has greater effects than increase in above-ground carbon inputs on soil organic carbon in terrestrial ecosystems of China under nitrogen enrichment. J. Appl. Ecol. 2021, 59, 768–778. [Google Scholar] [CrossRef]
  66. Riggs, C.E.; Hobbie, S.E.; Bach, E.M.; Hofmockel, K.S.; Kazanski, C.E. Nitrogen addition changes grassland soil organic matter decomposition. Biogeochemistry 2015, 125, 203–219. [Google Scholar] [CrossRef]
  67. Man, M.L.; Pierson, D.; Chiu, R.; Tabatabaei Anaraki, M.; vandenEnden, L.; Ye, R.X.; Lajtha, K.; Simpson, M.J. Twenty years of litter manipulation reveals that above-ground litter quantity and quality controls soil organic matter molecular composition. Biogeochemistry 2022, 159, 393–411. [Google Scholar] [CrossRef]
  68. Almeida, L.F.J.; Souza, I.F.; Hurtarte, L.C.C.; Teixeira, P.P.C.; Inagaki, T.M.; Silva, I.R.; Mueller, C.W. Forest litter constraints on the pathways controlling soil organic matter formation. Soil Biol. Biochem. 2021, 163, 108447. [Google Scholar] [CrossRef]
Figure 1. Location and layout of experimental plots.
Forests 16 00730 g001
Figure 2. Soil organic carbon concentration under nitrogen addition. Values are the means ± standard errors. Different letters denote significant differences under nitrogen addition (p < 0.05). n = 9.
Forests 16 00730 g002
Figure 3. Concentrations of (a) DOC and MBC, (b) EOC and ROC, and (c) POC and MAOC and distribution ratios of (d) DOC and MBC, (e) EOC and ROC, and (f) POC and MAOC under nitrogen addition. The values are the means ± standard errors. Different letters in the same index denote significant differences under nitrogen addition (p < 0.05). n = 9.
Forests 16 00730 g003
Figure 4. Soil carbon pool lability based on (a) chemical and (b) physical grouping under nitrogen addition. The values are the means ± standard errors. Different letters in the same index denote significant differences under nitrogen addition (p < 0.05). n = 9.
Forests 16 00730 g004
Figure 5. Values of (a) pH and concentrations of (b) ammonium nitrogen and (c) nitrate nitrogen under nitrogen addition. The values are the means ± standard errors. Different letters in the same index denote significant differences under nitrogen addition (p < 0.05). n = 9.
Forests 16 00730 g005
Figure 6. (a) Redundancy analysis (RDA) of the soil chemical properties and soil organic carbon (SOC) fractions under nitrogen addition. Red arrows indicate soil chemical properties, and blue arrows indicate SOC fractions. (b) Pearson’s correlation analysis of soil chemical properties, SOC and its fractions, and L. The significant values of each index are * p < 0.05, ** p < 0.01, and *** p < 0.001. (c) Random forest (RF) for SOC and L. The color blocks represent only the importance values of the factors with significant Pearson correlations (p < 0.05), and the circle sizes represent only the importance values of the significant factors (p < 0.05). (d,e) Partial least squares structural equation modeling (PLS-SEM) and standardized effect values of SOC and L. Red and blue arrows indicate positive and negative paths, respectively, and dotted lines indicate nonsignificant relationships (p > 0.05). The significance values for each path are * p < 0.05, ** p < 0.01, and *** p < 0.001.
Forests 16 00730 g006
Table 1. Sensitivity indices of soil organic carbon and its fractions after N addition (%).
TreatmentsSOCDOCMBCEOCPOCROCMAOC
LN31.91−39.344.25−23.5246.2239.2329.12
MN33.06−22.19−80.17−29.2372.4941.2925.38
HN41.20−19.06−79.09−21.37124.0049.4625.06
Disclaimer/Publisher’s Note: The statements, opinions and data contained in all publications are solely those of the individual author(s) and contributor(s) and not of MDPI and/or the editor(s). MDPI and/or the editor(s) disclaim responsibility for any injury to people or property resulting from any ideas, methods, instructions or products referred to in the content.

