Systematic Review

Evidence on the Social, Economic, and Environmental Impact of Interventions That Facilitate Bamboo Industry Development for Sustainable Livelihoods: A Systematic Map

1
Department of Forest Resources Management, Faculty of Forestry, University of British Columbia, Vancouver, BC V6T 1Z4, Canada
2
Independent Researcher, Bowmanville, ON LIC 4T8, Canada
3
Department of Wood Science, Faculty of Forestry, University of British Columbia, Vancouver, BC V6T 1Z4, Canada
*
Author to whom correspondence should be addressed.
Forests 2025, 16(5), 713; https://doi.org/10.3390/f16050713
Submission received: 13 March 2025 / Revised: 15 April 2025 / Accepted: 18 April 2025 / Published: 22 April 2025
(This article belongs to the Section Forest Economics, Policy, and Social Science)

Abstract

:
Bamboo’s perceived potential in livelihood development has led to development interventions that aim to strengthen the bamboo industry via activities such as training participants in bamboo management, strengthening institutions, and raising awareness. Using the Campaign for Environmental Evidence’s guidelines, we systematically map the available evidence of the impact of these interventions. The evidence is scattered across peer-reviewed and grey literature, with no universal reporting standards. Search sources for this systematic evidence map include a bibliographic database, CABdirect (now known as CABI Digital Library); a search platform for peer-reviewed literature, the Web of Science Core Collection; a bibliographic database for academic literature on agriculture and related fields, SEARCH by the USDA National Agricultural Library; a public search engine for scholarly literature, Google Scholar; a general search engine, Google; and the websites of 37 organizations, with both proprietary search engines and Google used to search for pdf files. Overall, 36 documents are included in the final review, describing 28 unique interventions from 13 countries. Most evidence is found outside the peer-reviewed literature. Outcomes including income changes, increased participation and engagement, and policy changes are reported, with economic impacts dominating the evidence base. Very little evidence of negative outcomes is found, likely constrained by reporting bias. Reporting on evidence of these interventions is limited, with many interventions being excluded from the database due to a lack of identifiable evidence of outcomes or impact.

1. Background

With over 1600 species worldwide [1], bamboos are a sub-family of self-propagating grasses, representing a key non-timber forest product (NTFP) in many tropic and sub-tropic regions [2]. Most large timber bamboo species are fast growing and can sequester and store large amounts of carbon in a short time [3]. For example, a single bamboo shoot of Phyllostachys edulis, common in Asia, can reach maturity and provide harvestable, high-quality bamboo culms in 3–7 years [4]. Bamboo forests can sequester as much or more carbon than other similar land uses in the tropics including agroforests, rubber plantations, oil palm, and some cash-crop farms [5,6]. This potential is linked to the fact that bamboo can be harvested yearly without killing the plant, regenerating many times over its lifespan [7]. There is also a wealth of evidence supporting bamboo species’ ability to thrive in degraded landscapes such as mining sites [8]. It has been used successfully in a variety of land restoration projects [9]. It is often used as part of a landscape mosaic approach [10] to regenerate and protect soil against erosion [11], to break up densely compacted soil to promote regrowth, and to help protect water sources and increase water quality [12]. After appropriate treatment, the physical strength and durability of timber bamboo are comparable to those of wood and thus have the potential to decrease pressure on existing timber resources and reduce deforestation [13].
Among other sources of locally abundant natural fiber, bamboo is of particular interest to many as a tool for livelihood development [14]. Many bamboo species flourish in rural parts of the Global South [15], close to some of the world’s most vulnerable human populations. Bamboo plays an important role in the daily lives and traditional practices of many cultures [16,17], both historically and at present [18]. Bamboo can be made into thousands of different types of goods ranging from lower-cost daily use items, alternatives for plastic [19], and artisanal crafts to strong load-bearing beams in houses [20], and even high-end furniture [21]. Due to these unique properties and versatility, some stakeholders have identified bamboo as a crop with high potential for climate-smart, ecologically sustainable income generation in tropical areas [22]. It has also been identified as a relatively undeveloped global industrial resource, with significant market potential [23] and potential for integration into future industrial paradigms [24].
In international development, the commercialization of locally available NTFP is often promoted as an ecologically and economically sound poverty alleviation strategy [25]. However, this approach is not without criticism in the literature [26]. Critics have pointed out that many unseen barriers to the commercialization of a crop or product may exist that may impede the process [27], and that scaling up production often leads to uneven economic opportunities or unsustainable harvesting of the resource, causing an eventual decline in the resource base and widening social inequality [28].
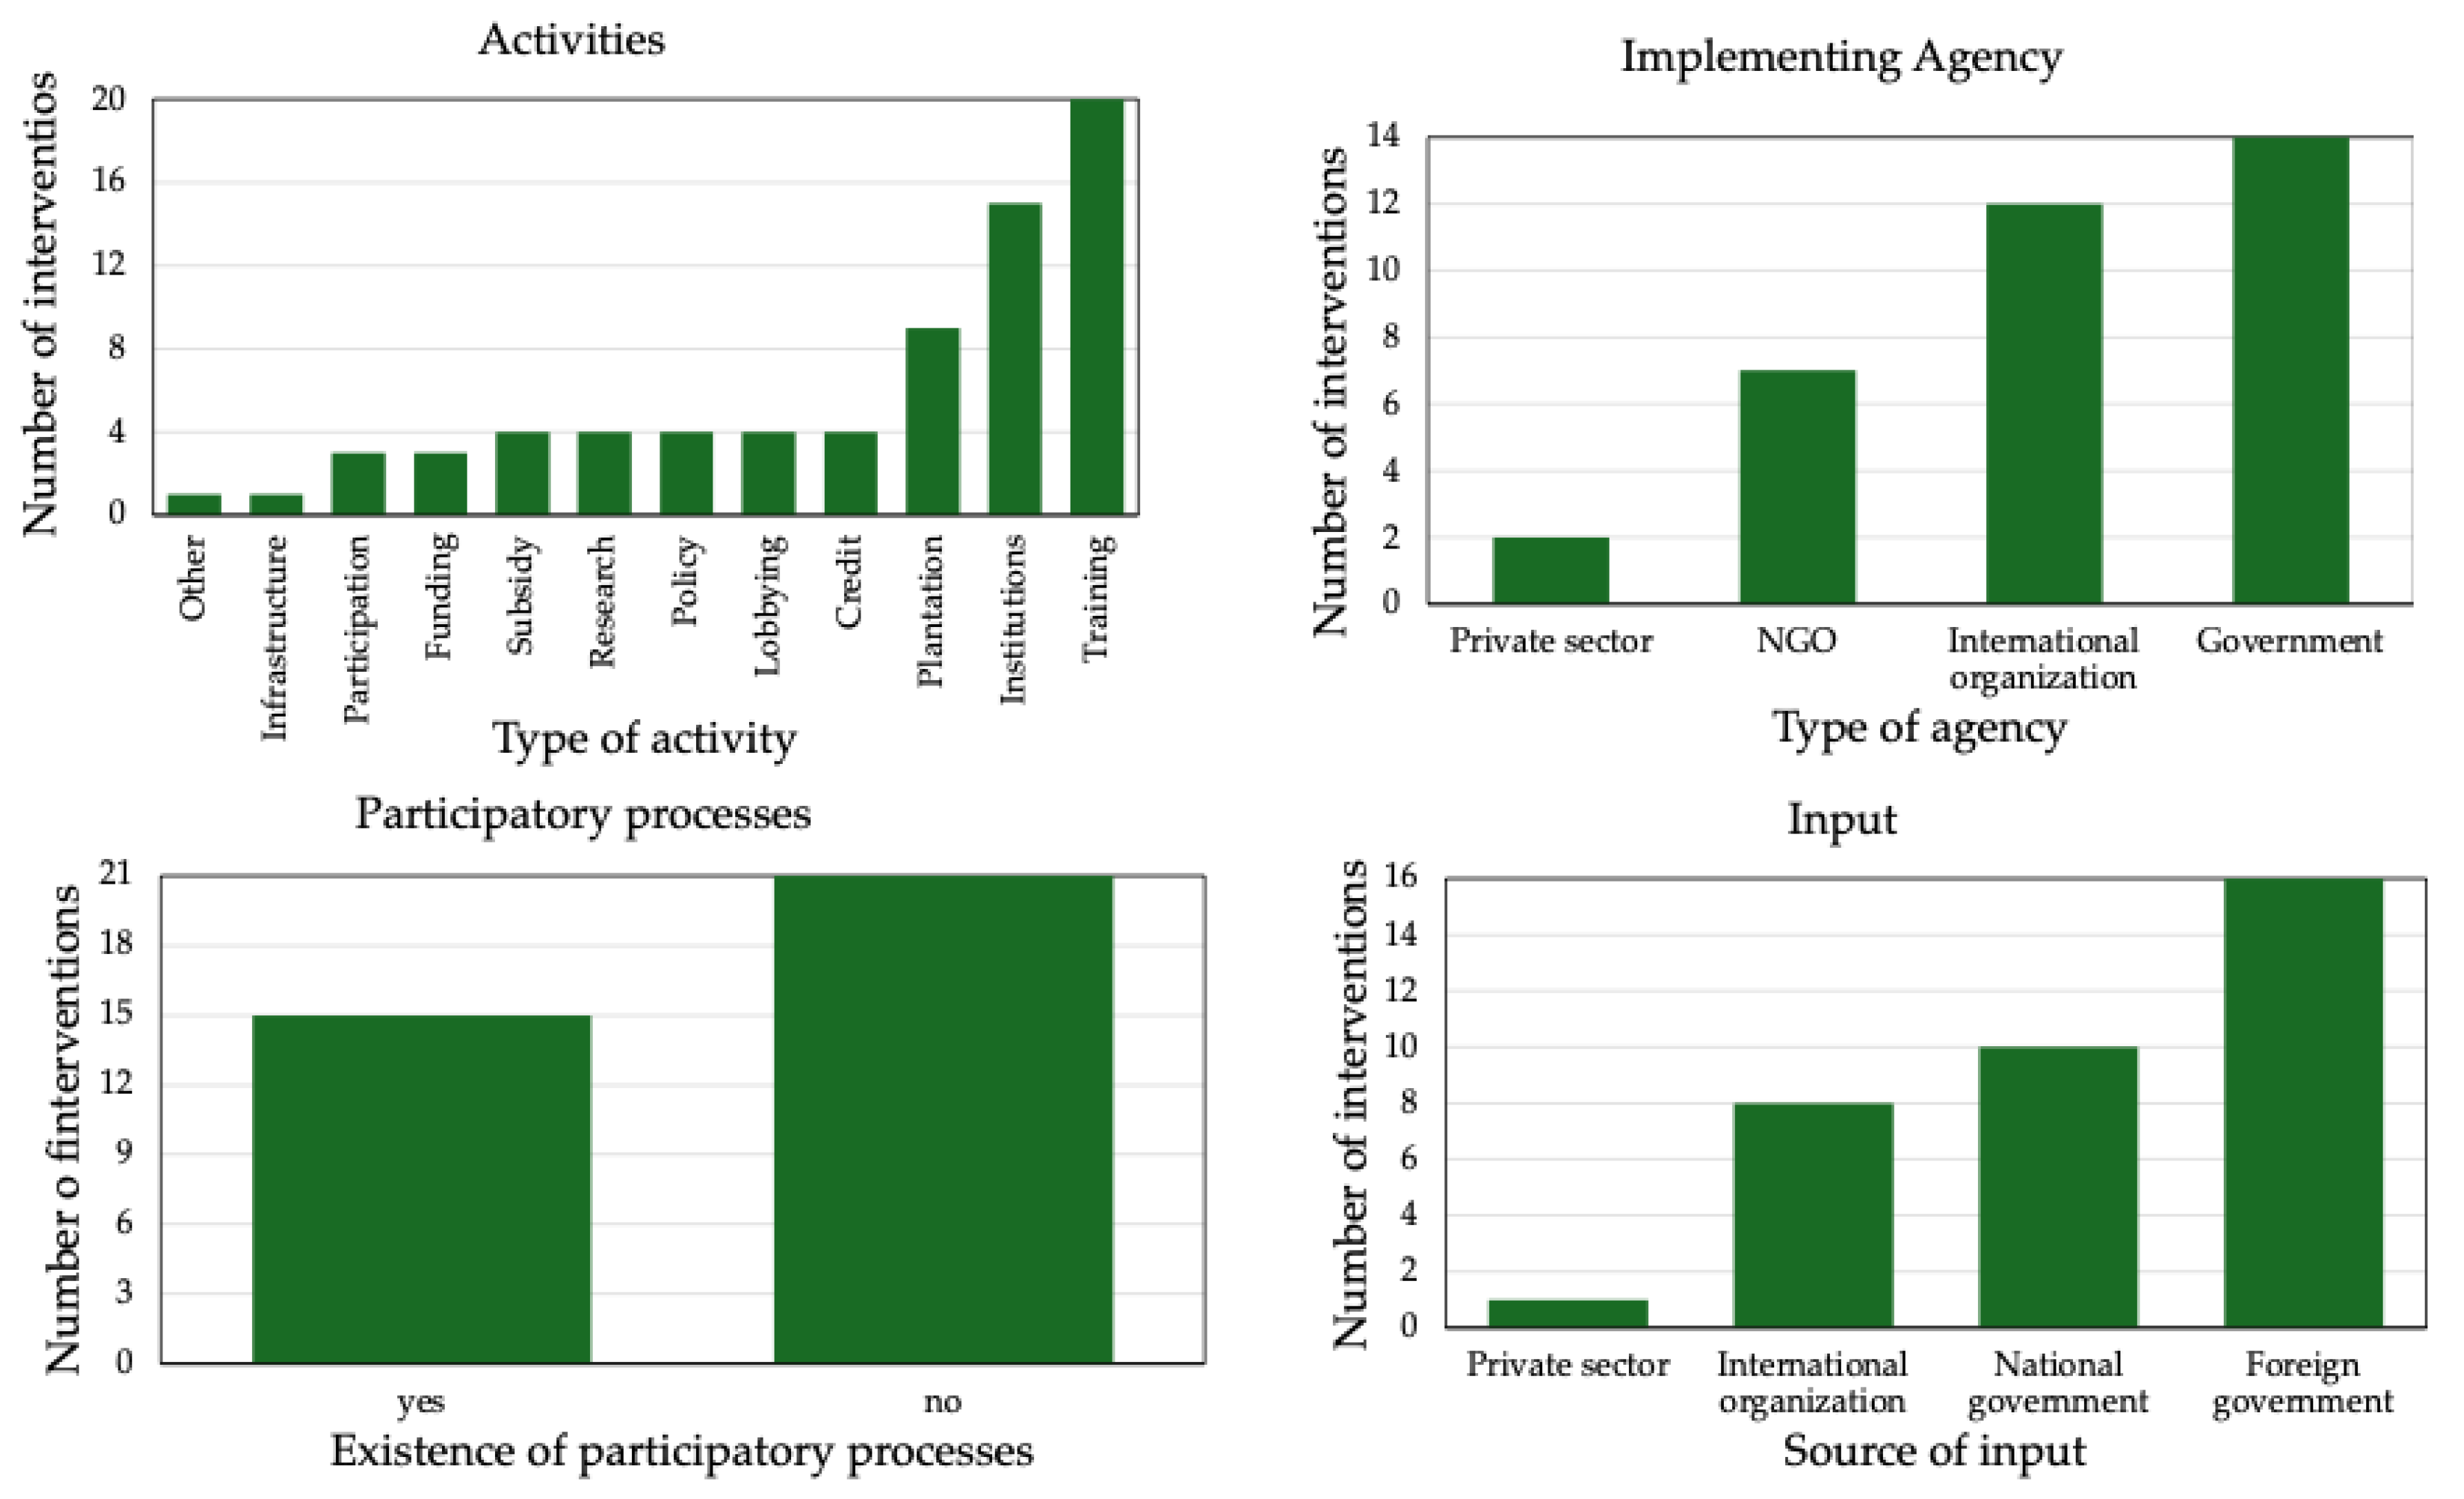
In this context, numerous projects across various countries have been implemented by international development institutions, non-governmental organizations (NGOs), and governments, that aim to facilitate the development of a sustainable and thriving bamboo industry. These projects usually combine social and economic objectives such as a desire for increased incomes, the diversification of income sources, or the addition of a stable source of supplementary income for local people, alongside a realm of environmental objectives like carbon sequestration [29], land restoration [30], and watershed management [
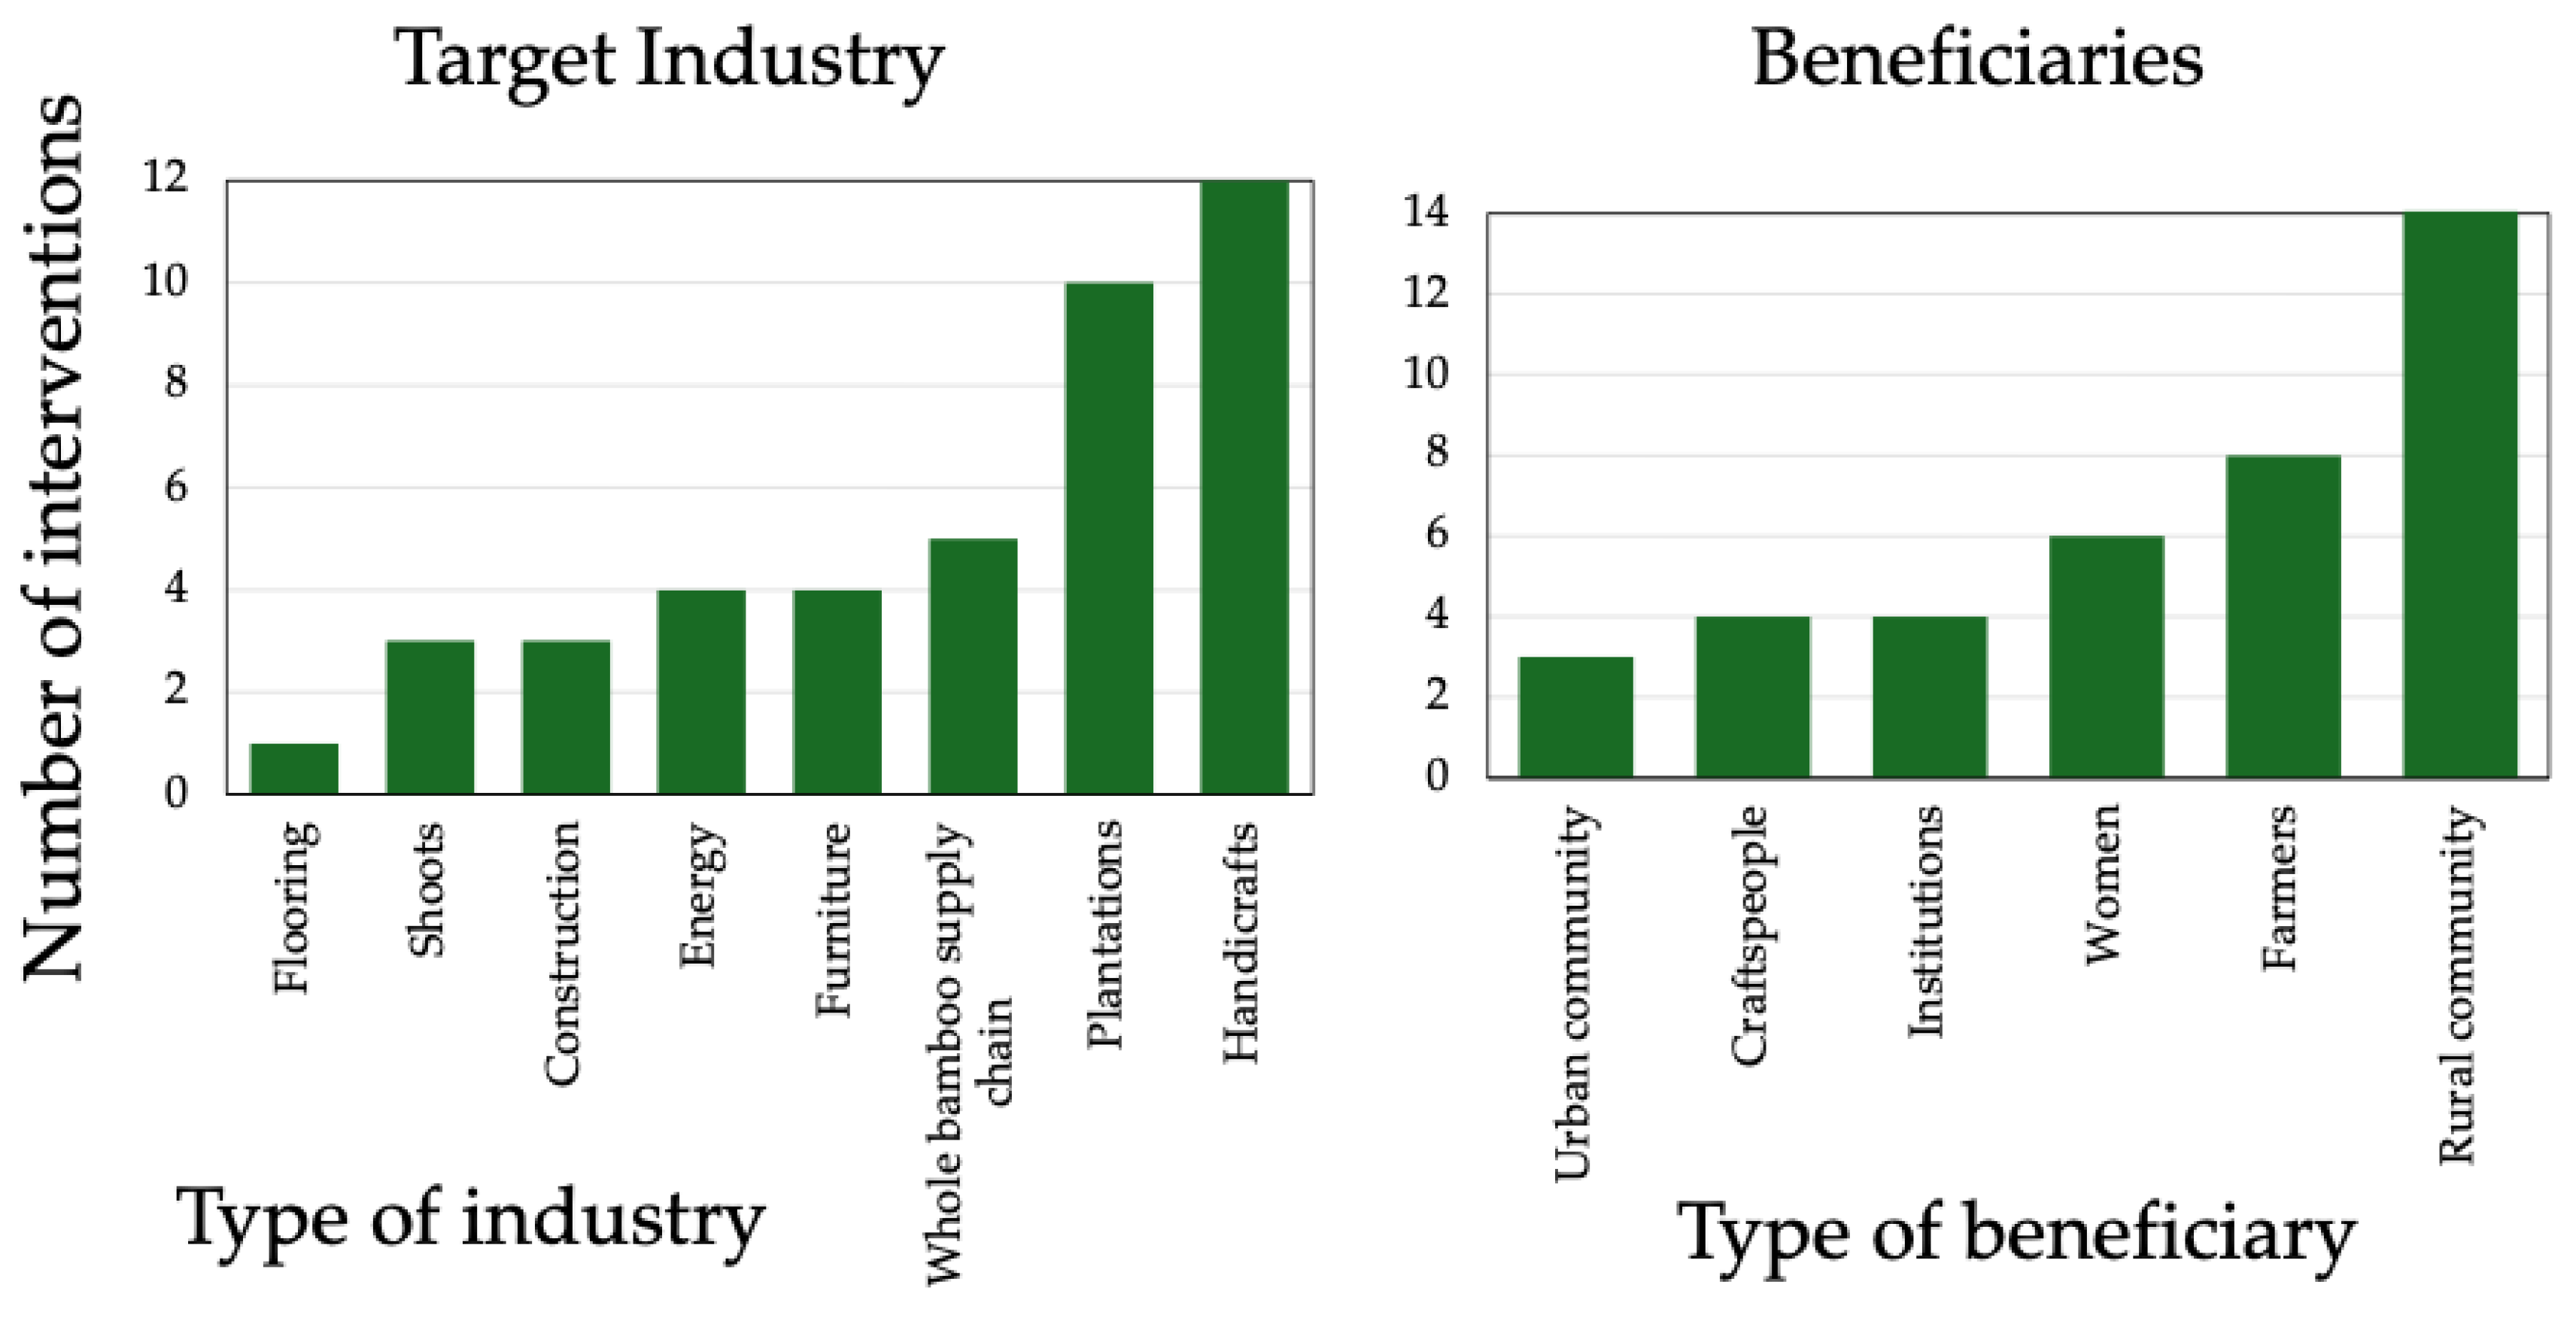
31]. They generally include a wide range of objectives and activities, typically funded through partnerships between government and non-government entities and implemented by international development organizations, local community organizations, or governments. Examples of activities carried out in this type of project include training participants in bamboo harvesting, management, or processing; policy or regulatory changes to incentivize bamboo industrial development; attempts to develop the natural resource base for future use, which could look like planting bamboo to meet joint environmental and social objectives; and funding for groups or entrepreneurial clusters to invest in equipment or marketing for their growing businesses. Other projects may promote the bamboo industry indirectly through market research. Bamboo fiber has many target applications. The target industry for this type of intervention could therefore include construction, decoration, flooring, furniture, handicrafts, food, or cosmetics. Specific target outcomes and impacts include socio-economic aspects, like income changes, wellbeing, or gender equality, but could also include any other type of outcome. Since bamboo fiber is considered an environmentally friendly and low-carbon material, environmental objectives are often implicit in the project design, with sustainable management of NTFPs such as bamboo often assumed to contribute automatically to many ecosystem services [32]. Target projects will be referred to henceforth as “interventions”, in keeping with our research question framing.
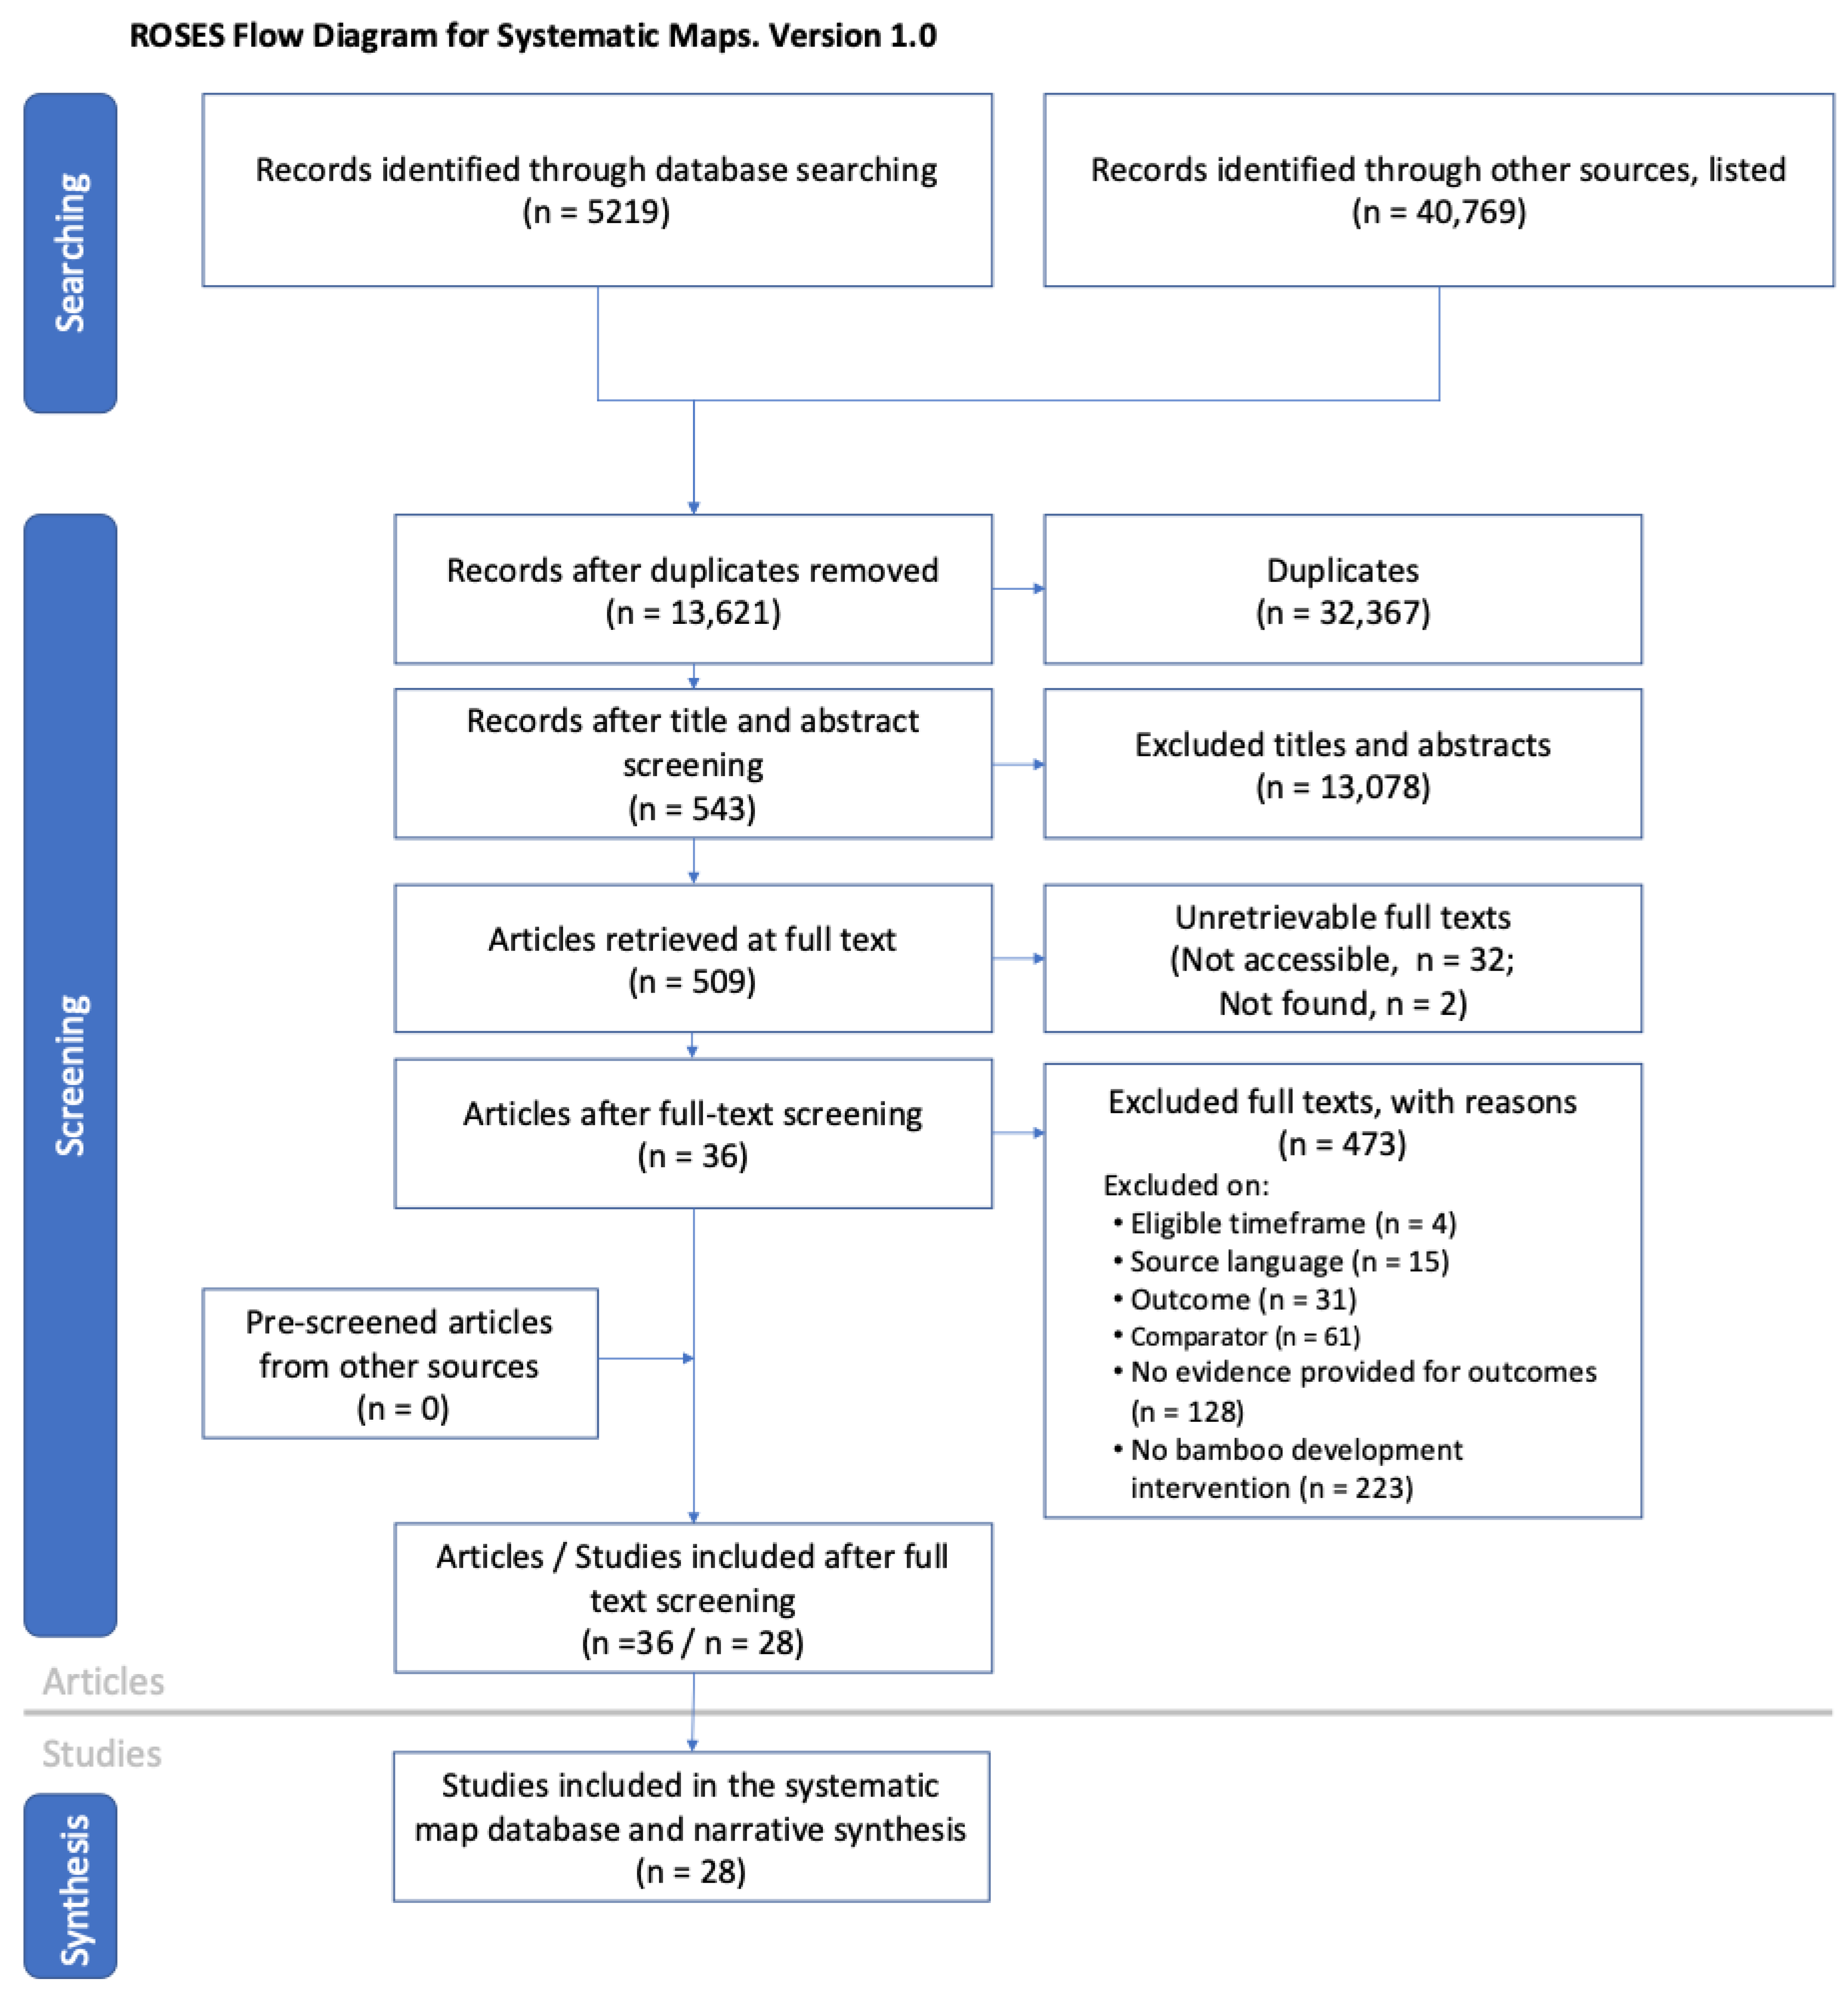
A systematic evidence map collects and categorizes evidence on a particular topic, summarizing trends and highlighting areas of data-scarce and data-rich evidence availability [33]. It is a useful method for evidence synthesis in cases such as this in which evidence is scattered and unevenly distributed and the research topic is broad. It can bring together the reported outcomes and impacts of these collective projects and programs, identify major gaps in the public understanding of this approach, and allow for a holistic look at evidence in the field.
This systematic evidence map follows the Campaign for Environmental Evidence (CEE) guidelines for systematic evidence maps [34]. As part of these guidelines, this review follows a previously published protocol, with deviations as detailed in Section 2.1 [35]. A protocol is a document that outlines the rationale, search strategy, and planned reporting methods for a meta-analysis. The purpose of publishing a protocol in advance of a final report is to ensure replicability and transparency, and to solicit feedback on the review methodology from an audience of peers.
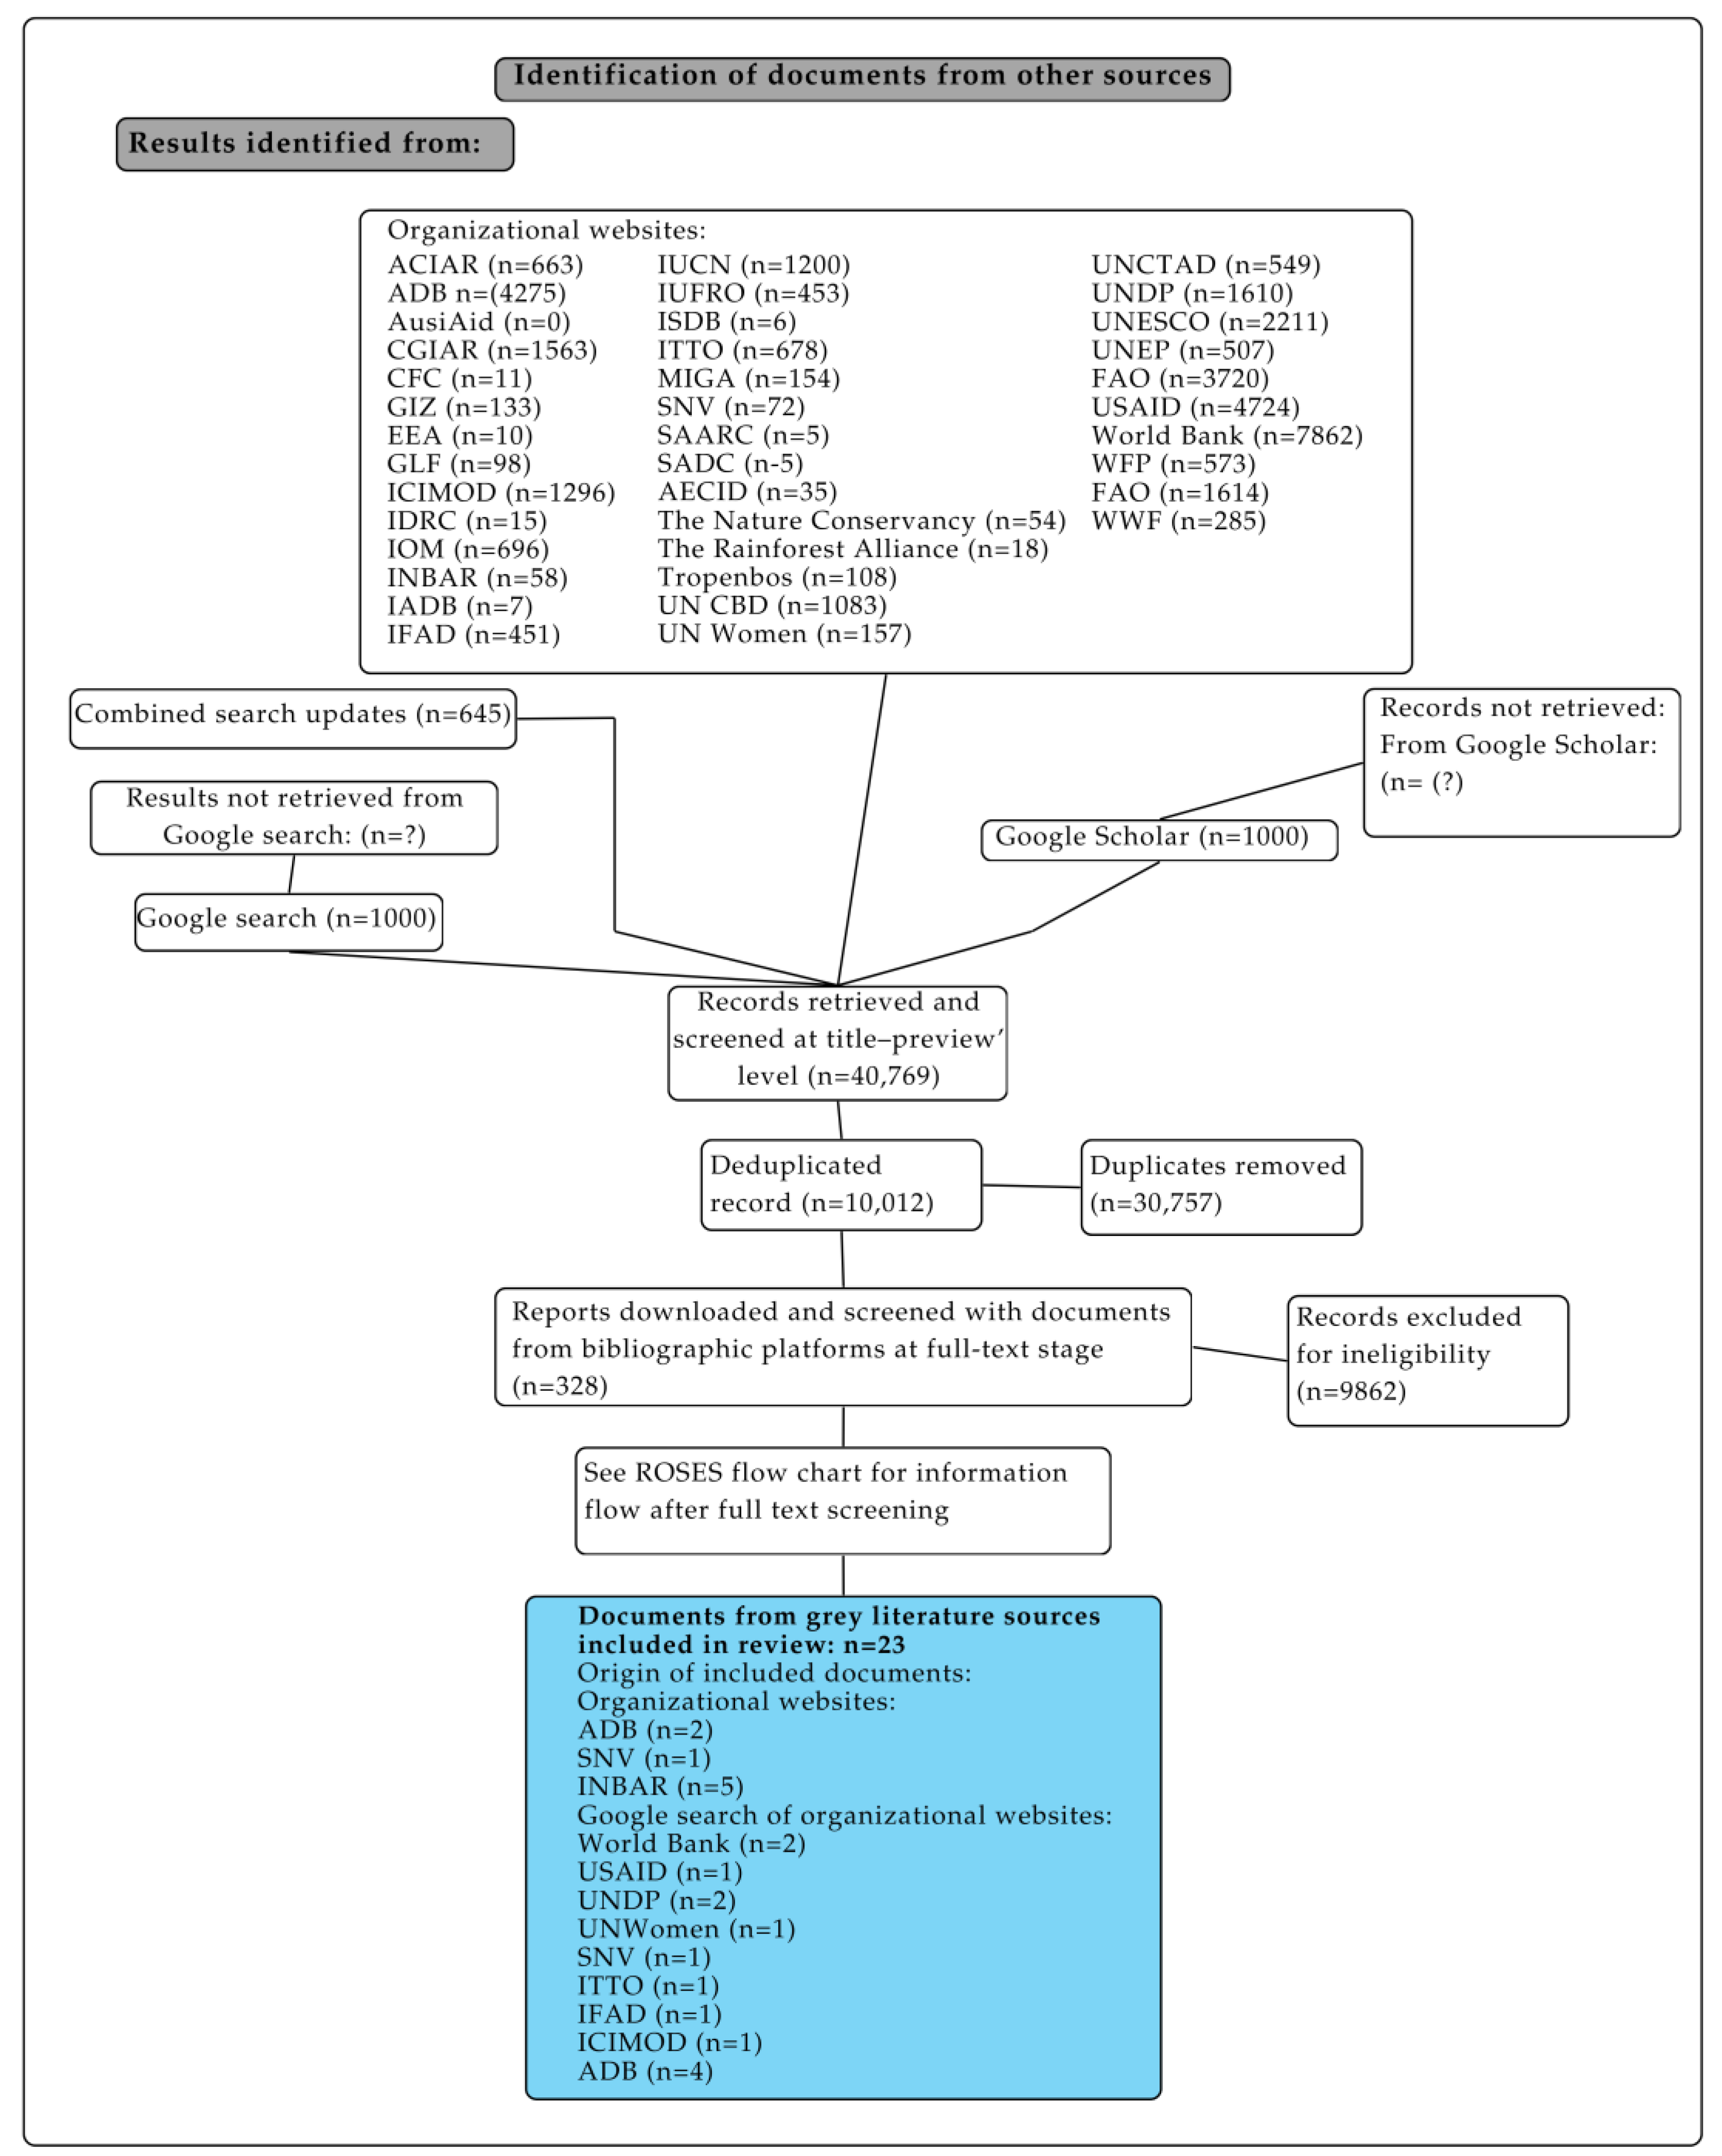
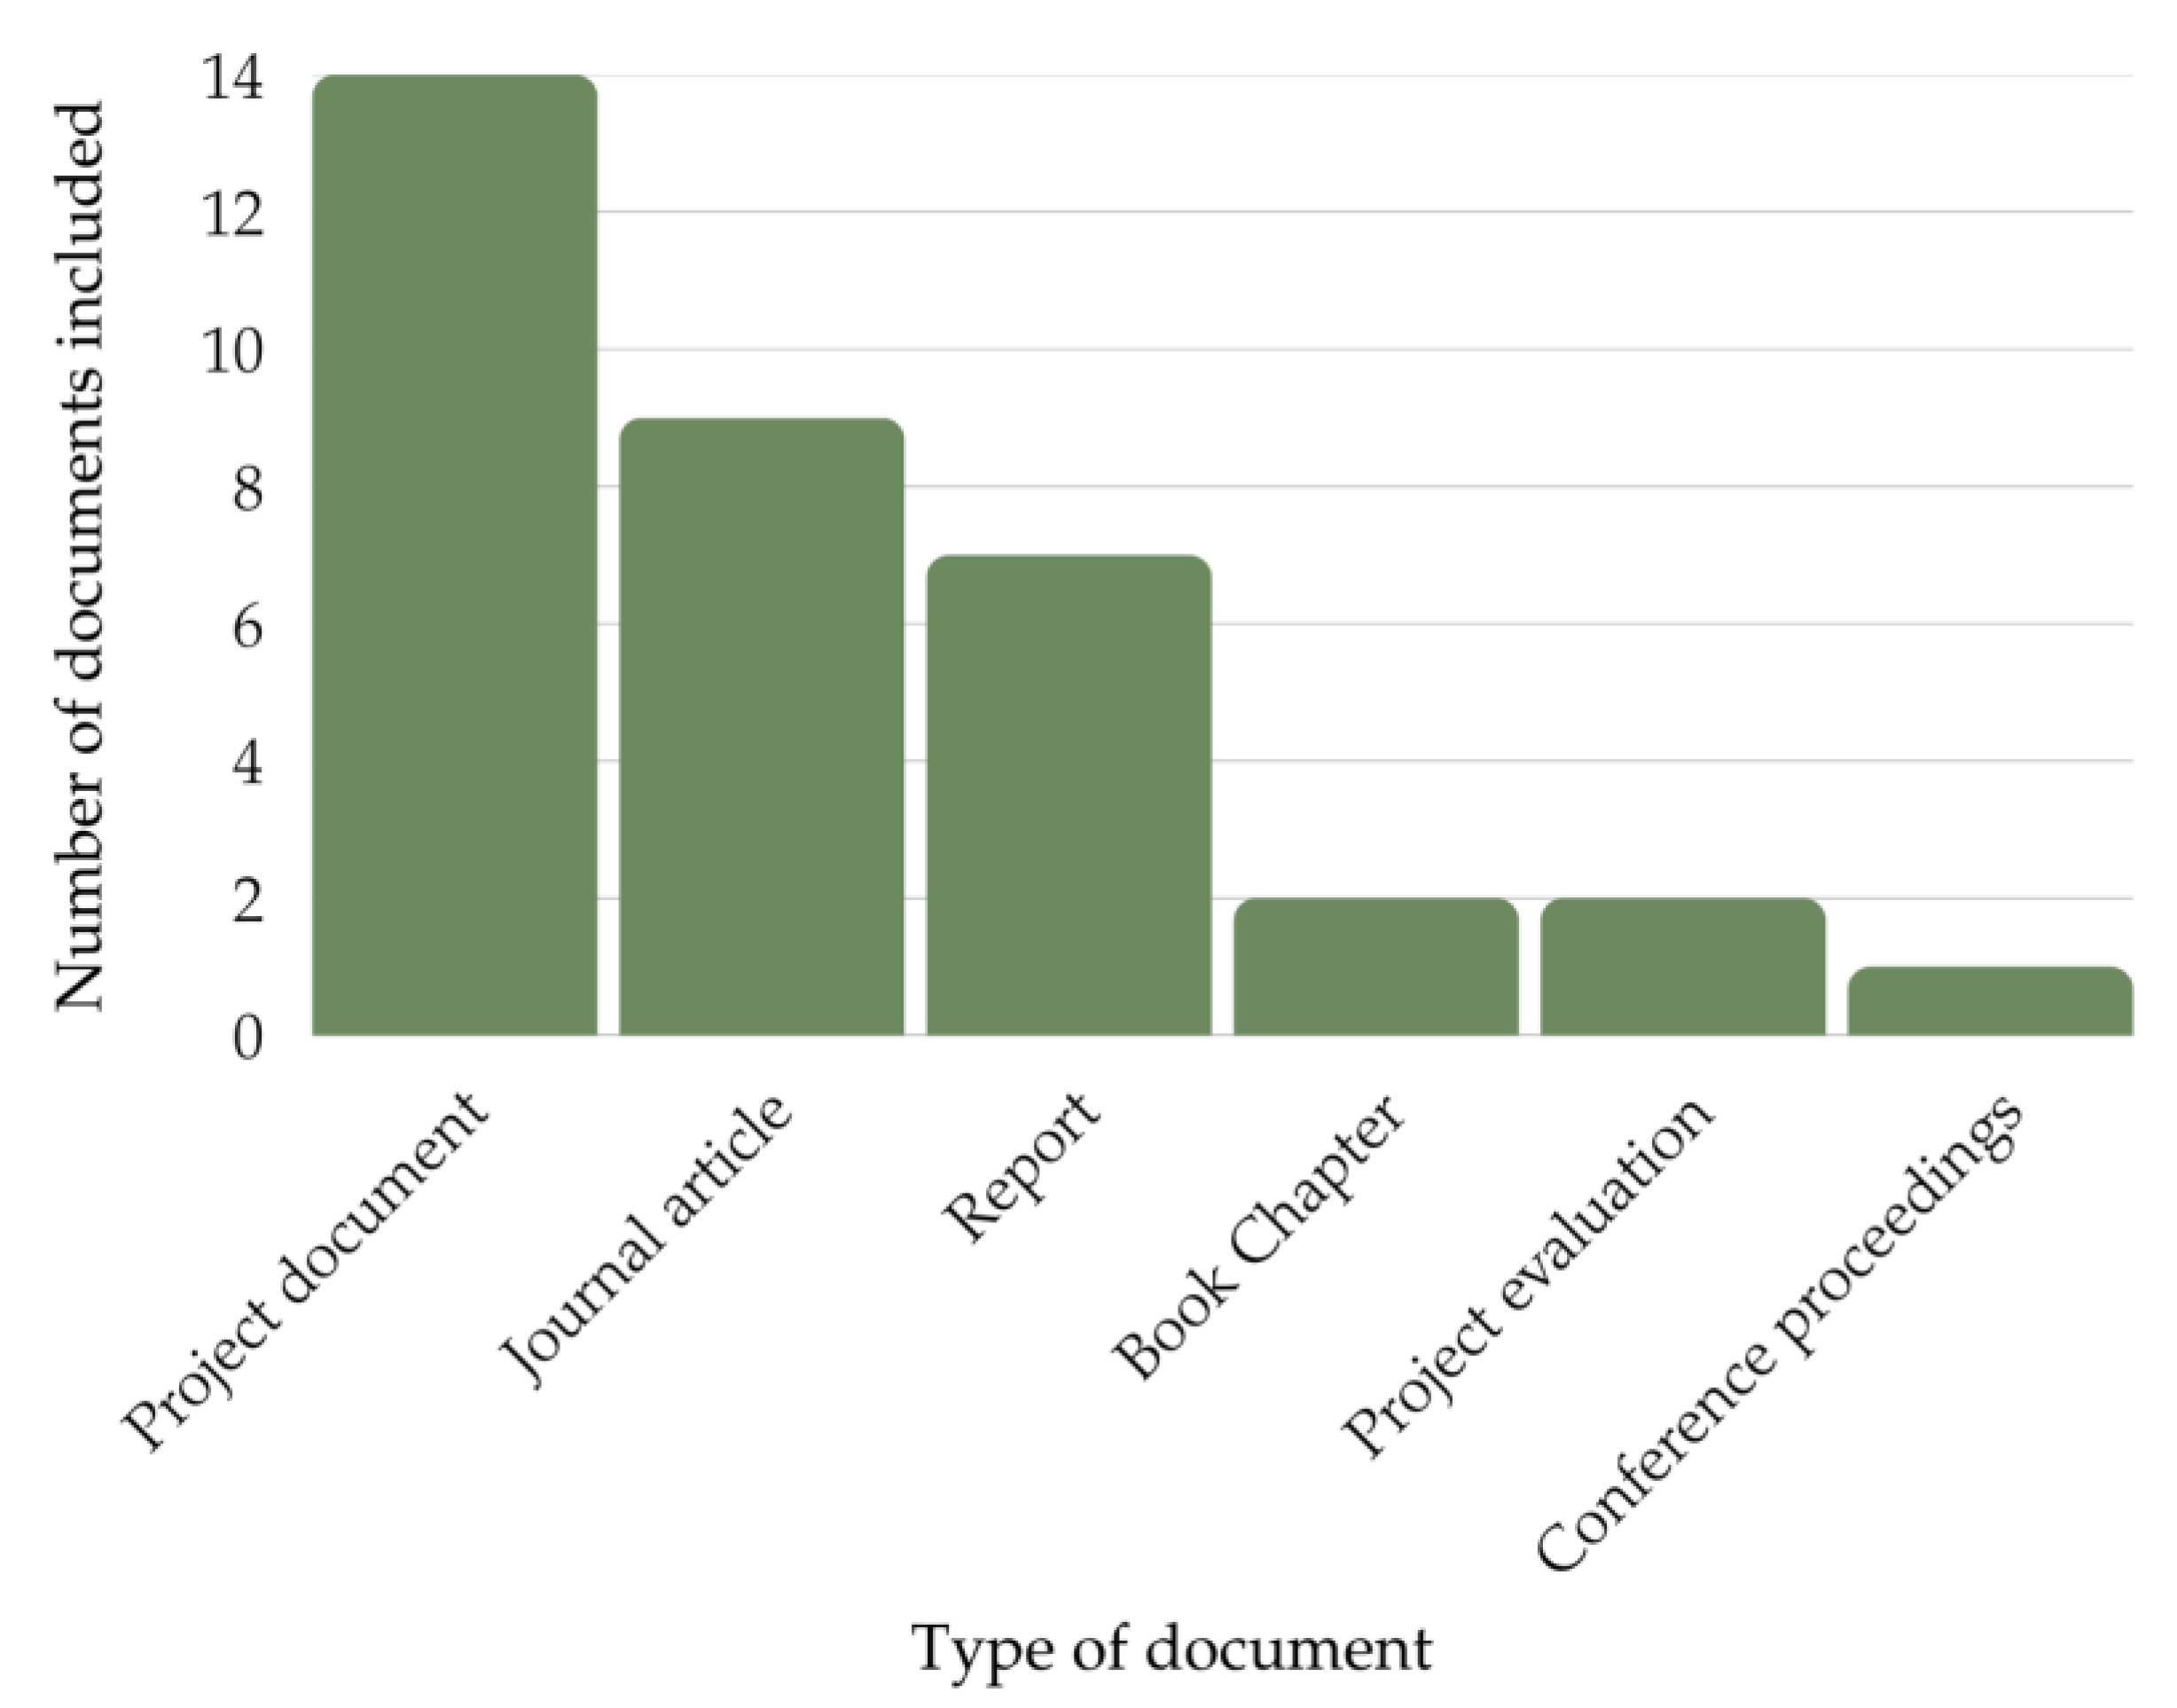
As far as we are aware, no attempt has yet been made to systematize evidence in this field. Although these interventions are sometimes discussed in the peer-reviewed literature, much of the information on the interventions in question is found in organizational and grey literature, including in project reports, program evaluations, and summaries. These reports are often published by the organization that has implemented the intervention and may have a significant risk of bias and incentive to obscure negative outcomes [36]. There is no universal evaluation or reporting methodology for international development projects, although many follow international development norms and participate in external evaluations and auditing practices. Specific standards include those of the Organization for Economic Co-operation and Development’s (OECD) Development Assistance Committee [37] and the International Aid Transparency Initiative (IATI) [38].
This systematic evidence map looks at evidence on the social, environmental, and economic impacts and outcomes of development interventions that have promoted bamboo for sustainable livelihoods since 1990. This project uses definitions of “outcomes” and “impacts” as defined by the Center for International Forestry Research (CIFOR) [39]. CIFOR defines “outcomes” and “impacts” as qualitatively different types of change, making their categorization in a systematic map database less ambiguous.
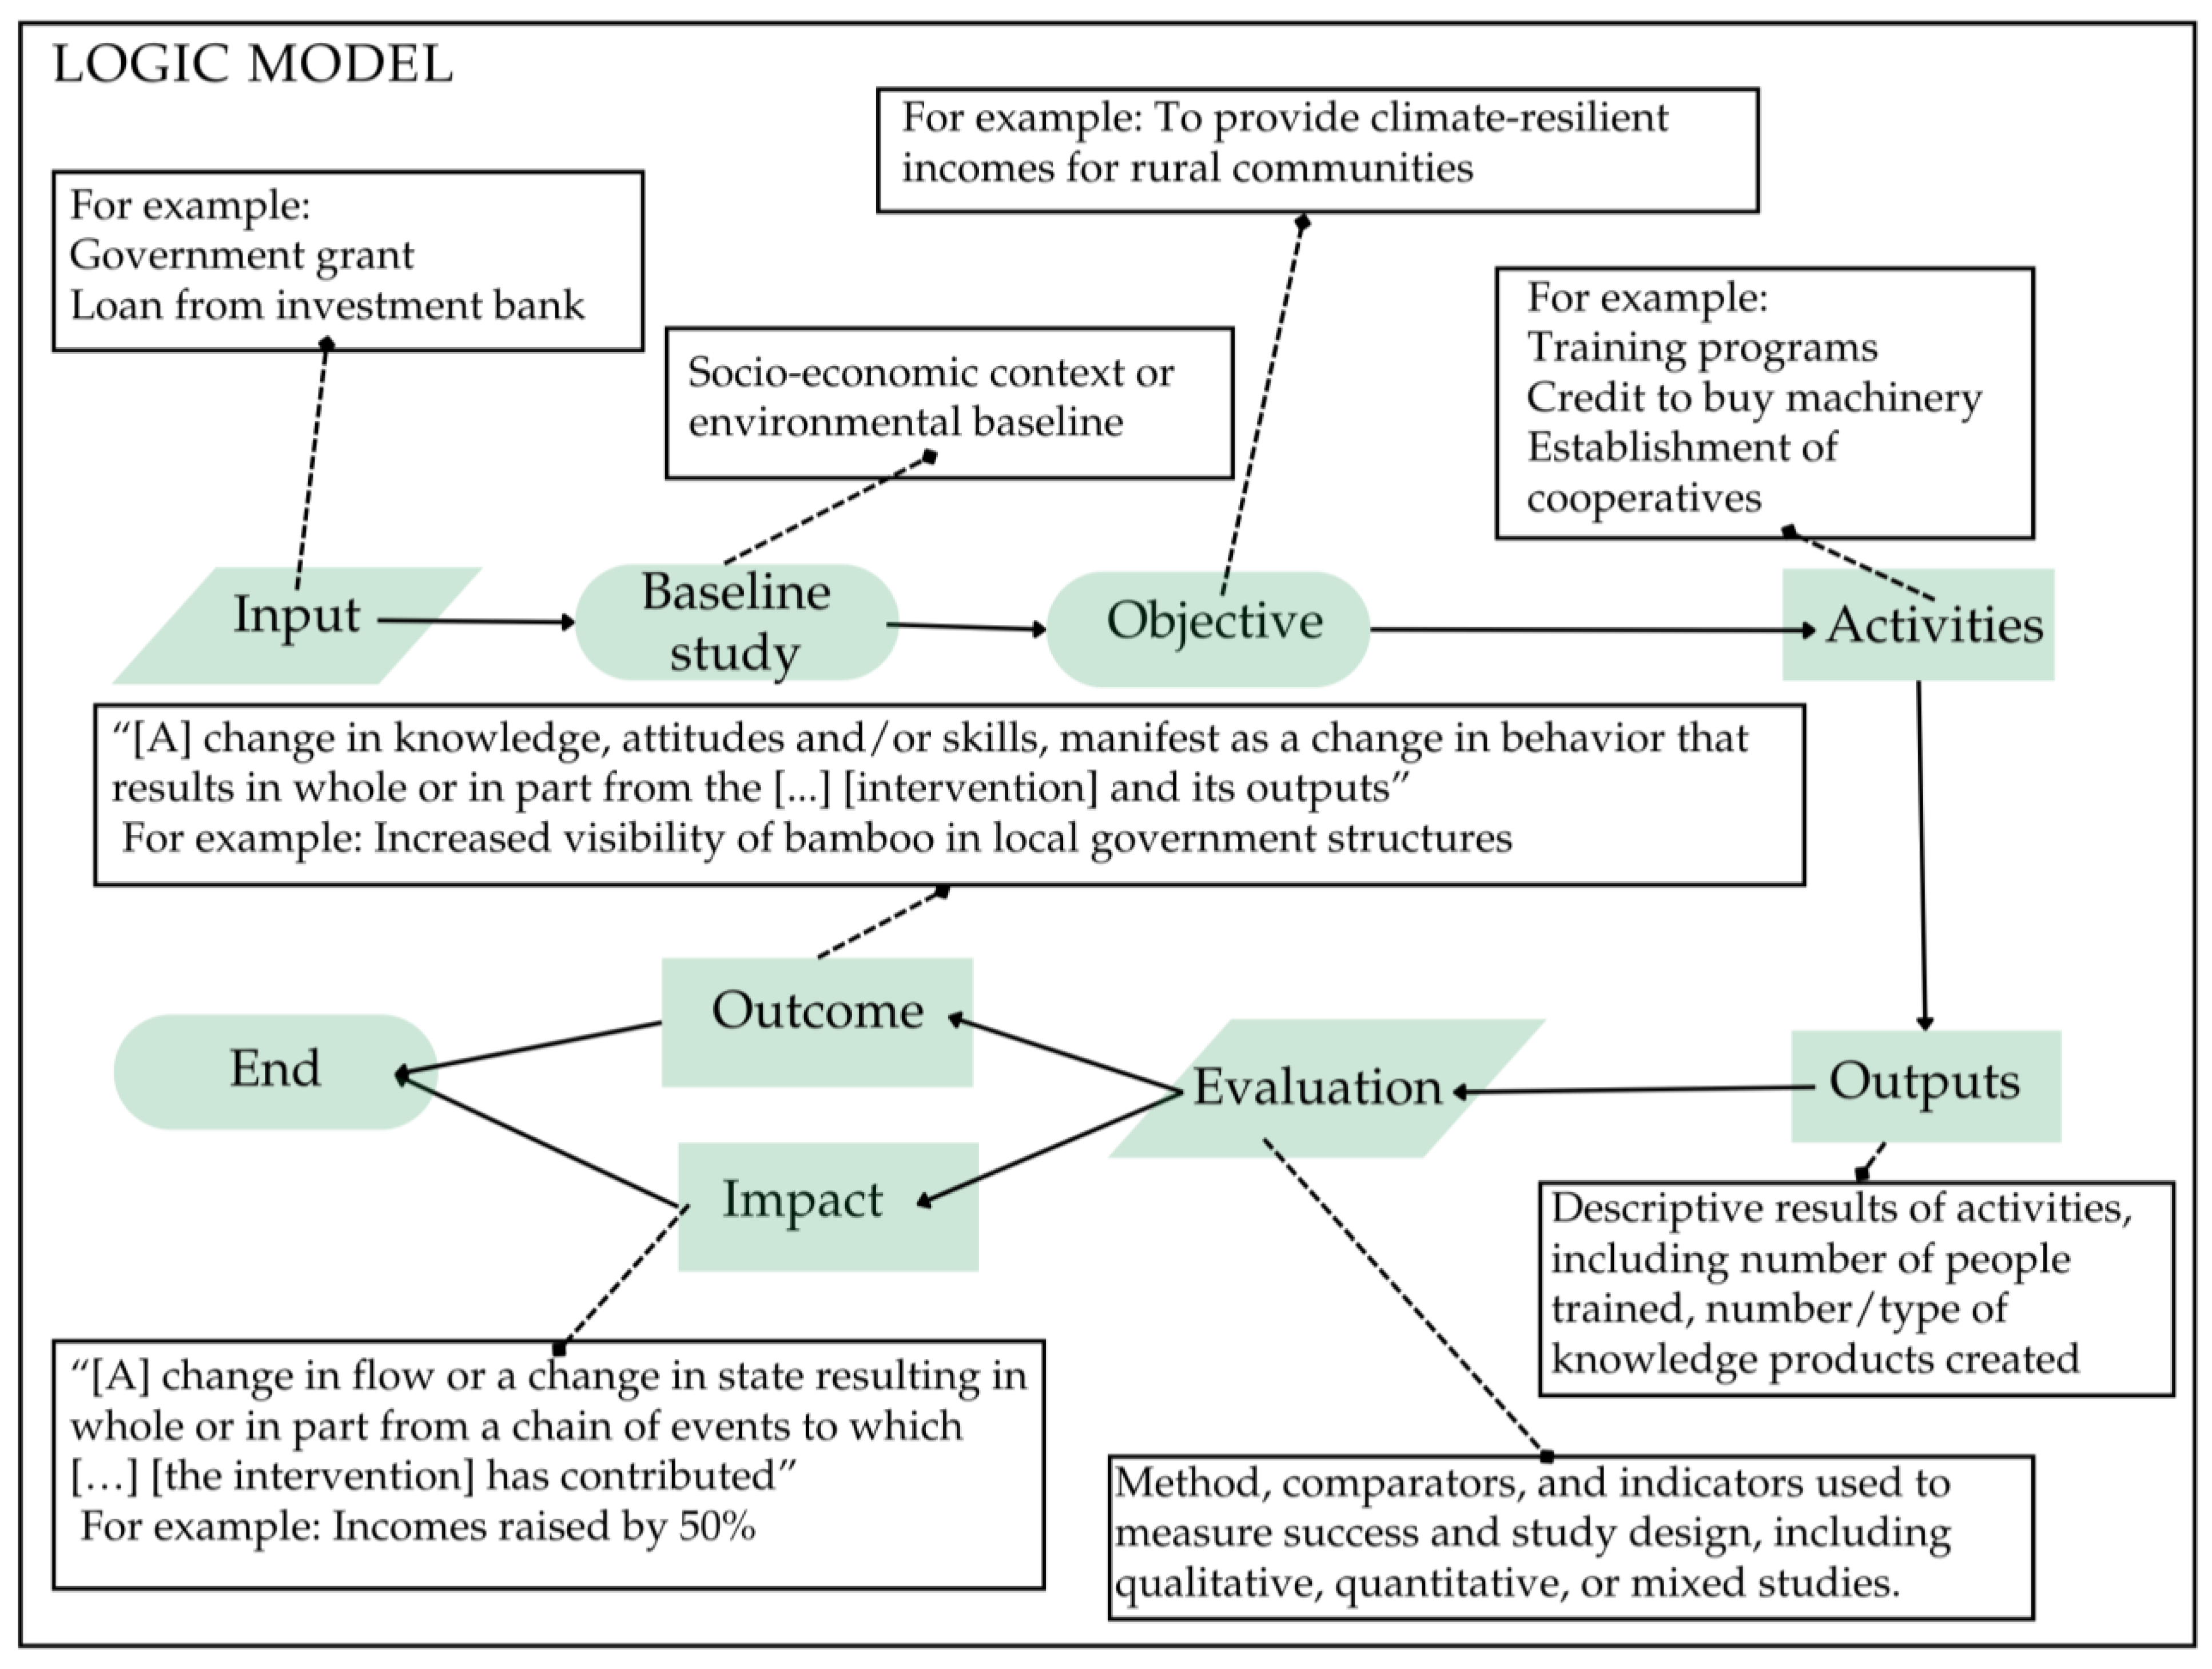
“Outcomes” are defined as “change[s] in knowledge, attitudes and/or skills, manifest as a change in behavior that results in whole or in part from the… [intervention]… and its outputs” [40]. “Impacts” are here defined as “change[s] in flow or a change in state resulting in whole or in part from a chain of events to which… [the intervention] … has contributed”. Within this framework, impacts often consist of population-level statistics that describe these changes in flow or in state. For example, % change in average income from a baseline would be classed as an impact, whereas individual changes in job title due to skills learnt during training would be classed as outcomes.
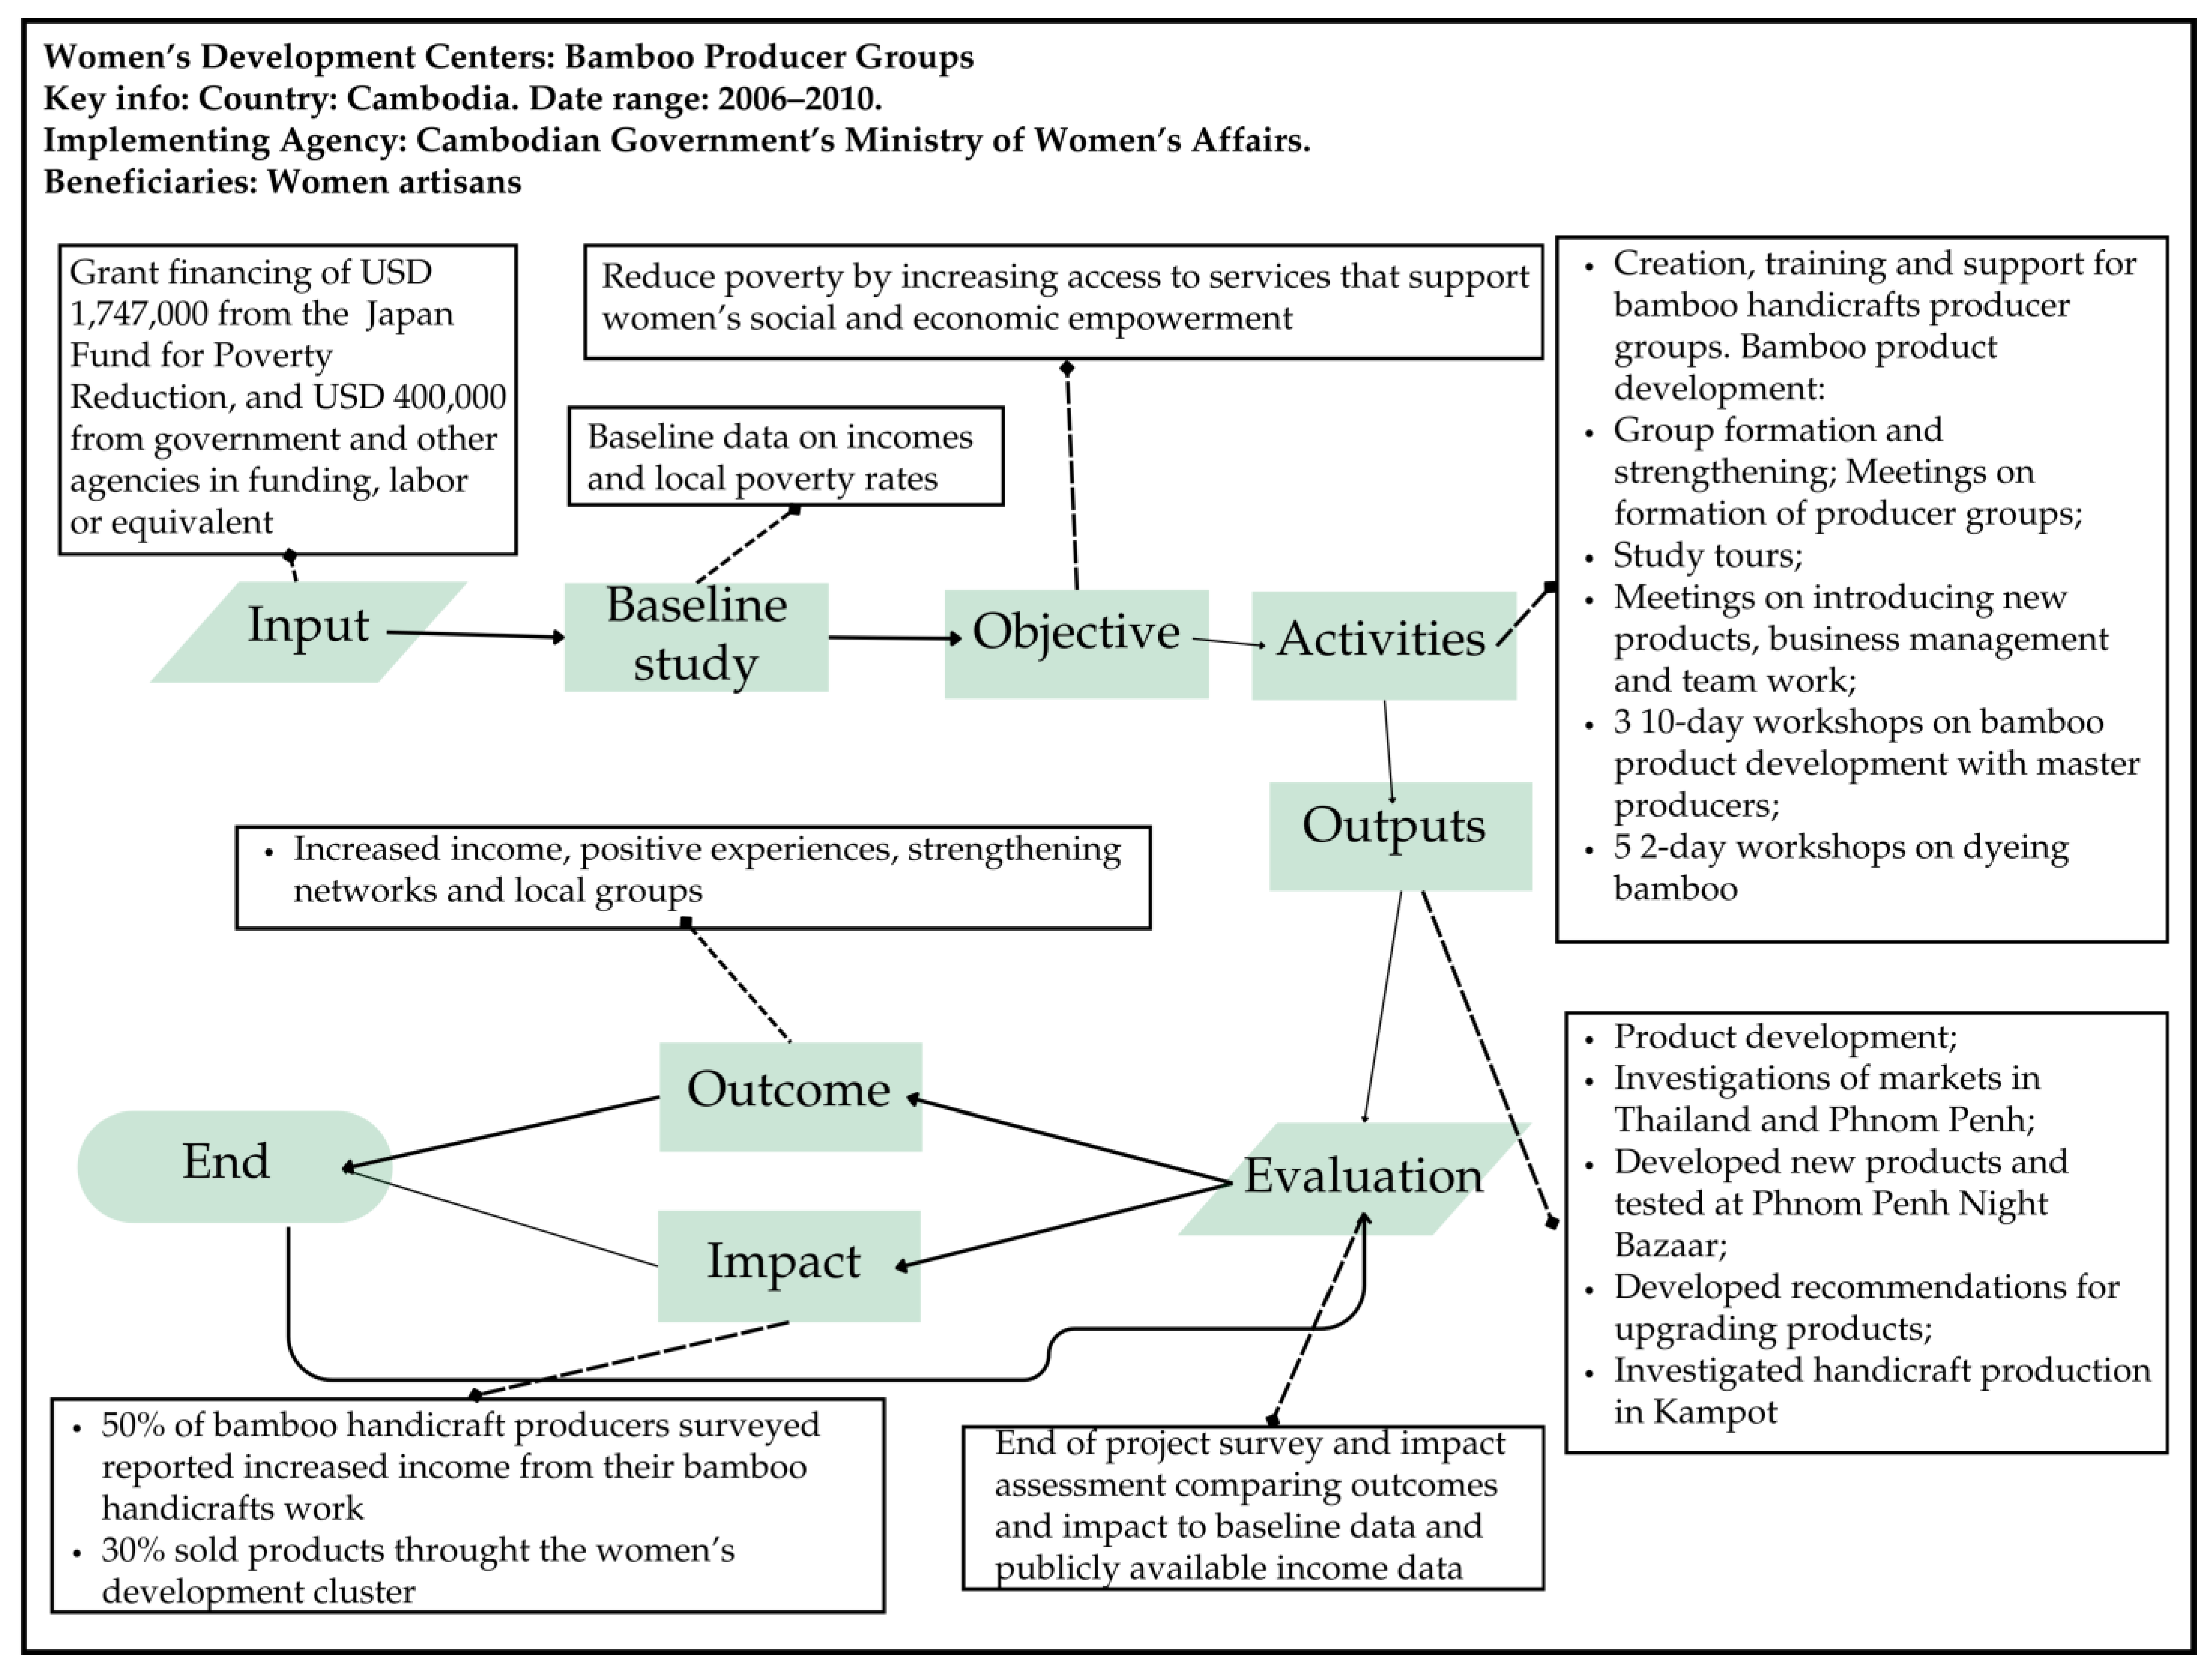
As required by the CEE guidelines for systematic evidence map reports [34], a generalized logic model [41] for the type of intervention considered in this review is shown in Figure 1. Examples for each category are shown to demonstrate how components of this type of project are conceptually linked, and the type of information we are interested in collecting during this systematic evidence-mapping exercise. This logic model presents a simplified casual connection between project funding, activities, outputs, and outcomes and is presented with the understanding that causality between different aspects of real-world projects may not be as simple. To attempt to confirm casual links between desired outcomes and project activities, project managers and evaluation professionals employ a wide range of different methodologies.

1.1. Stakeholder Engagement

Three expert stakeholders from the World Bamboo Organization, the Forest Stewardship Council, and the International Bamboo and Rattan Organization, and two academics from the University of British Columbia (UBC), were consulted by email to suggest interventions or search sources that were not covered by the protocol. Soliciting supplementary sources from experts did not yield any more search sources, but experts did suggest organizational websites to add to the search for grey literature. Seven search sources were suggested during the stakeholder engagement process.

1.2. Objective of the Review

The primary review question is as follows: What is the evidence on the social, environmental, and economic impact of interventions that facilitate bamboo industry development for sustainable livelihoods? This question was formulated using the Population, Intervention, Comparator, Outcome (PICO) framework for research questions [42]. PICO components are shown in Table 1.
Secondary review questions include the following:
  • What negative outcomes have been reported?
  • What are the gaps or poorly understood aspects in this literature?

2. Methods

This review followed a previously published protocol with deviations as detailed below [35]. Reporting Standards for Evidence Synthesis (ROSES) forms [43] and reporting guidelines [34] were followed, and a ROSES form for systematic maps is available in the Supplementary Material as Supplementary File S1.

2.1. Deviations from the Protocol

2.1.1. Objective and Research Question

The Population, Intervention, Outcome framework described in the protocol was changed to the PICO framework to incorporate the need for a comparator in the documents included in the map. The research question was not changed, but two secondary review questions (“What are the critical success factors for these projects and how is this success measured?” and “What are the theories of change for these projects?”) were removed, since these questions were judged to be out of scope for the present mapping exercise and more suitable for future research and analysis. One secondary research question “What are strategies that have not been successful and why?” was changed to “What negative outcomes were reported?” since the term “successful” was again judged out of scope for this evidence-mapping exercise.

2.1.2. Stakeholder Engagement

During the stakeholder engagement process, fewer stakeholders were consulted than planned due to time and resource availability.

2.1.3. Searches

References to the Web of Science database, a key search source, were changed to the Web of Science Core Collection, as subscribed to by the UBC Library.
The list of organizational websites for the grey literature search was expanded from 20 to 37 organizations.
Changes to online databases and search algorithms during the time between the protocol being published and the review being carried out necessitated changes to the searching process. In the protocol, the United States Department of Agriculture National Agricultural Library research database PubAg was specified as one of the bibliographic databases to be searched. Instead of using PubAg, the newer, more comprehensive bibliographic database, SEARCH from the United States Department of Agriculture (USDA) National Agricultural Library, was used. This decision allowed more records to be retrieved and the search to be more comprehensive.
In our original protocol, we planned to search the first 10 pages of Google search results, following guidelines for the use of Google in systematic reviews [44]. However, at the time of the original searches and search updates, Google search only displayed around 400 results in practice, and so this number was used as a cutoff point instead. In the March 2025 update, Google’s algorithms allowed more results to be shown, so we reverted to our original strategy of using the first 10 pages of search results.
Due to the limitations of SEARCH from the USDA National Agricultural Library, the search string had to be shortened slightly. In addition, to improve the precision and comprehensiveness of the search, slightly different search strings were used to search organizational websites using Google than were described in the protocol. Instead of only searching the word “bamboo” and specifying file type and website using Google’s advanced search functions, we added a selection of outcome, comparator, and intervention keywords in parentheses and separated by a pipe symbol “|” to search for the word “bamboo” and at least one of the other terms. Google searches are limited to 32 words in length, so we were unable to use all our identified intervention, comparator, and outcome terms in the Google searches.

2.1.4. Screening

The eligibility criteria were adjusted significantly to better reflect the objective of the review. Instead of including all documents that described interventions with social objectives, only documents that contained evidence of outcomes or impact, and for which a discernable study design and comparator could be identified, were included.

2.1.5. Coding

Codes and categories of metadata collected were expanded to more closely fit the objectives of the study during the review process. One column, “critical success factor”, was deleted, since inclusion of these data was judged out of scope for this evidence-mapping exercise. Columns originally marked “subcategories” were given more appropriate names according to the content of the column. Information about the study design and comparator was added.

2.2. Search for Articles

2.2.1. Search Terms and Strings

Specific search terms and strings as used in the final review can be found listed in Table 2 and in the Supplementary Material as Supplementary File S2.
The search dates of the original searches and search updates ranged from November 2022 to March 2025 (Supplementary File S2). Google searches of organizational websites were combined into longer search strings in the search updates using the pipe symbol “|” to differentiate between different sites.

2.2.2. Search Limitations

Date ranges were set to after 1990 where possible, since this review only considers interventions that ended after 1990. Searches using the Google search engine were limited to pdf files using the term “filetype:pdf”. No limitations were applied when searching for articles in organizational websites.

2.2.3. Search Sources

Search sources for this review include a bibliographic database, CABdirect; a search platform for peer-reviewed literature from the Centre for Agriculture and Bioscience International (CABI), a United-Kingdom-based research organization; the Web of Science Core Collection; a bibliographic database for academic literature on agriculture and related fields, SEARCH by the USDA National Agricultural Library; a public search engine for academic literature, Google Scholar; a general search engine, Google; and the websites of 37 organizations, with both proprietary search engines on the homepage and Google being used to search for pdfs. Organizational websites were found by searching in the Yearbook of International Organizations [33] using keywords such as “bamboo”, “nature”, and “forestry” and by finding references to organizations in other records during the search process [23]. An additional Google search using general keywords including “bamboo livelihood project” and “bamboo social outcomes intervention” identified several more organizations.
The UBC Library subscribes to the following indexes within the Web of Science Core Collection:
  • Science Citation Index Expanded (1900–present);
  • Social Sciences Citation Index (1956–present);
  • Arts and Humanities Citation Index (1975–present);
  • Conference Proceedings Citation Index—Science (1990–present);
  • Conference Proceedings Citation Index—Social Sciences & Humanities (1990–present);
  • Emerging Sources Citation Index (2015–present).
These indexes were therefore used for our search using the Web of Science Core Collection. CABDirect and SEARCH by the USDA National Agricultural Library were also accessed via the UBC Library subscription services.
In January 2024, CABDirect was rebranded as CABI Digital Library, and UBC had not resubscribed to the new rebranded service as of October 2024. Therefore, search updates were not carried out after 2024 using this bibliographic database.

2.2.4. Estimating the Comprehensiveness of the Search

During the protocol stage, search strings were tested for comprehensiveness using a list of 14 benchmark articles which we considered to fit the search criteria of the review [23]. The final search strings shown in Supplementary File S2 represent the culmination of this iterative process in which keywords and truncations, wildcards, and other elements were added and removed. Using these search strings, all 14 of these articles were found across the three databases chosen for the search. Since all the articles were retrieved, this search string was judged to be sufficiently comprehensive. The search string for the Web of Science Core Collection database was used as the baseline search string and modified for other search sources according to their specific needs.

2.2.5. Search Results

Search results were aggregated using Microsoft Excel. Duplicates were identified and removed using the Excel “remove duplicates” function. Full-text records were retrieved using publicly available search engines such as Google and Google Scholar, and the library subscription services of the author universities: UBC and the University of Western Ontario. If a record could not be accessed online through Google Scholar or retrieved using the subscription service of either university, then it was excluded from the final map.
Google Scholar only shows the first 1000 search results. All the available results were screened. At the final search update in March 2025, Google Scholar showed more search results, but we still limited the search to the first 1000.

2.3. Article Screening and Study Eligibility Criteria

2.3.1. Screening Process

For the databases and platform of peer-reviewed literature, a two-step screening process was used: (1) at the title–abstract level and (2) at the full-text level. Both screening stages were carried out by two reviewers, both part of the authorship team, working independently. Title–abstract screening was carried out by both reviewers on batches of 300 records. When questions were raised about the eligibility of a particular source, the issue was dealt with via discussion between the two reviewers. Final lists were shared between reviewers with uncertain records marked with a “maybe” for later discussion between reviewers, and inclusion or otherwise was decided after discussion. A third reviewer, another member of the authorship team, was available to cast tiebreaker votes if needed, but this was not necessary in the final count since there was generally a very high level of agreement between reviewers. No reviewers had authored articles to be included in the review. However, one author of this review who did not take part in the reviewing process did co-author articles to be considered for inclusion. This co-author was excluded from the reviewing process to avoid conflicts of interest. No articles written by any of the authorship team were included in the final evidence map.
The kappa interrater reliability test was used to check consistency between the two reviewers at both the title–abstract and the full-text level [45]. The kappa interrater reliability test is a commonly used statistical measure that measures the extent to which two reviewers agree on which papers to exclude or include in evidence synthesis. A higher coefficient denotes an extent closer to complete agreement. In the protocol for this review, the minimum kappa coefficient was 0.9 (meaning agreement between reviewers at least 9/10 times) [35]. The test was performed on batches of 30 records. Although the protocol specified multiple rounds of comprehensiveness testing, this was not necessary at the title–abstract level since a kappa coefficient of 1.0 was achieved during the first round of testing, indicating full agreement between the two reviewers.
At the full-text level, the first round yielded a kappa coefficient of 0.89, with reviewers disagreeing on the inclusion of one report. Since this value was less than the 0.9 cutoff specified in the protocol, this was deemed inadequate. After discussion between reviewers, the test was repeated with another batch of 30 records, and all the 30 test reports were agreed upon by the two reviewers, giving a kappa coefficient of 1.0.
The screening process for grey literature documents such as project reports differed from that used for bibliographic databases. In general, the title and a preview of the file were the only information visible to the reviewers upon first viewing. A title–preview-level screening was therefore performed as the first level of screening available to reviewers [34]. Sources that looked relevant were downloaded as a pdf and stored in a shared digital workspace for the second “full-text” screening stage. This stage involved skimming the entire document for eligibility. If the document was over five pages long, then a whole-document search for the word “bamboo” was sometimes used to find the relevant section and save the reviewer time.

2.3.2. Eligibility Criteria

To be eligible for inclusion, the source must describe efforts to develop the bamboo industry for the purpose of sustainable livelihood development. Target beneficiaries from any geographic location and at any scale, including regional, national, and international, were eligible for inclusion. All beneficiary groups were eligible for inclusion. Examples of target beneficiary groups include youth, women, artisans, farmers, and professionals. All target industries, including construction, handicrafts, and furniture, and interventions that target the whole bamboo value chain, were eligible for inclusion. Only articles written in English were included.
Interventions that concluded between 1990 and 2025 were included. This date range encompasses a period of rapid growth and interest in bamboo as a tool for livelihood in the international sphere. Interventions implemented by partner agencies from various groups, including governments, international agencies, non-governmental organizations, community groups, and other similar organizations, were included. Individual efforts by companies to sell bamboo projects were considered ineligible, as these projects described the growth of individual companies and not wider efforts to promote the bamboo industry. Only interventions for which a comparator could be identified were included in the review, but any comparator was eligible. In this context, inclusion of a defined “comparator” means that reported changes as a result of the intervention were compared to a clear baseline, control group, or other statistic. Categories and definitions of comparators identified during the review process are defined in Supplementary File S3.
Projects that did not report any outcomes or impacts, according to the definitions of the two terms discussed in Section 1 of this report, were considered ineligible. Interventions with purely environmental objectives, such as soil management, conservation, or carbon sequestration, without any human or social element, were considered ineligible, as these did not encompass industry development interventions according to our definition of the term. However, if both social and environmental objectives were reported, then the intervention was considered eligible. Any type of evaluation indicator was also considered eligible, including alternative qualitative indicators.
Since there is no universally agreed upon program evaluation methodology for bamboo industry development interventions, or indeed for development projects in general, any study design was considered for inclusion, provided the study design was identifiable in the document. Quantitative, qualitative, and mixed study designs were all considered eligible.

2.4. Study Validity Assessment

In accordance with the guidelines for systematic evidence maps [34], no specific study validity assessment was conducted. However, some information was recorded that might make it easier to conduct such a study in the future, such as the presence or otherwise of a baseline study and details about the type of evaluation methodology, comparator, and indicators used. In addition, careful internal consideration of whether any specific comparator and evidence of outcome/impact were present in the report was needed to ensure that consistency with our chosen definitions of outcomes, impact, and evidence was maintained.

2.5. Data Coding Strategy

To train reviewers on the coding process and ensure consistency between reviewers, the two reviewers first each coded a single source independently and compared results, discussing discrepancies and adjusting interpretations of the process. The two reviewers then double coded ten sources and reviewed the resulting data. Several small discrepancies between the two reviewers were discussed and resolved. After this consistency test, metadata were extracted independently by each reviewer working on a list of half the documents. The reviewers regularly discussed individual records to decide on how much detail to include in the map. Since codes were originally recorded on different tabs in a shared Google Sheet, reviewers could refer to each other’s work at any time to check the consistency of the coding.
The metadata described in the Supplementary Material (Supplementary File S3, Sheet “codebook”) were collected for each included report as a spreadsheet with one row corresponding to one intervention described within each study. Some articles described more than one intervention, and some interventions were described in more than one article. The study unit for this review was therefore an individual intervention, and not an individual article or study per se [46]. To make this process easier, the individual project or intervention was given a simple name which was stored in the systematic map. To synthesize multiple records to give more comprehensive information about a given intervention, multiple documents were listed under each project name where possible in the full systematic map so that readers could see which metadata on each project were sourced from which document. Abbreviations, where retained from the original document, were entered into a separate tab for reference. Data from list categories combined for each individual intervention are also presented in the Supplementary Material as an indexable table with each individual code afforded one column and the presence of that information conferred with a “1” in that column, with the absence of that information conferred with a “0” in that column.
Where possible, the exact text found in the source document referring to each subcategory was entered into the database to avoid introducing reviewer bias into the database (Supplementary File S3, Sheet: “Complete evidence database_text). If metadata for the categories included in the map were missing or unclear, no attempt was made to obtain or confirm the information.

2.6. Data Mapping Method

Data were collected in a spreadsheet as a database (Supplementary File S3). Data were collated using Google Sheets and analyzed using Microsoft Excel. Relevant descriptive trends are summarized below in maps, graphs, schematics, and tables. This descriptive analysis was carried out using the subcategories of the codes collected in the spreadsheet and stored in an indexable table with each row representing a single intervention (Supplementary File S3, Sheet: Interventions_indexable). This table was used to create the graphs and tables found in the Results section of this report.
To provide information based on which interventions could be appraised for quality in the future, details on the presence of a baseline study, the presence of information about the type and rigor of the evaluation methodology carried out, and type of comparator were included in the metadata. The geographic map was created using mapchart.net, a simple online tool for making colored and labeled maps. Infographics and figures were created using Canva, an online graphic design program.
Supplementary File S4 contains a list of individual articles included, their source, and the type of document, and a list of individual interventions studied. A narrative highlighting interesting, relevant, or demonstrative parts of the map was compiled and is presented below as maps, column and bar charts, infographics, and cross-category analyses. Information on key areas of the map, including individual interventions or categories of metadata, is included below.
Knowledge gaps and clusters are primarily highlighted by cross-tabulating different variables and using color gradients to highlight the combinations of variables with more or fewer documents included in the systematic map. Darker colors represent a higher frequency of overlap. Underrepresented topics with fewer documents included in the systematic map are considered to represent knowledge gaps, and overrepresented topics warranting further systematic review are considered to represent knowledge clusters. The cells in tables in Section 3.11 are shaded according to the color scheme in Table 3.

3. Review Findings

3.1. Descriptive Statistics

The ROSES Flow Diagram for this study (Figure 2) describes the information flow [47]. The title–abstract screening stage also encompasses records screened from the grey literature at the title–preview stage. Unobtainable records from Google Scholar and Google were excluded before the deduplication stage. Total document counts include all search updates. A total of 2724 records were retrieved from the Web of Science Core Collection online platform; 1791 results were retrieved from the SEARCH from the USDA National Agricultural Library database; and 704 results were retrieved from the CABDirect database. A total of 5219 results from bibliographic platforms were combined.
A total of 40,769 records were sought for retrieval from other sources. Figure 3 expands on the search for these documents, giving specific information on documents found from organizational websites, Google Scholar, and Google searches, which yielded a total of 23 documents included in the final review (Figure 2). Some organizational websites did not include the type of search function necessary to search for this type of document, so they were only able to be located by using Google to search the website using the search strings included.
After removing duplicates, a total of 13,621 records were screened at the title–abstract or title–preview stage, with 13,078 being excluded at this stage.
Attempts were then made to retrieve 543 records, with 32 not found and 2 inaccessible to researchers. Following retrieval, 495 documents were assessed for eligibility at the full-text level and 473 reports were excluded. In all, 36 documents from the bibliographic platforms and databases were included in the eventual map: 8 from organizational websites; 17 from a Google search of organizational websites; 6 from the CABDirect database; 3 found using SEARCH from the USDA National Agricultural Library database; and 4 found using the Web of Science Core Collection. A full list of the 34 unobtainable and 473 excluded records at the full-text stage and reasons for exclusion can be found in Supplementary File S5.
In all, 36 documents describing 28 unique interventions were included in the systematic evidence map. In the following results, we refer to either documents (individual documents included in the final review) or interventions (unique interventions described by one or more documents).

3.2. Temporal Distribution of Documents Included

The publication date of documents included in the review (Figure 4) ranged from 1999 to 2024, the latest year included in the review. The year with the most documents included was 2020 with six documents.

3.3. Type of Documents Included

Included documents were categorized into document types: project documents (fifteen documents, 16.3%, reports published for a primary internal audience of project staff); reports (seven documents, including technical reports and informational materials published by organizations); journal articles (nine documents); book chapters (two documents); project evaluations carried out by independent evaluators (two documents); and conference proceedings (one document) (Figure 5).
Of the twenty-eight interventions recorded, six appeared in more than one document included in the review, including four that appeared in two documents and two that appeared in three documents. All these interventions took place in Asia.

3.4. Study Design

Just 2 documents exclusively described qualitative methodologies (Figure 6), with 11 using quantitative and 23 using mixed methods.
The following sections refer to interventions and not to individual documents.

3.5. Geographic Distribution of Interventions

Interventions were distributed across 13 countries in Asia, Africa, and the Americas, specifically Latin America and the Caribbean (Figure 7). Evidence of the impact of the most interventions was found for China (10), followed by Cambodia, India, and Lao PDR (3). Asia was the most represented region, with 22 interventions compared to 5 in Africa and 1 in South America. In Africa, the most represented countries were Ethiopia and Uganda, with two interventions each.

3.6. Time Period and Duration of Interventions

No documents described interventions that began after 2020 (Figure 8). The most common time period for interventions included in the database was six years, with six interventions. The most recorded beginning year was 2016, with five interventions, and the most recorded end years were 2016, 2018, and 2019, with three interventions each.

3.7. Types of Intervention

The most common types of activities recorded (Figure 9) were training (20 interventions), supporting and strengthening institutions like NGOs or enterprises (15 interventions), and plantation management (9 interventions). Financial support to beneficiaries from various mechanisms, including credit provision (four interventions), direct funding (three interventions), and subsidies (four interventions), was also a major mode of activity found.
The most common type of implementing agency, with 14 interventions, was governments (Figure 9). Many were implemented by several partner agencies, often including national and foreign governments, international agencies, and local NGOs. The Chinese government was the national government that implemented or partially implemented the most interventions recorded in the database, with nine interventions.
For 15 interventions, the intervention incorporated participatory processes. In terms of input, which refers to funding or material and technical support, 16 interventions were implemented by a foreign government, which included international development agencies run by specific governments. Ten were funded at least in part by national or local governments. The remaining nine were separated into international organizations (eight interventions) and private sector funding (one intervention).

3.8. Outcomes and Impacts

No outcomes were found fitting the category of “food security” (Figure 10). For most (22) interventions, no negative outcomes were reported, although, for 1 intervention, no positive impacts or outcomes were reported. Negative outcomes varied, but primarily comprised participants being unable or unwilling to benefit from the interventions due to market or other local factors. Two interventions reported negative environmental outcomes, namely, the failure of planting bamboo to live up to its environmental promise. The most common outcome recorded was financial security (22 interventions), usually focusing on incomes increased or economic empowerment due to the sale or profit from bamboo products. Other outcomes found included individual and community wellbeing (11 interventions), participation and engagement (11 interventions), and environmental outcomes (10 interventions). Economic impacts were the most reported (26 interventions).

3.9. Evaluation Types

Economic evaluation indicators (Figure 11) were most often used (22 interventions), followed by human (17 interventions) and environmental (14 interventions) indicators.
A total of thirty-one documents (Figure 12) recorded some sort of baseline study, while five interventions did not collect baseline data and relied on another type of comparator, such as control (three interventions) or alternative groups (two interventions).

3.10. Beneficiaries and Target Industries

The most common beneficiary (Figure 13) was rural communities, with 19 interventions. This category covered rural areas such as villages and farms, whether specific communities or multiple. The most common industries targeted were bamboo handicrafts (12 interventions) and bamboo plantations (10 interventions), which included bamboo grown on smallholder farms to sell as culms or shoots. Interventions that focused on upgrading and supporting the whole bamboo supply chain, of which five were included, consisted of interventions aimed at simultaneously developing supply, demand, and the quality of the bamboo natural resource and products in a certain region.

3.11. Knowledge Gaps and Clusters

Cross-category analyses (Table 4, Table 5, Table 6, Table 7 and Table 8) identify knowledge gaps and knowledge clusters.

3.11.1. Knowledge Gaps

Table 4, Table 5, Table 6, Table 7 and Table 8 reveal significant gaps in the primary data relating to many types of data sought during this mapping exercise. Outcomes related to gender, health, and social equity were underreported (Table 4), as were all categories of impact except for economic (Table 5). Further primary research is needed to understand whether this is due to reporting bias, poor data collection in these areas, lack of interventions carried out in these field, or another factor.
Very few documents detailed evidence of interventions that effected policy change as a major activity (Table 6).

3.11.2. Knowledge Clusters

Data on economic and financial outcomes, impacts, and evaluation were relatively rich (Table 4, Table 5, Table 6, Table 7 and Table 8), representing the most significant knowledge cluster and a good candidate for further systematic review and quantitative or statistical analysis. Interventions that took place in China represent a geographic cluster, with nine interventions.
Other sections of the map that might be suitable for systematic review include the ten documents that describe training programs that train beneficiaries in bamboo handicrafts; the 11 documents describing interventions that took place in Asia and involved support for institutions (Table 7); and the 18 documents describing bamboo development interventions that involve training and lead to financial outcomes.
A full systematic review of interventions that use a pre–post intervention comparator, the most common comparator found (Table 7), may allow reviewers to use quantitative methods to compare and analyze the impact of these interventions.
Although only representing six documents, the most common industry targeted by interventions that also specifically targets women was the handicrafts industry (Table 8), suggesting that this area could be deserving of further primary research and study to further gender equality objectives. Indeed, the interventions supporting the handicrafts industry represent an interesting knowledge cluster, particularly considering the cultural and economic relevance of handicrafts sectors to many vulnerable communities.
A specific illustrative example of a well-represented area in the systematic map database is the 18 documents describing interventions that took place in Asia and describing training programs (Table 9). This area is a good candidate for full systematic review.
In addition, each of the 28 interventions included in the map may be suitable for further study or systematic review, or for creating theories of change or other theoretical frameworks to understand bamboo industry development. The systematic map database can be used to find more information about these interventions, and citations of documents in which more information can be found. An example logic model showing complete information for one of these projects is shown in Figure 14.

3.12. Limitations of the Map

3.12.1. Limitations in Search Strategy

The Google search engine is an imperfect tool for systematic evidence mapping. When searching for relevant articles using the Google search engine to locate organizational websites, only selected results can be accessed. The number of results shown is much larger than the number of results available for retrieval. Therefore, although many search results are shown, a smaller number of results (a maximum of around 400) was reviewed for each search undertaken, until our final search update in March 2025, when more results were accessible. Google also automatically removes duplicates, meaning that the number of results that we could review was often substantially lower than the stated number of results. In addition, Google searches are not fully replicable, as results may differ significantly depending on the location and search history of the person searching [44]. Google search algorithms are also updated over time and details on specific changes are not accessible to reviewers, making it difficult to update or replicate the same search over time. During our final search update, the number and relevance of results using the Google search engine had changed significantly, with the number of results increasing dramatically. Given the large proportion of documents included in the review that were sourced using Google to search organizational websites, this represents a significant limitation of the searching steps involved in this systematic evidence map. Google Scholar is also an imperfect tool for systematic reviews, since only 1000 results could be retrieved from any individual search at the time of our original searches, and information on how the search algorithm presents results is difficult to obtain, again meaning that searches are not replicable over time or across different reviewers [49]. While the home institutions of the authors did not have subscriptions to any other grey literature database, it is possible that searching via specific databases of grey literature documents such as Overton may have yielded other relevant results.
Given the resource availability, obtaining an exhaustive list of all organizations that may have carried out this type of intervention was impossible. There may be grey literature available on other organizational websites or university websites that the team missed due to this limitation. Still other smaller local NGOs may not publish information about their projects online at all.
In this review, the search language used was English. It is very likely that evidence on some interventions is documented and retrievable only when searching in other languages, notably Spanish, French, and Mandarin. These languages, in addition to other local languages, are spoken in bamboo-rich areas. Six relevant sources were found during the search that were not included because they were written in Chinese. Further evidence mapping may consider sources in these and other languages, including identifying search sources and strategies that may include sources in these languages.

3.12.2. Other Limitations

The lack of any universally agreed upon impact evaluation and reporting standards for this type of intervention makes collecting and synthesizing evidence difficult. The coding process was difficult since different terms for the categories of metadata needed were used in different documents, and a lot of information was missing. Definitions of outputs, outcomes, and impacts were inconsistent. The distribution of evidence on economic and environmental outcomes and impacts found in this review may reflect the ease in quantifying and recording certain tangible parameters, such as economic impacts like changes in income, and tangible environmental benefits like hectares of land restored, over any real on-the-ground evidence.
A significant number of documents (16 documents) were excluded from the eventual map because they did not report any outcomes or impact in the full-text screening stage, while still others (55 documents) were excluded because no comparator could be identified. These documents are a valuable resource because they report on relevant projects or interventions that have taken place, although they do not provide any evidence of the impact of these interventions. This limitation reflects the type of reporting on bamboo industry development interventions, a common source of discussion and debate among development practitioners and policymakers [50].
In addition, the type of document found in this review holds a significant risk of positive bias, with few documents reporting any limitations or negative outcomes of the interventions described. It may be the case that any negative outcomes, and harder-to-measure outcomes such as participant wellbeing, were underreported or omitted in the publication of the documents included in the review.
Some of the interventions included in the review earmarked funding for many activities, not just bamboo industry development, and specific numbers were not always available on funding specifically for bamboo industry development. Funding figures may therefore refer to wider projects and not solely to bamboo industry development and cannot be considered a reliable estimate of total funding spent on bamboo industry development.
Finally, the documents included in the final map clearly define an evaluation methodology and comparator, meaning it is clear how, and compared to what, the outcomes they describe occurred. However, there is a risk that outcomes described in the review could be due, in whole or in part, to external factors not explained in the documents themselves, such as other projects, government intervention, or external economic factors.

4. Discussion and Conclusions

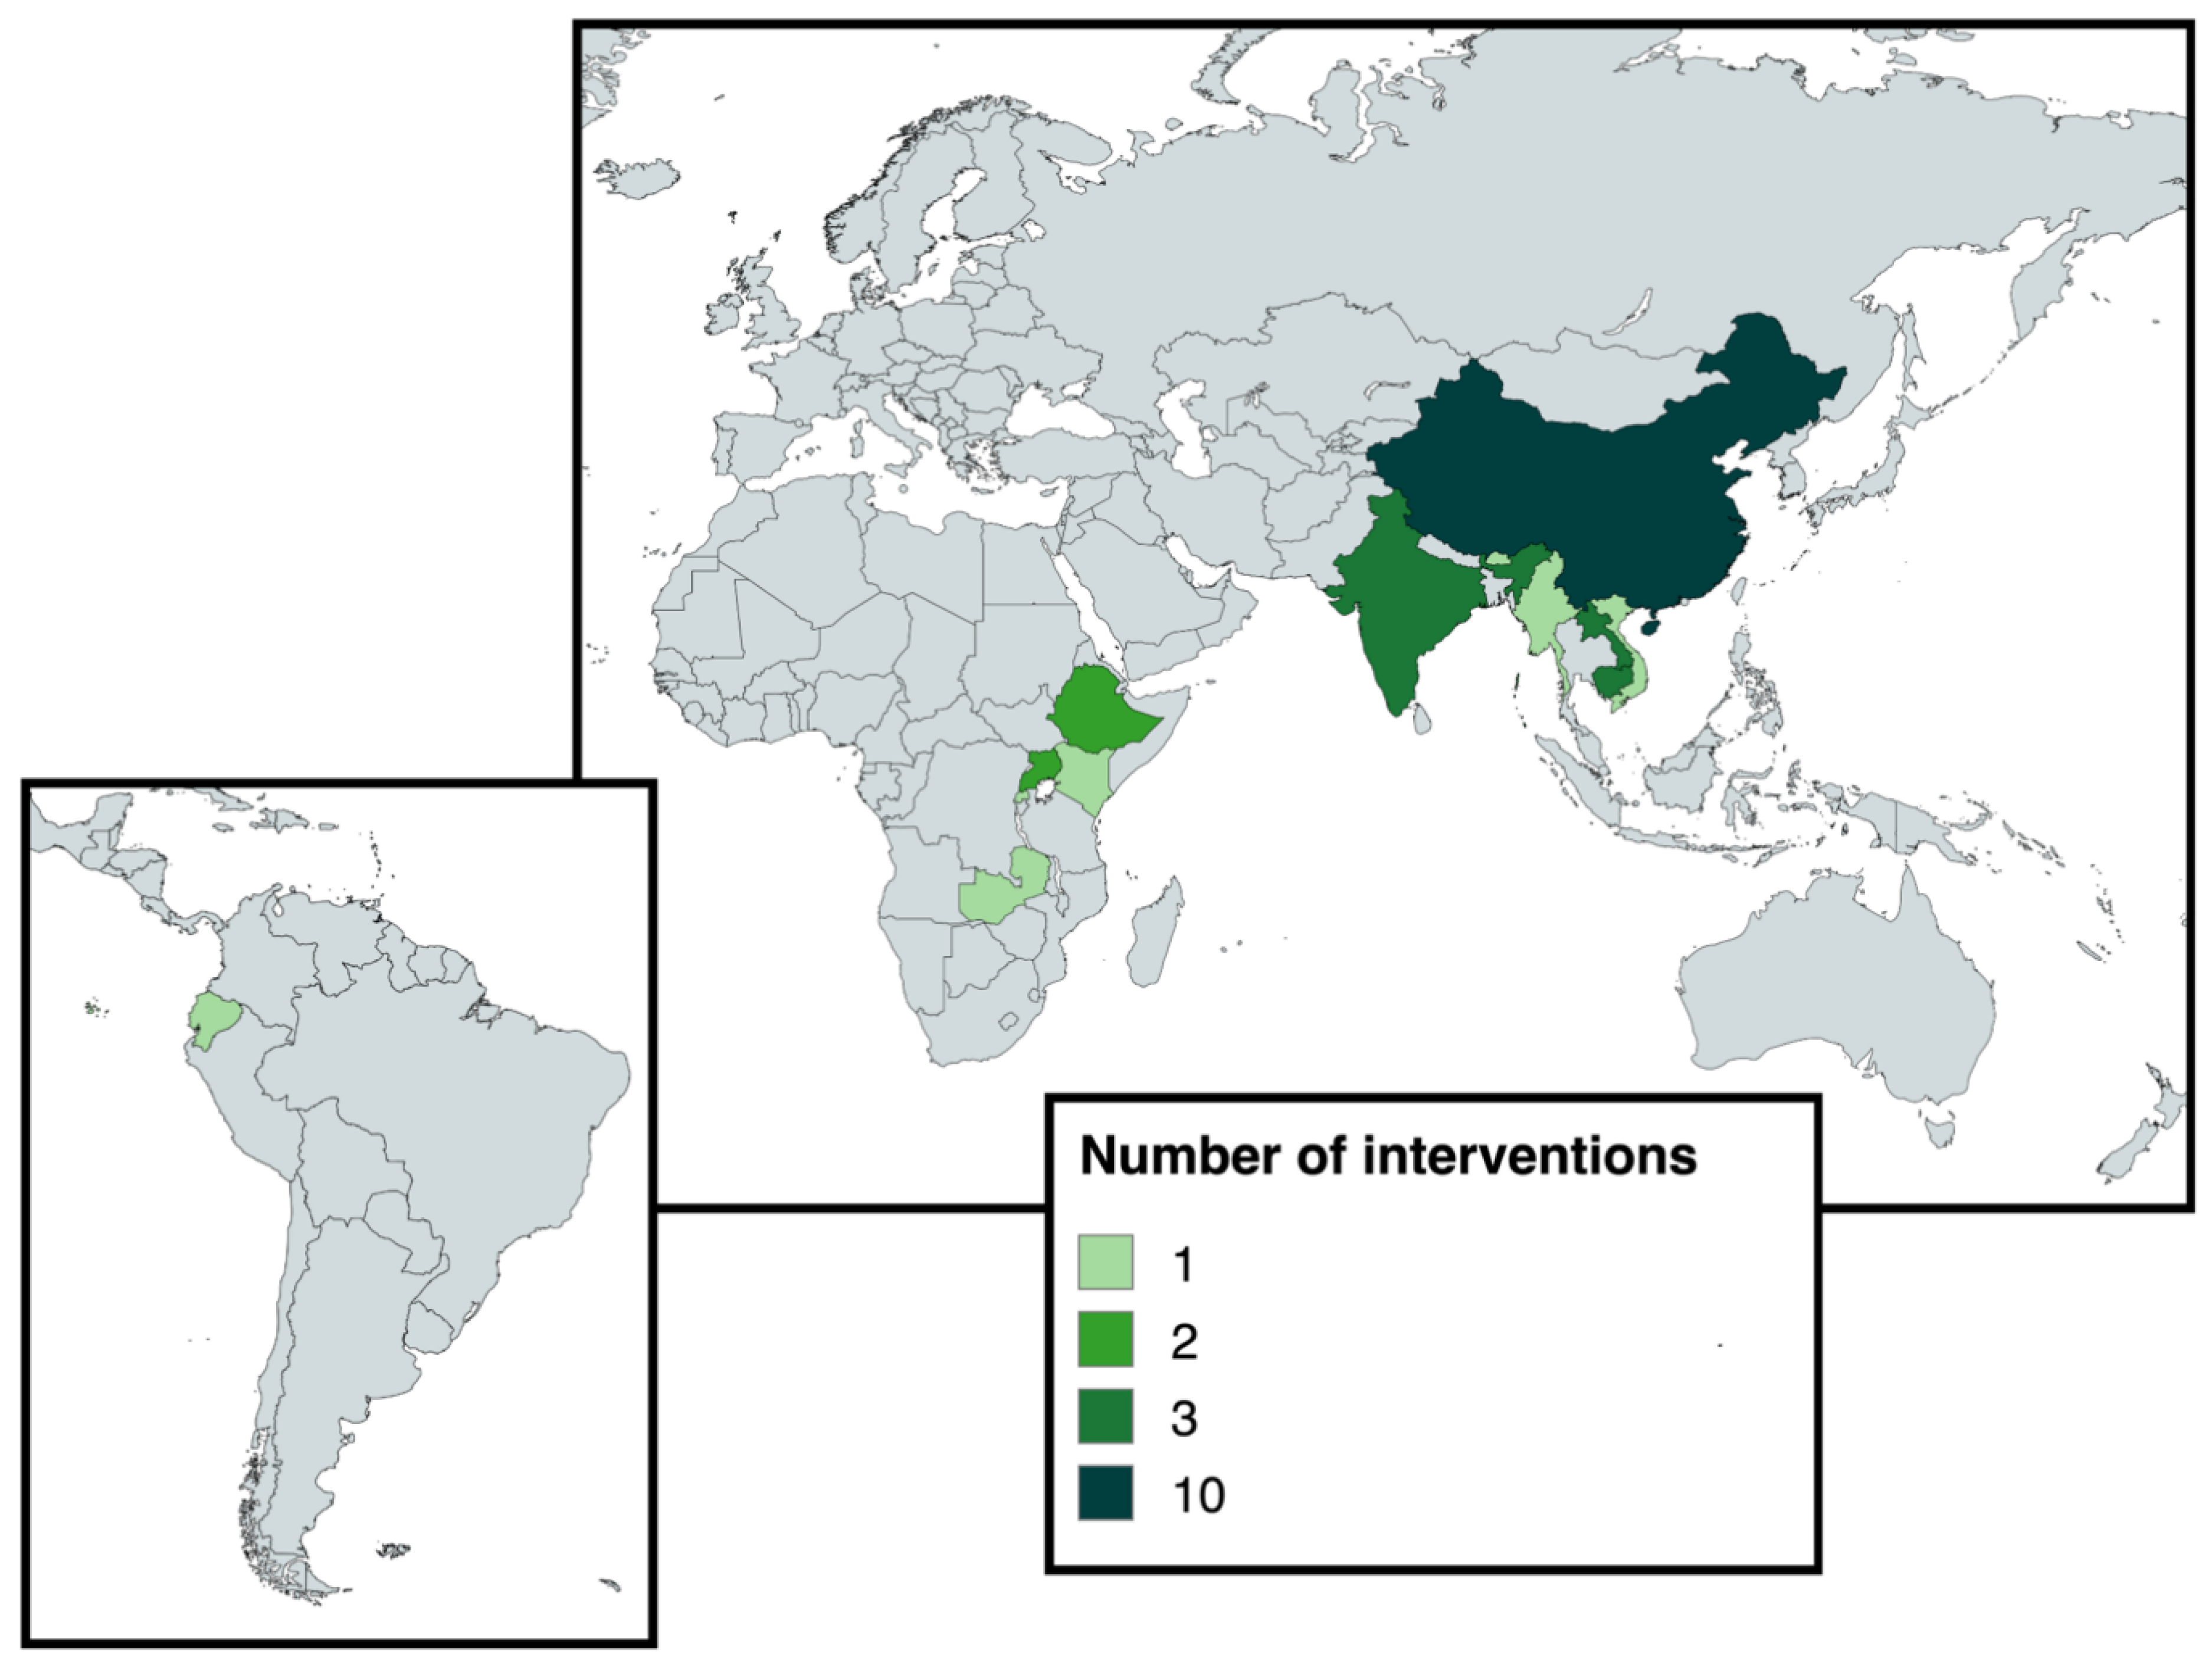
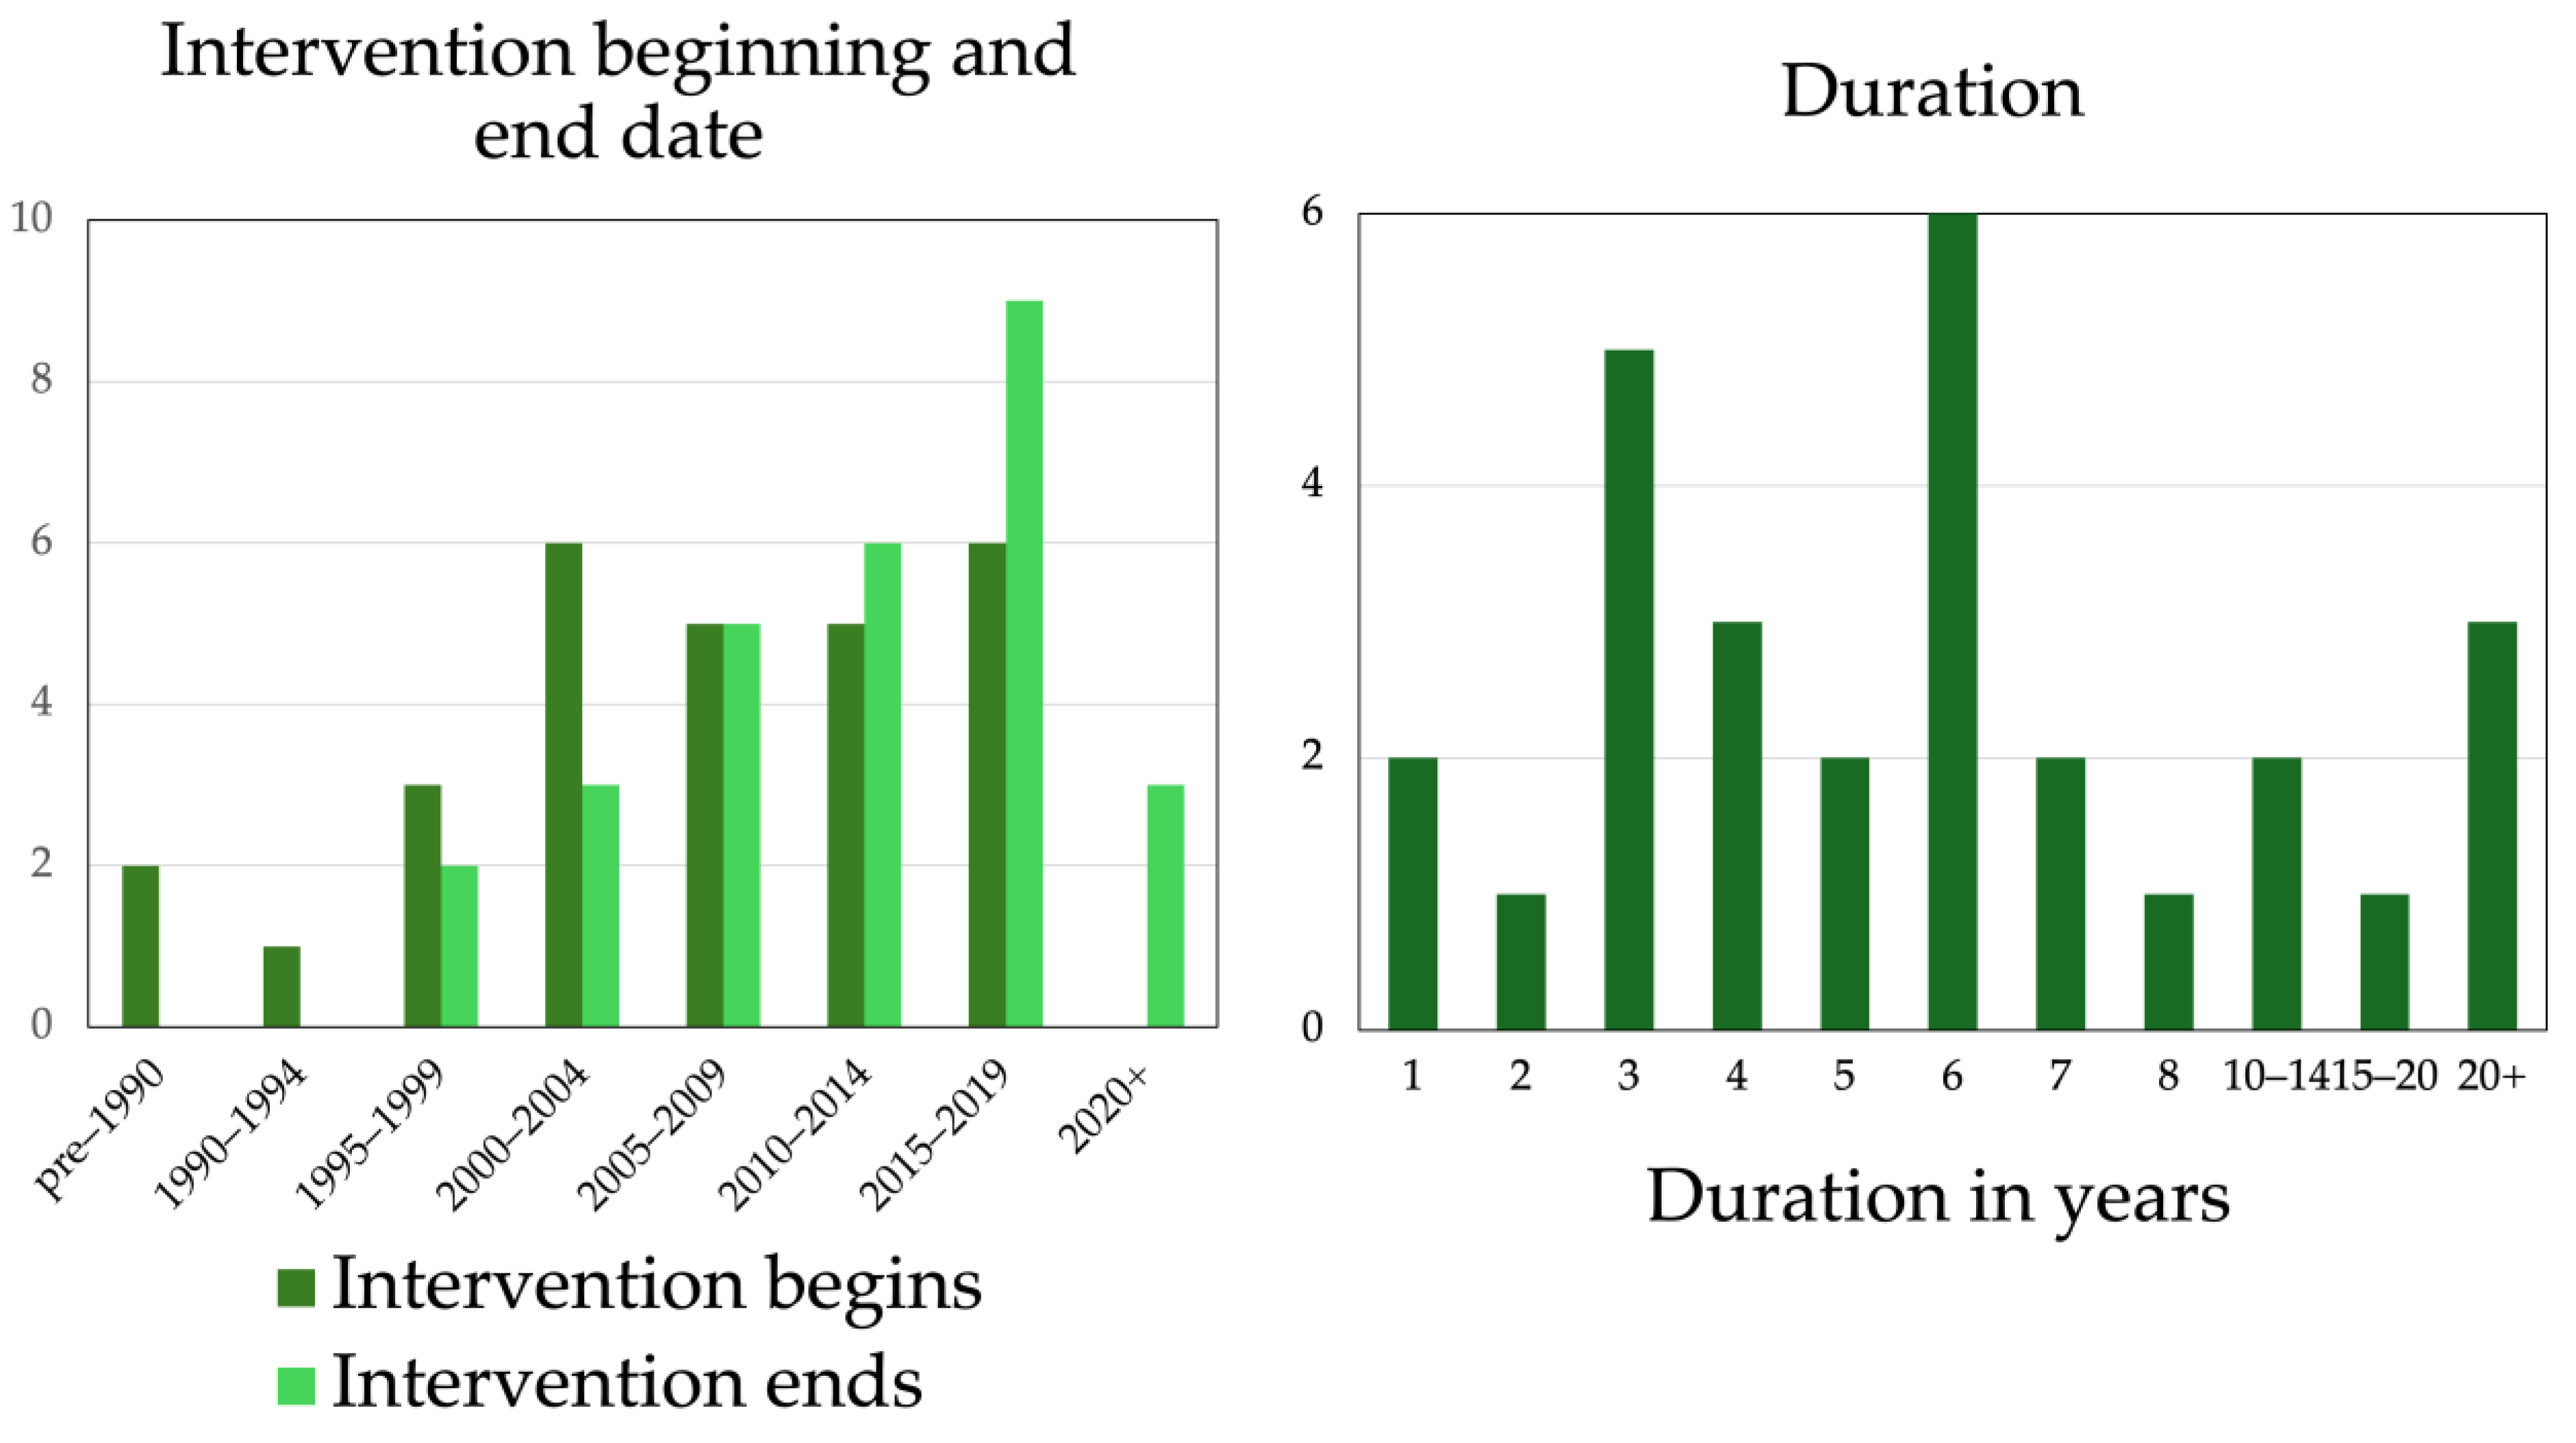
This systematic evidence map adds to the discussion of bamboo as a tool for livelihood development by collecting published evidence on the impact of bamboo development interventions worldwide since 1990. The resulting map is dominated by evidence provided by interventions implemented in China by the Chinese government, comprising 9 out of 28 interventions. A complete appraisal of the evidence is hindered by the large number of “unknown unknowns” in the field, and many interventions were excluded from the map due to a lack of evidence on their impact.

4.1. Implications for Policy/Management

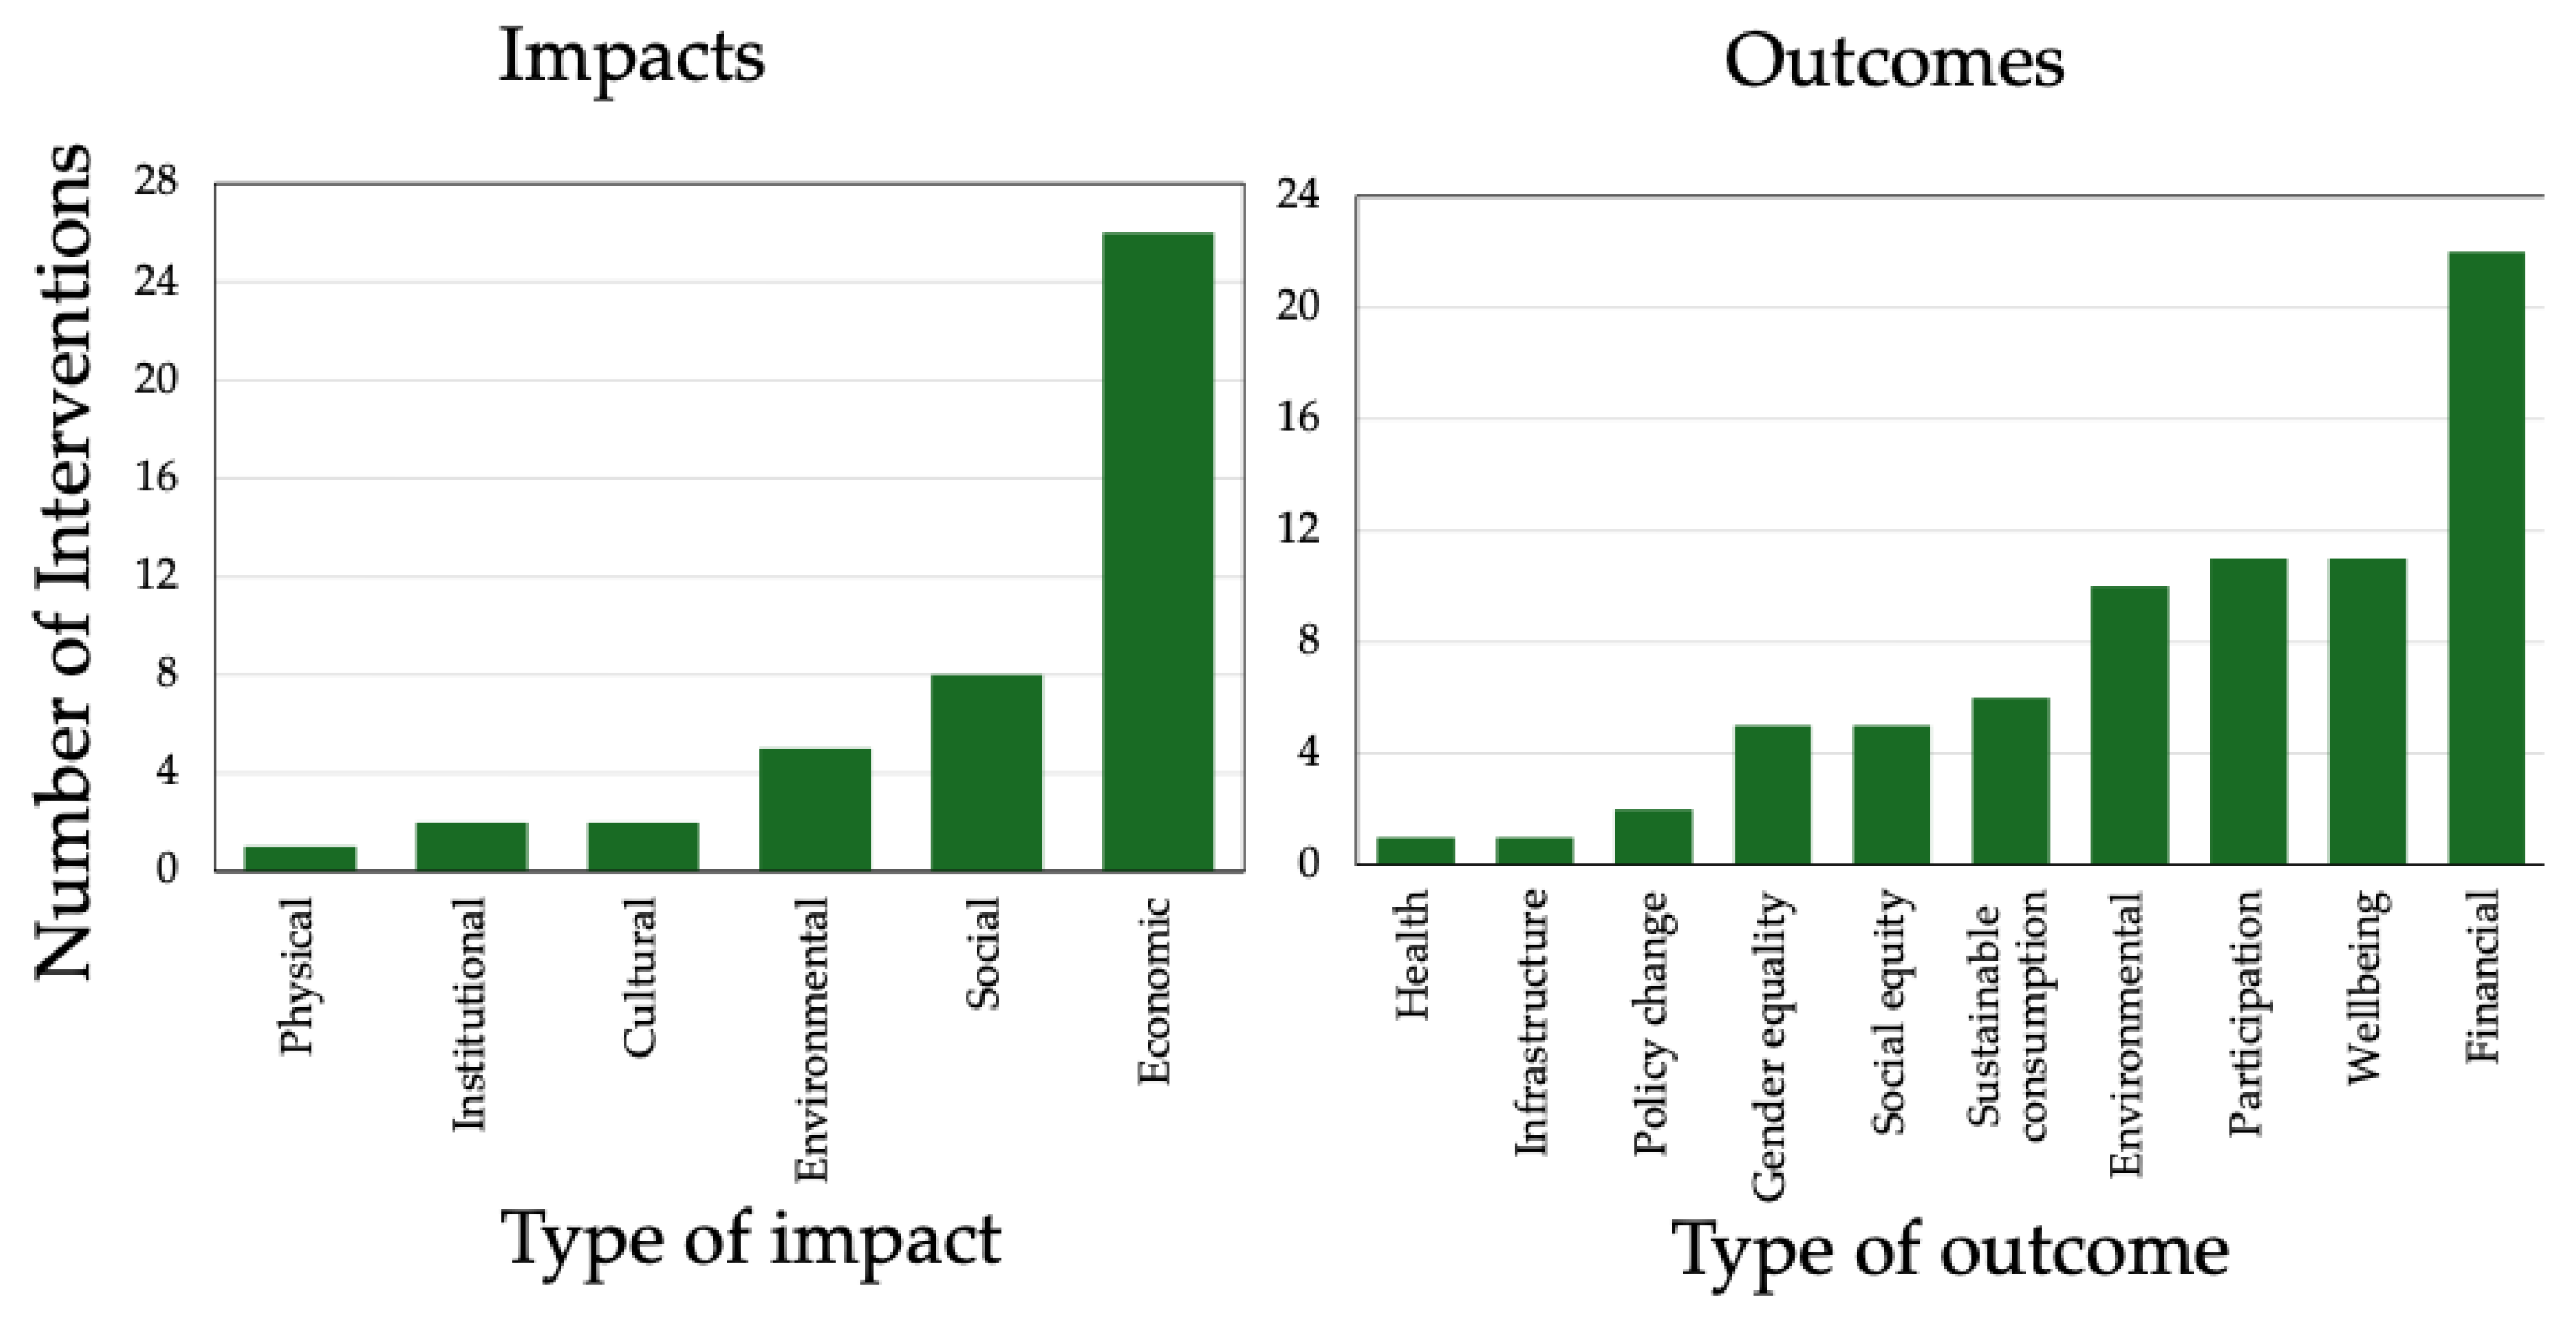
The evidence showed a significant trend towards financial security, as did outcomes focused on economic benefits. These findings are aligned with social science critiques of integrated conservation and development projects [51] that argue that financial rewards, being easily reported, and compared, are often prioritized at the expense of more intangible impacts related to community values and the intervention’s ethical responsibility to local communities. As few of the interventions recorded provided the long-term data required to sufficiently evaluate any negative social impacts and unintended consequences that might have arisen in response, it is uncertain whether these critiques can be applied to the context of bamboo development or if the financial and other benefits continued and expanded post-intervention. Confounding variables such as economic trends make understanding the true contribution of any intervention to community wellbeing and economic success very difficult.
The systematic map also demonstrates the prevalence of inter-institutional collaborations and foreign investment to fund these interventions, indicating that many national governments in bamboo-producing regions, particularly those outside of China, often lack the financial and technical capacity to grow this industry outside of domestic markets, or may lack the resources to collect and disseminate information on the evidence of the impact of the interventions. Investing in capacity building/training and strengthening local institutions were the most common activities across all 28 interventions, highlighting the perceived importance of human expertise and institutional resources to the bamboo industry.
This systematic map helps to identify areas of opportunity where future investments and interventions can be prioritized by policymakers, donors, and agency staff.

4.2. Implication for Research

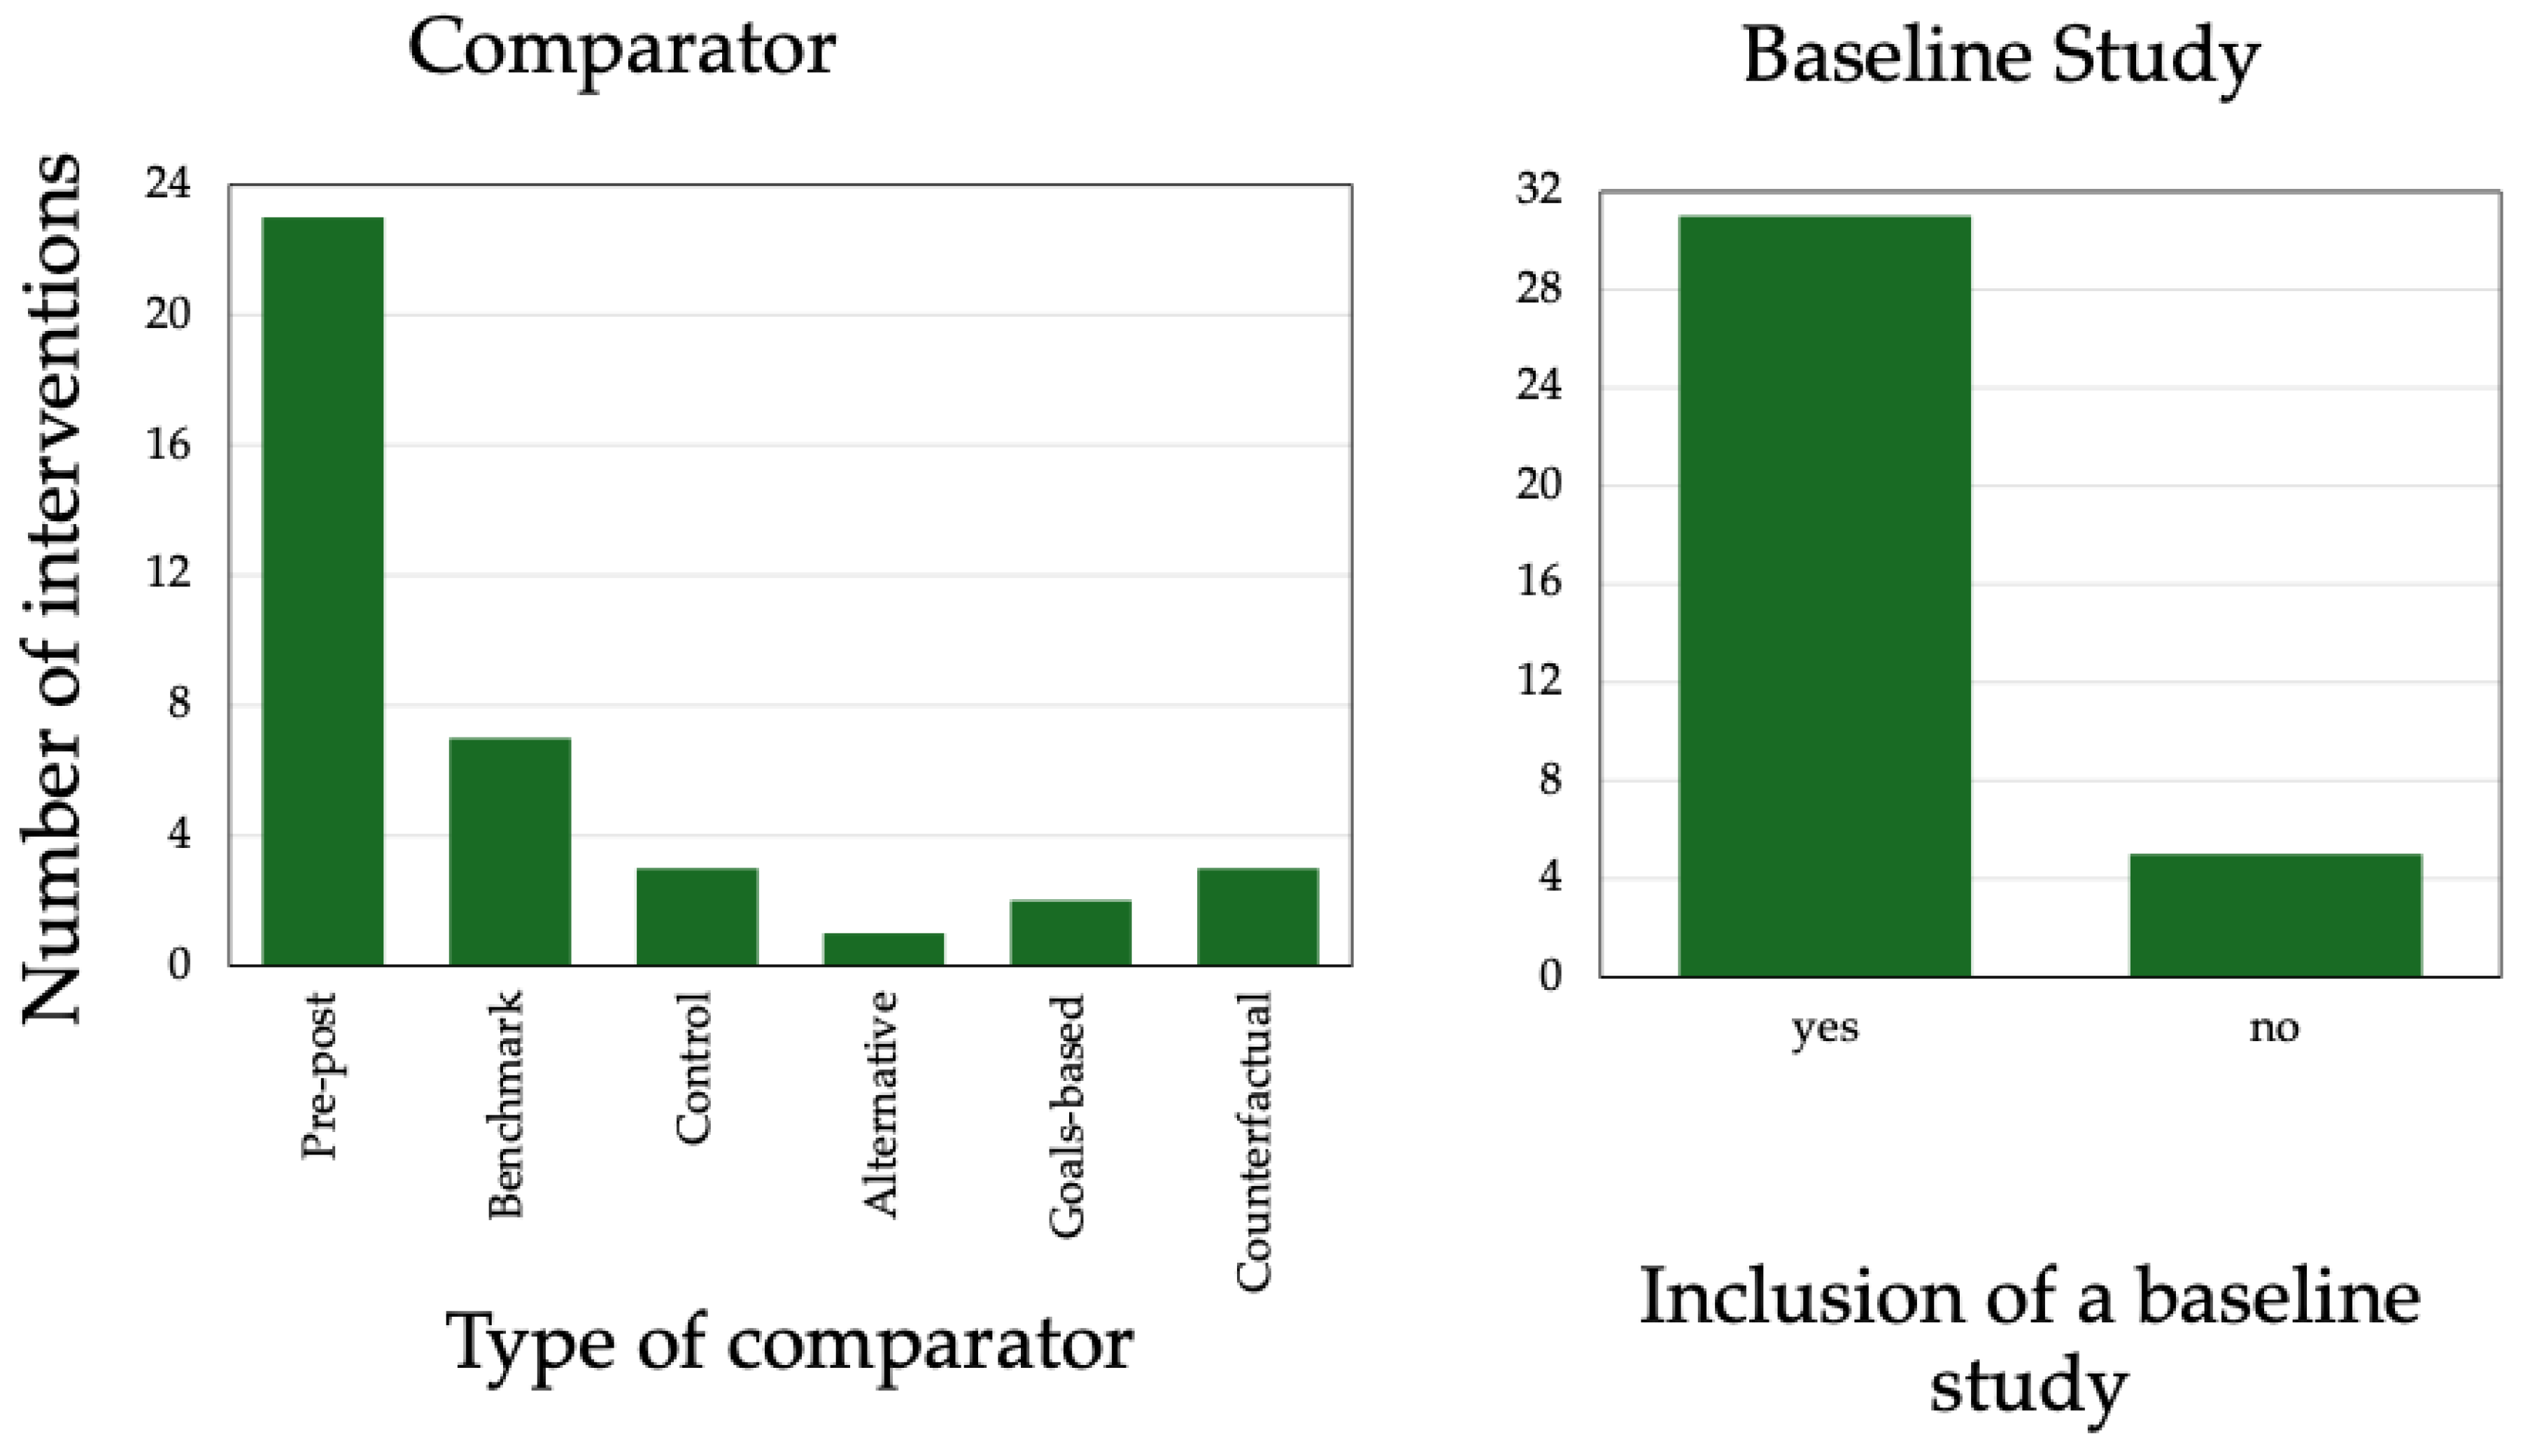
This review found evidence of the outcomes and impact of 28 unique interventions that have carried out activities across a range of industries, reporting outcomes both positive and negative for communities and the environment. Practitioners in the field are motivated to improve lives and create climate-smart value chains using an environmentally friendly and locally abundant material. The dominant type of outcome for which there is evidence is improved incomes and economic impact, with few alternative outcome types recorded in the literature. Further primary research collecting concrete evidence of the impact of more interventions in many areas would be beneficial for the field. The list of excluded records provided with this report can form a starting point for this research, since it provides a record of documents describing interventions for which no evidence of outcomes or impact could be found. We have also provided a list of interventions for which abundant information was found, which could become a starting point for further elaboration of themes, success factors, and theories of change for further research. Further research would also be beneficial in exploring the impact of the interventions included in this database in other areas, such as social equity and gender equality, for which few outcomes were found. In this field, research collecting data using a rigorous comparator, such as a control group similar to the beneficiary group, is particularly difficult. All interventions and beneficiary populations are very different. External factors, such as economic or social trends, can have an outsize impact on the metrics considered to show evidence of impact, such as incomes. This makes comparing and categorizing evidence on impact challenging. Collecting high-quality data is expensive and time consuming for project implementers. Nevertheless, reporting can make evidence synthesis and evidence-based recommendations more accurate by specifically identifying how and from what baseline or control data are collected in publicly available reports, and reporting on negative outcomes and on goals not achieved.
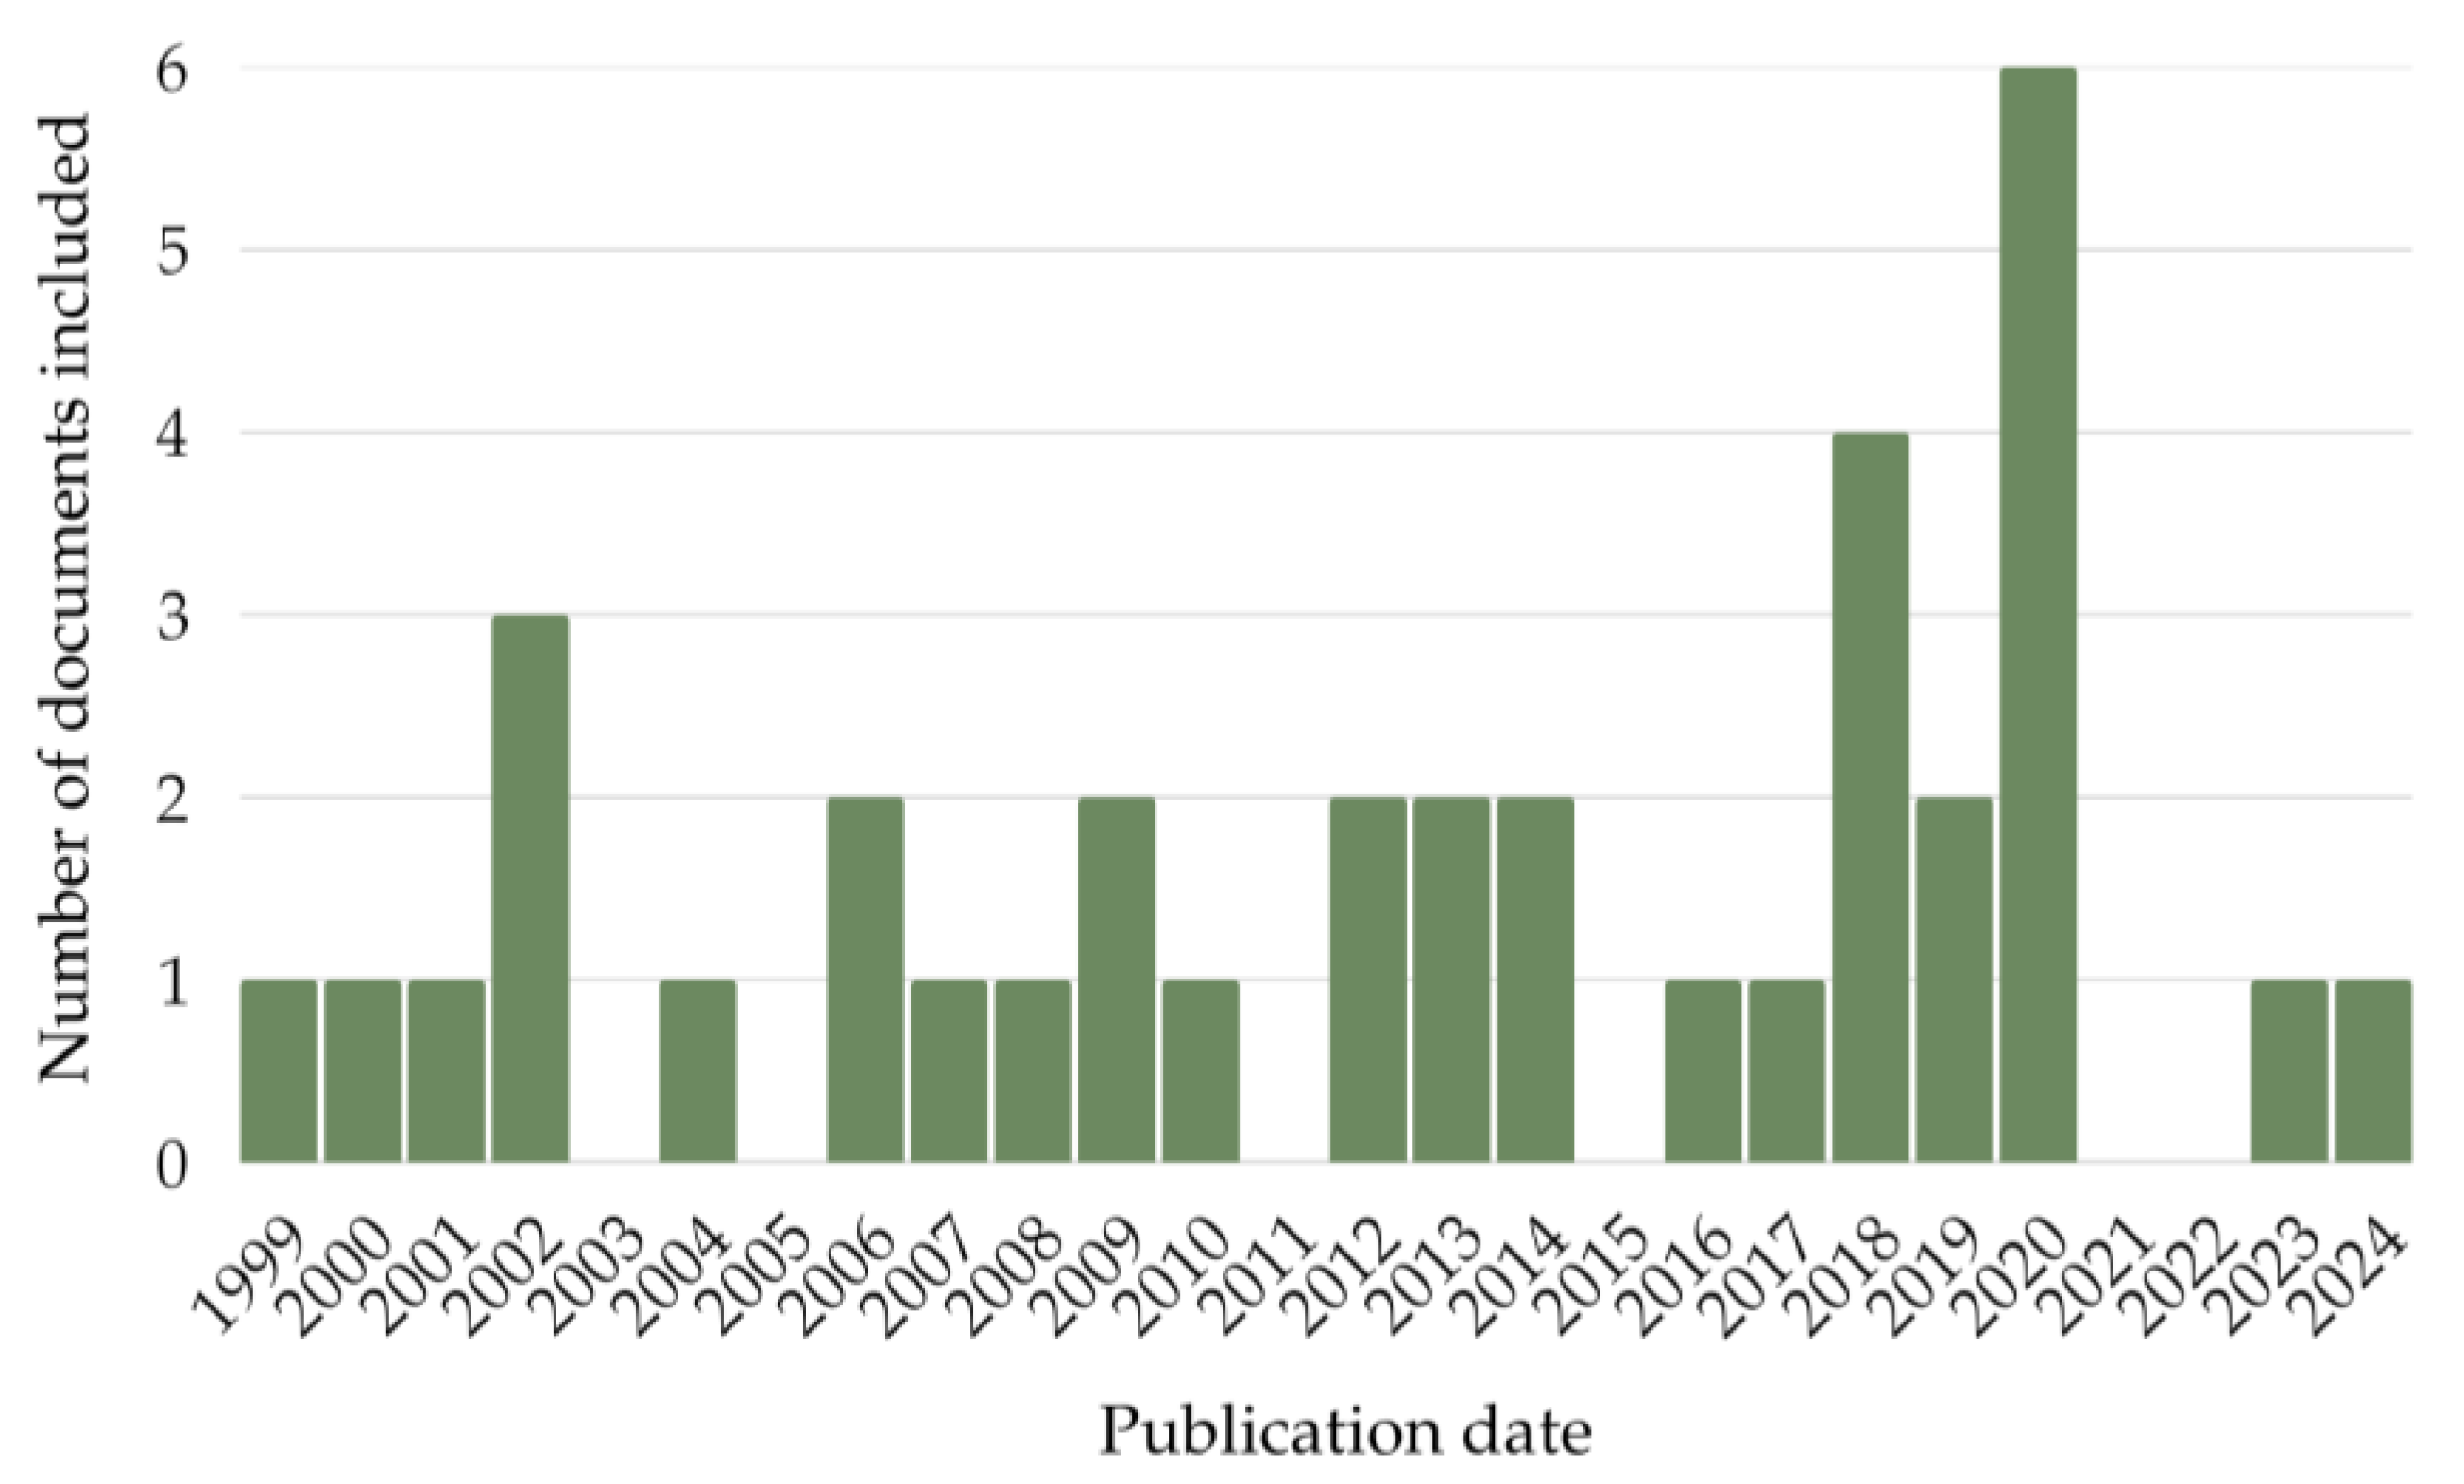
No area of evidence collected in this map can be said to be comprehensive or abundant, but the richest area of evidence identified in this map is the training programs carried out in Asia reporting economic outcomes for participants. The same issues outlined above may impact evidence synthesis in any area of the map since they persist across all countries, regions, and industries studied. However, our analysis highlights areas that could be elaborated upon for full systematic review, including interventions that incorporated training on some aspect of bamboo management, products, or marketing and took place in Asia, which represent the biggest cluster identified. Further primary research and a detailed case study are necessary to understand the evidence on the impact of bamboo industry development interventions in Africa and the Americas, which were underrepresented in the map. Most evidence (23 vs. 13 documents) was found outside of the peer-reviewed literature, indicating a research gap that could be addressed by academics.
As far as we are aware, the resulting systematic map database represents the first attempt to systematize evidence in this field. The database can be searched and filtered to see evidence on interventions carried out, including by filtering to a specific country, region, industry, date, or individual code. To allow agencies, governments, and others to fully understand the effects of livelihood development strategies that facilitate bamboo industry development, more comprehensive and holistic reporting of specific evidence, using rigorous study designs with clearly defined comparators such as baseline studies, is essential. Similarly, the development of systematic evidence map guidelines specifically for international development projects could open the door for more evidence synthesis of projects with mixed environmental and social outcomes, and varied evaluation methods and reporting.

Supplementary Materials

The following supporting information can be downloaded at https://www.mdpi.com/article/10.3390/f16050713/s1: Supplementary File S1: ROSES form for systematic maps [52,53,54]; Supplementary File S2: Search strings and number of results; Supplementary File S3: Systematic map database and codebook; Supplementary File S4: Full list of articles, search origins, type of document, and individual interventions; Supplementary File S5: Excluded and unretrievable files at the full-text stage; Supplementary File S6: PRISMA Checklist for Systematic maps [55].

Author Contributions

L.B. and T.L.B. devised and tested the codes and reviewed the search results and documents for this review. L.B. wrote the first draft of the final manuscript and T.L.B. contributed significantly to the manuscript writing and all analyses. L.B. created all figures. J.L.I. provided detailed guidance and comments on the protocol design, methodology, and the final manuscript. C.D. was responsible for project funding and assisted in the development of the rationale, protocol, and final manuscript. All authors have read and agreed to the published version of the manuscript.

Funding

This research is funded in part by a World Bamboo Fellowship from the World Bamboo Foundation; a Four-Year Fellowship from the University of British Columbia; and a Discovery Grant from the National Science and Engineering Research Council of Canada.

Institutional Review Board Statement

Not applicable.

Informed Consent Statement

Not applicable.

Data Availability Statement

All data generated or analyzed during this study are included in this published article and its Supplementary Files. Search strings for the Web of Science platform were preserved at https://searchrxiv.org/ on 3 December 2023. Search strings were accessed on 19 April 2025.

Acknowledgments

The authors would like to acknowledge the support and expertise of Brian Belcher at Royal Roads University and Helen Brown at the University of British Columbia when developing the concept for this research.

Conflicts of Interest

The authors declare that they have no competing interests. The funders had no role in the design of the study; in the collection, analyses, or interpretation of data; in the writing of the manuscript; or in the decision to publish the results.

Abbreviations

The following abbreviations are used in this manuscript and Supplementary Materials:
ADBAsian Development Bank
ARSAction Research Site
CABICentre for Agriculture and Bioscience International
CEECampaign for Environmental Evidence
CIBARTCentre for Indian Bamboo Resource and Technology
CIFORCenter for International Forestry Research
EUEuropean Union
FAOUnited Nations Food and Agriculture Organization
GRETGroupe de Recherches et d’Echanges Technologiques (Group for Research and Technology Exchanges)
IATIInternational Aid Transparency Initiative
ICBRInternational Centre for Bamboo and Rattan
ICIMODInternational Centre for Integrated Mountain Development
ICRAFWorld Agroforestry
IFADInternational Fund for Agricultural Development
INBARInternational Bamboo and Rattan Organization
IOMInstitute of Migration
ITTOInternational Tropical Timber Organization
IUCNInternational Union for the Conservation of Nature
IUFROInternational Union of Forest Research Organizations
JFPRJapan Fund for Poverty Reduction
KEFRIKenya Forestry Research Institute
MOFCOMChinese Ministry of Commerce
NGONon-governmental organization
NTFPNon-timber forest product
OECDOrganization for Economic Co-operation and Development
PICOPopulation, Intervention, Control (or Comparator), Outcome
ROSESReporting Standards for Evidence Synthesis
SADCSouthern African Development Community
SMESmall- and Medium-Sized Enterprise
SNVNetherlands Development Agency
TAMBACTamenglong Bamboo and Cane Development Centre
TRIBACTripura Bamboo and Cane Development Centre
UBCUniversity of British Columbia
UNDPUnited Nations Development Programme
USAIDU.S. Agency for International Development
USDAUnited States Department of Agriculture

References

  1. Vorontsova, M.S.; Clark, L.G.; Dransfield, J.; Govaerts, R.; Baker, W.J. World Checklist of Bamboos and Rattans; Kew Gardens/INBAR: Kew, UK; Beijing, China, 2016; ISBN 9789295098992. [Google Scholar]
  2. Hamid, N.H.; Jawaid, M.; Abdullah, U.H.; Alomar, T.S. Monopodial and Sympodial Bamboos Grown in Tropic and Sub-Tropic Countries—A Review. BioResources 2023, 18, 6499–6560. [Google Scholar] [CrossRef]
  3. Thokchom, A.; Yadava, P.S. Bamboo and Its Role in Climate Change. Curr. Sci. 2015, 108, 762–763. Available online: https://www.currentscience.ac.in/Volumes/108/05/0762.pdf (accessed on 17 April 2025).
  4. Liese, W.; Tang, T.K.H. Properties of the Bamboo Culm. In Tropical Forestry; Liese, W., Köhl, M., Eds.; Springer International Publishing: Cham, Switzerland, 2015; Volume 10, pp. 227–256. ISBN 978-3-319-14132-9. [Google Scholar]
  5. Pan, C.; Zhou, G.; Shrestha, A.K.; Chen, J.; Kozak, R.; Li, N.; Li, J.; He, Y.; Sheng, C.; Wang, G. Bamboo as a Nature-Based Solution (NbS) for Climate Change Mitigation: Biomass, Products, and Carbon Credits. Climate 2023, 11, 175. [Google Scholar] [CrossRef]
  6. Yuen, J.Q.; Fung, T.; Ziegler, A.D. Carbon Stocks in Bamboo Ecosystems Worldwide: Estimates and Uncertainties. For. Ecol. Manag. 2017, 393, 113–138. [Google Scholar] [CrossRef]
  7. Liese, W.; Weiner, G. Ageing of Bamboo Culms. A Review. Wood Sci. Technol. 1996, 30, 77–89. [Google Scholar] [CrossRef]
  8. Asante, K.O.H.; Akoto, D.S.; Derkyi, N.S.A.; Abugre, S. Advancing Circular Economy for the Growth, Root Development and Elemental Characteristics of Bamboo (Bambusa vulgaris) on Galamsey-Degraded Soil. Adv. Bamboo Sci. 2024, 6, 100054. [Google Scholar] [CrossRef]
  9. FAO; INBAR. Bamboo for Land Restoration. In INBAR Policy Synthesis Report 4; INBAR: Beijing, China, 2018; Volume 4, p. 38. [Google Scholar]
  10. Laestadius, L.; Maginnis, S.; Minnemeyer, S.; Potapov, P.; Saint-Laurent, C.; Sizer, N. Mapping Opportunities for Forest Landscape Restoration. Unasylva 2011, 62, 47–48. [Google Scholar]
  11. Kaushal, R.; Kumar, A.; Patra, S.; Islam, S.; Tomar, J.M.S.; Singh, D.V.; Mandal, D.; Rajkumar; Mehta, H.; Chaturvedi, O.P.; et al. In-Situ Soil Moisture Conservation in Bamboos for the Rehabilitation of Degraded Lands in the Himalayan Foothills. Ecol. Eng. 2021, 173, 106437. [Google Scholar] [CrossRef]
  12. Mishra, G.; Giri, K.; Panday, S.; Kumar, R.; Bisht, N.S. Bamboo: Potential Resource for Eco-Restoration of Degraded Lands. J. Biol. Earth Sci. 2014, 4, B130–B136. [Google Scholar]
  13. Fahim, M.; Haris, M.; Khan, W.; Zaman, S. Bamboo As a Construction Material: Prospects and Challenges. Adv. Sci. Technol. Res. J. Adv. 2022, 16, 165–175. [Google Scholar]
  14. Alamerew, A.N.; Kozak, R.; Shrestha, A.K.; Zhu, Z.; Wang, G. A Way for Livelihood Improvement: Systematic Review on Bamboo Forest Research. Trees For. People 2024, 16, 100571. [Google Scholar] [CrossRef]
  15. Akinlabi, E.T.; Anane-Fenin, K.; Akwada, D.R. Bamboo Taxonomy and Distribution Across the Globe. In Bamboo; Springer: Berlin/Heidelberg, Germany, 2017; pp. 1–37. ISBN 9783319568072. [Google Scholar]
  16. Liufu, Y.Q.; Hu, R.C.; Fu, Q.Y.; Luo, B.S. Bobai Hakka Weaving: Plant Diversity, Traditional Culture, and a Model for Rural Revitalization. Environ. Dev. Sustain. 2023, 26, 17335–17352. [Google Scholar] [CrossRef]
  17. Singh, A.; Singh, R. Cultural Significance and Diversities of Ethnic Foods of Northeast India. Indian J. Tradit. Knowl. 2007, 6, 79–94. [Google Scholar]
  18. Honfo, H.; Tovissodé, F.C.; Gnanglè, C.; Mensah, S.; Salako, V.K.; Assogbadjo, A.E.; Agbangla, C.; Kakaï, R.G. Traditional Knowledge and Use Value of Bamboo in Southeastern Benin: Implications for Sustainable Management. Ethnobot. Res. Appl. 2015, 14, 139–153. [Google Scholar] [CrossRef]
  19. Zhang, H.; Zhang, X.; Ding, Y.; Huang, F.; Cai, Z.; Lin, S. Charting the Research Status for Bamboo Resources and Bamboo as a Sustainable Plastic Alternative: A Bibliometric Review. Forests 2024, 15, 1812. [Google Scholar] [CrossRef]
  20. Madhushan, S.; Buddika, S.; Bandara, S.; Navaratnam, S.; Abeysuriya, N. Uses of Bamboo for Sustainable Construction—A Structural and Durability Perspective—A Review. Sustainability 2023, 15, 11137. [Google Scholar] [CrossRef]
  21. Razal, R.; Bantayan, R. Mainstreaming Engineered-Bamboo Products for Construction and Furniture; Philippine Council for Agriculture, Aquatic and Natural Resources Research and Development: Taguig, Philippines, 2012; ISBN 9789715790611. [Google Scholar]
  22. Tambe, S.; Patnaik, S.; Upadhyay, A.P.; Edgaonkar, A.; Singhal, R.; Bisaria, J.; Srivastava, P.; Hiralal, M.H.; Dahake, K.; Gawande, A.; et al. Evidence-Based Policy for Bamboo Development in India: From “Supply Push” to “Demand Pull”. For. Policy Econ. 2020, 116, 102187. [Google Scholar] [CrossRef]
  23. Neha, P.; Aravendan, M. A Review on Sustainable Product Design, Marketing Strategies and Conscious Consumption of Bamboo Lifestyle Products. Intell. Inf. Manag. 2023, 15, 67–99. [Google Scholar] [CrossRef]
  24. Binfield, L.; Nasir, V.; Dai, C. Bamboo industrialization in the era of Industry 5.0: An exploration of key concepts, synergies and gaps. Environ. Dev. Sustain. 2024. [Google Scholar] [CrossRef]
  25. Arnold, J.E.M.; Pérez, M.R. Can Non-Timber Forest Products Match Tropical Forest Conservation and Development Objectives? Ecol. Econ. 2001, 39, 437–447. [Google Scholar] [CrossRef]
  26. Dyck, M. Non-Timber Forest Problems: NTFPs in Conservation and Development Initiatives. In Tropical Forest Ecosystem Services in Improving Livelihoods For Local Communities; Springer: Berlin/Heidelberg, Germany, 2022; pp. 29–44. ISBN 9789811933424. [Google Scholar]
  27. Belcher, B.; Schreckenberg, K. Commercialisation of Non-Timber Forest Products: A Reality Check. Dev. Policy Rev. 2007, 25, 355–377. [Google Scholar] [CrossRef]
  28. van den Boog, T.; Bulkan, J.; Tansey, J.; van Andel, T.R. Sustainability Issues of Commercial Non-Timber Forest Product Extraction in West Suriname. J. Ethnobiol. Ethnomed. 2018, 14, 44. [Google Scholar] [CrossRef]
  29. Nath, A.J.; Lal, R.; Das, A.K. Managing Woody Bamboos for Carbon Farming and Carbon Trading. Glob. Ecol. Conserv. 2015, 3, 654–663. [Google Scholar] [CrossRef]
  30. The Restoration Initiative. Bamboo and Beyond: Restoring Cameroon’s Forest Landscapes. Available online: https://www.therestorationinitiative.org/bamboo-and-beyond-restoring-cameroons-forest-landscapes/ (accessed on 11 October 2024).
  31. INBAR. Bamboo for Sustainable Land Management and Livelihood Development in Ethiopia. Available online: https://www.inbar.int/wp-content/uploads/2020/05/1527562055.pdf (accessed on 17 April 2025).
  32. Paudyal, K.; Adhikari, S.; Sharma, S.; Samsudin, Y.B.; Paudyal, B.; Bhandari, A.; Birhane, E.; Darcha, G.; Thanglong, T.; Baral, H. Framework for Assessing Ecosystem Services from Bamboo Forests: Lessons from Asia and Africa; Center for International Forestry Research (CIFOR) and World Agroforestry Centre (ICRAF): Bogor, Indonesia, 2019. [Google Scholar]
  33. Miake-Lye, I.M.; Hempel, S.; Shanman, R.; Shekelle, P.G. What Is an Evidence Map? A Systematic Review of Published Evidence Maps and Their Definitions, Methods, and Products. Syst. Rev. 2016, 5, 28. [Google Scholar] [CrossRef]
  34. Collaboration for Environmental Evidence. Guidelines and Standards for Evidence Synthesis in Environmental Management; Collaboration for Environmental Evidence: Stockholm, Sweden, 2022. [Google Scholar]
  35. Binfield, L.; Britton, T.L.; Dai, C.; Innes, J. Evidence on the Social, Economic, and Environmental Impact of Interventions That Facilitate Bamboo Industry Development for Sustainable Livelihoods: A Systematic Map Protocol. Environ. Evid. 2022, 11, 33. [Google Scholar] [CrossRef]
  36. Bamberger, M. Why Do Many International Development Evaluations Have a Positive Bias? Should We Worry? Eval. J. Australas. 2009, 9, 39–49. [Google Scholar] [CrossRef]
  37. Organisation for Economic Co-operation and Development. Overview. In Enabling Women’s Economic Empowerment; OECD: Paris, France, 2019; p. 118. [Google Scholar]
  38. IATI. Organization Standard Version 2.03. Available online: https://iatistandard.org/en/iati-standard/203/organisation-standard/ (accessed on 30 December 2023).
  39. Belcher, B.M.; Hughes, K. Understanding and Evaluating the Impact of Integrated Problem-Oriented Research Programmes: Concepts and Considerations. Res. Eval. 2021, 30, 154–168. [Google Scholar] [CrossRef]
  40. Belcher, B.M.; Davel, R.; Claus, R. A Refined Method for Theory-Based Evaluation of the Societal Impacts of Research. MethodsX 2020, 7, 100788. [Google Scholar] [CrossRef]
  41. Funnell, S.C.; Rogers, P.J. Purposeful Program Theory; John Wiley & Sons: Hoboken, NJ, USA, 2011; Volume 27, ISBN 9780470939888. [Google Scholar]
  42. Methley, A.M.; Campbell, S.; Chew-Graham, C.; McNally, R.; Cheraghi-Sohi, S. PICO, PICOS and SPIDER: A Comparison Study of Specificity and Sensitivity in Three Search Tools for Qualitative Systematic Reviews. BMC Health Serv. Res. 2014, 14, 579. [Google Scholar] [CrossRef]
  43. Haddaway, N.R.; Macura, B.; Whaley, P.; Pullin, A.S. ROSES for Systematic Map Reports. Version 1.0. Available online: https://figshare.com/articles/online_resource/ROSES_for_Systematic_Map_Reports_Version_1_0/5897299 (accessed on 19 April 2025).
  44. Piasecki, J.; Waligora, M.; Dranseika, V. Google Search as an Additional Source in Systematic Reviews. Sci. Eng. Ethics 2018, 24, 809–810. [Google Scholar] [CrossRef]
  45. McHugh, M.L. Interrater Reliability: The Kappa Statistic. Biochem. Med. 2012, 22, 276–282. [Google Scholar] [CrossRef]
  46. James, K.L.; Randall, N.P.; Haddaway, N.R. A Methodology for Systematic Mapping in Environmental Sciences. Environ. Evid. 2016, 5, 7. [Google Scholar] [CrossRef]
  47. Haddaway, N.R. ROSES Flow Diagram for Systematic Maps. 2017. Available online: https://www.roses-reporting.com/flow-diagram (accessed on 19 April 2025).
  48. Women in Small Enterprise Cambodia. Women’s Development Center Project: Final Report; ADB JFPR: Manila, Philippines, 2010. [Google Scholar]
  49. Haddaway, N.R.; Collins, A.M.; Coughlin, D.; Kirk, S. The Role of Google Scholar in Evidence Reviews and Its Applicability to Grey Literature Searching. PLoS ONE 2015, 10, e0138237. [Google Scholar] [CrossRef]
  50. Lavergne, R.; Saxby, J. Capacity Development: Vision and Implication; Canadian International Development Agency: Ottawa, ON, Canada, 2001; Volume 6088. [Google Scholar]
  51. Igoe, J.; Brockington, D. Neoliberal Conservation: A Brief Introduction. Conserv. Soc. 2007, 5, 432–449. [Google Scholar]
  52. Bayliss, H.R.; Haddaway, N.R.; Eales, J.; Frampton, G.K.; James, K.L. Updating and amending systematic reviews and systematic maps in environmental management. Environ. Evid. 2016, 5, 20. [Google Scholar] [CrossRef]
  53. Haddaway, N.R.; Kohl, C.; da Silva, N.R.; Schiemann, J.; Spök, A.; Stewart, R.; Sweet, J.B.; Wilhelm, R. A framework for stakeholder engagement during systematic reviews and maps in environmental management. Environ. Evid. 2017, 6, 11. [Google Scholar] [CrossRef]
  54. Leeds Institute of Health Sciences. Search Concept Tools. Available online: https://medhealth.leeds.ac.uk/info/639/information_specialists/1500/search_concept_tools (accessed on 11 December 2017).
  55. Page, M.J.; McKenzie, J.E.; Bossuyt, P.M.; Boutron, I.; Hoffmann, T.C.; Mulrow, C.D.; Shamseer, L.; Tetzlaff, J.M.; Akl, E.A.; Brennan, S.E.; et al. The PRISMA 2020 Statement: An Updated Guideline for Reporting Systematic Reviews. BMJ 2021, 372. [Google Scholar] [CrossRef]
Figure 1. Logic model showing examples of interventions, outcomes, and other terms used to describe bamboo industry development interventions in this review, with explanations and examples of each term used.
Forests 16 00713 g001
Figure 2. ROSES Flow Diagram [47] showing the search and screening process resulting in the systematic map.
Forests 16 00713 g002
Figure 3. Information Flow Diagram showing the origins of documents included in the systematic evidence map from other sources.
Forests 16 00713 g003
Figure 4. Publication date of included documents.
Forests 16 00713 g004
Figure 5. Type of document included in the review.
Forests 16 00713 g005
Figure 6. Study design of documents included in the review.
Forests 16 00713 g006
Figure 7. Regions and distribution of interventions represented in the systematic evidence database.
Forests 16 00713 g007
Figure 8. Beginning, end, and length of interventions included in the systematic map database.
Forests 16 00713 g008
Figure 9. Number of interventions included in the review corresponding to type of intervention, including activities, implementing agency, and level of participation and input, representing the type of institution that offered financial, technical, or in-kind support to implement the project. X axes represent the number of interventions.
Forests 16 00713 g009
Figure 10. Frequency of documents reporting different categories of outcomes and impact.
Forests 16 00713 g010
Figure 11. Frequency of interventions recorded according to evaluation indicator used to measure outcomes.
Forests 16 00713 g011
Figure 12. Frequency of documents including different comparator types and existence or otherwise of a baseline study.
Forests 16 00713 g012
Figure 13. Number of interventions included in the review by metadata collected on target industry and beneficiary. X axes represent the number of interventions.
Forests 16 00713 g013
Figure 14. Example logic model showing complete information of an intervention [48] included in the evidence map. Dotted arrows denote data pulled from the systematic evidence map.
Forests 16 00713 g014
Table 1. Review question elements: Population, Intervention, Comparison, and Outcome.
PIO ElementReview Question Element
PopulationGlobal projects concluded since 1990 that promote bamboo industry development
InterventionProjects with a primary aim of livelihood development or other similar social objectives
ComparatorAny identifiable comparator
OutcomeSocial, environmental, and economic outcomes
Table 2. Search string for the Web of Science Core Collection. The acronym “TS" refers to the Topic field, which searches for terms in the title, abstract, author keywords, and Keywords Plus fields. The “*” symbol is a wildcard, which means that any characters, or none, can replace this symbol. Boolean search operators AND and OR are also included in the search string.
DatabaseSubscription Service UsedDate of Search (DD/MM/YYYY)Date of Search Updates (DD/MM/YYYY)Search StringSearch Limits
Web of Science Core CollectionUBC Library. Indexes subscribed to:
-
Science Citation Index Expanded (1900–present);
-
Social Sciences Citation Index (1956–present);
-
Arts and Humanities Citation Index (1975–present);
-
Conference Proceedings Citation Index—Science (1990–present).
25 November 202212 October 2023; 15 October 2024; 6 March 2024.(((TS = (bamboo* OR Bambusa OR Dendrocalamus OR Gigantochloa OR Guadua OR Melocanna OR Ochlandra OR Phyllostachys OR Thyrsostachys OR Schizostachyum OR Arundinia OR Lingnania OR Oxytenthera OR Chusquea)) AND TS = (socioeconomic OR socio-economic OR rural OR empower* OR communit* OR econom* OR “value chain*” OR “cultural heritage” OR “traditional knowledge” OR industr* OR livelihood* OR financ* OR poverty OR income* OR inclus*)) AND TS = (Change* OR relation* OR develop* OR affect* OR project* OR program* OR interven* OR initiative* OR implement*)) AND TS = (Climat* OR outcome* OR result* OR impact* OR social* OR “food security” OR gender* OR environment* OR contribut* OR ecolog* OR evaluat* OR benefit* OR effect* OR “global warming” OR “land restoration” OR soil* OR water* OR air OR capacit* OR particip*)Publication Date = 1 January 1990 to 6 March 2025
TS = Topic (search in title, abstract, keywords)
Table 3. Cell shading legend for tables in Section 3.11 (Knowledge Gaps and Clusters).
Cell Shading Rules
0
1
2–4
5–7
8–10
11–13
15–17
18+
Table 4. Cross-category analysis tabulating frequency of outcomes described in documents alongside other categories of metadata collected. Refer to Table 3 for the color shading key.
Outcomes
ParticipationEnvironmentalFinancialPolicyWellbeingGender EqualityHealthSustainable ConsumptionInfrastructureSocial Equity
Target IndustryPlantations4381311311
Shoots2130100002
Construction1130100001
Furniture3331000101
Whole bamboo supply chain2230200201
Handicrafts56112640302
Energy0040320200
Tourism0000000000
Wild harvest2211000100
Flooring0010000000
BeneficiariesWomen1261440101
Farmers3350200201
Rural community981621031514
Urban community0030100100
Institutions1130100100
Craftspeople1141210101
Other0000000000
Youth0010100100
ActivitiesTraining97182940603
Credit1140321111
Policy change1120100201
Lobbying4441200201
Strengthening institutions56142830402
Direct funding1030321012
Engagement2130000001
Research2341300200
Plantation management4441211211
Subsidy2230311112
Other0010000000
Infrastructure1110100100
InputForeign government96142740402
National government3470510202
Private sector0010000000
International organization2351321211
Other0000000000
Evaluation indicatorEconomic77182930504
Social5490740102
Environmental8992511413
Physical3330211113
Institutional 0000000000
Cultural1020200002
ImpactEconomic982111151515
Social3370520301
Physical0000000001
Institutional2220000001
Environmental3341000102
Cultural2220100101
RegionAsia77162941615
Africa4350110000
America0010100000
Comparator typeGoals-based2221100100
Alternate interventions0010000000
Control groups2130100100
Pre-post intervention871621041414
Counterfactual1120010200
Benchmarking1230321212
Study typeQuantitative2130000102
Qualitative0010000100
Mixed991821151413
Table 5. Cross-category analysis of metadata tabulating frequency of different impacts with other categories of data. Refer to Table 3 for cell shading legend.
Impact
EconomicSocialPhysicalInstitutionalEnvironmentalCultural
Target IndustryPlantations940120
Bamboo shoots310121
Construction300111
Furniture300111
Whole bamboo supply chain511011
Handicrafts1140231
Energy430000
Tourism000000
Wild harvest000010
Flooring100000
BeneficiariesWomen620000
Farmers831011
Rural community1750242
Urban community310000
Institutions310000
Craftspeople410000
Youth110000
ActivitiesTraining1860122
Credit420001
Policy change321011
Lobbying310122
Strengthening institutions1460241
Direct funding310000
Engagement300111
Research410001
Plantation management710010
Subsidy310001
Infrastructure110001
InputForeign government1450121
National government1031121
Private sector100000
International organization610020
Evaluation indicatorEconomic2171252
Social1050000
Environmental1240242
Physical411122
Institutional 410010
Cultural210000
RegionAsia2071132
Africa510120
America100000
Study typeQuantitative601121
Qualitative110000
Mixed1970131
Comparator typeGoals-based100010
Alternate interventions100000
Control groups310001
Pre-post intervention1760242
Counterfactual310000
Benchmarking631011
Table 6. Cross-category frequency analysis of activities recorded. Refer to Table 3 for cell shading legend.
Activity
TrainingCreditPolicy ChangeLobbyingStrengthening InstitutionsDirect fundingEngagementResearchPlantation ManagementSubsidyOtherInfrastructure
RegionAsia16433113329411
Africa300130010000
America100010010000
InputForeign government15113112234100
National government612240123211
Private sector110010000000
International organization510142015200
BeneficiariesWomen610041010100
Farmers423230023101
Rural community15314123246401
Urban community310020100010
Institutions411030011100
Craftspeople400020111100
Youth100010000000
Evaluation indicatorEconomic16323132336211
Social1010162113200
Environmental821482137301
Physical322211112301
Cultural200011000100
Study typeQuantitative411120202010
Qualitative101010000000
Mixed15313123147401
Comparator typeGoals-based200220011000
Alternate100000100010
Control groups000000001000
Pre-post14413133236401
Counterfactual301010001000
Benchmarking322111013201
Table 7. Cross-category analysis comparing beneficiary type with other categories of metadata collected.
Beneficiaries
WomenFarmersRural CommunityUrban CommunityInstitutionsCraftspeopleYouth
RegionAsia57143341
Africa1140000
America0010100
InputForeign government53121331
National government2461020
Private sector0101100
International organization1170200
Evaluation indicatorEconomic55163241
Social5281131
Environmental14120110
Physical0240100
Cultural1020010
Study typeQuantitative0322100
Qualitative0100100
Mixed64171241
Comparator typeGoals-based0120000
Alternate interventions0001000
Control groups0100000
Pre-post53162341
Counterfactual1110100
Benchmarking1330010
Table 8. Cross-category analysis of target industry with other categories of metadata collected.
Target Industry
PlantationBamboo ShootsConstructionFurnitureWhole Bamboo Supply ChainHandicraftsEnergyTourismWild HarvestFlooring
RegionAsia82234104021
Africa1101120000
America1010000000
ActivitiesTraining52344104021
Credit1010111001
Policy change1000201000
Lobbying1111220010
Strengthening institutions5332194011
Direct funding1100011000
Engagement1111120000
Research1011210000
Plantation management6001130020
Subsidy1001110010
Other0000100000
Infrastructure0000100000
InputForeign government6224194020
National government2000540000
Private sector0010000001
International organization4111121020
Other0000000000
Evaluation indicatorEconomic73334113011
Social3101173010
Environmental5313350020
Physical1112210010
Cultural0100010000
BeneficiariesWomen0001062000
Farmers4010301001
Rural community63243103020
Urban community1010111001
Institutions2021001011
Craftspeople1001040000
Youth1000011000
Study typeQuantitative1121310001
Qualitative1000001000
Mixed82132113020
Comparator typeGoals-based1000110010
Alternate interventions0000100000
Control groups1000000000
Pre-post intervention73331113021
Counterfactual1000111000
Benchmarking2000310000
Table 9. Cross-tabulated variables for documents describing interventions that took place in Asia and described training programs.
Number of Documents Describing Interventions Taking Place in Asia and Describing Training Programs
OutcomesParticipation and engagement6
Environmental outcomes5
Financial outcomes17
Policy2
Wellbeing7
Gender equality3
Health0
Sustainable consumption6
Infrastructure0
Social equity3
InputForeign government11
National government5
Private sector1
International organization4
BeneficiariesWomen5
Farmers3
Rural community12
Urban community3
Institutions3
Craftspeople4
Youth1
Study typeQuantitative6
Qualitative1
Mixed11
ComparatorPre–post intervention16
Benchmarking2
Counterfactual1
Alternative interventions1
Goals based1
Disclaimer/Publisher’s Note: The statements, opinions and data contained in all publications are solely those of the individual author(s) and contributor(s) and not of MDPI and/or the editor(s). MDPI and/or the editor(s) disclaim responsibility for any injury to people or property resulting from any ideas, methods, instructions or products referred to in the content.

